Market Overview
Prices of groundnut and palmolein oil plunged at the
wholesale oils and oilseeds owing to slackened demand
from retailers. However, other edible and non-edible
oils moved in a tight range in limited deals and settled
at previous levels. Easing demand from retailers
against ample stocks position on increased supplies
from producing regions, mainly led to decline in
groundnut and palmolein oil prices.
Government will release 10 lakh tonnes of wheat from
buffer stock to sell in the open market to boost
domestic availability and check prices. 12 lakh tonnes
of wheat has so far been imported by private traders
this fiscal, which will also ensure sufficient availability
of stock in the open market. Private imports could
touch 30 lakh tonnes this fiscal, while ruling out any
possibilities of further cut in import duty or the
government importing wheat on its own account.
Crude palm oil prices went up as traders created fresh
positions amid uptick in domestic demand and
restricted supplies from producing belts. Rise in crude
palm oil prices at futures trade to fresh positions built
up by participants due to pick-up in demand in the spot
market against tight stocks position on restricted
supplies from growing regions.
Mentha oil prices eased further as traders engaged in
trimming their positions, tracking a weak trend at spot
market. Cutting down of positions by participants amid
a weak trend at spot market on sluggish demand from
consuming industries against adequate stocks position
on higher supplies from Chandausi in Uttar Pradesh
mainly kept mentha oil prices down at futures trade.
Malaysian palm oil futures rose supported by concerns
about lower output despite a weaker performance by
rival vegetable oils. U.S. wheat futures fell more than 1
% and soybean and as markets took cues from U.S.
Department of Agriculture export sales data.
Commodity
Turmeric
Jeera
Soybean
Soy Oil
R M Seed
CPO
Sugar
Wheat
Mentha Oil
Cotton
Exchange
NCDEX
NCDEX
NCDEX
NCDEX
NCDEX
MCX
NCDEX
NCDEX
MCX
MCX
Expiry
Nov
Nov
Nov
Nov
Nov
Nov
Dec
Nov
Nov
Nov
Price
7378.0
17470.0
3087.0
669.7
4538.0
518.4
3426.0
2006.0
931.1
18430.0
%
Change
0.6%
1.6%
0.2%
0.2%
0.3%
0.4%
0.1%
-1.3%
-1.4%
0.6%
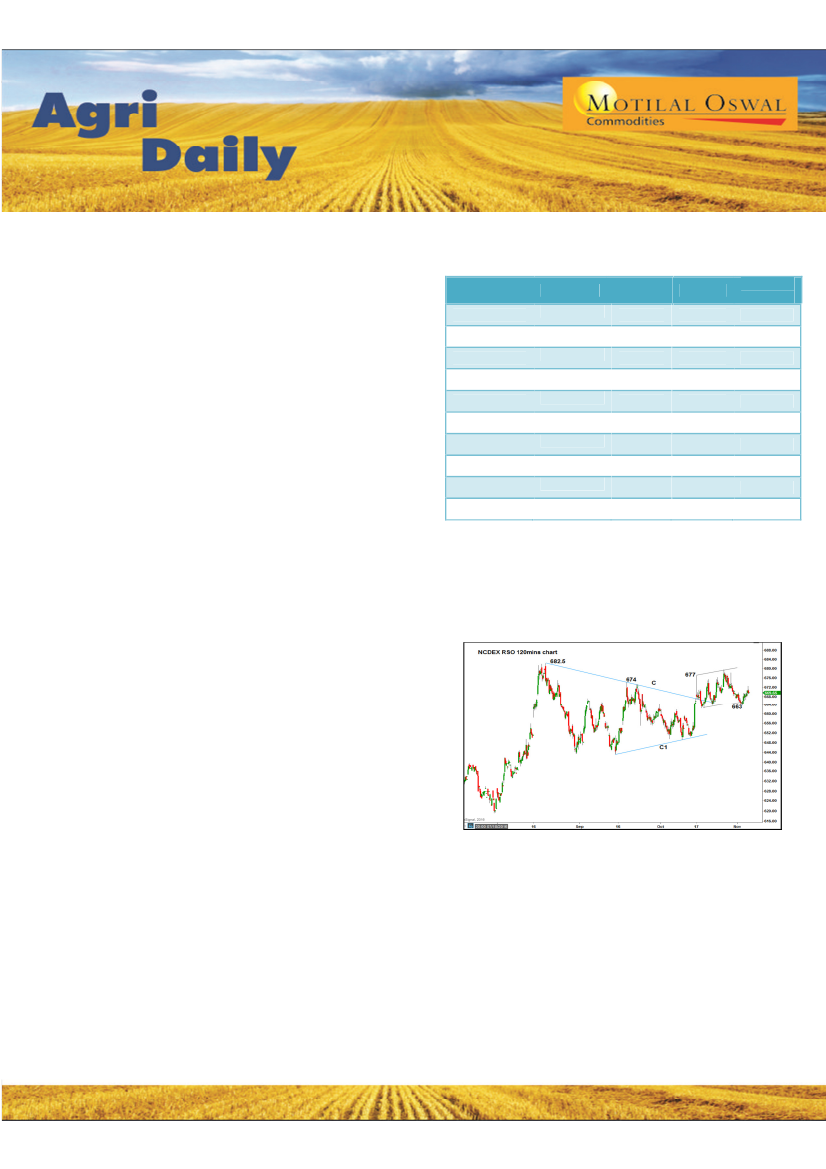
Chart of the Day: NCDEX RSO
As shown, NCDEX RSO has recently breached consolidation
range marked by C –C1 and is sustaining well above the
same indicating bullish move ahead. As long as immediate
support near Rs.663-659.50 zone is held, dip buying is
advised targeting Rs.682 on the higher side.
1
Please refer to disclaimer at the end of the report.