Eveready Industries
BSE SENSEX
27,253
Bloomberg
Equity Shares (m)
M.Cap.(INRb)/(USDb)
52-Week Range (INR)
1, 6, 12 Rel. Per (%)
12M Avg Val (INR M)
Free float (%)
S&P CNX
8,432
EVRIN IN
72.7
18.3 / 0.3
318 / 192
-2/-4/-16
57
56.0
9 November 2016
2QFY17 Results Update | Sector: Others
CMP: INR243
TP: INR332(+37%)
Buy
PAT growth healthy; new product category growth key trigger
Healthy margin expansion:
Eveready Industries’
(EVRIN)
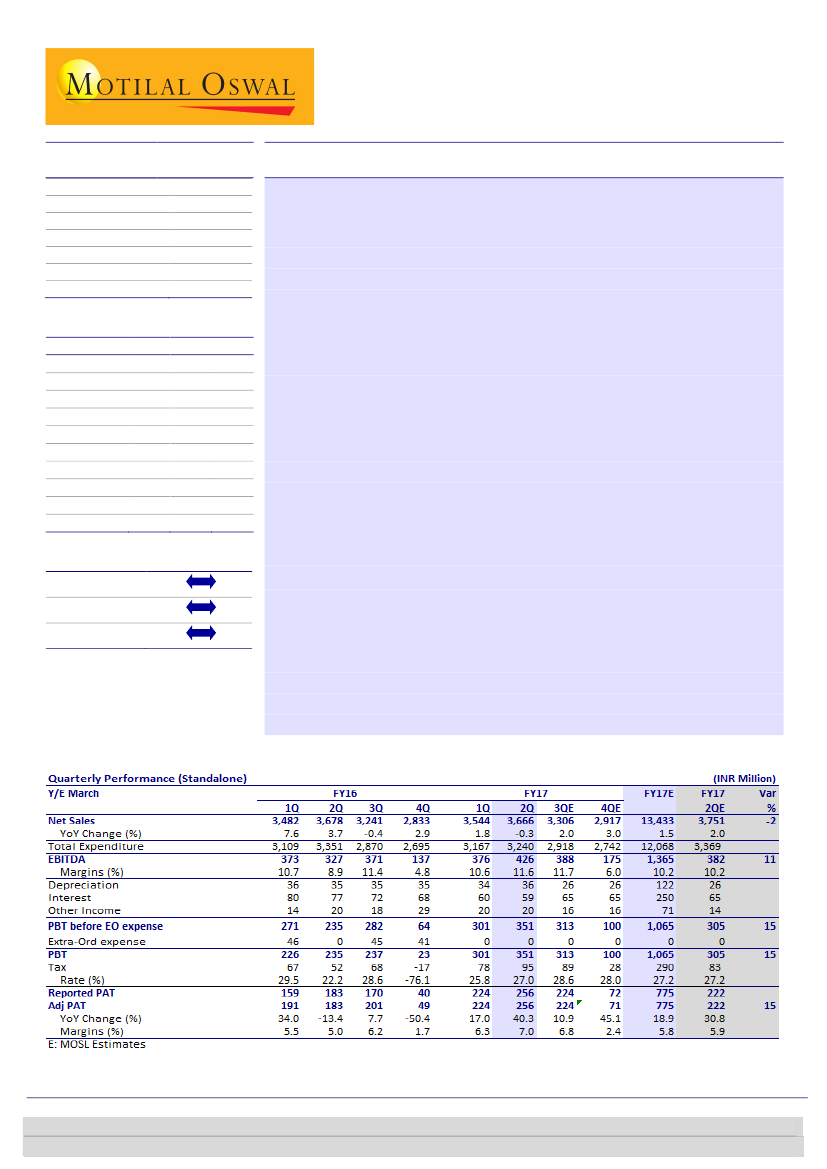
2QFY17 revenue was
flattish at INR3,666m (est. of INR3,751m) due to weak rural demand and
flattish growth across battery/flashlights businesses. LED business grew 92%
YoY, offset by 55% YoY decline in CFL business, leading to small blended growth
in the electrical segment. EBITDA margin expanded 274bp YoY to 11.6% (est. of
+10.2%) in 2QFY17. EBITDA grew 30% YoY to INR426m (est. of INR382m) due to
favorable product mix, overall cost conservation and improved lighting
category margins. Adjusted PAT grew 40% YoY to INR256m (est. of INR222m).
Healthy LED sales growth:
Total LED sales grew 92% YoY to INR506m from
INR263m in 2QFY16. Volume-wise, 6m pieces were sold (+3x YoY), of which
~50% were government orders. It won EESL orders for LED tube lights worth
INR180m, which would be executed in 3Q/4Q and thus drive growth in 2HFY17
New product categories to drive growth:
EVRIN has launched a range of
products in the small appliances segment (value for money positioning). The
company expects to clock revenues of INR1b in FY18 from the category. It is
appointing new distributors/dealers in northern/eastern markets. In
luminaries, it intends to launch new products from 3QFY17 and ramp-up sales
in FY18. Luminaries is expected to be a high-margin business.
Valuation and view:
We expect the government’s move to ban certain
denomination notes to cause liquidity crunch for dealers for a month or so, but
not impact demand (small-ticket item). We keep estimates unchanged: 6%
revenue CAGR and 190bp EBITDA margin expansion over FY16-18, driving 25%
PAT CAGR. We value the stock at 23x (50% premium over 5year median P/E led
by increase in return ratios and entry into newer product categories) FY18E;
maintain
Buy
with TP of INR332.
Financials & Valuation (INR b)
Y/E Mar
2016 2017E 2018E
Net Sales
13.2
13.4
15.0
EBITDA
1.2
1.4
1.6
PAT
0.7
0.8
1.1
EPS (INR)
9.2
10.7
14.5
Gr. (%)
8.3
16.2
34.9
BV/Sh (INR)
28.4
35.6
45.4
RoE (%)
16.2
33.5
35.7
RoCE (%)
15.2
23.8
26.3
P/E (x)
26.1
22.5
16.7
P/BV (x)
8.5
6.8
5.3
Estimate change
TP change
Rating change
Investors are advised to refer through important disclosures made at the last page of the Research Report.
Niket Shah
(Niket.Shah@MotilalOswal.com); +91 22 3982 5426
Chintan Modi
(Chintan.Modi@MotilalOswal.com); +912239825422/Chitvan
Oza
(chitvan.oza@MotilalOswal.com); +912230102415
Motilal Oswal research is available on www.motilaloswal.com/Institutional-Equities, Bloomberg, Thomson Reuters, Factset and S&P Capital.