Allcargo Logistics
BSE SENSEX
26,052
Bloomberg
Equity Shares (m)
M.Cap.(INR b)/(USD b)
52-Week Range (INR)
1, 6, 12 Rel. Per (%)
12M Avg Val (INR M)
Free float (%)
S&P CNX
8,033
AGLL IN
252.1
41.3/ 0.6
222 / 135
-1/6/-16
50
30.2
23 November 2016
2QFY17 Results Update | Sector: Logistics
CMP: INR164
TP: INR196 (+20%)
Buy
Steady performance in challenging environment
Financials & Valuations (INR b)
Y/E Mar
2016 2017E 2018E
Net Sales
56.6
57.9
62.2
EBITDA
5.2
5.1
5.7
PAT
2.7
2.7
3.2
EPS (INR)
10.8
10.6
12.8
Gr. (%)
17.2
(2.2) 21.4
BV/Sh (INR)
87.5
71.1
81.2
RoE (%)
13.2
13.3
16.8
RoCE (%)
11.2
10.9
13.7
P/E (x)
15.2
15.5
12.8
P/BV (x)
1.9
2.3
2.0
EV/EBITDA (x)
8.7
7.8
6.4
Estimate change
TP change
Rating change
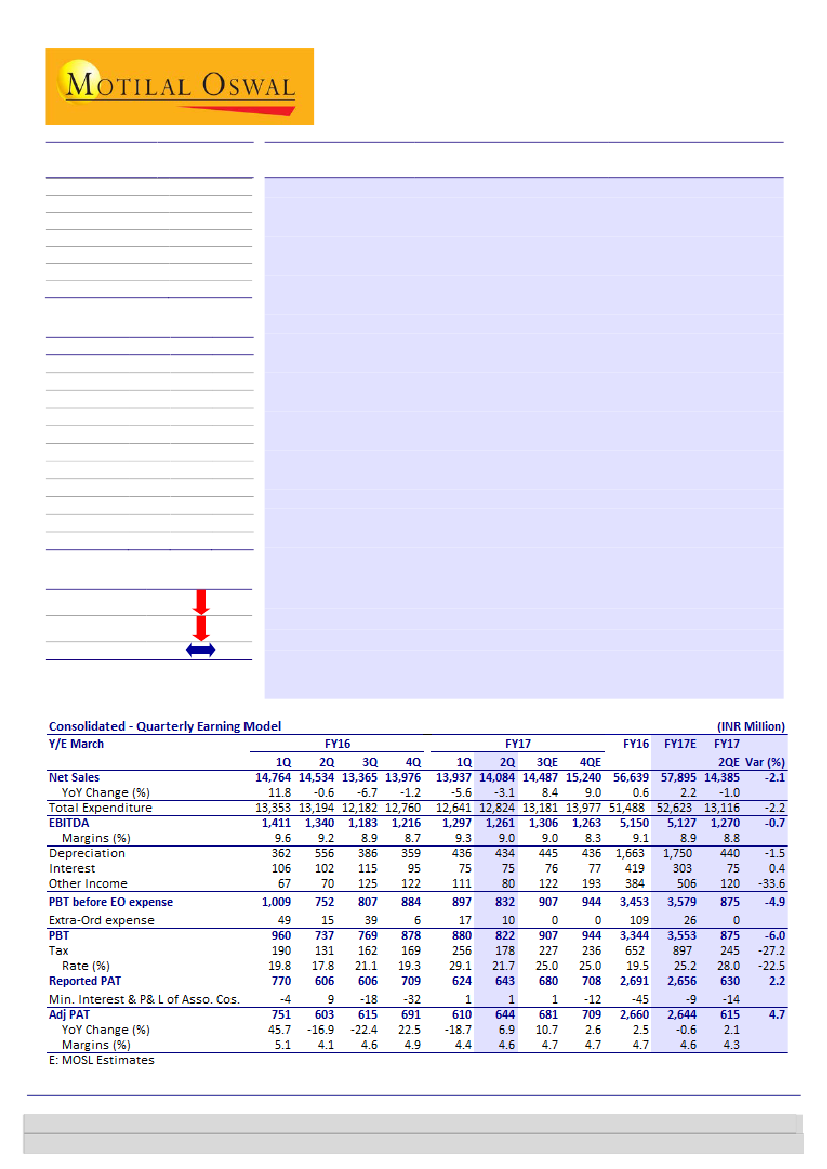
Allcargo’s (AGLL) EBITDA declined 6% YoY (-3% QoQ) to INR1.26b (est. of INR1.27b)
due to slowdown in the project logistics business and transfer of certain business in
JV. Reported EBIT stood at INR827m (est. of INR830m; +5% YoY; -4% QoQ), while
PAT was INR643m (est. of INR630m; +6% YoY; +3% QoQ) driven by a lower tax rate
of 21.7% (est. of 28%; 29% in 1QFY17).
MTO volumes up 8% YoY, despite weak macros:
AGLL’s MTO volumes grew
8% YoY to 127,463 TEUs in 2QFY17, despite muted global trade. Growth
continued to come from the key markets of India, China and South East Asia.
Realizations declined 9% YoY led by falling freight rates, while EBIT margin
increased to 4.1% (v/s 3.9% in 2QFY16).
Margin improvement for CFS segment:
CFS volumes stood at 69,260 TEUs (flat
YoY, -7.8% QoQ). CFS revenue stood at INR1.1b (+5% YoY, +1% QoQ).
Realizations were INR15,494/TEU, as against INR15,726 in the year-ago period.
EBIT/TEU stood at INR5,732 (v/s INR5,080 in 2QFY16), helped by handling of
specialized cargo in Chennai CFS.
P&E impacted by slowdown in project logistics business:
P&E segment’s EBIT
stood at INR110m (-21% YoY; -38% QoQ) led by management’s conscious
decision to move away from low RoCE business, resulting in sale of aged assets.
Valuation and view:
With (a) current businesses largely in steady state and minimal capex
requirement and (b) strong balance sheet and ~8-9% FCF yield, AGLL is well
placed to invest in DFC/GST-led opportunities.
We value AGLL at FY18E EV/EBITDA of 8.5x and arrive at fair value of INR196.
On FY18E, the stock trades at P/E of 12.8x and EV/EBITDA of INR6.4x. Maintain
Buy.
Investors are advised to refer through important disclosures made at the last page of the Research Report.
Motilal Oswal research is available on www.motilaloswal.com/Institutional-Equities, Bloomberg, Thomson Reuters, Factset and S&P Capital.
Abhishek Ghosh
(Abhishek.Ghosh@motilaloswal.com); +91 22 3982 5436
Abhinil Dahiwale
(Abhinil.Dahiwale@MotilalOswal.com); +91 22 3980 4309
 Motilal Oswal Financial Services
Allcargo Logistics
Exhibit 1: AGLL 2QFY17 earnings snapshot (INR m)
1QFY15 2QFY15 3QFY15 4QFY15 1QFY16 2QFY16 3QFY16 4QFY16 1QFY17 2QFY17
Volume Details
MTO Volumes (TEU)
CFS/ICD Volumes (TEU)
Financial Summary (INR m)
MTO
CFS/ICD
P&E
Others
Net Revenue
Reported EBITDA
EBITDA margin
Depreciation
EBIT
Interest
Other Income
PBT before exceptional
Exceptional
PBT before exceptional
Tax
Tax rate (%)
PAT
PAT margin (%)
101,937 108,874 107,261 104,128 113,410 117,574 116,168 112,593 120,971 127,463
72,930 75,398 70,587 72,664 78,727 77,027 74,251 74,751 84,013 78,830
11,309 12,500 12,101 11,828 12,431 12,231 10,964 11,908 11,793 12,093
907 1,021 1,059 1,046 1,094 1,064 1,148 1,067 1,096 1,112
1,165 1,267 1,322 1,545 1,425 1,388 1,399 1,277 1,322
990
78
70
93
70
76
85
109
144
100
5
13,206 14,618 14,317 14,152 14,779 14,562 13,392 14,020 13,989 14,102
1,214 1,225 1,359 1,071 1,411 1,340 1,183 1,216 1,297 1,261
9.2%
8.4%
9.5%
7.6%
9.5%
9.2%
8.8%
8.7%
9.3%
8.9%
427
391
372
384
362
556
386
359
436
434
787
835
987
687 1,048
785
797
858
861
827
164
141
140
89
106
102
115
95
75
75
83
147
116
191
67
70
125
122
111
80
706
841
962
789 1,009
752
807
884
897
832
34
48
34
12
49
15
39
6
17
10
673
793
928
777
960
737
769
878
880
822
159
132
187
222
190
131
162
169
256
178
23.6% 16.6% 20.1% 28.6% 19.8% 17.8% 21.1% 19.3% 29.1% 21.7%
514
661
742
555
770
606
606
709
624
643
3.9%
4.5%
5.2%
3.9%
5.2%
4.2%
4.5%
5.1%
4.5%
4.6%
YoY (%) QoQ (%)
8.4
2.3
-1.1
4.5
-28.7
-94.1
-3.2
-6.0
-22.0
5.4
-26.4
13.9
10.5
-34.0
11.4
36.2
6.1
5.4
-6.2
2.5
1.5
-25.1
-95.0
0.8
-2.8
-0.5
-3.9
-0.1
-28.3
-7.3
-40.0
-6.6
-30.3
3.0
Source: Company, MOSL
Key takeaways from concall
Jhajjhar ICD:
Management mentioned that there in final stages of due diligence
of land for Jhajjar ICD. They would subsequently apply for rail linkage in the
terminal. The new ICD/logistics park will enable Allcargo to capitalize on DFC.
Kolkata CFS:
It is expected to become operational in 4QFY17. The planned
capacity had earlier been announced at 100,000 TEUs. Land for the CFS has
been leased from the port authority on a long-term basis. The total capex for
the CFS is ~INR350m.
Contract with CWC’s CFS in Mundra:
AGLL has entered in a contract to manage
and operate (M&O) with CWC’s (Central Warehousing Corporation) CFS in
Mundra, Gujarat. The CFS facility is located adjacent to existing CFS of AGLL.
Focus on high ROCE business:
Management is moving away from the low
returns business and has exited trailer business in 2QFY17 and earlier it has
exited some equipment leasing (part of P&E segment) in 1QFY17.
Announced Buyback of Shares:
Management announced a share buyback at a
price of INR195 per equity share on 7
th
November 2016. Total 6.4 million equity
shares (~2.54% of total outstanding share) are offered for the buyback
amounting to sum of ~INR1.25b.
23 November 2016
2
 Motilal Oswal Financial Services
Allcargo Logistics
Exhibit 2: MTO volumes (TEUs) increased +8.4% YoY and
+5.4% QoQ in 2QFY17
MTO Volumes (TEUs)
Exhibit 3: Realizations declined 8.8% YoY and 2.7% QoQ in
2QFY17; EBIT (INR b) declined 4% YoY and 17% QoQ
in INR '000/TEU
5.7
4.9 5.1
Realizations
5.2
4.6
4.1
111
115
113
114
110
104
94
106
97
EBIT (RHS)
5.5
4.7
3.9
95
2.1
Source: MOSL, Company
Exhibit 4: CFS+ICD volumes (TEUs) increased 2.3% YoY and -
6.2% QoQ in 2QFY17
CFS/ICD Volumes (TEUs)
Exhibit 5: Realizations declined 3% YoY and 8.2% QoQ in
2QFY17; EBIT was down by 8% YoY and flat QoQ in 2QFY17
in INR '000/TEU
4.4
3.3
12
3.3
13
15
14
14
15
15
13
13
14
Realizations
4.2
4.6
4.0
5.2
EBIT (RHS)
4.2
4.2
4.0
Source: MOSL, Company
23 November 2016
3
 Motilal Oswal Financial Services
Allcargo Logistics
Valuation and view
Allcargo Logistics gives an unique opportunity to participate in the (a) domestic
economic revival (through CFS and P&E) and (b) exposure to global LCL (less
than container load) consolidation market where it is one of the top two players
(fast growing sub-segment in container shipping) with presence in >90
countries.
We believe that Allcargo Logistics through its superior size and global presence
via ECU Line has established an effective competitive advantage versus its
competitors. It is therefore well placed to tackle both any sluggishness in
container business as well as make good use of the opportunities in this space.
Strong balance sheet, increasing FCF will help Allcargo to further consolidate in
global LCL market and help it to make value accretive acquisitions to further
spur growth. Its domestic land banks give it an opportunity to capitalize on
upcoming rail DFC (dedicated freight corridor) and GST reform.
AGLL with (a) current businesses largely in steady state and minimal capex
requirement and (b) strong balance sheet and ~8-9% FCF yield; is well placed to
invest in DFC/GST led opportunities.
We value Allcargo Logistics at FY18E EV/EBITDA of 8.5x and arrive at a fair value
of INR196. On FY18E, the stock trades at P/E of 12.8x and EV/EBITDA of INR6.4x.
Maintain
Buy.
23 November 2016
4
 Motilal Oswal Financial Services
Allcargo Logistics
Story in charts
Exhibit 6: MTO revenues (INR m) grew at 21% CAGR driven
by contribution from acquired entities
Domestic
FCL Marine
Hindustan Cargo
Econocaribe
34
-
28
3
3
32
-
26
3
3
Ecu-Line
Total 47
41
9
5
2
3
28
3
3
FY14
Exhibit 7: Regional MTO revenue share (in %) – America’s
share improved rapidly due to acquisitions
India
America
10
32
26
17
16
FY12
(15M)
Far East
11
29
25
19
16
FY13
Europe
9
30
24
24
13
FY14
9
30
19
29
12
FY15
Others
7
28
21
29
15
FY16
11
37
21
18
13
10
35
23
18
14
CY10
48
8
-
7
2
CY06
15
-
12
0
2
CY07
21
-
17
1
3
CY08
17
-
14
1
2
CY09
22
-
18
2
2
CY10
29
3
4
FY15
FY16
FY12 FY13
(15M)
CY09
Source: Company, MOSL
Exhibit 8: Expect MTO volumes to grow at 8% CAGR driven
by improving trade volumes
MTO volume ('000 teu)
26%
19%
16%
6%
-9%
200
238
337
285
335
FY14
422
FY15
460
497
531
18%
9%
8%
7%
YoY (%)
Exhibit 9: Allcargo has presence near the major ports in
India
CY09 CY10 FY12 - FY13
15M
FY16 FY17E FY18E
Source: Company, MOSL
Exhibit 10: Expect CFS volumes to grow at 6% CAGR at FY15-
FY18E
CFS volume ('000 teu)
67%
51%
71%
CFS utilization (%)
64%
Exhibit 11: P&E revenue growth lagged increase in capital
employed led by slowdown in domestic economy
P&E Capital Employed (INRm)
1,053
745
409
135
P&E EBIT (INRm)
986
623
716
61%
43%
44%
57%
60%
579
574
174
227
305
230
210
212
274
290
311
2,488 3,611 10,672 10,660 9,762 9,014 8,322 8,623 8,803
CY09 CY10 FY12 FY13 FY14 FY15 FY16 FY17E FY18E
(15M)
Source: Company, MOSL
CY09 CY10 FY12 - FY13 FY14 FY15 FY16 FY17E FY18E
15M
Source: Company, MOSL
23 November 2016
5
 Motilal Oswal Financial Services
Allcargo Logistics
Exhibit 12: MTO segment contributes the highest to revenue
Revenue share (%)
9
7
16
7
12
8
MTO
11
8
CFS
8
6
P&E
9
7
10
8
Exhibit 13: MTO segment contributes the highest to EBIT
EBIT share (%)
30
41
30
23
38
24
37
MTO
CFS
13
38
P&E
5
36
20
29
15
31
83
77
79
81
85
84
83
39
CY10
39
FY12
(15M)
49
FY13
59
51
54
CY09
CY10
FY12
(15M)
FY13
FY14
FY15
FY16
CY09
FY14
FY15
FY16
Source: Company, MOSL
23 November 2016
6
 Motilal Oswal Financial Services
Allcargo Logistics
Financials and Valuations
Consolidated - Income Statement
Y/E March
Total Income from Operations
Change (%)
EBITDA
Margin (%)
Depreciation
EBIT
Int. and Finance Charges
Other Income
PBT bef. EO Exp.
EO Items
PBT after EO Exp.
Income tax
Tax Rate (%)
PAT
Minority + Associate share
PAT incl. Minority + Associate
Adjusted PAT
Change (%)
Margin (%)
FY12 (15M)
42,696
49.1
5,131
12.0
1,337
3,794
644
559
3,709
0
3,709
734
19.8
2,976
132
2,844
2,844
71.4
6.7
FY13
39,255
-8.1
3,554
9.1
1,474
2,080
414
670
2,335
0
2,335
512
21.9
1,823
126
1,697
1,697
-40.3
4.3
FY14
48,445
23.4
3,763
7.8
1,755
2,009
563
515
1,960
0
1,960
416
21.2
1,544
51
1,493
1,493
-12.0
3.1
FY15
56,180
16.0
4,646
8.3
1,574
3,072
535
412
2,950
0
2,950
700
23.7
2,250
73
2,177
2,323
55.5
4.1
FY16
56,639
0.8
5,151
9.1
1,663
3,488
419
384
3,453
109
3,344
652
19.5
2,691
32
2,660
2,723
17.2
4.8
FY17E
57,895
2.2
5,127
8.9
1,750
3,377
303
506
3,579
26
3,553
897
25.2
2,656
12
2,644
2,664
-2.2
4.6
(INR Million)
FY18E
62,240
7.5
5,661
9.1
1,836
3,825
266
767
4,327
0
4,327
1,082
25.0
3,245
12
3,233
3,233
21.4
5.2
Consolidated - Balance Sheet
Y/E March
Equity Share Capital
Total Reserves
Net Worth
Minority Interest
Deferred Liabilities
Total Loans
Capital Employed
Gross Block
Less: Accum. Deprn.
Net Fixed Assets
Goodwill on Consolidation
Capital WIP
Total Investments
Curr. Assets, Loans&Adv.
Inventory
Account Receivables
Cash and Bank Balance
Loans and Advances
Curr. Liability & Prov.
Account Payables
Other Current Liabilities
Provisions
Net Current Assets
Deferred Tax assets
Appl. of Funds
E: MOSL Estimates
FY12 (15M)
260
14,638
14,899
311
924
7,653
23,788
16,358
3,801
12,557
4,580
854
1,071
9,369
125
3,576
1,341
4,327
4,815
3,338
1,094
383
4,555
171
23,788
FY13
252
15,604
15,857
433
1,172
7,267
24,728
18,850
5,163
13,687
4,602
139
1,859
9,641
111
3,825
1,382
4,324
5,429
3,536
1,275
619
4,212
228
24,728
FY14
252
17,679
17,931
463
1,284
9,921
29,599
20,528
7,094
13,434
9,051
236
1,902
11,675
114
5,715
1,647
4,199
6,938
4,661
1,674
602
4,737
238
29,599
FY15
252
18,826
19,078
221
1,354
6,133
26,786
20,244
8,283
11,961
8,655
302
894
12,648
117
6,476
1,738
4,318
7,928
5,744
1,557
627
4,720
253
26,786
FY16
504
21,559
22,063
228
1,373
5,431
29,095
21,333
9,351
11,982
9,263
521
1,465
13,531
112
6,669
2,069
4,681
7,875
5,998
1,264
613
5,656
208
29,095
FY17E
504
17,416
17,920
228
1,373
4,681
24,201
22,689
11,101
11,588
3,033
274
1,465
17,647
119
6,805
5,946
4,776
10,014
6,115
3,271
628
7,633
208
24,201
(INR Million)
FY18E
504
19,967
20,471
228
1,373
4,181
26,253
23,496
12,937
10,559
3,033
167
1,465
21,652
128
7,315
9,073
5,135
10,832
6,557
3,517
758
10,820
208
26,253
23 November 2016
7
 Motilal Oswal Financial Services
Allcargo Logistics
Financials and Valuations
Ratios
Y/E March
Basic (INR)
EPS
Cash EPS
BV/Share
DPS
Payout (%)
Valuation (x)
P/E
Cash P/E
P/BV
EV/Sales
EV/EBITDA
Dividend Yield (%)
Return Ratios (%)
RoE
RoCE
RoIC
Working Capital Ratios
Debtor (Days)
Creditor (Days)
Working Cap. Turnover (Days)
Leverage Ratio (x)
Net Debt/Equity (x)
FY12 (15M)
11.3
16.6
59.1
0.8
7.6
FY13
6.7
12.6
62.9
0.7
12.1
FY14
5.9
12.9
71.1
0.8
14.3
FY15
9.2
15.5
75.7
1.0
13.4
17.8
10.6
2.2
0.8
9.8
0.6
17.0
17.4
20.2
31
43
27
0.5
11.0
8.9
10.1
36
47
26
0.4
8.8
7.3
8.2
43
50
23
0.5
12.6
9.4
10.7
42
53
19
0.3
FY16
10.8
17.4
87.5
2.0
20.8
15.2
9.4
1.9
0.8
8.7
1.2
13.2
11.2
12.8
43
57
23
0.2
FY17E
10.6
17.5
71.1
2.0
21.0
15.5
9.4
2.3
0.7
7.8
1.2
13.3
10.9
13.9
43
58
11
0.0
FY18E
12.8
20.1
81.2
2.4
21.0
12.8
8.2
2.0
0.6
6.4
1.5
16.8
13.7
21.4
43
57
10
-0.2
Consolidated - Cash Flow Statement
Y/E March
OP/(Loss) before Tax
Depreciation
Interest & Finance Charges
Direct Taxes Paid
(Inc)/Dec in WC
CF from Operations
Others
CF from Operating incl EO
(inc)/dec in FA
Free Cash Flow
(Pur)/Sale of Investments
Others
CF from Investments
(Inc)/Dec in Debt
Interest Paid
Dividend Paid
Others
CF from Fin. Activity
Inc/Dec of Cash
Opening Balance
Closing Balance
E: MOSL Estimates
FY12 (15M)
3,710
1,337
551
-930
-1,353
3,315
153
3,468
-5,991
-2,524
1,014
-414
-5,391
3,009
-556
-530
-90
1,834
-89
1,430
1,341
FY13
2,335
1,474
370
-634
-22
3,522
-278
3,244
-1,896
1,348
52
88
-1,757
-563
-538
-74
-271
-1,446
41
1,341
1,382
FY14
1,960
1,755
532
-373
-195
3,680
-572
3,107
-1,290
1,817
-237
-2,665
-4,192
2,732
-586
-222
-575
1,350
265
1,382
1,647
FY15
3,171
1,574
492
-478
113
4,872
-573
4,300
-442
3,858
1,218
-1,028
-252
-2,509
-550
-310
-589
-3,957
91
1,647
1,738
FY16
3,530
1,529
409
-894
86
4,660
-175
4,484
-1,414
3,070
-449
-109
-1,971
1,437
-475
-640
-2,504
-2,182
331
1,738
2,069
(INR Million)
FY17E
3,553
1,750
-202
-897
1,901
6,104
0
6,104
-1,110
4,994
0
506
-604
-750
-303
-558
-12
-1,623
3,877
2,069
5,946
FY18E
4,327
1,836
-501
-1,082
-60
4,519
0
4,519
-700
3,819
0
767
67
-500
-266
-682
-12
-1,459
3,127
5,946
9,073
23 November 2016
8
 Motilal Oswal Financial Services
Allcargo Logistics
Corporate profile
Company description
AGLL is an integrated logistics services provider with
>USD1b in sales. Its key business divisions are global
Multimodal Transport Operations (NVOCC, LCL and
FCL), domestic CFS/ICD operations and Project and
Engineering division. It also provider contract
logistics services.
Exhibit 1: Sensex rebased
Source: MOSL/Bloomberg
Exhibit 2: Shareholding pattern (%)
Sep-16
Promoter
DII
FII
Others
69.8
0.1
14.6
15.5
Jun-16
69.9
0.1
13.8
16.1
Sep-15
69.9
0.1
6.2
23.8
Source: Capitaline
Exhibit 3: Top holders
Holder Name
Blackstone Gpv Capital Partners Mauritius V-
A Ltd
Blackstone Gpv Capital Partners (Mauritius)
V-K Ltd
Blackstone Gpv Capital Partners (Mauritius)
V-L Ltd
Acacia Partners, LP
Blackstone Gpv Capital Partners (Mauritius)
V-M Ltd
% Holding
4.4
4.4
3.8
2.3
1.8
Source: Capitaline
Note: FII Includes depository receipts
Exhibit 4: Top management
Name
Shashi Kiran Shetty
Adarsh Hegde
Arathi Shetty
Shailesh Dholakia
Designation
Chairman & Managing Director
Joint Managing Director
Director
Company Secretary
Exhibit 5: Directors
Name
Shashi Kiran Shetty
Adarsh Hegde
Arathi Shetty
Hari L Mudra*
Name
Keki Elavia*
M P Bansal
J Ramachandran*
Kaiwan Kalyaniwalla*
Source: Capitaline
*Independent
Exhibit 6: Auditors
Name
Appan & Lokhandwala Associates
BSR & Co LLP
Mehta & Mehta
Mukundan K V
Appan & Lokhandwala Associates
Type
Statutory
Statutory
Secretarial Audit
Internal
Statutory
Source: Capitaline
Exhibit 7: MOSL forecast v/s consensus
EPS
(INR)
FY17
FY18
MOSL
forecast
10.6
12.8
Consensus
forecast
15.2
17.5
Variation (%)
-30.2
-26.9
Source: Bloomberg
23 November 2016
9
 Motilal Oswal Financial Services
Disclosures
Allcargo Logistics
This document has been prepared by Motilal Oswal Securities Limited (hereinafter referred to as Most) to provide information about the company (ies) and/sector(s), if any, covered in the report and may be distributed by it and/or its
affiliated company(ies). This report is for personal information of the selected recipient/s and does not construe to be any investment, legal or taxation advice to you. This research report does not constitute an offer, invitation or
inducement to invest in securities or other investments and Motilal Oswal Securities Limited (hereinafter referred as MOSt) is not soliciting any action based upon it. This report is not for public distribution and has been furnished to
you solely for your general information and should not be reproduced or redistributed to any other person in any form. This report does not constitute a personal recommendation or take into account the particular investment
objectives, financial situations, or needs of individual clients. Before acting on any advice or recommendation in this material, investors should consider whether it is suitable for their particular circumstances and, if necessary, seek
professional advice. The price and value of the investments referred to in this material and the income from them may go down as well as up, and investors may realize losses on any investments. Past performance is not a guide for
future performance, future returns are not guaranteed and a loss of original capital may occur.
MOSt and its affiliates are a full-service, integrated investment banking, investment management, brokerage and financing group. We and our affiliates have investment banking and other business relationships with a some
companies covered by our Research Department. Our research professionals may provide input into our investment banking and other business selection processes. Investors should assume that MOSt and/or its affiliates are
seeking or will seek investment banking or other business from the company or companies that are the subject of this material and that the research professionals who were involved in preparing this material may educate investors
on investments in such business . The research professionals responsible for the preparation of this document may interact with trading desk personnel, sales personnel and other parties for the purpose of gathering, applying and
interpreting information. Our research professionals are paid on twin parameters of performance & profitability of MOSt.
MOSt generally prohibits its analysts, persons reporting to analysts, and members of their households from maintaining a financial interest in the securities or derivatives of any companies that the analysts cover. Additionally, MOSt
generally prohibits its analysts and persons reporting to analysts from serving as an officer, director, or advisory board member of any companies that the analysts cover. Our salespeople, traders, and other professionals or affiliates
may provide oral or written market commentary or trading strategies to our clients that reflect opinions that are contrary to the opinions expressed herein, and our proprietary trading and investing businesses may make investment
decisions that are inconsistent with the recommendations expressed herein. In reviewing these materials, you should be aware that any or all of the foregoing among other things, may give rise to real or potential conflicts of interest.
MOSt and its affiliated company(ies), their directors and employees and their relatives may; (a) from time to time, have a long or short position in, act as principal in, and buy or sell the securities or derivatives thereof of companies
mentioned herein. (b) be engaged in any other transaction involving such securities and earn brokerage or other compensation or act as a market maker in the financial instruments of the company(ies) discussed herein or act as an
advisor or lender/borrower to such company(ies) or may have any other potential conflict of interests with respect to any recommendation and other related information and opinions.; however the same shall have no bearing
whatsoever on the specific recommendations made by the analyst(s), as the recommendations made by the analyst(s) are completely independent of the views of the affiliates of MOSt even though there might exist an inherent
conflict of interest in some of the stocks mentioned in the research report Reports based on technical and derivative analysis center on studying charts company's price movement, outstanding positions and trading volume, as
opposed to focusing on a company's fundamentals and, as such, may not match with a report on a company's fundamental analysis. In addition MOST has different business segments / Divisions with independent research
separated by Chinese walls catering to different set of customers having various objectives, risk profiles, investment horizon, etc, and therefore may at times have different contrary views on stocks sectors and markets.
Unauthorized disclosure, use, dissemination or copying (either whole or partial) of this information, is prohibited. The person accessing this information specifically agrees to exempt MOSt or any of its affiliates or employees from,
any and all responsibility/liability arising from such misuse and agrees not to hold MOSt or any of its affiliates or employees responsible for any such misuse and further agrees to hold MOSt or any of its affiliates or employees free
and harmless from all losses, costs, damages, expenses that may be suffered by the person accessing this information due to any errors and delays. The information contained herein is based on publicly available data or other
sources believed to be reliable. Any statements contained in this report attributed to a third party represent MOSt’s interpretation of the data, information and/or opinions provided by that third party either publicly or through a
subscription service, and such use and interpretation have not been reviewed by the third party. This Report is not intended to be a complete statement or summary of the securities, markets or developments referred to in the
document. While we would endeavor to update the information herein on reasonable basis, MOSt and/or its affiliates are under no obligation to update the information. Also there may be regulatory, compliance, or other reasons that
may prevent MOSt and/or its affiliates from doing so. MOSt or any of its affiliates or employees shall not be in any way responsible and liable for any loss or damage that may arise to any person from any inadvertent error in the
information contained in this report. MOSt or any of its affiliates or employees do not provide, at any time, any express or implied warranty of any kind, regarding any matter pertaining to this report, including without limitation the
implied warranties of merchantability, fitness for a particular purpose, and non-infringement. The recipients of this report should rely on their own investigations.
This report is intended for distribution to institutional investors. Recipients who are not institutional investors should seek advice of their independent financial advisor prior to taking any investment decision based on this report or for
any necessary explanation of its contents.
Most and it’s associates may have managed or co-managed public offering of securities, may have received compensation for investment banking or merchant banking or brokerage services, may have received any compensation
for products or services other than investment banking or merchant banking or brokerage services from the subject company in the past 12 months.
Most and it’s associates have not received any compensation or other benefits from the subject company or third party in connection with the research report.
Subject Company may have been a client of Most or its associates during twelve months preceding the date of distribution of the research report
MOSt and/or its affiliates and/or employees may have interests/positions, financial or otherwise of over 1 % at the end of the month immediately preceding the date of publication of the research in the securities mentioned in this
report. To enhance transparency, MOSt has incorporated a Disclosure of Interest Statement in this document. This should, however, not be treated as endorsement of the views expressed in the report.
Motilal Oswal Securities Limited is registered as a Research Analyst under SEBI (Research Analyst) Regulations, 2014. SEBI Reg. No. INH000000412
Pending Regulatory inspections against Motilal Oswal Securities Limited:
SEBI pursuant to a complaint from client Shri C.R. Mohanraj alleging unauthorized trading, issued a letter dated 29th April 2014 to MOSL notifying appointment of an Adjudicating Officer as per SEBI regulations to hold inquiry and
adjudge violation of SEBI Regulations; MOSL replied to the Show Cause Notice whereby SEBI granted us an opportunity of Inspection of Documents. Since all the documents requested by us were not covered we have requested to
SEBI vide our letter dated June 23, 2015 to provide pending list of documents for inspection.
List of associate companies of Motilal Oswal Securities Limited -Click
here to access detailed report
Analyst Certification
The views expressed in this research report accurately reflect the personal views of the analyst(s) about the subject securities or issues, and no part of the compensation of the research analyst(s) was, is, or will be directly or
indirectly related to the specific recommendations and views expressed by research analyst(s) in this report. The research analysts, strategists, or research associates principally responsible for preparation of MOSt research receive
compensation based upon various factors, including quality of research, investor client feedback, stock picking, competitive factors and firm revenues
Disclosure of Interest Statement
Analyst ownership of the stock
Served as an officer, director or employee
ALLCARGO LOGISTICS
No
No
A graph of daily closing prices of securities is available at www.nseindia.com and http://economictimes.indiatimes.com/markets/stocks/stock-quotes
Regional Disclosures (outside India)
This report is not directed or intended for distribution to or use by any person or entity resident in a state, country or any jurisdiction, where such distribution, publication, availability or use would be contrary to law, regulation or which
would subject MOSt & its group companies to registration or licensing requirements within such jurisdictions.
For Hong Kong:
This report is distributed in Hong Kong by Motilal Oswal capital Markets (Hong Kong) Private Limited, a licensed corporation (CE AYY-301) licensed and regulated by the Hong Kong Securities and Futures
Commission (SFC) pursuant to the Securities and Futures Ordinance (Chapter 571 of the Laws of Hong Kong) “SFO”. As per SEBI (Research Analyst Regulations) 2014 Motilal Oswal Securities (SEBI Reg No. INH000000412) has
an agreement with Motilal Oswal capital Markets (Hong Kong) Private Limited for distribution of research report in Kong Kong. This report is intended for distribution only to “Professional Investors” as defined in Part I of Schedule 1 to
SFO. Any investment or investment activity to which this document relates is only available to professional investor and will be engaged only with professional investors.” Nothing here is an offer or solicitation of these securities,
products and services in any jurisdiction where their offer or sale is not qualified or exempt from registration. The Indian Analyst(s) who compile this report is/are not located in Hong Kong & are not conducting Research Analysis in
Hong Kong.
Motilal Oswal Securities Limited (MOSL) is not a registered broker - dealer under the U.S. Securities Exchange Act of 1934, as amended (the"1934 act") and under applicable state laws in the United States. In addition MOSL is not a
registered investment adviser under the U.S. Investment Advisers Act of 1940, as amended (the "Advisers Act" and together with the 1934 Act, the "Acts), and under applicable state laws in the United States. Accordingly, in the
absence of specific exemption under the Acts, any brokerage and investment services provided by MOSL, including the products and services described herein are not available to or intended for U.S. persons.
This report is intended for distribution only to "Major Institutional Investors" as defined by Rule 15a-6(b)(4) of the Exchange Act and interpretations thereof by SEC (henceforth referred to as "major institutional investors"). This
document must not be acted on or relied on by persons who are not major institutional investors. Any investment or investment activity to which this document relates is only available to major institutional investors and will be
engaged in only with major institutional investors. In reliance on the exemption from registration provided by Rule 15a-6 of the U.S. Securities Exchange Act of 1934, as amended (the "Exchange Act") and interpretations thereof by
the U.S. Securities and Exchange Commission ("SEC") in order to conduct business with Institutional Investors based in the U.S., MOSL has entered into a chaperoning agreement with a U.S. registered broker-dealer, Motilal Oswal
Securities International Private Limited. ("MOSIPL"). Any business interaction pursuant to this report will have to be executed within the provisions of this chaperoning agreement.
The Research Analysts contributing to the report may not be registered /qualified as research analyst with FINRA. Such research analyst may not be associated persons of the U.S. registered broker-dealer, MOSIPL, and therefore,
may not be subject to NASD rule 2711 and NYSE Rule 472 restrictions on communication with a subject company, public appearances and trading securities held by a research analyst account.
For Singapore
Motilal Oswal Capital Markets Singapore Pte Limited is acting as an exempt financial advisor under section 23(1)(f) of the Financial Advisers Act(FAA) read with regulation 17(1)(d) of the Financial Advisors Regulations and is a
subsidiary of Motilal Oswal Securities Limited in India. This research is distributed in Singapore by Motilal Oswal Capital Markets Singapore Pte Limited and it is only directed in Singapore to accredited investors, as defined in the
Financial Advisers Regulations and the Securities and Futures Act (Chapter 289), as amended from time to time.
In respect of any matter arising from or in connection with the research you could contact the following representatives of Motilal Oswal Capital Markets Singapore Pte Limited:
Varun Kumar
Varun.kumar@motilaloswal.com
Contact : (+65) 68189232
Office Address:21 (Suite 31),16 Collyer Quay,Singapore 04931
For U.S
23 November 2016
Motilal Oswal Tower, Level 9, Sayani Road, Prabhadevi, Mumbai 400 025
Phone: +91 22 3982 5500 E-mail: reports@motilaloswal.com
Motilal Oswal Securities Ltd
10