Sector Update| 02 January 2017
Automobiles | Update
rrrrrrr
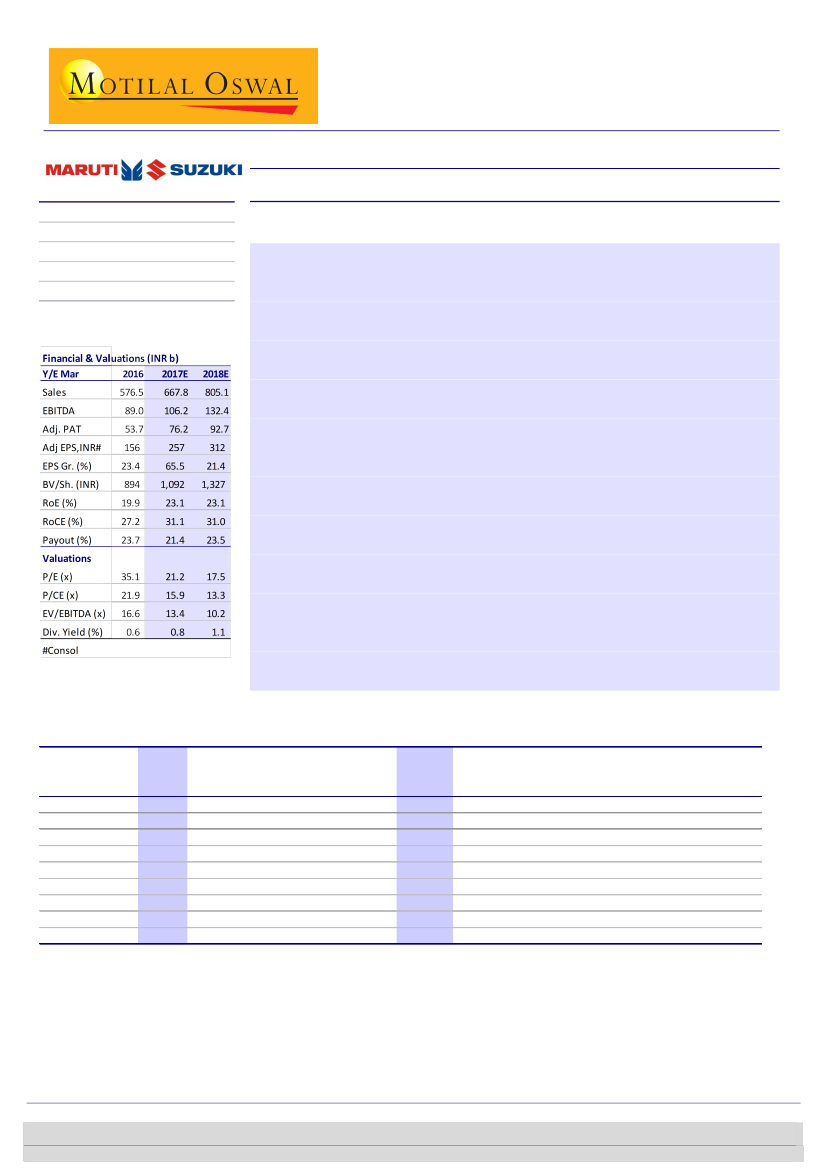
CMP: INR5,466
Bloomberg
Equity Shares (m)
M.Cap. (INR b) / (USD b)
52-Week Range (INR)
1, 6, 12 Rel. Per (%)
MSIL IN
302.1
1,651/24.2
5972/3202
6/33/16
Automobiles
TP: INR6,093 (+12%)
Buy
Below est at 117.9k units (v/s est. 124k), decline of ~1%YoY
Exports and new launches cushion demonetization impact
MSIL’s Dec-16 wholesales were below est at ~117,908 units (v/s est 123,960 units), 1%
YoY decline (-13% MoM). Our FY17 estimates indicate a 10% growth implying a 15.5%
residual growth rate or ~128.2k/month of run rate.
Domestic volumes declined by 4% YoY (-16% MoM) to 106k (v/s est 113k) due to the
impact of demonetization. The decline in domestic volumes was partially offset due to
waiting periods of Baleno and Brezza which account for ~15% of domestic volumes.
Mini segment was the worst hit due to demonetization, with volumes declining by
15% YoY.
The compact segment too declined by 9% YoY. Waiting period of Baleno restricted
further fall of the compact segment.
Dzire Tour declined by 29% YoY to 2559 units (v/s 3614 units in Dec-15).
Mid-size segment was driven by Ciaz with a 31% YoY growth. Ciaz clocked in 3711
units (v/s 2841 units in Dec-15).
UVs continued their momentum, with a 75% YoY growth, primarily aided by
incremental volumes of Vitarra Brezza, which enjoys a waiting period of 6-7 months.
Incremental volumes of Brezza, Baleno supported by robust growth in the mid size
segment (Ciaz) partially insulated the impact of demonetization on MSIL’s Dec-16
volumes.
We estimate retail volumes in Dec-16 to have grown by 8-10% on a YoY basis to 178k.
Export volumes surprised with a ~47% YoY growth to 11,494 units (v/s est 10,500
units) led by robust sales of Baleno to Japan and Europe.
The stock trades at 21.2x/17.5x FY17E/18E consolidated EPS of ~INR257/312. Maintain
Buy.
Snapshot of volumes for Dec 2016
Dec-16
Total volume
Domestic
LCVs
C (Vans)
A2 (Compacts)
A3 (Sedan)
A4
UV (Ertiga, S-Cross)
Export
Dec-15
YoY
(%)
-1.0
-4.4
0.0
-17.1
-10.2
-13.5
NA
75.3
47.1
Nov-16
135,550
126,325
105
12,238
77,133
19,634
0
17,215
9,225
MoM (%)
-13.0
-15.8
NA
-24.6
-17.3
-12.0
NA
-6.6
24.6
FY17-YTD
FY16-YTD
Chg
(%)
FY17
estimate
YoY Resi-dual Gr.
(%)
(%)
15.5
14.9
Residual
Monthly
Run rate
138,748
127,715
117,908 119,149
106,414 111,333
26
0
9,224
11,122
63,822 71,088
17,270 19,955
0
0
16,072
9,168
11,494
7,816
1,154,164 1,068,846 8.0 1,570,408 9.9
1,061,873 971,958
9.3 1,445,018 10.7
294
0
NA
112,007
107,581
4.1
612,150
583,468
4.9
194,168
216,985 -10.5
0
0
NA
143,254
63,924 124.1
92,291
96,888
-4.7 125,390
1.2
22.8
11,033
Investors are advised to refer through important disclosures made at the last page of the Research Report.
Jinesh Gandhi
(Jinesh@MotilalOswal.com); +91 22 3982 5416
Aditya Vora
(Aditya.Vora@MotilalOswal.com); +91 22 3078 4701
3 November 2014
1
Motilal Oswal research is available on www.motilaloswal.com/Institutional-Equities, Bloomberg, Thomson Reuters, Factset and S&P Capital.