12 January 2017
3QFY17 Results Update | Sector: Technology
TCS
BSE SENSEX
27,247
Bloomberg
Equity Shares (m)
M.Cap.(INRb)/(USDb)
52-Week Range (INR)
1, 6, 12 Rel. Per (%)
Avg Val, INRm
Free float (%)
S&P CNX
8,407
TCS IN
Set for new innings under Rajesh Gopinathan…
1,970
4,577.4 / 67.0
…Amid background of marginal 3Q beat and positive outlook
2740 / 2055
CFO Rajesh to succeed as the CEO:
With Mr. Natarajan Chandrasekaran set
3/-2/-10
to be the chairman of Tata Sons starting February 21, CFO Mr. Rajesh
2840
Gopinathan will take charge as the CEO of TCS. He started his professional
26.7
CMP: INR2,323 TP: INR2,550(+10%)
Neutral
Financials & Valuations (INR b)
2016
2017E
Y/E Mar
1,086.5 1,188.1
Net Sales
306.8
327.6
EBITDA
242.1
266.4
PAT
123.2
135.2
EPS (INR)
11.2
9.8
Gr. (%)
371.4
427.6
BV/Sh (INR)
37.1
33.8
RoE (%)
36.8
32.7
RoCE (%)
18.9
17.2
P/E (x)
6.3
5.4
P/BV (x)
2018E
1,345.0
367.8
286.2
145.3
7.4
505.5
31.1
29.4
16.0
4.6
Estimate change
TP change
Rating change
career with TCS in 2001. He was appointed as the CFO in February 2013, and
has also worked in roles of Strategy and Business Finance in the past. TCS
also announced N G Subramaniam as the COO of the company.
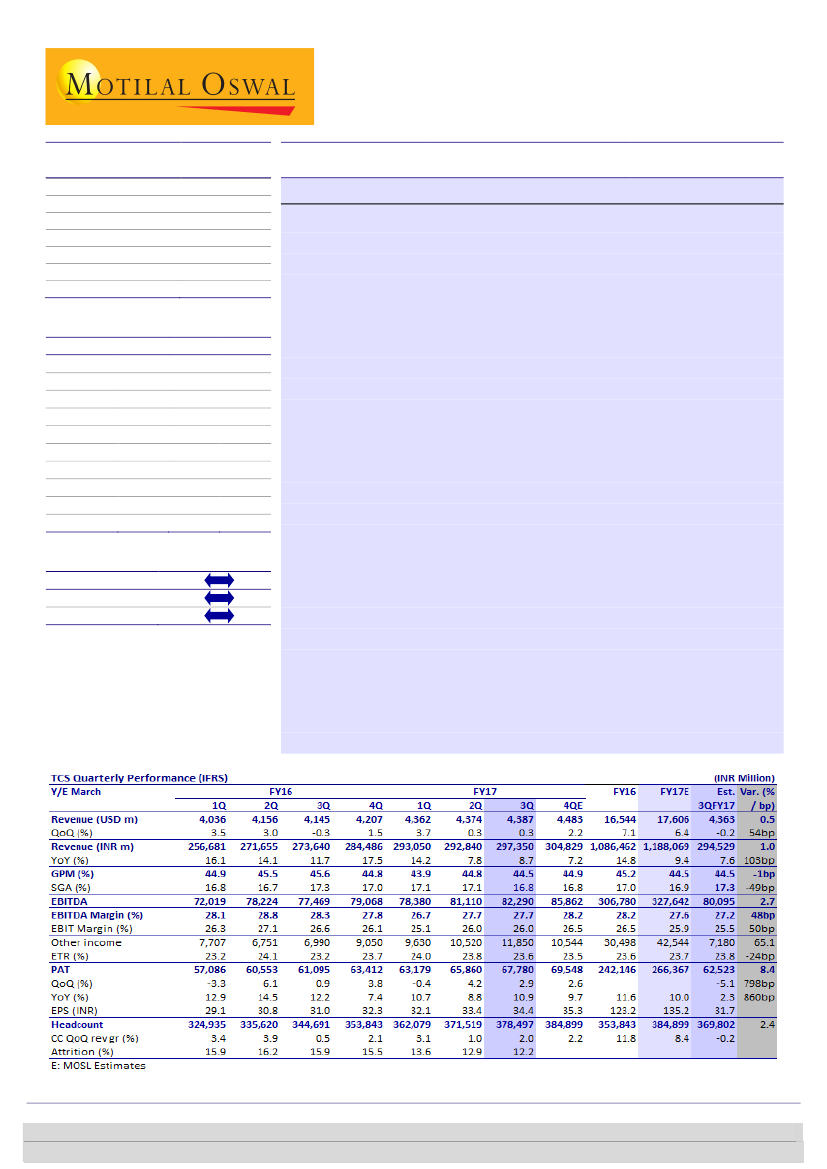
Marginal 3QFY17 beat:
TCS’ 3QFY17 CC revenue growth of 2.0% QoQ and
EBIT margin of 26% (flat QoQ) were both 50bp ahead of our estimates. India
(+10.3% QoQ), IMS (+9.5% QoQ CC) and Asset Leveraged solution (+21%
QoQ CC) drove growth, with BFSI and Retail seeing some recovery to grow at
company average. PAT was INR67.8b, +2.9% QoQ compared to our estimate
of INR62.5b aided by operating beat and higher other income.
Positive outlook - undeterred by visa implications:
TCS expects momentum
to sustain in 4Q, which drives our estimate of 2.2% QoQ CC growth next
quarter. Commentary was positive on all fronts: [1] Commitment to EBIT
margin band of 26-28% for now, despite the potential hike in wages for visa
employees, [2] Positive momentum in BFSI as clients shift from cost takeout
to growth, [3] Opportunity in traditional business from consolidation.
Valuation & View:
For the industry in last couple of years, topmost level
changes have understandably been accompanied with a round of flux ( more
recently at INFO, WPRO, MTCL), and one will have to be watchful of a
potentially similar shuffle at TCS. We tread cautiously as a result of this
uncertainty and ascribe a target multiple of 16x (v/s 17x earlier). Over FY16-
19, we expect TCS to grow its CC revenue/USD revenue/Earnings at CAGR of
10.1% / 8.3% / 8.8%. Our price target of INR2,550 implies 9% upside. Neutral
Investors are advised to refer through important disclosures made at the last page of the Research Report.
Motilal Oswal research is available on www.motilaloswal.com/Institutional-Equities, Bloomberg, Thomson Reuters, Factset and S&P Capital.
Ashish Chopra
(Ashish.Chopra@MotilalOswal.com); +91 22 6129 1530
Sagar Lele
(Sagar.Lele@MotilalOswal.com); +91 22 6129 1531
 Motilal Oswal Financial Services
TCS
3QFY17 marginally ahead of estimates
TCS’ 3QFY17 constant currency (CC) revenue growth was 2% QoQ, a tad above
our expectation of 1.5% QoQ CC.
Revenue growth was constituted of 1% QoQ volume growth, implying CC
realization improvement of 1%. Adverse cross currency movements impacted
revenues by 170bp, taking reported USD revenue growth down to 0.3% QoQ, at
USD4,387m.
YoY CC revenue growth during the quarter was 8.6% compared to 6.8% in the
previous quarter.
Strength in Digital bounced back up after seeing some weakness in 2QFY17.
Revenue from Digital grew by 4.7% QoQ, and it now constitutes to 16.8% of
total revenue. This compares with contribution of 16.1% in 2QFY17 and 13.7% in
3QFY16.
Exhibit 1: YoY CC growth improves to 8.4%, but remains in single digits for the fifth consecutive quarter
CC revenue growth (QoQ, %)
CC revenue growth (YoY, %)
Source: MOSL, Company
Exhibit 2: Breakup of revenue growth
1QFY17: USD revenue growth impacts
Volume
Realization change
Cross currency movements
QoQ USD revenue growth (%)
Percentage
+1.0
+1.0
-1.7
+0.3
Source: Company, MOSL
Segmental Color – Strong growth in some clouded by volatility in others
On a YoY CC basis, both UK (+4.9%) and Asia Pacific (+3.9%) have been soft. The
rest, excluding North America (+8.7%) have all grown in double digits.
Sequentially, North America grew 2.2% QoQ CC, UK grew 1.7% QoQ CC and
Continental Europe declined in CC terms QoQ by 1.1%. Double-digit sequential
growth was seen in Latin America (+12.5%) and India (+10.3%) sequentially.
Among verticals, Communication & Media declined by 4.9% QoQ CC and Life
Sciences & Healthcare by 0.8% QoQ CC. However, these were because of one-
offs and aren’t expect to drag going forward. BFSI (40.4% of total revenue) grew
by 2.1% QoQ CC. Energy & Utilities saw a strong rebound, growing by 5.8% QoQ
CC.
Among Services, Products business grew by 21% QoQ CC after seeing a decline
of 20% QoQ CC in 2Q. IMS picked up pace again growing by 9.5% QoQ CC.
Growth in ADM continued to be soft at -1.3% QoQ CC. Enterprise Solutions &
Consulting was flat during the quarter.
2
12 January 2017
 Motilal Oswal Financial Services
TCS
Exhibit 3: Double digit sequential growth in Latin America and India
Geographies
North America
Latin America
UK
Continental Europe
India
APAC
MEA
Contr. to
overall rev (%)
55.0
2.2
13.3
11.1
6.3
9.6
2.5
CC QoQ
Gr. (%)
2.2
12.5
1.7
-1.1
10.3
-1.8
3.8
CC YoY
Gr. (%)
8.7
15.1
4.9
11.3
13.1
3.9
19.8
Source: Company, MOSL
Exhibit 4: Communication and Healthcare drag growth
Verticals
BFSI
Retail & CPG
Communication & Media
Manufacturing
Life Sciences & Healthcare
Hi-Tech
Energy & Utilities
Travel & Hospitality
Others
Contr. to
overall rev (%)
40.4
13.5
10.6
10.6
7.4
5.4
4.5
3.8
3.8
CC QoQ
Gr. (%)
2.1
1.9
-4.9
2.1
-0.8
2.6
5.8
0.6
30.6
CC YoY
Gr. (%)
8.4
3.4
5.4
12.5
9.3
1.2
21.3
12.7
21.4
Source: Company, MOSL
Exhibit 5: Strong growth in Infrastructure Services and Asset Leveraged Solutions
Services
ADM
EAS + Consulting
Testing
Engg Services
IMS
Products
BPO
Contr. to
overall rev (%)
37.2
17.5
9.0
4.9
16.8
3.0
11.6
CC QoQ
Gr. (%)
-1.3
0.2
1.7
3.1
9.5
21.0
1.5
CC YoY
Gr. (%)
1.6
8.7
13.5
18.2
19.9
17.2
8.2
Source: Company, MOSL
Flat margins, partly aided by one-time in the previous quarter
EBIT margin was flat at 26%, marginally ahead of our estimate of 25.5% (-50bp
QoQ). In the previous quarter, costs included USD26m paid to settle the Orange
County lawsuit, the absence of which in 3Q resulted in a tailwind of ~60bp.
In cost of services, Equipment & Software costs increased 150bp QoQ despite
which margins remained flat. The cost was accompanied by a proportion
increase in revenue that got reflected in the growth seen in India, Infrastructure
Services and Asset Leveraged Solutions.
PAT was INR67.8b, +2.9% QoQ, compared to our estimate of INR62.5b (decline
of 5.1% QoQ) primarily because of slight operational beat and higher Other
Income.
12 January 2017
3
 Motilal Oswal Financial Services
TCS
Exhibit 6: Margins 50bp ahead of our estimate
30.2 29.7
29.1
SGA (% of Revenues)
27.2
26.3 26.8 27.0
EBIT Margin (%)
27.1 26.6
26.1
26.0 26.0
27.0
25.1
25.1
18.6
17.3 17.9 17.1 17.5 17.0 17.3
17.3 17.0 17.1 17.1 16.8
16.3 17.1 16.7
Source: Company, MOSL
Leadership changes – Rajesh Gopinathan takes over as CEO, NGS as COO
Rajesh Gopinathan has been appointed as CEO and MD. He would take over
from N Chandrasekaran, who has been appointed as Chairman of Tata Sons
effective February 21, 2017.
Rajesh has been the CFO of TCS since February 2013, prior to which he was the
Vice President – Business Finance, where he was responsible for financial
management of the company’s individual operating units.
N Ganapathy Subramaniam (NGS) has been appointed the as the President and
Chief Operating Officer. He currently is the President of TCS Financial Solutions,
and has been part of TCS and the industry for the past 34 years. He has played a
global role, especially in the Banking and Financial Services sector.
Cash generation strong
Cash generation for TCS improved significantly as it generated INR79.6b in cash
from operations, clocking an OCF margin of 26.8%. This has been a sharp
improvement from 21.5% in 3QFY16.
This was led by improvement in DSO of 3 days to 74 in 3QFY17, compared to 77
at the end of FY16. Including unbilled revenue, DSO stood at 88 in 3QFY17,
compared to 90 at the end of FY16.
Free cash flow at INR75.5b clocking at 111% of net profit. This compares with
FCF/net profit of 89% in 3QFY16.
Takeaways from Management commentary
One-offs in Communication and Healthcare:
Revenue declined sequentially in
the verticals of Communication and Healthcare. In Communication, weakness
was seen in UK, Europe and Asia Pacific; while in Healthcare the US slowed
down. However, both these factors are one-off, and aren’t expect to continue
following the same trend going forward.
Focused on reducing visa dependency:
In light of recent regulatory
developments, TCS highlighted that it has been a key partner to its clients, who
have been facing business model challenges. It has been ramping up local
recruitment efforts, partnering with universities, and running STEP programmes.
TCS has been amongst the top net job creators in the US. It has been continually
reducing dependency on visas; evident from the fact that it applied for a third of
the visas this year, compared to the previous year.
4
12 January 2017
 Motilal Oswal Financial Services
TCS
Wages up to the mark:
Onsite wages at TCV have been benchmarked against
their prevailing locations, and adjusted for age and experience. There is a high
convergence of salaries between locals and those in the US on visas. Typically,
locals have been hired in senior capacities, while technical gaps have been filled
by supply of resources from outside the US.
Buoyancy in BFSI:
BFSI, over the last 5-6 years has been focused on cost take-
out, regulatory compliance and automation. However, they are now looking at
growth, and investments in technology. The pipeline, and TCS’ positioning have
been leading to a buoyant outlook in the vertical.
Margin band maintained:
TCS maintained its targeted EBIT margin band of 26-
28%. It has been approaching the market in a well-balanced manner to achieve
both growth and profitability. Despite some known and some unknown cost
pressures, the intent is to maintain profitability in the target band. While some
cost pressures can be addressed, the true impact on costs and profitability from
regulatory changes will only be known once details around the legislation are
made know.
Cutting revenue estimates 1.3-2.2%
With growth largely in line with estimates in 3QFY17, we haven’t tempered
much with our FY17 growth estimates. However, we have adjusted that for
FY18E lower to factor for cross-currency impact.
Our EBIT margin estimates are up slightly (20-25bp) factoring strong execution
demonstrated over the last couple of quarters, coupled with positive
commentary around the intent to maintain the band despite pressures.
Consequently, our earnings estimates are mostly unchanged, with revenue
moderation offsetting the slight margin uptick.
Exhibit 7: Change in estimates
FY17E
67.5
17,670
6.8
25.9
135.2
Revised
Earlier
Change
FY18E FY19E FY17E FY18E FY19E FY17E FY18E FY19E
70.0
70.4
67.5
70.0
70.4 -0.1%
0.0% 0.0%
19,224 20,998 17,761 19,528 21,322 -0.5% -1.6% -1.5%
8.8
9.2
7.4
9.9
9.2 -55bp -115bp 5bp
25.9
25.4
25.6
25.7
25.4 26bp
22bp 8bp
145.3 158.4 131.9 147.0 157.5 2.5% -1.2% 0.6%
Source: Company, MOSL
INR/USD
USD Revenue - m
USD revenue growth (%)
EBIT Margin (%)
EPS - INR
Valuation and view
Over FY11-15, TCS had led the incremental revenues as well as operating profits
not just domestically, but also in the global arena (compared to peers multiple
times its size). However, weak areas like Diligenta, Japan and India / Latin
America saw the company cede its growth leadership to peers such as CTSH and
INFO last year.
During the period of outperformance, TCS’ traction has been impressively
broad-based, unlike select pockets of stress across its peer group. However,
over the past 12 months, some factors that have led relative softness in
performance v/s the company’s expectations have had secular elements
(Energy, Telecom and Insurance in FY16, followed by BFSI and Retail this year),
as well as company-specific headwinds (India, Japan and Diligenta in particular).
5
12 January 2017
 Motilal Oswal Financial Services
TCS
Geographically, although the company sees some stability in Latin America and
India, while Japan may still take a while before delivering sustained growth.
The growth outperformance to industry peers has waned, but it is well invested
building Digital capabilities to recoup that advantage. We expect acceleration in
revenue growth from current ~7% YoY CC to ~10% in FY18, led by continued
high growth on the increasing Digital base and eventual ramp ups that have hit
FY17 momentum.
Uncertain macro limits confidence to proceed with project based IT spending
that is discretionary in nature, especially in verticals like BFSI and Retail. TCS’
exposure to both BFSI and UK is slightly higher than peers, implying that
performance in near term may not see any sharp revival. Commentary by the
management and outlook going forward however has been positive led by
optimism around BFSI and opportunity in traditional business from
consolidation.
For the industry in last couple of years, changes at the very top have been
understandably been accompanied with a round of flux (at INFO, WPRO, MTCL),
and one cannot rule out the uncertainty from a potentially similar shakeout at
TCS. We tread cautiously as a result of this uncertainty and ascribe a target
multiple of 16x (v/s 17x earlier). Our growth expectations for Revenue / Earnings
CAGR over FY16-19E stand at 8.3 / 8.8%. Our target price of INR2,550 discounts
FY19 EPS by 16x, and implies 9% upside. Maintain
Neutral.
Key triggers
Sustained pickup in BFSI | Retail
Digital-led resurgence in growth leadership
Further recovery in margins in the near term
Key risk factors
Further deceleration in YoY CC growth from turbulent macro
Rapid appreciation in INR
Intensification of pricing pressure
Exhibit 9: TCS 1-year forward PB chart
Avg(x)
25.8
Min(x)
11.5
9.5
7.5
6.1
4.9
2.3
PB (x)
Peak(x)
Avg(x)
Min(x)
10.5
Exhibit 8: TCS 1 year forward PE chart
30
24
18
12
6
7.0
17.8
16.7
PE (x)
Peak(x)
5.5
3.5
1.5
Source: Company, MOSL
12 January 2017
6
 Motilal Oswal Financial Services
TCS
Exhibit 10: Comparative Valuation
Company
TCS
Infosys
Wipro
HCL Tech
TechM
Tier-I Aggr
Mkt cap
(USD b)
68.1
34.1
17.3
17.7
7.1
144.3
TP Upside
EPS (INR)
P/E (x)
(INR)
(%) FY17E FY18E FY19E FY17E FY18E
Neutral 2,550 9.8
135.2 145.3 158.4 17.1 16.0
Buy 1,250 25.1
61.7 67.8 75.0 16.2 14.7
Neutral 560
18.9
34.3 39.5 44.1 13.7 11.9
Buy
960
14.1
56.7 63.2 67.2 14.8 13.3
Buy
560
16.4
30.9 36.0 39.5 15.6 13.4
15.5 13.9
Rating
FY19E FY17E
14.6 33.8
13.3 22.8
10.7 17.7
12.5 26.6
12.2 19.1
12.7 24.0
RoE (%)
FY18E
31.1
22.6
18.5
25.5
19.3
23.4
FY19E
29.0
22.5
18.5
23.2
18.5
22.3
FY17-19E CAGR (%)
USD rev.
EPS
9.0
8.3
9.8
10.3
7.9
13.5
11.2
8.9
8.9
13.1
Source: Company, MOSL
12 January 2017
7
 Motilal Oswal Financial Services
TCS
Story in charts
Exhibit 11: Outperformance to peers has waned…
FY11
FY12
FY13
FY14
FY15
FY16
1HFY17
Exhibit 12: … amid fast decelerating revenues
CC revenue growth (YoY, %)
TCS
Infosys
Wipro (IT
Services)
HCL Tech
Source: Company, MOSL
Exhibit 13: Revenue growth getting delinked to headcount…
170
160
150
140
130
120
110
100
Headcount
USD revenues
Exhibit 14: ...as competitive intensity gradually pulls down
pricing
Picing indexed at 100
102
100
98
96
94
Source: Company, MOSL
Exhibit 15: Operating at peak efficiency, reflected in
utilization (assumed 4QFY16 onwards)…
Util Excl. Trainees (%)
86.785.4
85.386.2
84.986.084.984.9
86.084.9
83.082.0
Exhibit 16: ..Margins continue to be within the targeted
range
SGA (% of Revenues)
EBIT Margin (%)
25.126.026.0
30.229.729.1
82.7
83.484.383.8
84.9
27.0
26.326.827.027.2
25.1
27.126.626.1
72.5
75.0
77.577.9
79.8
81.382.181.582.082.380.980.982.0
18.6
17.317.917.117.517.017.316.317.116.717.317.017.117.116.8
Source: Company, MOSL
12 January 2017
8
 Motilal Oswal Financial Services
TCS
Exhibit 17: Operating Metrics
2QFY15
Service Lines (%)
ADM
Engineering and Industrial Services
Infrastructure Services
Enterprise Solutions
Global Consulting
Enterprise Solutions & Consulting
Asset Leverage Solutions
Assurance Services
BPO
Industry Verticals (%)
BFSI
Manufacturing
Telecom + Media
Life Sciences & Healthcare
Retail & Distribution
Transportation
Energy and Utilities
Hi-Tech
Others
Geographies (%)
America
UK
Rest of Europe
Europe
India
APAC
Latin America
MEA
Others
Revenue Mix (%)
Offshore
Onsite
GDC
Utilization
Excluding Trainees
Including Trainees
Total Employees
Trainee Additions
Lateral Additions
Overseas Additions
Gross Additions
Net Additions
Attrition (LTM %)
40.5
4.6
13.8
15.6
3.2
18.8
2.3
8.4
11.6
3QFY15
39.5
4.5
14.3
15.4
3.7
19.1
2.4
8.5
11.7
4QFY15
40.1
4.5
14.5
15.4
3.2
18.6
2.3
8.4
11.6
1QFY16
40.3
4.5
14.7
15.1
2.9
18.0
2.5
8.5
11.5
2QFY16
40.0
4.5
14.7
15.0
2.5
17.5
3.2
8.7
11.4
3QFY16
39.7
4.5
15.2
4QFY16
39.4
4.7
15.2
1QFY17
38.5
4.8
15.5
2QFY17
38.4
4.8
15.7
3QFY17
37.2
4.9
16.8
17.4
2.8
8.6
11.8
17.1
3.2
8.8
11.6
17.7
3.2
8.8
11.5
17.8
2.6
9.0
11.7
17.5
3.0
9.0
11.6
40.4
10.1
11.6
6.3
13.5
3.5
4.3
5.7
4.6
40.5
10.1
11.6
6.4
13.4
3.5
4.2
5.9
4.4
40.6
10.2
10.8
6.7
13.6
3.4
3.9
6.0
4.8
40.6
9.9
11.1
6.9
13.8
3.5
4.0
5.8
4.4
40.5
9.8
10.8
7.0
13.8
3.6
4.0
5.9
4.6
40.5
9.9
10.9
7.3
13.8
3.6
4.1
6.0
3.9
40.9
10.4
10.8
7.3
14.1
3.7
4.1
5.6
3.1
40.4
10.4
11.3
7.3
14.0
3.9
4.2
5.4
3.1
40.4
10.7
11.4
7.6
13.4
3.9
4.3
5.4
2.9
40.4
10.6
10.6
7.4
13.5
3.8
4.5
5.4
3.8
51.0
17.1
11.5
28.6
6.5
10.1
1.9
1.9
20.4
51.9
16.1
11.7
27.8
6.5
9.7
2.1
2.0
20.3
52.4
15.9
11.1
27.0
6.6
9.8
2.1
2.1
20.6
52.8
16.1
11.0
27.1
6.4
9.6
1.9
2.2
20.1
52.7
16.4
10.8
27.2
6.5
9.4
1.8
2.4
20.1
53.5
15.9
10.9
26.8
6.0
9.4
2.1
2.2
19.7
54.0
14.9
11.2
26.1
5.9
9.6
2.0
2.4
19.9
53.5
14.8
11.5
26.3
6.2
9.6
2.0
2.4
20.2
54.0
13.8
11.8
25.6
5.8
10.2
2.0
2.4
20.4
55.0
13.3
11.1
24.4
6.3
9.6
2.2
2.5
20.6
45.7
48.9
5.4
46.0
48.2
5.8
46.0
48.5
5.5
86.2
81.3
86.7
82.1
85.4
81.5
86.3
82.9
86.0
82.3
84.9
80.9
313,757 318,625 319,656 324,935 335,620 344,691 353,843 362,079 371,519 378,497
7,583
5,529
5,569
6,425
9,943
7,593
8,623
5,038 11,884 10,950
8,924
6,129
5,853
9,337 10,978 10,451 10,659
9,877
7,486
4,804
3,843
4,903
2,973
4,540
4,265
4,074
3,294
2,877
3,295
2,608
20,350 16,561 14,395 20,302 25,186 22,118 22,576 17,792 22,665 18,362
8,326
4,868
1,031
5,279 10,685
9,071
9,071
9,071
9,440
6,978
12.8
13.4
14.9
15.9
16.2
15.9
15.5
13.6
12.9
12.2
Source: Company, MOSL
12 January 2017
9
 Motilal Oswal Financial Services
TCS
Exhibit 18: Growth Metrics
QoQ growth (%)
Service Lines
ADM
Engineering and Industrial Services
Infrastructure Services
Enterprise Solutions
Global Consulting
Asset Leverage Solutions
Assurance Services
BPO
Industry Verticals
BFSI
Manufacturing
Telecom
Life Sciences & Healthcare
Retail & Distribution
Transportation
Energy and Utilities
Hi-Tech
Others
Geographies
America
UK
Rest of Europe
Europe
India
APAC
Latin America
MEA
Others
Offshore
Onsite
GDC
Overall International business
Domestic Business
2QFY15
5.6
8.7
16.5
4.3
6.4
-2.2
3.9
3.7
3QFY15
-2.4
-2.1
3.7
-1.2
15.7
4.4
1.2
0.9
4QFY15
0.7
-0.8
0.6
-0.8
-14.2
-4.9
-2.0
-1.6
1QFY16
4.0
3.5
4.9
1.5
-6.2
12.5
4.7
2.6
2QFY16
2.2
3.0
3.0
2.3
-11.2
31.8
5.4
2.1
3QFY16
-1.0
-0.3
3.1
0.0
0.0
-12.7
-1.4
3.2
4QFY16
0.7
6.0
1.5
0.0
0.0
16.0
3.9
-0.2
1QFY17
1.3
5.9
5.7
0.0
0.0
3.7
3.7
2.8
2QFY17
0.0
0.3
1.6
0.0
0.0
-18.5
2.6
2.0
3QFY17
-2.8
2.4
7.3
0.0
0.0
15.7
0.3
-0.6
3.0
24.9
0.7
6.4
4.0
3.4
17.3
10.2
8.7
0.3
0.1
0.1
1.6
-0.7
0.1
-2.3
3.6
-4.3
-0.5
0.2
-9.7
3.9
0.7
-3.6
-7.9
0.9
8.2
3.5
0.5
9.9
6.6
5.0
6.5
6.2
0.0
-5.1
2.7
1.9
0.6
4.5
3.0
5.9
3.0
4.7
7.6
-0.3
0.7
-0.3
4.0
-0.3
-0.3
2.2
1.4
-15.5
2.5
6.6
0.3
1.5
3.7
4.3
1.5
-5.3
-19.3
2.4
3.7
9.9
3.7
2.9
9.3
6.2
0.0
3.7
0.3
3.2
1.4
4.4
-4.0
0.3
2.7
0.3
-6.2
0.3
-0.6
-8.7
-2.3
1.0
-2.3
5.0
0.3
31.4
3.9
2.7
1.9
2.4
9.7
41.3
-8.1
1.0
19.9
2.7
10.2
0.5
6.1
9.7
1.8
-5.8
1.8
-2.7
0.1
-3.9
10.6
5.3
-0.4
0.7
-1.4
7.5
0.1
0.1
0.2
-2.0
-5.9
-3.6
0.7
0.2
-0.8
4.2
0.7
-0.9
-0.3
-6.0
-0.9
0.7
4.3
4.8
2.6
3.9
0.4
1.4
-6.4
8.4
1.0
3.7
3.7
3.7
3.7
0.4
2.8
4.9
1.1
3.3
4.6
0.8
-2.5
12.3
3.0
1.2
-3.3
0.6
-1.7
-7.9
-0.3
16.3
-8.6
-2.3
2.5
-4.9
4.3
-1.1
-0.2
3.7
-3.3
10.7
2.5
2.7
3.0
6.5
4.5
9.0
3.7
3.7
3.7
5.2
1.2
-6.5
2.9
-2.4
-6.2
6.5
0.3
0.3
1.3
2.2
-3.3
-5.7
-4.4
8.9
-5.6
10.3
4.5
1.3
2.9
4.6
0.3
-7.9
1.6
-0.2
3.4
9.0
0.7
-6.2
1.3
8.9
Source: Company, MOSL
12 January 2017
10
 Motilal Oswal Financial Services
TCS
Financials and Valuations
Key assumption
INR/USD Rate
Revenues (USD m)
Offshore Revenue (%)
Total Headcount
Net Addition
Per Capita Productivity
Util. excl. trainees (%)
Util. incl. trainees (%)
2012
48.1
10,171
50.6
238,583
39,969
46,528
82.2
68.7
2012
488,938
31.0
144,177
29.5
9,036
135,141
4,041
0
139,182
31,688
22.8
1,110
106,384
106,384
22.5
2012
1,957
323,276
325,233
1,000
5,276
12,306
343,815
107,400
42,852
64,548
0
347,442
137,469
34,617
175,356
68,175
68,175
279,267
343,815
2013
54.4
11,568
49.3
276,196
37,613
44,945
81.7
68.3
2013
629,895
28.8
180,870
28.7
10,792
170,078
11,174
0
181,252
40,344
22.3
1,494
139,413
139,413
31.0
2013
1,957
407,524
409,481
1,000
6,561
10,894
427,936
135,587
53,644
81,944
33,765
403,836
172,366
79,035
152,435
91,609
91,609
312,228
427,936
2014
60.9
13,443
47.9
300,464
24,268
46,623
83.6
75.4
2014
818,094
29.9
251,322
30.7
13,243
238,079
15,891
0
253,969
60,712
23.9
2,089
191,168
191,168
37.1
2014
1,959
551,393
553,352
0
6,905
12,561
572,817
170,530
66,887
103,644
37,673
547,808
222,360
156,495
168,953
116,308
116,308
431,500
572,817
2015
61.2
15,454
46.2
319,656
19,192
49,843
85.9
82.0
2015
946,484
15.7
272,941
28.8
18,698
254,243
31,393
0
285,636
66,564
23.3
2,114
216,958
216,958
13.5
2015
1,959
572,808
574,767
0
9,136
19,004
602,907
201,300
85,585
115,716
7,283
626,539
242,670
197,713
186,157
146,630
146,630
479,909
602,907
2016
65.7
16,544
46.0
353,843
34,187
49,128
85.5
80.5
2016
1,086,462
14.8
306,780
28.2
18,879
287,901
30,498
0
318,399
75,026
23.6
1,227
242,146
242,146
11.6
2016
1,970
729,929
731,899
0
3,542
14,092
749,533
222,363
104,464
117,900
7,831
786,397
280,646
292,021
213,731
162,594
162,594
623,803
749,533
2017E
67.5
17,606
46.0
384,899
31,056
47,664
85.1
81.6
2017E
1,188,069
9.4
327,642
27.6
19,834
307,809
42,544
0
350,353
83,095
23.7
891
266,367
266,367
10.0
2017E
1,970
840,490
842,460
0
3,550
14,361
860,371
260,070
124,297
135,773
2,670
880,285
309,919
348,078
222,288
158,357
158,357
721,928
860,371
2018E
70.0
19,224
46.0
423,495
38,596
47,560
85.2
81.2
2018E
1,344,965
13.2
367,801
27.3
19,364
348,437
27,574
0
376,011
88,363
23.5
1,440
286,208
286,208
7.4
2019E
70.4
20,998
46.0
457,947
34,451
47,646
85.2
81.7
2019E
1,478,291
9.9
397,516
26.9
21,345
376,171
33,790
0
409,961
96,341
23.5
1,440
312,180
312,180
9.1
Income Statement
Y/E Mar
Net Sales
Change (%)
EBITDA
EBITDA Margin (%)
Depreciation
EBIT
Other Income
Extraordinary items
PBT
Tax
Tax Rate (%)
Min. Int. & Assoc. Share
Reported PAT
Adjusted PAT
Change (%)
(INR Million)
Balance Sheet
Y/E Mar
Share Capital
Reserves
Net Worth
Preference Shares
Minority Interest
Loans & Other Liabilities
Total Capital Employed
Gross Fixed Assets
Less: Acc Depreciation
Net Fixed Assets
Investments
Current Assets
Debtors
Cash & Bank
Loans & Adv, Others
Curr Liabs & Provns
Curr. Liabilities
Net Current Assets
Total Assets
(INR Million)
2018E
2019E
1,970
1,970
993,907 1,157,173
995,877 1,159,143
0
0
3,550
3,550
16,362
17,718
1,015,789 1,180,410
288,260 316,450
143,661 165,007
144,599 151,444
2,670
2,670
1,047,044 1,219,475
354,982 385,512
440,621 556,983
251,441 276,980
178,523 193,178
178,523 193,178
868,520 1,026,297
1,015,789 1,180,410
12 January 2017
11
 Motilal Oswal Financial Services
TCS
Financials and Valuations
Ratios
Y/E Mar
Basic (INR)
EPS
Cash EPS
Book Value
DPS
Payout (incl. Div. Tax.)
Valuation(x)
P/E
Cash P/E
Price / Book Value
EV/Sales
EV/EBITDA
Dividend Yield (%)
Profitability Ratios (%)
RoE
RoCE
RoIC
Turnover Ratios (%)
Fixed Asset Turnover (x)
Debtors (No. of Days)
Leverage Ratios (%)
Net Debt/Equity (x)
2012
54.4
59.0
166.7
25.0
46.0
2013
71.2
76.7
209.7
22.0
30.9
2014
97.6
104.4
282.5
32.0
32.8
2015
110.8
120.3
293.4
79.0
71.3
2016
123.2
132.5
371.4
43.4
35.2
2017E
135.2
145.3
427.6
46.5
34.4
2018E
145.3
155.1
505.5
55.7
38.4
2019E
158.4
169.3
588.4
62.5
39.5
21.0
19.3
7.9
4.6
16.0
3.4
36.7
35.1
40.8
8.4
86.9
-0.1
2012
144,177
-28,759
-49,352
66,066
-41,584
24,483
18,390
-23,193
0
1,588
-57,246
-55,658
-12,785
47,401
34,616
37.8
36.5
42.4
8.6
89.8
-0.2
2013
180,870
-30,664
-13,501
136,704
-6,733
129,971
-33,765
-40,498
0
-1,412
-50,377
-51,788
44,418
34,616
79,034
39.7
38.6
52.2
8.8
88.1
-0.3
2014
251,322
-46,910
12,834
217,246
-64,233
153,012
-3,909
-68,142
0
1,666
-73,310
-71,643
77,461
79,034
156,494
38.5
37.8
50.2
8.6
89.7
-0.3
2015
272,941
-57,762
25,257
240,437
-49,941
190,496
30,391
-19,550
0
6,444
-186,113
-179,670
41,217
156,494
197,712
18.9
17.5
6.3
4.0
14.0
1.9
37.1
36.8
51.9
9.3
87.9
-0.4
2016
306,780
-45,755
-32,355
228,670
-38,294
190,376
-548
-38,842
12,778
-4,913
-103,385
-95,519
94,309
197,712
292,020
17.2
16.0
5.4
3.6
12.9
2.0
33.8
32.7
49.0
9.4
90.7
-0.4
2017E
327,642
-41,442
-58,999
227,202
-20,777
206,426
5,161
-15,616
-45,006
270
-110,793
-155,530
56,057
292,020
348,077
16.0
15.0
4.6
3.1
11.3
2.4
31.1
29.4
49.3
9.6
90.2
-0.4
2018E
367,801
-62,229
-37,214
268,358
-45,026
223,333
0
-45,026
0
2,001
-132,791
-130,790
92,543
348,077
440,620
14.7
13.7
3.9
2.7
10.1
2.7
29.0
27.2
48.2
10.0
91.4
-0.5
2019E
397,516
-63,990
-24,220
309,305
-45,384
263,922
0
-45,384
0
1,356
-148,915
-147,559
116,362
440,620
556,982
Cash Flow Statement
Y/E Mar
Adjusted EBITDA
Non cash opr. exp (inc)
(Inc)/Dec in Wkg. Cap.
CF from Op. Activity
(Inc)/Dec in FA & CWIP
Free cash flows
(Pur)/Sale of Invt
CF from Inv. Activity
Inc/(Dec) in Net Worth
Inc / (Dec) in Debt
Divd Paid (incl Tax) & Others
CF from Fin. Activity
Inc/(Dec) in Cash
Add: Opening Balance
Closing Balance
(INR Million)
12 January 2017
12
 Motilal Oswal Financial Services
TCS
Corporate profile
Company description
TCS is the largest IT services company in India, with
(LTM) revenue of over USD17.1b. It employs over
371,000 people and provides IT and BPO services to
over 1,000 global clients. It is one of the preferred
IT vendors for most Fortune 500/Global 1,000
companies.
Exhibit 1: Sensex rebased
Source: MOSL/Bloomberg
Exhibit 2: Shareholding pattern (%)
Sep-16
Promoter
DII
FII
Others
73.3
5.2
17.0
4.5
Jun-16
73.3
5.2
17.0
4.5
Sep-15
73.9
8.9
12.7
4.5
Source: Capitaline
Exhibit 3: Top holders
Holder Name
LIC of India
% Holding
3.2
Note: FII Includes depository receipts
Source: Capitaline
Exhibit 4: Top management
Name
Ishaat Hussain
N Chandrasekaran
Suprakash Mukhopadhyay
Designation
Chairman
Managing Director &
CEO
Company Secretary
Exhibit 5: Directors
Name
Aarthi Subramanian
Aman Mehta
O P Bhatt
V Thyagarajan
Name
P A Vandrevala
Clayton M Christensen
Ron Sommer
Vijay Kelkar
Source: Capitaline
*Independent
Exhibit 6: Auditors
Name
Deloitte Haskins & Sells LLP
Type
Statutory
Exhibit 7: MOSL forecast v/s consensus
EPS
(INR)
FY17
FY18
MOSL
forecast
135.2
145.3
Consensus
forecast
132.6
143.5
Variation (%)
2.0
1.3
Source: Bloomberg
Source: Capitaline
12 January 2017
13
 Motilal Oswal Financial Services
Disclosures
This document has been prepared by Motilal Oswal Securities Limited (hereinafter referred to as Most) to provide information about the company (ies) and/sector(s), if any, covered in the report and may be distributed by it and/or
TCS
its affiliated company(ies). This report is for personal information of the selected recipient/s and does not construe to be any investment, legal or taxation advice to you. This research report does not constitute an offer, invitation or
inducement to invest in securities or other investments and Motilal Oswal Securities Limited (hereinafter referred as MOSt) is not soliciting any action based upon it. This report is not for public distribution and has been furnished to
you solely for your general information and should not be reproduced or redistributed to any other person in any form. This report does not constitute a personal recommendation or take into account the particular investment
objectives, financial situations, or needs of individual clients. Before acting on any advice or recommendation in this material, investors should consider whether it is suitable for their particular circumstances and, if necessary, seek
professional advice. The price and value of the investments referred to in this material and the income from them may go down as well as up, and investors may realize losses on any investments. Past performance is not a guide
for future performance, future returns are not guaranteed and a loss of original capital may occur.
MOSt and its affiliates are a full-service, integrated investment banking, investment management, brokerage and financing group. We and our affiliates have investment banking and other business relationships with a some
companies covered by our Research Department. Our research professionals may provide input into our investment banking and other business selection processes. Investors should assume that MOSt and/or its affiliates are
seeking or will seek investment banking or other business from the company or companies that are the subject of this material and that the research professionals who were involved in preparing this material may educate
investors on investments in such business . The research professionals responsible for the preparation of this document may interact with trading desk personnel, sales personnel and other parties for the purpose of gathering,
applying and interpreting information. Our research professionals are paid on twin parameters of performance & profitability of MOSt.
MOSt generally prohibits its analysts, persons reporting to analysts, and members of their households from maintaining a financial interest in the securities or derivatives of any companies that the analysts cover. Additionally,
MOSt generally prohibits its analysts and persons reporting to analysts from serving as an officer, director, or advisory board member of any companies that the analysts cover. Our salespeople, traders, and other professionals or
affiliates may provide oral or written market commentary or trading strategies to our clients that reflect opinions that are contrary to the opinions expressed herein, and our proprietary trading and investing businesses may make
investment decisions that are inconsistent with the recommendations expressed herein. In reviewing these materials, you should be aware that any or all of the foregoing among other things, may give rise to real or potential
conflicts of interest. MOSt and its affiliated company(ies), their directors and employees and their relatives may; (a) from time to time, have a long or short position in, act as principal in, and buy or sell the securities or derivatives
thereof of companies mentioned herein. (b) be engaged in any other transaction involving such securities and earn brokerage or other compensation or act as a market maker in the financial instruments of the company(ies)
discussed herein or act as an advisor or lender/borrower to such company(ies) or may have any other potential conflict of interests with respect to any recommendation and other related information and opinions.; however the
same shall have no bearing whatsoever on the specific recommendations made by the analyst(s), as the recommendations made by the analyst(s) are completely independent of the views of the affiliates of MOSt even though
there might exist an inherent conflict of interest in some of the stocks mentioned in the research report
Reports based on technical and derivative analysis center on studying charts company's price movement, outstanding positions and trading volume, as opposed to focusing on a company's fundamentals and, as such, may not
match with a report on a company's fundamental analysis. In addition MOST has different business segments / Divisions with independent research separated by Chinese walls catering to different set of customers having various
objectives, risk profiles, investment horizon, etc, and therefore may at times have different contrary views on stocks sectors and markets.
Unauthorized disclosure, use, dissemination or copying (either whole or partial) of this information, is prohibited. The person accessing this information specifically agrees to exempt MOSt or any of its affiliates or employees from,
any and all responsibility/liability arising from such misuse and agrees not to hold MOSt or any of its affiliates or employees responsible for any such misuse and further agrees to hold MOSt or any of its affiliates or employees free
and harmless from all losses, costs, damages, expenses that may be suffered by the person accessing this information due to any errors and delays. The information contained herein is based on publicly available data or other
sources believed to be reliable. Any statements contained in this report attributed to a third party represent MOSt’s interpretation of the data, information and/or opinions provided by that third party either publicly or through a
subscription service, and such use and interpretation have not been reviewed by the third party. This Report is not intended to be a complete statement or summary of the securities, markets or developments referred to in the
document. While we would endeavor to update the information herein on reasonable basis, MOSt and/or its affiliates are under no obligation to update the information. Also there may be regulatory, compliance, or other reasons
that may prevent MOSt and/or its affiliates from doing so. MOSt or any of its affiliates or employees shall not be in any way responsible and liable for any loss or damage that may arise to any person from any inadvertent error in
the information contained in this report. MOSt or any of its affiliates or employees do not provide, at any time, any express or implied warranty of any kind, regarding any matter pertaining to this report, including without limitation
the implied warranties of merchantability, fitness for a particular purpose, and non-infringement. The recipients of this report should rely on their own investigations.
This report is intended for distribution to institutional investors. Recipients who are not institutional investors should seek advice of their independent financial advisor prior to taking any investment decision based on this report or
for any necessary explanation of its contents.
Most and it’s associates may have managed or co-managed public offering of securities, may have received compensation for investment banking or merchant banking or brokerage services, may have received any compensation
for products or services other than investment banking or merchant banking or brokerage services from the subject company in the past 12 months.
Most and it’s associates have not received any compensation or other benefits from the subject company or third party in connection with the research report.
Subject Company may have been a client of Most or its associates during twelve months preceding the date of distribution of the research report
MOSt and/or its affiliates and/or employees may have interests/positions, financial or otherwise of over 1 % at the end of the month immediately preceding the date of publication of the research in the securities mentioned in this
report. To enhance transparency, MOSt has incorporated a Disclosure of Interest Statement in this document. This should, however, not be treated as endorsement of the views expressed in the report.
Motilal Oswal Securities Limited is registered as a Research Analyst under SEBI (Research Analyst) Regulations, 2014. SEBI Reg. No. INH000000412
Pending Regulatory inspections against Motilal Oswal Securities Limited:
SEBI pursuant to a complaint from client Shri C.R. Mohanraj alleging unauthorized trading, issued a letter dated 29th April 2014 to MOSL notifying appointment of an Adjudicating Officer as per SEBI regulations to hold inquiry and
adjudge violation of SEBI Regulations; MOSL replied to the Show Cause Notice whereby SEBI granted us an opportunity of Inspection of Documents. Since all the documents requested by us were not covered we have requested
to SEBI vide our letter dated June 23, 2015 to provide pending list of documents for inspection.
List of associate companies of Motilal Oswal Securities Limited -
Click here to access detailed report
Analyst Certification
The views expressed in this research report accurately reflect the personal views of the analyst(s) about the subject securities or issues, and no part of the compensation of the research analyst(s) was, is, or will be directly or
indirectly related to the specific recommendations and views expressed by research analyst(s) in this report. The research analysts, strategists, or research associates principally responsible for preparation of MOSt research
receive compensation based upon various factors, including quality of research, investor client feedback, stock picking, competitive factors and firm revenues
Disclosure of Interest Statement
Analyst ownership of the stock
Served as an officer, director or employee -
TATA CONSULTANCY
No
No
A graph of daily closing prices of securities is available at www.nseindia.com and http://economictimes.indiatimes.com/markets/stocks/stock-quotes
Regional Disclosures (outside India)
This report is not directed or intended for distribution to or use by any person or entity resident in a state, country or any jurisdiction, where such distribution, publication, availability or use would be contrary to law, regulation or
which would subject MOSt & its group companies to registration or licensing requirements within such jurisdictions.
For Hong Kong:
This report is distributed in Hong Kong by Motilal Oswal capital Markets (Hong Kong) Private Limited, a licensed corporation (CE AYY-301) licensed and regulated by the Hong Kong Securities and Futures
Commission (SFC) pursuant to the Securities and Futures Ordinance (Chapter 571 of the Laws of Hong Kong) “SFO”. As per SEBI (Research Analyst Regulations) 2014 Motilal Oswal Securities (SEBI Reg No. INH000000412)
has an agreement with Motilal Oswal capital Markets (Hong Kong) Private Limited for distribution of research report in Kong Kong. This report is intended for distribution only to “Professional Investors” as defined in Part I of
Schedule 1 to SFO. Any investment or investment activity to which this document relates is only available to professional investor and will be engaged only with professional investors.” Nothing here is an offer or solicitation of
these securities, products and services in any jurisdiction where their offer or sale is not qualified or exempt from registration. The Indian Analyst(s) who compile this report is/are not located in Hong Kong & are not conducting
Research Analysis in Hong Kong.
For U.S.
Motilal Oswal Securities Limited (MOSL) is not a registered broker - dealer under the U.S. Securities Exchange Act of 1934, as amended (the"1934 act") and under applicable state laws in the United States. In addition MOSL is
not a registered investment adviser under the U.S. Investment Advisers Act of 1940, as amended (the "Advisers Act" and together with the 1934 Act, the "Acts), and under applicable state laws in the United States. Accordingly, in
the absence of specific exemption under the Acts, any brokerage and investment services provided by MOSL, including the products and services described herein are not available to or intended for U.S. persons.
This report is intended for distribution only to "Major Institutional Investors" as defined by Rule 15a-6(b)(4) of the Exchange Act and interpretations thereof by SEC (henceforth referred to as "major institutional investors"). This
document must not be acted on or relied on by persons who are not major institutional investors. Any investment or investment activity to which this document relates is only available to major institutional investors and will be
engaged in only with major institutional investors. In reliance on the exemption from registration provided by Rule 15a-6 of the U.S. Securities Exchange Act of 1934, as amended (the "Exchange Act") and interpretations thereof by
the U.S. Securities and Exchange Commission ("SEC") in order to conduct business with Institutional Investors based in the U.S., MOSL has entered into a chaperoning agreement with a U.S. registered broker-dealer, Motilal
Oswal Securities International Private Limited. ("MOSIPL"). Any business interaction pursuant to this report will have to be executed within the provisions of this chaperoning agreement.
The Research Analysts contributing to the report may not be registered /qualified as research analyst with FINRA. Such research analyst may not be associated persons of the U.S. registered broker-dealer, MOSIPL, and
therefore, may not be subject to NASD rule 2711 and NYSE Rule 472 restrictions on communication with a subject company, public appearances and trading securities held by a research analyst account.
For Singapore
Motilal Oswal Capital Markets Singapore Pte Limited is acting as an exempt financial advisor under section 23(1)(f) of the Financial Advisers Act(FAA) read with regulation 17(1)(d) of the Financial Advisors Regulations and is a
subsidiary of Motilal Oswal Securities Limited in India. This research is distributed in Singapore by Motilal Oswal Capital Markets Singapore Pte Limited and it is only directed in Singapore to accredited investors, as defined in the
Financial Advisers Regulations and the Securities and Futures Act (Chapter 289), as amended from time to time.
In respect of any matter arising from or in connection with the research you could contact the following representatives of Motilal Oswal Capital Markets Singapore Pte Limited:
Varun Kumar
Varun.kumar@motilaloswal.com
Contact : (+65) 68189232
Office Address:21 (Suite 31),16 Collyer Quay,Singapore 04931
Motilal Oswal Securities Ltd
12 January 2017
Motilal Oswal Tower, Level 9, Sayani Road, Prabhadevi, Mumbai 400 025
Phone: +91 22 3982 5500 E-mail: reports@motilaloswal.com
14