18 January 2017
Market snapshot
Equities - India
Close
Chg .%
Sensex
27,236
-0.2
Nifty-50
8,398
-0.2
Nifty-M 100
15,243
0.0
Equities-Global
Close
Chg .%
S&P 500
2,268
-0.3
Nasdaq
9,355
0.7
FTSE 100
7,220
-1.5
DAX
11,540
-0.1
Hang Seng
9,702
0.4
Nikkei 225
18,814
-1.5
Commodities
Close
Chg .%
Brent (US$/Bbl)
56
1.5
Gold ($/OZ)
1,217
1.2
Cu (US$/MT)
5,731
-1.9
Almn (US$/MT)
1,802
0.3
Currency
Close
Chg .%
USD/INR
68.0
-0.2
USD/EUR
1.1
1.1
USD/JPY
112.6
-1.4
YIELD (%)
Close 1MChg
10 Yrs G-Sec
6.4
0.0
10 Yrs AAA Corp
7.5
0.0
Flows (USD b)
17-Jan
MTD
FIIs
0.0
-0.5
DIIs
-0.1
0.3
Volumes (INRb) 17-Jan MTD*
Cash
202
203
F&O
3,537
3,474
Note: YTD is calendar year, *Avg
YTD.%
2.3
2.6
6.2
YTD.%
1.3
1.1
1.1
0.5
3.3
-1.6
YTD.%
0.8
5.6
3.8
5.8
YTD.%
0.1
1.9
-3.7
YTDchg
-0.1
-0.1
CY16
2.9
5.3
CY16*
220
3,447
Today’s top research ideas
Shriram City Union Finance (INITIATING COVERAGE): The
Quintessential NBFC; Tapping the untapped market
SCUF is a diversified NBFC with strong expertise in low ticket size and high growth
products like MSME and 2W lending. At INR0.5m, the average MSME ticket size of
the company is significantly lower than business loans of other banks/NBFCs.
Banks find it economically infeasible to cater to this segment with such small ticket
loans, resulting in modest competition for SCUF. SCUF is the country’s largest two-
wheeler financier by volumes, disbursing ~75,000 loans a month. While AUM grew
at 42% CAGR over FY05-13, growth was badly hit due to wind-down of the gold loan
portfolio and a sluggish rural economy. However, with the necessary infrastructure
in place as well as improving credit demand, we expect SCUF to record 19% AUM
CAGR over FY16-19E driven by strong growth in MSME and personal loans.
With robust capitalization (Tier I of 23%+), improving return ratios (3.7% ROA,
16.8% ROE by FY19E) and robust AUM CAGR, we expect stock to deliver 35% return
over next 12 months. Buy with a target price of INR2,500 (2.5x FY19E BVPS).
Research covered
Cos/Sector
Shriram City Union Fin.
NIIT Technologies
Dewan Housing
LIC Housing Finance
AVIATION
Results Expectation
Key Highlights
The Quintessential NBFC; Tapping the untapped market
Stellar cash generation; Offset by patchy growth trajectory
Temporary impact from demonetization; cost of funds down sharply
Growth continues to be driven by the non-core businesses
Dec-16 domestic air passenger growth at 23.4% YoY;
KPIT Technology
Piping hot news
Tax breather for foreign investors
Quote of the day
In a commodity business, it’s very hard to
Foreign portfolio investors (FPI) can now breathe easy with the Income Tax (I-
be smarter than your dumbest
T) Department on Tuesday putting in abeyance its controversial circular on
competitor.
taxing India-dedicated funds. Experts said clarity was necessary on the issue at
the earliest so that FPIs were certain.
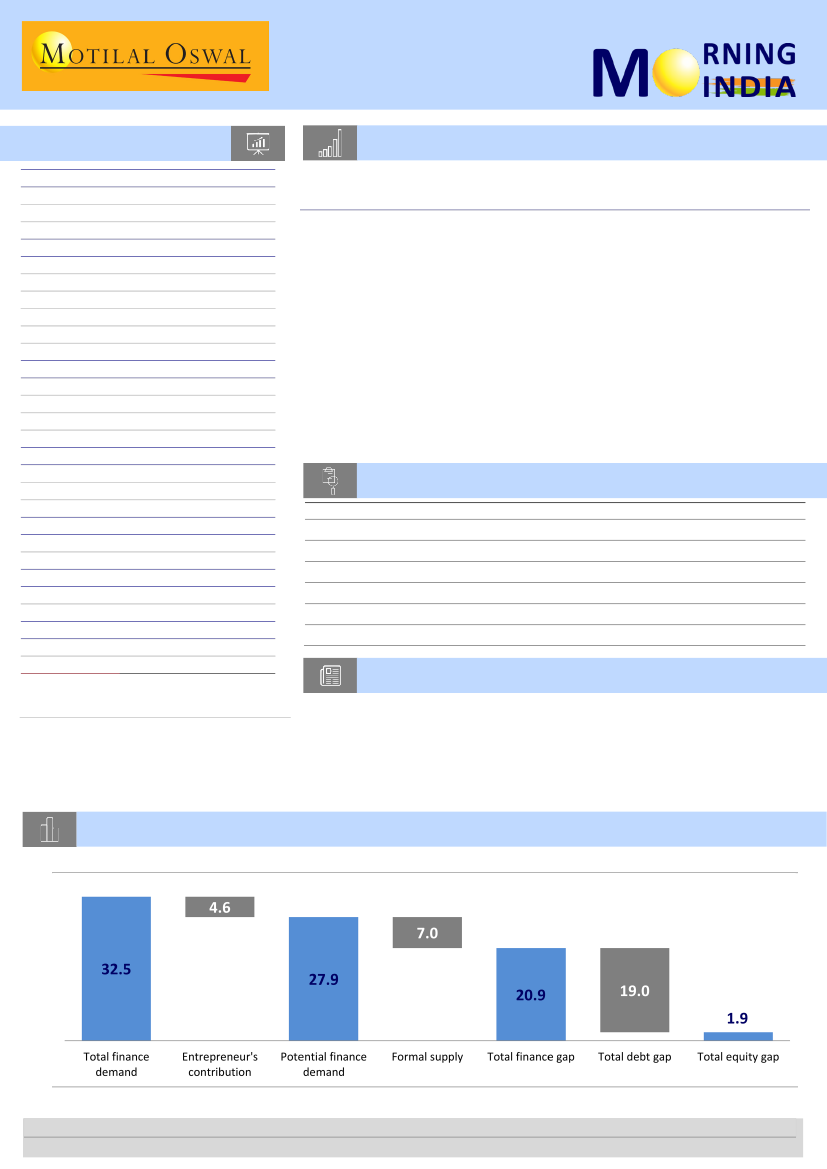
Chart of the Day: SCUF - MSME sector lacks sufficient access to formal financing (INR t)
Overall finance gap in the MSME sector (INR t)
Research Team (Gautam.Duggad@MotilalOswal.com)
Motilal Oswal research is available on www.motilaloswal.com/Institutional-Equities, Bloomberg, Thomson Reuters, Factset and S&P Capital.
Investors are advised to refer through important disclosures made at the last page of the Research Report.

In the news today
Kindly click on numbers for the detailed news link
1
Kolkata-based fast-moving
consumer goods company Emami
plans to increase the portfolio of
its new Rosscare brand from 80 to
200 products in the next 18
months. These products, which
will be sold by its pharmacy chain
Frank Ross, will not directly
compete with Emami’s…
2
No stay on Fortis stake sale plan yet
The battle between the Singh brothers of Fortis and Japanese pharma
company Daiichi Sankyo has reached a stalemate for now. The Japanese
firm had sought a stay on plans by billionaire brothers Malvinder and
Shivinder Singh to sell over 26 per cent stake in Fortis, a move that has
been in the offing for a few months now. The Delhi High Court, which is
considering a case filed by the latter, seeking payment of penalties by the
brothers as determined by a Singapore Tribunal, however, has not given
relief to Daiichi for now. The next hearing of the case is scheduled on
January 23.
Emami bets big on Rosscare
brand
3
Domestic airlines fly 24% more
passengers in Dec
Domestic airlines flew 95.52 lakh
passengers in December last year
an increase of almost 24 per cent
over the 77.09 lakh passengers
carried in December 2015. The
latest data released by the
Directorate General of Civil
Aviation shows that IndiGo flew
38.48 lakh passengers in
December last year retaining its
position
4
The outlook for the Indian
banking sector, especially for
public sector banks (PSBs),
remains challenging given their
weak asset quality, consequent
impact on internal capital
generation and increasing capital
requirements under Basel-III
regulations, said credit rating
agency ICRA. Private banks,
however…
Outlook for public sector
banks challenging: ICRA
5
Along with a likely 2-percentage-
point cut in the corporate tax rate
in the FY18 Budget, the
government may also make a
similar reduction in minimum
alternative tax (MAT) rate to keep
the differential tax treatment
intact for zero-tax firms, sources
said, reports Prasanta Sahu in
New Delhi. Also, there could be
some change in MAT rules for
computation of book profits (on
which the tax is applied) in view
of the implementation of new
accounting standard — Ind-AS —
by a large number of firms from
April 1, they said.
Arun Jaitley may cut MAT
along with corporate tax
6
Maruti Suzuki India Ltd executives
have traded in their baggy, navy
blue suits for slim-fit black suits or
smart casuals. Some have shed
weight. The hair is neatly
trimmed. Some were gamely
learning to tap their feet when
Deejay Axwell of Swedish House
Mafia fame…
7
Ministry pushes for India-
made steel only for govt infra
projects
Maruti Suzuki spends Rs2,000
crore on Nexa dealerships in
image makeover bid
Concerned over the anemic
growth in steel consumption,
steel minister Birender Singh
urged all concerned ministries to
use India-made steel only for
infrastructure and construction
projects of the government…
18 January 2017
2

Shriram City Union Finance
BSE Sensex
27,288
S&P CNX
8,413
Initiating Coverage | Sector: Financials
CMP: INR1,849
TP: INR2,500 (+35%)
Buy
The Quintessential NBFC
Tapping the untapped market
Stock Info
Bloomberg
Equity Shares (m)
52-Week Range (INR)
1, 6, 12 Rel. Per (%)
M.Cap. (INR b)
M.Cap. (USD b)
12M Avg Val (INR M)
Free float (%)
SCUF IN
65.9
2650 / 1337
3/2/18
117.3
1.8
98
66.2
Financial Snapshot (INR b)
Y/E March
2017E 2018E
NII
27.9 32.8
PPP
16.3 19.4
PAT
6.6
8.2
EPS (INR)
101
125
EPS Gr. (%)
25
24
BV/Sh. (INR)
766
869
RoA (%)
3.3
3.6
RoE (%)
13.9 15.3
Payout (%)
19
17
Valuations
P/E (x)
18.4 14.8
P/BV (x)
2.4
2.1
Div. Yield (%)
0.9
1.0
Shriram City Union Finance (SCUF) is a diversified NBFC with strong expertise in
low-ticket-size and high-growth products like micro, small and medium enterprise
(MSME) and two-wheeler (2W) lending.
SCUF’s key strengths are a) a large customer base with long-term relationships
directly or through group companies, b) strong local knowledge and ability to
appraise businesses dealing in cash (requires strong on-the-ground knowledge)
and c) robust recovery mechanism.
With strong capitalization (Tier I of 23%+), improving return ratios (3.7% RoA,
16.8% RoE by FY19E) and robust AUM CAGR of 19% over FY16-19E, the stock
should deliver 35% return over next 12 months, in our view. We initiate coverage
on SCUF with a Buy rating and a target price of INR2,500.
2019E
39.9
24.1
10.4
157
26
1000
3.7
16.8
17
11.8
1.8
1.2
A sustainable model to tap an untapped market
Loan appraisals/collections for businesses largely dealing in cash require strong
on-the-ground knowledge. NBFCs like SUCF are well placed to capture this
segment with their local knowledge, cost-efficient business model and robust
recovery mechanism. SCUF also relies on the large pool of Shriram Chits’
customers to grow its business and gain information on customer
credit/repayment history. With significant opportunities in place, we expect
SCUF to deliver AUM CAGR of 19% over FY16-19E.
MSME – Banking on high volume and low ticket size
MSME financing accounts for more than half of SCUF’s loan book, with the
company targeting customers with credit requirement below INR2.5m.
At
INR0.5m, the average loan ticket size of the company is significantly lower
than the ticket size of business loans (LAP) of other NBFCs.
Around 85% of the
book is backed by property collateral, mostly self-occupied residential. Apart
from robust growth opportunities in this segment, strong collateral also ensures
healthy asset quality and lower loss given default.
Shareholding pattern (%)
As On
Sep-16 Jun-16 Sep-15
Promoter
33.8
33.8
33.8
DII
5.8
2.0
2.3
FII
17.5
16.1
15.1
Others
43.0
48.1
48.8
FII Includes depository receipts
Shriram City Union Finance
The Quintessential NBFC
Market leader in 2W financing
SCUF has significant presence in 2W financing (~18% of its loan book).
With a
network of 6,000 dealers, SCUF is India’s largest 2W financier by volumes,
disbursing ~75,000 loans a month.
It usually commences business in a new
geography with 2W financing, which, in our view, is an apt strategy given that it
is a mass market product. Here, it mostly targets self-employed customers who
find it difficult (due to tedious paper work) to secure finance from banks. This
helps SCUF on two fronts: (1) to gain foothold in a new territory and (2) to
understand credit behavior of the self-employed segment in the region.
Piran Engineer
+
91 22 3980 4393
Piran.Engineer@motilaloswal.com
Please click here for Video Link
18 January 2017
3

Stock Performance (1-year)
Temporary blip due to demonetization
Over last two months, cash flow issues (due to cash crunch post demonetization)
and moderation in economic activities impacted growth for SCUF. We see this as a
temporary blip as the cash situation at the ground level is improving rapidly.
Demand for credit in the target customer base remains high, and most of the loans
are for income generation. Hence, beyond a temporary blip, we do not see any
significant impact on medium- to long-term growth and asset quality.
Strong earnings CAGR of 25% over FY16-19E
With strong capitalization and capacity in place, SCUF is expected to record AUM
CAGR of 19% over FY16-19E. Also, with strong pricing power in the target customer
segment, falling interest rates should be beneficial for margins. Robust growth
would also drive operating leverage (expect cost-to-average AUM to decline to 5.4%
in FY19 from 5.8% in FY16). While NPA recognition transition to 90dpd would
increase GNPLs in the interim, we expect net credit losses to remain unchanged.
With margins improvement, operating leverage and higher leverage on equity, RoE
should approach 17% by FY19. We expect earnings CAGR of 25% over FY16-19E.
Improving return ratio, strong growth; Initiating with Buy
With a large employee base of ~25,000 and branches totaling ~1,000, SCUF has built
the infrastructure to support its AUM growth. Also, strong capitalization (Tier 1 of
23%+) would ensure dilution-free growth for the company. RoAs/RoEs are expected
to improve to 3.7%+/17%+ by FY19E. We value the company at 2.5x FY19E BV based
on Residual Income model. Our key assumptions are Rf of 7.0%, CoE of 13.5% and a
terminal growth rate of 5%. The stock has corrected ~20% since 8 November 2016.
We thus initiate coverage with a
Buy rating and a target price of INR2,500.
Exhibit 1: Valuation comparison
FY17E
Shriram City Union Finance
3.3
Shriram Transport Finance
2.2
Bajaj Finance
3.3
Mahindra & Mahindra Finance
1.9
Cholamandalam Investment & Finance 2.4
RoA
FY18E
3.6
2.5
3.3
2.0
2.5
FY19E
3.7
2.7
3.4
2.0
2.6
FY17E
13.9
13.4
21.1
11.3
18.1
RoE
FY18E
15.3
15.4
22.8
11.9
19.0
FY19E
16.8
16.6
25.4
12.0
20.3
FY17E
2.4
1.9
5.5
2.4
3.5
P/B
FY18E
2.1
1.7
4.5
2.2
2.9
FY19E
1.8
1.5
3.6
2.0
2.5
FY17E
18.4
15.2
28.3
22.4
20.7
P/E
FY18E
14.8
11.8
21.8
19.4
16.7
FY19E
11.8
9.6
15.9
17.6
13.1
Source: Company, MOSL
18 January 2017
4

NIIT Technologies
BSE SENSEX
27,236
Bloomberg
Equity Shares (m)
M.Cap.(INRb)/(USDb)
52-Week Range (INR)
1, 6, 12 Rel. Per (%)
Avg Val, INRm
Free float (%)
S&P CNX
8,398
NITEC IN
61
26.1 / 0.4
Offset by patchy growth trajectory
588 / 370
Ramp-downs and seasonality:
NIIT Technologies’ (NITEC) revenue declined
-5/-9/-31
0.6% QoQ to USD103m (in line), but increased 0.6% QoQ CC. While seasonal
117
weakness played out as usual, growth was bogged down by ramp-down in a
69.3
17 January 2017
3QFY17 Results Update | Sector: Technology
CMP: INR416
TP: INR470(+13%)
Stellar cash generation
Neutral
Financials & Valuations (INR b)
2016
2017E
Y/E Mar
26.8
27.7
Net Sales
4.7
4.6
EBITDA
2.8
2.7
PAT
45.7
38.2
EPS (INR)
143.7
-16.4
Gr. (%)
259.8
280.1
BV/Sh (INR)
19.0
14.2
RoE (%)
18.6
15.8
RoCE (%)
9.1
10.8
P/E (x)
1.6
1.5
P/BV (x)
2018E
30.6
5.1
3.0
49.3
28.9
316.2
16.5
15.3
8.4
1.3
Estimate change
TP change
Rating change
large Travel account. Top client issues/project completions have resulted in
sporadic growth over last few quarters. Increase in GIS revenue, contributing
1pp to growth, led to in-line revenue performance.
Better outlook for 4Q:
Revenue growth and profitability are expected to
improve in 4Q, led by pick-up in new deal wins. Although deal wins have
gained pace LTM (+19% YoY), the progress is not being reflected in the
executable order book, which has grown merely by 3% YoY to USD311m.
Following strong EBITDA margin increase of 70bp QoQ to 16.9% in 3QFY17,
NITEC is on track to achieve its end-FY17 margin guidance of 17.5%.
Improved cash generation:
Cash generation has improved significantly. Net
cash addition in 3QFY17 stood at INR1b (166% of PAT). This has been largely
led by improvement in DSO to 69 in 3QFY17 (from 73 in 2QFY17 and 90 in
3QFY16), and lower organic capex requirements on the back of completion
of the Greater Noida campus.
Attractive valuations; momentum yet to pick up:
With cash forming 22% of
market cap, FCF yield of 10/11% and dividend yield of 2.7/2.9% for
FY18/19E, we believe valuations provide ample support at current levels.
However, with growth trends, deal wins and order book failing to improve
materially versus the past, we keep our stance unchanged. Valuing the stock
at 9x FY19 earnings, we maintain
Neutral
with a target of INR470.
18 January 2017
5

18 January 2017
3QFY17 Results Update | Sector:
Financials
Dewan Housing
BSE SENSEX
27,236
Bloomberg
Equity Shares (m)
M.Cap. (INR b) / (USD b)
52-Week Range (INR)
1, 6, 12 Rel. Per (%)
Avg Val (INR m)
Free float (%)
S&P CNX
8,398
DEWH IN
291.8
83.2/1.2
337 / 141
15/32/30
582
60.7
CMP: INR285
TP: INR405 (+42%)
Buy
Temporary impact from demonetization; cost of funds down sharply
Financials & Valuation (INR Billion)
Y/E MAR
2016 2017E 2018E
NII
PPP
Adj. PAT
EPS (INR)
EPS Gr. (%)
BV (INR)
RoAA (%)
RoE (%)
Payout (%)
Valuations
P/E (x)
P/BV (x)
P/ABV (x)
Div. Yield (%)
14.8
12.8
7.3
25.0
17.2
172
1.2
15.1
46.1
11.4
1.7
1.7
7.0
17.7
15.8
9.2
30.7
22.9
202
1.2
16.6
23.2
9.3
1.4
1.4
2.2
20.7
18.7
10.7
35.6
16.0
228
1.2
16.6
23.2
8.0
1.2
1.2
Valuation and view:
DEWH continues to capitalize on its mortgage lending expertise in an
2.5
Dewan Housing Finance (DEWH) reported 3QFY17 PAT of INR2.45b (+32% YoY,
+5% QoQ), 7% ahead of our estimates, largely on account of better-than-expected
NII growth (21% YoY, 5% QoQ).
AUM growth of 19% YoY was impressive, especially considering the impact of
demonetization on its core self-employed segment (40% of its customer base).
Management is confident of achieving 17-19% AUM growth in FY17.
Disbursements rose 10% YoY, primarily driven by home loans and LAP (+15% YoY).
Disbursements in project financing were flat-to-marginally negative YoY.
Margins expanded 2bp QoQ and 17bp YoY to 3.07%. DEWH benefited from lower
cost of funds (-23bp QoQ, -57bp YTD), which was driven by improving liability mix
(reduction in bank borrowings and increase in market borrowings) and decline in
cost of bank borrowings (-42bp QoQ, -69bp YTD). DEWH raised INR140b (22% of
overall borrowing) last quarter from capital markets at much lower cost than bank
borrowings, the full impact of which was felt in 3QFY17. We believe there is
upside to margins from further reduction in cost of bank borrowings.
Management continues to focus on cost control. Operating expenses rose 9% YoY,
despite NII growth of 21% YoY. Advertising expenses are down 30% YTD, while
legal and professional expenses are flat. As a result, C/I ratio (calculated) declined
more than 300bp YoY to 26.4%. We believe that C/I ratio will continue trending
down toward the stated target of 21-21.5%. Sustained improvement in C/I ratio
will be a key trigger to stock re-rating, in our view.
underpenetrated market. We expect AUM growth to remain higher than industry average at
18-19%+. Margins will improve further with higher share of builder loans and lower cost of
funds. Also, management’s continued focus on lowering operating cost should improve
investor sentiment and lead to re-rating. We largely maintain our estimates for FY17/18. We
use RI model with Rf of 7.0%, CoE of 14.2% and terminal growth rate of 4.5% to value the
stock.
Buy
with a TP of INR405 (1.6x FY19E BV).
18 January 2017
6

17 January 2017
Update | Sector: Financials
LIC Housing Finance
BSE SENSEX
27,288
Bloomberg
Equity Shares (m)
M.Cap.(INR b)/(USD b)
52-Week Range (INR)
1, 6, 12 Rel. Per (%)
Avg Val. (INR m)
Free float (%)
S&P CNX
8,413
LICHF IN
505.0
263.1/3.9
624 / 389
-5/8/4
1231
59.7
CMP: INR540
TP: INR693 (+33%)
Buy
LIC Housing Finance (LICHF) exhibited a mixed performance in 3QFY17.
Growth continues to be driven by the non-core businesses, i.e. LAP and
project financing. This also helped improve incremental spreads. Core
home loan growth remains sluggish. However, with a higher focus on
customer retention, pre-payments rates have slowed over past few
quarters. Key takeaways from the conference call:
Home loan enquiries improve toward the end of 3Q
Financials & Valuations (INR b)
2016 2017E 2018E
Y/E Mar
NII
PPP
Adj. PAT
Adj. EPS (INR)
EPS Gr. (%)
BV/Sh (INR)
RoAA (%)
RoE (%)
Payout (%)
Valuations
P/E (x)
P/BV (x)
Div. Yield (%)
29.4
27.1
16.6
32.9
23.3
181.1
1.5
19.6
19.4
15.8
2.9
1.1
36.4
32.4
19.3
38.3
16.5
211.8
1.5
19.5
19.7
13.6
2.5
1.3
41.7
37.4
23.7
46.9
22.3
249.4
1.6
20.3
19.7
11.1
2.1
1.5
Management commented that strong growth in disbursements in builder loans
(INR11b, up 3x YoY) was due to the large undisbursed sanction pipeline. The
pipeline now stands at INR20b. However, management mentioned that run-
rate disbursements will continue remaining in the range of INR4-5b per
quarter.
Home loan enquiries improved toward end-December. It also launched a new
product in the affordable housing segment. Management expects growth to
pick up in 4QFY17.
While new home loans are being disbursed at 8.6-8.7% (non-annualized), LICHF
offers an option to existing borrowers to reset interest rates to around 9%
(non-annualized). Note that this option earlier was reset to 9.9% (50bp above
interest rate at that time). Current yield on home loan book is 9.6% (non-
annualized).
Incremental CoF was 7.83% in 3QFY17. LICHF is able to borrow at sub-7.6%.
While CoF on existing book is 8.8%, it expects ~10bp reduction per quarter led
by refinancing of NCDs. NCDs worth INR120b are maturing in FY18 and
INR155b in FY19.
~80% of home loan disbursements in 3Q were on pure floating rate.
Incremental yields in each segment are as follows – home loans: 8.5-8.7%, LAP:
10.5-11% and project financing: 13-14% (all non-annualized).
Fee income fell sharply led by :
a)
high base due to one-off in 3QFY16 and
b)
large discounts on processing fees in October to home loan borrowers.
However, LICHF has hiked its fees in January across most products.
The company incurred wage arrears of INR75m during the quarter.
Valuation and view:
Despite being the second largest HFC, LICHF manages to
grow ~15% YoY. On the margins front, the company is poised to reap
significant benefits of falling GSec yields. We believe LICHF should sustain ~1.8-
2% incremental spreads over next few quarters. We value LICHF based on RI
model, with Rf of 7.25%, CoE of 12.8%, terminal growth rate of 5% and
terminal RoE of 15.9%. Maintain
Buy
with a TP of INR693 (2.4x FY19E BV).
Falling yields cushioned by declining CoF; Margins to remain steady
Other highlights
18 January 2017
7

Sector Update | 17 January 2017
Aviation
Domestic passenger growth
(YoY %)
25.6
Dec-16 domestic air passenger growth at 23.4% YoY
Domestic load factor at 88.7%; IndiGo’s domestic ASK/RPK share highest
24.0 23.5 23.3 22.6 23.4
Domestic air passengers in India grew +23.4% YoY to 9.5m in Dec-16 (v/s +20.2% in
Dec-15; +23.1% in 3QFY17). However, we believe this strong growth would be at the
cost of yields, as seen in headline fares.
While Dec-16 ASK growth stood at 21.4% YoY (v/s +21.1% in 3QFY17 and +19% in
2QFY17), RPKs increased 23.8% YoY (v/s +22.8% in 3QFY17 and +24.5% in 2QFY17).
Load factor stood at 88.7% in Dec-16 (v/s 84.8% in 3QFY17 and 83% in 2QFY17).
Domestic air passenger growth at 23.4% YoY in Dec-16
Industry load factor (%)
88.7
84.1
82.2
82.5
81.1
84.5
India’s domestic air passengers grew 23.4% YoY to 9.5m in Dec-16 (v/s 8.9m in
Nov-16). Domestic passenger growth exceeded 20% for the 14
th
straight month.
IndiGo’s passenger growth stood at +40.3% YoY in Dec-16 (v/s +43% in 3QFY17
and +39% in 2QFY17).
SpiceJet’s domestic passenger volumes grew +24% YoY in Dec-16 (v/s +22% in
3QFY17).
Go Air’s domestic passenger volumes grew +22.1% YoY in Dec-16 (v/s +19% in
3QFY17).
Passenger volume growth YoY for other airlines was as follows: Jet Airway:
+5.3% YoY (v/s +1.3% in 3QFY17); Air India: +3.8% (v/s +2% in 3QFY17).
IndiGo’s passenger market share stood at ~40.4% in Dec-16 (v/s +41.8% in
3QFY17 and +40% in 2QFY17).
Jet Airways’ market share remained below 20% for the ninth consecutive month
at 17.8%. It had market share of above 20% since Jul-14.
Air India’s market share stood at 13.8% (v/s 13.1% in 3QFY17).
SpiceJet’s market share stood at 12.7% (v/s 12.8% in 3QFY17).
GoAir’s market share stood at 8.2% in Dec-16; it seems to have stabilized in the
8-9% range.
IndiGo’s domestic ASKs increased 32.9% YoY (v/s +34% in 3QFY17); its domestic
ASK share stood at the highest at 41.6%.
SpiceJet’s domestic ASKs grew +23.7% YoY (v/s +19.8% in 3QFY17).
Domestic ASKs of GoAir grew 16.4% YoY (v/s +13.5% in 3QFY17) and those of Jet
grew 4.9% YoY (v/s +3% in 3QFY17).
IndiGo’s RPKs grew +37.3% YoY (v/s +38.9% in 3QFY17), with the highest market
share of 42.9% in Dec-16.
SpiceJet’s domestic RPKs grew +25.8% YoY (v/s +21.2% in 3QFY17), with a
market share of 12.1% in Dec-16.
GoAir’s domestic RPKs grew +22% YoY (v/s +18.7% in 3QFY17), with a market
share of 8.1% in Dec-16.
Jet’s RPK growth stood at +8% YoY, followed by Air India (+2.4% YoY).
81.0
IndiGo’s passenger market share remains highest at ~40% in Dec-16
Passenger market share (%)
Nov-16
IndiGo
Jet
AI
SpiceJet
GoAir
Others
17.3
17.8
12.8
13.8
12.8
12.7
8.0
8.2
6.9
7.1
Dec-16
42.2
40.4
Domestic ASKs increase +21.4% YoY in Dec-16 (v/s +21.1% in 3QFY17)
Domestic RPKs rise 23.8% YoY in Dec-16 (v/s +22.8% in 3QFY17)
18 January 2017
8

Industry load factors
stood at 88.7% (v/s 84.8% in 3QFY17)
SpiceJet’s load factor stood at 93.7% in Dec-16 (v/s 92.7% in 3QFY17); had 90%+
load factor for last 20 months.
IndiGo’s load factor stood at 91.4% (v/s 88.1% in 3QFY17).
GoAir’s load factor stood at 90.7% (v/s 87.5% in 3QFY17).
Jet reported load factor at 86% (v/s 80.2% in 3QFY17).
Air India reported load factor at 81.3% (v/s 75.9% in 3QFY17).
Exhibit 2: Domestic passengers grew +23.4% YoY to 9.5m in Dec-16
Total Domestic Passengers (millions)
7.6
7.8
8.6 8.5 8.2
7.9
8.3 8.6
7.9
9.5
8.9
Dec-16 was 12 consecutive
month of above 20%
growth
th
5.9
5.2
5.2
5.6 5.7
7.3
7.1 6.7
6.6
6.2 6.3
5.8 5.8
7.0 7.7
6.5 6.6 6.7
5.9 6.4
6.0
7.4
Source: DGCA, MOSL
Exhibit 3: Double-digit passenger growth since Aug-14
Domestic passenger growth (YoY %)
Domestic passenger volumes
grew +23.4% YoY in Dec-16
23.4
25.4
24.8
25.6 23.523.3
22.8 22.9 24.6
24.3
20.2
20.0
21.5
19.5
18.5
17.7
14.4
22.6
22.6
20.0
20.8 24.0
9.1
18.8
16.2
17.2
5.3
14.4
10.5
2.7
1.7
6.4
0.8
29.9
29.8
Source: DGCA, MOSL
Exhibit 4: Airline-wise passenger growth (YoY %)
Passenger growth
YoY (%)
80
Total
Air India
IndiGo
SpiceJet
Jet Airways
GoAir
Passenger volumes up
+40.3% YoY for IndiGo in
Dec-16.
50
20
-10
-40
Source: DGCA, MOSL
18 January 2017
9

December 2016 Results Preview | Sector: Technology
KPIT Technologies
Bloomberg
Equity Shares (m)
M.Cap. (INR b) /(USD b)
52-Week Range (INR)
1, 6, 12 Rel. Per (%)
Financial Snapshot (INR b)
Y/E Mar
Sales
EBITDA
PAT
EPS (INR)
EPS Gr. (%)
BV/Sh. (INR)
RoE (%)
RoCE (%)
Payout (%)
Valuations
P/E (x)
P/BV (x)
EV/EBITDA (x)
Div yld (%)
9.7
2.0
5.4
1.1
10.8
1.7
5.1
1.5
8.8
1.4
3.6
1.5
8.4
1.2
2.9
1.5
2016
32.2
4.4
3.0
14.1
19.0
69.0
21.0
24.3
10.6
2017E 2018E 2019E
33.2
4.0
2.5
12.6
-10.3
80.8
16.9
18.9
15.8
36.9
5.0
3.1
15.6
23.7
96.4
17.6
20.9
12.8
40.4
5.3
3.2
16.3
4.0
112.7
15.5
19.2
12.3
KPIT IN
200.5
34/1
197 / 108
2/-7/-23
CMP: INR137
TP: INR170 (+24%)
Neutral
Revenue performance has been lumpy for KPIT, with guidance of a
better 2H compared to 1H.
We expect the impact of seasonal weakness, and pressure in ERP
implementation to continue weighing on overall performance,
further accentuated by cross-currency movements.
We expect revenue of US123m, down 0.6% QoQ in USD terms and
up 0.5% QoQ CC.
Cost optimization methods, operational efficiency improvement
and increased fresher hiring are likely to lead to margin expansion
(+100bp QoQ) post the cumulative 515bp decline in EBITDA margin
over the last two quarters.
Our PAT estimate is INR619m, up 10.2% QoQ because of the
compounding of higher margins and other income.
KPIT trades at 10.8x FY17E and 8.8x FY18E earnings. Maintain
Neutral.
Key issues to watch for
Growth in IES, Engineering services and top client.
Margin performance and guidance.
Commentary on deal wins across segments.
Plan to recoup revenue growth and profitability.
(INR m)
FY17E
492
0.3
33,191
2.9
30.0
17.9
12.1
9.7
326
146
25.4
2,527
-10.2
12.6
11,724
69.9
43.1
Quarterly Performance (Indian GAAP)
Y/E March
1Q
Revenue (USD m)
118
QoQ (%)
-3.3
Revenue (INR m)
7,583
YoY (%)
9.9
GPM (%)
28.2
SGA (%)
18.7
EBITDA Margin (%)
9.5
EBIT Margin (%)
7.3
Other income
106
Interest
47
ETR (%)
27.9
PAT
444
QoQ (%)
-11.8
YoY (%)
-12.6
EPS (INR)
2.2
Headcount
10,839
Util excl. trainees (%)
66.4
Offshore rev. (%)
44.7
Fixed Price (%)
26.2
E: MOSL Estimates
FY16
2Q
3Q
125
123
5.3
-1.0
8,123
8,130
7.2
4.3
32.1
32.9
18.1
18.3
14.0
14.6
11.9
12.3
86
36
44
35
25.4
26.5
751
735
69.1
-2.1
6.3
12.5
3.8
3.7
10,659
10,559
69.7
69.1
44.9
41.2
27.1
29.1
4Q
124
0.7
8,407
10.2
35.3
19.1
16.2
13.6
20
25
13.4
885
20.4
75.7
4.4
10,910
70.2
42.1
26.4
1Q
120
-3.5
8,032
5.9
28.9
18.3
10.7
8.3
116
56
24.3
551
-37.8
24.0
2.8
11,288
68.1
41.5
28.5
FY17E
2Q
3QE
123
123
3.0
-0.6
8,310
8,283
2.3
1.9
29.5
30.0
18.5
18.0
11.0
12.0
8.6
9.5
49
86
14
39
25.1
26.0
562
619
2.0
10.2
-25.2
-15.8
2.8
3.1
11,666
11,565
69.2
70.8
43.3
43.8
28.0
FY16
4QE
126
2.7
8,566
1.9
31.3
16.7
14.6
12.1
75
37
26.0
796
28.6
-10.1
4.0
11,724
71.5
43.7
490
0.3
32,243
7.8
32.2
18.6
13.5
11.4
248
152
22.8
2,815
18.7
14.1
10,910
68.8
43.2
18 January 2017
10

In conversation
1. CAPA: FY17 is not going to be as good as fy18 for aviation;
Kapil Kaul, CEO - South Asia
The traffic growth will be around 20% for the next 2 years on the back of 3 years
of 20% traffic growth. See traffic growth for next 2-3 decades.
Concerned about the infrastructure capacity along with a possible situation of
over-supply. Low cost environment is another area of concern.
FY18 would not be as good as FY17; might see second quarter of FY18 giving a
signal of tougher times with the environment becoming difficult.
India has a fleet pipeline of 900 planes over a period of 10 years. The near term
challenge is largely due to 320 Neos which are creating a few operational issues.
2. MARICO: Three months delay in gst rollout will help trade and
industry; Harsh Mariwala, Chairman
Actual rates and classification of goods into various brackets could be a cause of
friction between centre and states when GST is launched on July 1.
The way the centre is moving it is very determined that the GST is implemented
as soon as possible; hopeful that the dual control issues will get resolved.
Three month delay will help the trade and industry cope up with the change
rather than prove detrimental to the same.
18 January 2017
11

From the think tank
1. An assault on rbi’s autonomy. by Yoginder K Alagh
I initially intended to write this piece as a critique of the treatment given to the
Reserve Bank of India by the executive authorities. However, a more productive
approach would be to work on the mechanism of strengthening institutions and
their interface with each other. Friends such as YV Reddy and Bimal Jalan have
already expressed their criticism in civil, technical, and compelling language. The
relationship between a central bank and the executive is at best rocky, needing
considerable skills and patience in working on the policy strategies to be
followed.
2. Paradigm shift. by The Businessline
Last week’s press conference of US President-elect Donald Trump was less than
reassuring for those who believed that the responsibilities of office would have
a moderating effect on his extreme positions. Trump came across as aggressive,
in stark contrast to Barack Obama, who, in his farewell speech, yet again tried to
warn the country against divisive currents. The reasons are, however, not far to
seek. Perhaps never before has a US president-elect been a subject of such
controversy. Trump is under fire for influencing the elections through Russian
intelligence and cosying up to Russian President Vladimir Putin.
3. Mergers and acquisitions: no need to regulate the non-
compete fee. by Lalit Kumar
It is usual to find non-compete provision in mergers and acquisitions deals. This
provision imposes restriction on parties to carry on similar business. The
provision prevents joint venture partners from competing in similar business as
that of their joint venture entity. This restriction could be during the term of the
venture and even after its termination. The provision could also prevent the
selling shareholder who exits a company to not compete in the business of that
company. Non-compete is valid in law for the duration of the joint venture but
not thereafter.
4. A time of change for the oil industry. by Livemint
The oil industry is a fickle beast. The inflation-adjusted price of a barrel of crude
took off in 2004 after decades of stability and rose to stratospheric heights.
Record highs were touched, then outstripped; by mid-2008, prices had risen to
over $147, with a further rise predicted. It never came. The financial crisis
brought uncertainty and yo-yoing prices—and ultimately, the penury of the last
two years. It’s a history worth keeping in mind when considering the clutch of
recent reports—from Barclays, the US government’s energy information
administration (EIA) and energy consultancy Wood Mackenzie, among others—
that point to the world’s major oil and gas companies having turned a corner.
18 January 2017
12

5. Clarity begins at home. by Nilanjan Banik
Earlier this month, while addressing party workers at the national executive
meeting of the Bharatiya Janata Party, Prime Minis ter Narendra Modi
underscored the need to bring transparency in political funding. With more than
90% of the banned currency notes back in the system, questions persist on the
efficacy of the government's demonetisation move. Everyone is looking at the
next course of action to fight black money. The PM has argued that the poor and
financially weaker sections supported the withdrawal of old high-denomination
currency notes.The common perception is that rich and corrupt politicians
disproportionately corner all the money -most of it in black.
International
6. Pacific conflict looms between america and china. by Gideon
Rachman
The questions surrounding Donald Trump’s relationship with Russia are lurid
and compelling. But they are distracting from a more important and more
dangerous story: the growing signs that the Trump administration is heading for
a clash with China — one that could even lead to military conflict. The latest
indication came last week at the confirmation hearings of Rex Tillerson, who is
Mr Trump’s nominee to be US secretary of state. Mr Tillerson signalled a
significant hardening in the US attitude to the artificial islands that Beijing has
been building in the South China Sea.
18 January 2017
13

Click excel icon
for detailed
valuation guide
CMP
(INR)
Valuation snapshot
ROE (%)
FY16 FY17E FY18E
25.8
20.9
33.2
18.7
19.4
35.8
22.4
6.1
14.0
43.6
15.4
4.5
19.9
18.3
24.1
18.8
17.1
11.8
13.3
6.0
18.3
11.3
16.6
6.6
10.9
11.2
9.3
19.9
13.7
Loss
Loss
Loss
Loss
5.5
1.2
Loss
7.6
7.0
-2.7
21.1
24.9
15.1
31.5
21.4
27.1
19.6
10.8
11.4
15.1
18.3
21.9
23.5
29.4
15.9
19.7
40.3
19.9
10.9
13.6
39.0
14.5
7.7
23.1
11.5
26.5
17.0
5.8
10.9
11.2
9.3
18.7
10.4
7.5
15.5
Loss
13.6
12.4
9.7
20.9
11.9
8.1
Loss
5.6
1.4
10.4
4.8
4.8
7.5
5.2
4.7
21.1
28.6
15.8
31.0
19.5
26.0
19.1
11.4
11.3
18.4
16.8
23.6
26.5
30.9
20.0
24.5
41.6
21.1
16.3
14.7
37.5
14.5
10.3
23.1
15.9
29.5
19.2
9.7
11.8
9.7
10.4
19.5
10.0
9.5
16.4
12.4
14.5
12.3
10.0
22.6
13.6
11.5
7.5
7.4
5.8
10.1
5.1
7.0
9.2
9.5
7.0
22.8
17.7
17.2
32.1
18.9
29.3
19.5
12.2
11.9
19.0
16.2
Company
Automobiles
Amara Raja
Ashok Ley.
Bajaj Auto
Bharat Forge
Bosch
Eicher Mot.
Endurance Tech.
Escorts
Exide Ind
Hero Moto
M&M
Mahindra CIE
Maruti Suzuki
Tata Motors
TVS Motor
Aggregate
Banks - Private
Axis Bank
DCB Bank
Equitas Hold.
Federal Bank
HDFC Bank
ICICI Bank
IDFC Bank
IndusInd
J&K Bank
Kotak Mah. Bk
RBL Bank
South Indian
Yes Bank
Aggregate
Banks - PSU
BOB
BOI
Canara
IDBI Bk
Indian Bk
OBC
PNB
SBI
Union Bk
Aggregate
NBFCs
Bajaj Fin.
Bharat Fin.
Dewan Hsg.
GRUH Fin.
HDFC
Indiabulls Hsg
LIC Hsg Fin
Manappuram
M&M Fin.
Muthoot Fin
PFC
Reco
Buy
Buy
Buy
Buy
Neutral
Buy
Buy
Buy
Buy
Neutral
Buy
Not Rated
Buy
Buy
Buy
TP
% Upside
EPS (INR)
P/E (x)
P/B (x)
(INR) Downside FY16 FY17E FY18E FY17E FY18E FY17E FY18E
17
7
13
17
-2
29
23
12
13
-4
24
13
17
7
28.7
3.9
131.8
28.1
483.3
492.9
20.7
11.1
7.3
158.3
53.6
4.2
177.6
36.9
9.1
29.7
4.9
133.0
25.8
507.6
608.7
22.6
20.7
7.8
169.5
66.0
6.2
252.2
29.0
11.9
38.8
6.6
158.9
36.4
657.7
869.5
28.7
34.2
9.4
192.2
83.7
9.7
306.9
45.6
16.5
30.6
17.4
20.5
36.3
42.2
36.6
25.8
17.7
23.3
18.5
18.3
31.9
22.5
18.0
31.8
22.7
37.5
16.5
25.9
16.7
21.4
15.6
20.7
25.1
Loss
27.3
31.4
7.7
17.8
22.4
12.9
Loss
10.5
48.2
8.1
6.0
15.4
26.1
8.9
16.5
28.7
15.8
9.8
43.2
36.2
11.2
14.2
20.9
23.4
11.3
5.7
23.4
13.1
17.2
25.7
32.6
25.6
20.3
10.7
19.3
16.3
14.4
20.3
18.5
11.5
23.0
17.2
20.9
13.6
22.7
13.8
17.7
14.9
15.4
20.7
4.3
22.4
25.8
6.9
13.8
17.6
8.5
6.2
7.5
11.4
7.7
5.4
9.9
11.0
4.6
10.6
22.1
17.5
7.8
34.5
33.7
8.9
11.9
18.6
20.3
9.7
5.4
6.1
3.8
5.7
5.5
8.8
12.8
4.7
1.9
3.2
6.6
1.5
2.2
5.2
2.0
7.7
3.9
2.1
1.7
2.3
1.5
3.7
1.3
1.5
3.6
0.6
3.5
3.3
0.7
3.4
2.7
1.0
0.5
0.6
0.7
0.8
0.3
0.7
1.1
0.5
0.8
5.6
3.4
1.4
12.3
5.1
2.8
2.5
2.3
2.5
2.0
0.9
5.0
3.2
5.0
4.8
7.3
9.1
3.9
1.6
2.8
5.6
1.3
2.0
4.3
1.7
6.1
3.3
2.0
1.5
2.1
1.4
3.2
1.2
1.4
3.2
0.5
3.0
3.0
0.7
2.9
2.4
0.9
0.5
0.5
0.6
0.8
0.3
0.7
1.0
0.4
0.7
4.6
2.8
1.3
10.1
4.6
2.5
2.2
2.2
2.3
1.7
0.8
906
1,061
86
92
2,730 3,097
935
1,096
21,421 20,937
22,285 28,755
584
715
366
410
182
205
3,132 3,011
1,206 1,497
198
-
5,667 6,415
523
613
379
407
Neutral
486
Neutral
117
Buy
155
Buy
76
Buy
1,238
Buy
268
Under Review 65
Buy
1,214
Neutral
62
Buy
726
Buy
382
Neutral
21
Buy
1,325
519
134
240
106
1,510
332
-
1,430
68
932
450
21
1,500
7
14
55
40
22
24
18
9
28
18
-1
13
34.5
6.8
6.2
2.8
48.6
16.7
38.4
8.6
18.9
9.0
2.5
60.4
13.0
7.1
6.0
4.5
57.9
17.2
3.1
48.4
Loss
26.6
12.2
2.8
74.5
23.2
8.6
6.8
5.5
69.8
18.0
4.2
58.7
14.5
32.4
14.8
3.1
95.8
Buy
Neutral
Under Review
Neutral
Buy
Neutral
Buy
Buy
Buy
159
115
284
74
247
116
130
256
139
223
125
-
49
314
108
172
338
168
40
9
-33
27
-7
32
32
21
Loss
Loss
Loss
Loss
14.8
4.9
Loss
15.7
19.7
12.3
Loss
27.2
1.5
30.4
19.3
8.5
9.8
15.6
18.8
18.5
37.9
6.4
31.9
21.3
13.2
23.3
30.4
Buy
Buy
Buy
Neutral
Buy
Buy
Buy
Not Rated
Buy
Buy
Neutral
912
674
285
339
1,243
777
532
80
296
310
137
1,096
893
413
348
1,553
1,015
693
-
339
373
117
20
33
45
3
25
31
30
14
20
-15
23.9
23.8
25.0
6.7
30.6
55.7
32.9
3.5
11.9
20.3
23.8
31.8
42.7
29.0
7.9
34.3
69.5
37.6
3.8
12.7
27.5
24.0
41.3
38.5
36.8
9.8
36.9
87.7
44.7
4.3
14.6
32.0
25.5
18 January 2017
14

Click excel icon
for detailed
valuation guide
CMP
(INR)
666
144
1,852
955
Valuation snapshot
FY16
17.0
21.0
12.3
12.2
17.8
11.1
15.6
Loss
52.1
3.0
24.9
5.9
19.0
27.9
13.5
9.9
14.2
11.8
20.2
Loss
12.5
9.7
15.3
7.6
8.3
7.2
5.9
5.5
9.2
3.9
6.3
0.3
19.5
6.2
0.7
12.2
11.0
9.3
34.7
55.9
67.9
33.3
43.4
23.4
30.8
82.4
29.3
9.1
36.9
40.9
46.0
19.5
ROE (%)
FY17E
15.7
18.8
13.9
13.4
17.5
11.4
19.2
2.9
80.9
4.2
22.0
-6.8
16.9
19.3
16.0
10.9
14.5
9.2
18.6
Loss
12.2
13.2
15.4
10.4
5.9
7.2
8.5
7.6
12.9
7.0
10.9
4.2
20.6
Loss
4.5
20.2
11.9
11.6
32.4
42.2
56.3
27.8
34.1
22.3
25.1
68.7
28.4
15.0
32.8
35.9
42.9
10.8
FY18E
19.6
19.5
15.3
15.4
17.9
14.5
18.3
3.9
74.2
6.0
23.1
20.1
23.3
18.6
16.7
11.7
14.6
12.6
19.0
Loss
12.5
15.4
16.4
12.0
7.1
10.9
9.8
10.3
13.3
7.4
13.7
10.5
18.6
6.8
16.0
24.3
15.0
12.9
32.0
38.8
63.2
27.9
33.6
22.7
24.7
79.1
28.3
16.5
33.1
39.2
42.7
10.5
Company
Repco Home
REC
STF
Aggregate
Capital Goods
ABB
Bharat Elec.
BHEL
CG Cons. Elec.
Crompton Grv.
Cummins
GE T&D
Havells
Inox Wind
K E C Intl
L&T
Pennar Eng.
Siemens
Solar Ind
Suzlon Energy
Thermax
Va Tech Wab.
Voltas
Aggregate
Cement
Ambuja Cem.
ACC
Birla Corp.
Dalmia Bharat
Grasim Inds.
India Cem
J K Cements
JK Lakshmi Ce
Ramco Cem
Orient Cem
Prism Cem
Shree Cem
Ultratech
Aggregate
Consumer
Asian Paints
Britannia
Colgate
Dabur
Emami
Godrej Cons.
GSK Cons.
HUL
ITC
Jyothy Lab
Marico
Nestle
Page Inds
Parag Milk
Pidilite Ind.
Reco
Buy
Neutral
Buy
Buy
TP
% Upside
EPS (INR)
P/E (x)
P/B (x)
(INR) Downside FY16 FY17E FY18E FY17E FY18E FY17E FY18E
842
26
24.0 25.7
37.7
25.9
17.7
3.8
3.2
134
-7
28.5 29.4
35.3
4.9
4.1
0.9
0.7
2,500
35
80.4 100.7 124.8 18.4
14.8
2.4
2.1
1,282
34
53.3 63.5
82.3
15.0
11.6
1.9
1.7
14.6
12.5
2.6
2.2
1,125
1,600
110
180
48
836
320
390
200
160
1,600
-
1,260
690
-
706
620
370
2
6
-14
10
-26
0
3
4
7
7
11
7
-2
-16
26
7
15.8
56.9
Loss
1.9
2.1
27.2
3.0
7.8
20.7
7.4
44.7
8.8
16.9
18.4
Loss
23.5
16.3
11.7
18.2
60.0
3.9
3.7
0.6
26.0
5.6
7.5
17.5
10.1
53.6
10.5
17.0
19.3
Loss
24.8
25.2
11.8
26.9
69.9
5.5
5.1
1.9
30.2
10.7
11.3
20.0
12.1
62.2
12.4
25.3
22.9
0.6
27.6
32.6
14.0
60.6
25.2
32.4
43.8
116.6
32.3
55.1
49.9
10.7
14.8
27.0
14.2
69.0
36.7
Loss
34.0
19.4
29.2
31.4
37.6
40.8
20.6
51.2
11.1
15.0
26.5
78.0
20.7
Loss
100.0
37.9
35.8
27.8
47.6
42.7
40.8
38.7
42.4
43.1
31.7
42.6
30.1
48.0
43.1
52.7
56.8
37.9
40.9
21.7
23.3
31.8
35.1
27.8
29.2
33.0
9.4
12.4
23.3
12.0
46.3
30.9
27.8
30.5
15.0
24.5
25.1
30.8
27.2
15.6
34.7
9.5
12.7
19.2
30.2
19.3
37.7
25.4
25.7
25.1
21.0
42.4
36.7
33.3
32.7
34.3
36.2
28.0
37.5
26.3
40.7
35.5
42.3
44.9
27.5
6.9
4.5
0.9
29.3
0.9
6.7
6.2
8.4
1.9
2.2
2.8
2.1
6.3
6.4
Loss
4.0
2.5
4.3
3.3
1.6
2.9
1.6
3.8
1.4
1.1
2.8
3.2
3.9
2.7
4.4
7.0
4.0
3.2
14.5
16.1
21.9
9.9
12.6
8.9
7.4
29.5
8.0
7.0
12.8
17.9
24.4
3.0
5.9
4.0
0.9
19.8
0.9
6.1
5.6
7.7
1.6
1.9
2.6
1.8
5.8
5.5
Loss
3.7
2.2
3.8
3.0
1.5
3.0
1.5
3.4
1.2
1.0
2.5
3.1
3.3
2.5
3.8
5.6
3.5
2.7
12.7
12.8
20.4
8.4
10.6
7.6
6.5
29.7
7.0
6.5
10.9
15.4
19.2
2.7
Neutral
Buy
Sell
Buy
Sell
Neutral
Neutral
Buy
Neutral
Buy
Buy
Not Rated
Neutral
Neutral
Not Rated
Sell
Buy
Buy
1,103
1,514
128
164
65
839
311
373
188
149
1,446
149
1,173
707
16
842
491
344
Buy
Neutral
Buy
Buy
Under Review
Neutral
Buy
Buy
Buy
Buy
Buy
Buy
Buy
213
246
1,331 1,321
695
759
1,751 1,736
846
-
134
118
702
767
368
440
608
698
126
175
89
102
14,959 17,096
3,385 3,749
16
-1
9
-1
-12
9
19
15
39
14
14
11
5.5
5.7
32.0 32.6
20.4 33.8
21.5 34.2
48.3 76.1
4.4
8.9
14.5 26.4
0.4
4.7
23.4 29.4
3.0
Loss
0.1
0.9
201.1 394.3
79.3 94.6
6.9
48.9
44.5
50.4
88.7
10.6
36.5
12.2
31.5
3.3
3.5
582.0
134.8
Neutral
Buy
Buy
Neutral
Buy
Neutral
Neutral
Neutral
Buy
Neutral
Buy
Neutral
Buy
Neutral
960
1,020
3,011 3,380
909
1,200
277
300
1,049 1,240
1,583 1,655
5,000 5,465
841
900
252
290
346
360
257
300
5,883 6,410
14,044 17,100
266
285
6
12
32
8
18
5
9
7
15
4
17
9
22
7
18.7 20.2
70.1 70.6
22.3 22.3
7.1
7.2
25.2 24.7
33.2 36.8
167.1 157.7
19.0 19.7
7.7
8.4
4.1
7.2
5.6
6.0
119.9 111.5
208.6 247.4
6.7
7.0
22.6
82.1
27.2
8.5
30.6
43.8
178.8
22.4
9.6
8.5
7.2
139.2
312.7
9.7
18 January 2017
15

Click excel icon
for detailed
valuation guide
CMP
(INR)
628
6,727
121
827
2,080
Valuation snapshot
FY16
29.9
30.8
10.3
14.8
19.8
31.8
38.8
23.8
32.5
11.5
32.8
12.8
28.6
18.8
Loss
16.4
21.6
22.1
5.9
22.9
14.2
16.5
23.3
34.4
25.8
13.2
55.5
10.2
10.1
5.1
15.4
11.6
NM
22.6
Loss
Loss
21.9
7.7
24.7
18.7
0.1
23.4
27.0
18.2
11.6
20.7
Loss
Loss
5.4
15.9
ROE (%)
FY17E
27.6
27.7
7.3
14.5
20.3
29.3
25.1
23.9
29.9
12.2
23.9
11.2
26.7
10.6
Loss
20.4
20.5
29.6
9.0
22.8
17.8
20.3
22.2
26.4
23.8
13.3
50.5
8.6
8.3
12.4
16.7
11.3
43.2
25.7
Loss
Loss
19.6
5.8
20.7
10.4
Loss
25.3
29.4
16.8
17.3
22.5
Loss
14.9
7.1
12.8
FY18E
25.6
29.4
9.1
16.9
23.6
29.9
26.8
21.8
27.2
13.9
27.2
13.9
26.5
16.1
3.8
19.1
22.7
40.8
14.1
23.4
19.4
23.9
22.5
29.9
26.1
16.9
48.6
10.3
12.8
19.4
17.8
13.5
46.3
26.9
2.1
-6.1
18.0
6.7
20.6
16.4
23.5
27.6
30.7
20.8
18.1
22.6
Loss
19.6
8.7
14.2
Company
P&G Hygiene
Radico Khaitan
United Brew
United Spirits
Aggregate
Healthcare
Alembic Phar
Alkem Lab
Aurobindo
Biocon
Cadila
Cipla
Divis Lab
Dr Reddy’s
Fortis Health
Glenmark
Granules
GSK Pharma
IPCA Labs
Lupin
Sanofi India
Sun Pharma
Syngene Intl
Torrent Pharma
Aggregate
Logistics
Allcargo Logistics
Blue Dart
Concor
Gateway
Distriparks
Gati
Transport Corp.
Aggregate
Media
Dish TV
D B Corp
Den Net.
Hathway Cab.
Hind. Media
HT Media
Jagran Prak.
PVR
Siti Net.
Sun TV
Zee Ent.
Aggregate
Metals
Hindalco
Hind. Zinc
JSPL
JSW Steel
Nalco
NMDC
SAIL
Reco
Buy
Buy
Neutral
Buy
Buy
TP
% Upside
EPS (INR)
P/E (x)
P/B (x)
(INR) Downside FY16 FY17E FY18E FY17E FY18E FY17E FY18E
700
11
14.8 16.4
18.4
38.4
34.2
9.8
7.9
8,340
24
129.9 138.5 168.9 48.6
39.8
12.6
10.9
120
-1
6.9
5.3
7.1
22.9
17.1
1.6
1.5
1,065
29
11.1 12.3
16.4
67.0
50.6
9.2
8.0
2,620
26
16.7 27.8
45.7
74.9
45.6
13.8
10.7
38.9
33.3
11.4
9.9
640
1,800
1,050
750
450
525
975
3,000
240
990
160
3,150
540
1,825
5,200
925
-
1,750
6
8
49
-25
29
-10
32
1
28
12
43
16
-1
22
26
43
32
38.2 23.5
64.7 77.3
33.9 42.0
23.2 27.1
15.4 13.6
18.8 18.1
41.9 45.4
132.3 82.7
Loss
Loss
24.9 41.4
5.5
7.1
44.2 50.4
10.5 17.0
50.4 61.6
103.2 142.2
19.6 27.8
11.1 13.0
59.7 57.7
30.7
84.4
49.9
34.3
18.7
25.6
51.0
141.7
3.5
49.7
10.0
61.8
29.4
77.0
172.8
37.9
16.1
78.4
25.6
21.6
16.8
36.7
25.7
32.4
16.2
36.0
Loss
21.4
15.8
53.9
32.1
24.3
29.1
23.3
45.6
23.0
25.4
17.4
43.4
33.1
24.9
13.2
9.6
28.4
44.1
17.9
Loss
Loss
10.0
14.1
16.7
60.9
Loss
20.7
41.2
31.5
9.2
13.2
Loss
Loss
18.6
13.1
19.6
19.8
14.2
29.0
18.7
22.9
14.5
21.0
52.9
17.8
11.2
44.0
18.6
19.4
23.9
17.1
36.8
17.0
19.1
14.3
34.3
26.1
15.3
7.0
7.7
21.6
26.0
15.2
46.9
-47.1
9.0
11.2
14.7
34.6
13.7
17.4
27.2
21.8
7.7
11.2
Loss
10.0
14.3
13.2
5.9
4.7
4.4
4.5
5.7
3.6
4.1
3.7
2.2
4.4
2.8
16.0
2.8
5.1
5.2
4.5
9.2
5.6
6.0
2.6
19.3
2.8
2.0
2.0
1.5
3.2
Loss
4.3
1.0
2.8
1.8
0.8
3.2
6.1
3.9
5.2
9.3
5.3
1.5
2.8
0.4
2.1
1.3
1.9
4.7
4.0
3.4
4.0
4.6
3.2
3.6
3.2
1.9
3.4
2.3
17.9
2.5
4.1
4.6
3.7
7.5
4.6
5.0
2.3
14.7
2.6
1.9
1.8
1.3
2.9
9.8
3.9
1.0
3.0
1.5
0.7
2.8
5.3
2.6
4.8
7.5
4.5
1.3
2.3
0.5
1.8
1.2
1.8
Neutral
Neutral
Buy
Sell
Buy
Neutral
Neutral
Neutral
Buy
Neutral
Buy
Neutral
Neutral
Buy
Buy
Buy
Not Rated
Buy
602
1,669
706
995
350
587
737
2,977
187
884
112
2,716
547
1,497
4,131
648
594
1,329
Buy
Not Rated
Neutral
Buy
Not Rated
Not Rated
183
4,454
1,201
238
123
162
196
-
1,317
313
-
-
7
10
31
10.8
84.4
40.6
11.4
3.2
13.5
10.5
102.5
36.3
9.6
9.3
16.9
12.8
129.9
45.9
15.6
17.6
21.0
Buy
87
Buy
358
Neutral
87
Buy
37
Buy
269
Neutral
84
Buy
180
Buy
1,241
Buy
37
Under Review 526
Buy
480
115
450
75
47
360
85
215
1,429
45
-
590
33
26
-14
28
34
2
20
15
21
23
6.5
16.2
Loss
Loss
24.6
7.3
10.5
25.5
Loss
21.1
10.6
2.0
20.0
Loss
Loss
26.9
5.9
10.8
20.4
Loss
25.4
11.7
3.3
23.5
1.9
-0.8
29.7
7.5
12.2
35.8
2.7
30.3
17.7
Buy
Neutral
Neutral
Buy
Buy
Buy
171
284
77
187
69
143
234
282
88
195
73
162
37
-1
14
4
6
13
12.0
19.8
Loss
Loss
2.7
8.4
18.5
21.5
Loss
Loss
3.7
10.9
22.1
25.4
Loss
18.7
4.8
10.8
18 January 2017
16

Click excel icon
for detailed
valuation guide
CMP
(INR)
59
236
454
Valuation snapshot
ROE (%)
FY16 FY17E
Loss Loss
7.9
13.0
4.6
8.7
4.9
7.9
31.6
4.0
7.7
11.7
22.4
13.6
18.4
22.1
10.6
9.5
14.0
12.0
11.4
13.4
6.3
21.3
16.8
16.5
21.5
28.9
24.7
21.0
45.3
27.4
12.3
19.0
19.5
46.3
37.1
23.4
20.3
24.0
24.4
7.4
12.7
12.6
9.2
42.2
3.1
15.5
11.9
14.7
17.7
12.9
13.1
26.2
5.3
12.9
11.9
26.6
29.3
21.8
39.4
11.6
10.1
21.5
11.6
13.7
8.9
3.1
20.2
15.2
15.9
26.6
27.7
23.2
16.9
42.3
18.0
13.7
14.2
16.7
42.8
33.8
19.1
17.7
20.3
23.7
7.3
17.2
Loss
5.3
32.9
4.7
10.1
10.6
16.1
15.1
11.3
11.3
FY18E
Loss
14.8
28.3
10.2
22.7
4.6
13.2
13.5
19.7
20.8
19.8
28.4
13.1
13.1
24.7
11.4
13.3
15.3
8.8
19.7
16.7
17.8
25.5
27.5
22.5
17.6
36.8
22.0
16.3
16.6
19.2
41.7
31.1
19.3
18.5
22.8
22.8
5.3
16.6
Loss
2.1
37.7
6.3
5.8
11.9
16.6
16.3
15.2
13.4
Company
Vedanta
Tata Steel
Aggregate
Oil & Gas
BPCL
Cairn India
GAIL
Gujarat St. Pet.
HPCL
IOC
IGL
MRPL
Oil India
ONGC
PLNG
Reliance Ind.
Aggregate
Retail
Jubilant Food
Shopper's Stop
Titan Co.
Aggregate
Technology
Cyient
HCL Tech.
Hexaware
Infosys
KPIT Tech
L&T Infotech
Mindtree
Mphasis
NIIT Tech
Persistent Sys
Tata Elxsi
TCS
Tech Mah
Wipro
Zensar Tech
Aggregate
Telecom
Bharti Airtel
Bharti Infratel
Idea Cellular
Aggregate
Utiltites
Coal India
CESC
JSW Energy
NTPC
Power Grid
Aggregate
Others
Arvind
Bata India
Castrol India
Reco
Sell
Neutral
Sell
TP
% Upside
EPS (INR)
P/E (x)
P/B (x)
(INR) Downside FY16 FY17E FY18E FY17E FY18E FY17E FY18E
28
-53
Loss
Loss
Loss
Loss
Loss
0.7
0.8
250
6
10.8 21.4
27.3
11.1
8.7
1.2
1.1
321
-29
7.7
11.7
37.1
38.8
12.3
3.9
3.1
18.7
13.5
1.5
1.4
756
-
429
168
543
464
898
115
376
223
411
1,057
14
-4
16
13
32
-2
5
10
14
14
2
55.2
11.4
18.1
7.9
38.0
20.3
29.7
7.4
29.1
13.6
11.2
93.0
55.5
14.0
28.7
8.8
52.7
49.3
42.0
17.0
33.3
14.8
19.8
99.2
56.4
12.5
36.4
11.0
45.1
40.1
43.7
15.8
40.3
20.0
26.9
107.9
12.0
18.7
15.5
16.5
9.2
7.1
21.9
6.5
10.3
13.2
18.2
10.5
11.0
77.4
95.6
41.2
45.6
14.7
14.8
14.7
15.2
11.4
12.4
18.2
12.3
10.8
17.3
23.6
16.8
15.8
14.0
13.0
15.7
25.6
20.5
Loss
37.2
19.1
14.1
11.8
14.8
13.9
9.3
25.1
43.4
11.8
21.0
12.2
13.2
10.7
8.8
21.0
6.9
8.5
9.7
13.4
9.6
10.4
44.9
31.8
36.9
37.4
11.5
13.2
12.9
14.1
9.2
11.6
13.4
9.6
8.3
13.9
19.3
15.7
13.5
12.2
9.8
14.2
33.7
19.8
Loss
90.4
16.7
9.6
19.7
12.3
11.8
8.0
15.5
33.2
2.9
1.0
1.7
1.9
2.2
2.0
4.5
2.2
1.2
1.3
3.6
1.2
1.5
6.9
2.9
7.8
6.9
2.3
3.6
3.9
3.2
1.8
4.7
3.2
1.6
1.5
2.7
9.0
5.3
2.8
2.4
2.5
3.7
1.8
3.6
1.1
2.0
6.3
1.5
1.2
1.5
2.1
1.4
2.5
4.7
2.5
1.0
1.6
1.7
2.0
1.7
3.9
1.8
1.1
1.3
3.0
1.0
1.4
6.9
2.6
6.8
6.2
2.0
3.1
3.3
2.9
1.5
3.9
2.8
1.5
1.3
2.6
7.3
4.5
2.4
2.1
2.1
3.2
1.7
3.2
1.3
1.9
6.3
1.4
1.1
1.4
1.8
1.3
2.2
4.3
Buy
Neutral
Neutral
Neutral
Buy
Buy
Neutral
Buy
Buy
Neutral
Buy
Neutral
665
262
445
145
483
351
918
110
342
195
361
1,041
Neutral
Neutral
Neutral
833
291
360
900
300
360
8
3
0
15.0
5.8
8.0
10.8
3.0
8.7
18.5
9.2
9.8
Buy
Buy
Neutral
Buy
Neutral
Buy
Neutral
Neutral
Neutral
Neutral
Buy
Neutral
Buy
Neutral
Buy
489
836
200
956
144
679
485
519
416
627
1,423
2,278
487
481
906
600
960
230
1,250
170
800
520
560
450
700
1,619
2,550
550
560
1,250
23
15
15
31
18
18
7
8
8
12
14
12
13
17
38
30.7 33.4
40.1 56.7
12.9 13.6
59.0 62.8
14.1 12.6
52.4 54.9
35.9 26.6
34.5 42.2
45.7 38.6
37.2 36.2
49.7 60.2
123.2 135.2
35.1 30.9
36.1 34.3
68.2 69.5
42.7
63.2
15.5
67.8
15.6
58.6
36.2
54.0
50.2
45.0
73.6
145.3
36.0
39.5
92.5
Buy
Buy
Sell
318
353
69
410
435
65
29
23
-6
11.9
11.8
8.6
12.4
17.2
Loss
9.4
17.8
Loss
Neutral
Buy
Buy
Buy
Buy
307
680
64
176
198
297
940
85
199
209
-3
38
32
13
6
22.6
27.8
7.6
12.3
11.5
16.1
48.4
5.4
11.9
14.2
18.4
70.7
3.3
14.3
16.8
Buy
Buy
372
472
444
483
19
2
14.0
11.2
14.8
10.9
24.0
14.2
18 January 2017
17

Click excel icon
for detailed
valuation guide
CMP
Reco
(INR)
Buy
395
Buy
183
Under Review 324
Buy
2,950
Buy
237
Neutral
877
Buy
180
Buy
865
Sell
228
Under Review 95
Buy
370
Buy
471
Buy
427
Buy
555
Buy
1,180
Buy
2,255
Buy
821
Buy
1,656
Buy
318
Sell
1,179
Neutral
5,872
Neutral
163
Valuation snapshot
ROE (%)
FY17E
118.4
18.2
18.5
15.1
29.5
105.1
37.8
12.0
6.2
8.6
15.1
17.1
33.1
8.6
11.4
28.8
31.7
16.2
13.5
56.8
16.6
26.1
FY18E
108.8
29.8
20.4
20.7
33.7
110.2
31.2
12.3
11.8
11.7
15.7
20.0
31.0
9.9
15.2
35.9
30.1
18.2
16.6
65.0
19.7
27.4
Company
Century Ply.
Coromandel Intl
Dynamatic Tech
Eveready Inds.
Interglobe
Indo Count
Info Edge
Inox Leisure
Jain Irrigation
Just Dial
Kaveri Seed
Kitex Garm.
Manpasand
MCX
Monsanto
PI Inds.
SRF
S H Kelkar
Symphony
TTK Prestige
V-Guard
Wonderla
TP
% Upside
EPS (INR)
P/E (x)
P/B (x)
(INR) Downside FY16 FY17E FY18E FY17E FY18E FY17E FY18E FY16
529
34
9.6
12.8
13.4
30.8
29.5
33.9
30.5 76.0
211
15
7.5
4.6
8.8
40.0
20.8
6.9
5.6
36.3
-
11.8 16.3
20.0
19.9
16.2
3.5
3.1
14.9
3,388
15
19.4 67.6 112.9 43.6
26.1
6.0
4.9
4.7
266
12
9.2
9.2
12.9
25.7
18.4
7.0
5.6
16.2
1,018
16
55.2 58.3
72.5
15.0
12.1
14.6
12.3 176.5
223
24
13.4 15.7
18.5
11.5
9.7
3.6
2.6
48.9
1,050
21
13.0 18.4
20.7
46.9
41.7
5.3
4.9
9.2
206
-10
8.4
4.1
8.6
55.4
26.6
3.5
3.1
14.9
-
2.2
5.5
7.6
17.1
12.5
1.5
1.4
4.0
426
15
20.4 15.6
18.5
23.6
20.0
3.4
2.9
21.1
489
4
24.9 23.1
28.8
20.4
16.3
3.4
3.1
20.7
631
48
23.6 29.3
35.1
14.6
12.2
4.3
3.4
35.5
761
37
10.1 14.9
23.8
37.2
23.4
2.7
2.5
11.4
1,400
19
23.4 28.3
40.8
41.7
28.9
4.6
4.2
3.5
2,706
20
60.1 68.4
87.2
33.0
25.9
9.6
9.0
26.4
959
17
22.1 31.3
38.4
26.2
21.4
7.4
5.7
29.2
1,915
16
73.7 81.0 105.0 20.4
15.8
3.2
2.7
17.0
338
6
5.5
7.5
10.1
42.6
31.4
5.5
4.9
12.6
1,053
-11
15.6 27.0
35.1
43.6
33.6
23.7
20.2 35.0
4,896
-17
100.7 107.8 139.9 54.5
42.0
54.5
42.0 17.2
179
10
3.7
4.5
5.8
36.0
28.2
8.6
7.0
26.3
18 January 2017
18

MOSL Universe stock performance
Company
Automobiles
Amara Raja
Ashok Ley.
Bajaj Auto
Bharat Forge
Bosch
Eicher Mot.
Endurance Tech.
Escorts
Exide Ind
Hero Moto
M&M
Mahindra CIE
Maruti Suzuki
Tata Motors
TVS Motor
Banks - Private
Axis Bank
DCB Bank
Equitas Hold.
Federal Bank
HDFC Bank
ICICI Bank
IDFC Bank
IndusInd
J&K Bank
Kotak Mah. Bk
RBL Bank
South Indian
Yes Bank
Banks - PSU
BOB
BOI
Canara
IDBI Bk
Indian Bk
OBC
PNB
SBI
Union Bk
NBFCs
Bajaj Fin.
Bharat Fin.
Dewan Hsg.
GRUH Fin.
HDFC
Indiabulls Hsg
LIC Hsg Fin
Manappuram
M&M Fin.
Muthoot Fin
PFC
Repco Home
REC
STF
Capital Goods
ABB
1 Day (%)
1.3
0.2
0.3
-0.2
0.5
-0.2
-0.2
1.6
-1.7
1.3
-0.6
1.0
-0.4
-0.6
-1.0
2.0
-3.1
2.3
1.1
-0.7
-0.3
1.2
-0.3
0.7
-0.7
1.5
-0.7
-0.4
-0.3
-0.6
2.0
-0.9
-0.1
0.0
1.5
0.2
0.6
-0.5
0.3
-1.0
2.9
-1.0
1.6
-1.5
1.9
3.3
2.6
-1.0
1.0
0.3
-0.6
-1.9
1M (%)
0.4
10.4
2.7
-3.6
6.4
2.4
2.0
16.7
3.7
0.1
2.4
7.2
9.3
10.7
0.7
2.9
8.9
0.1
10.1
4.9
5.0
1.3
12.0
-1.8
0.8
8.4
1.9
12.2
-0.3
1.2
-5.2
5.0
6.1
0.9
4.1
-3.2
1.2
7.3
5.1
17.9
5.4
-2.1
21.6
-3.5
19.0
11.6
15.1
9.2
26.7
11.3
12.5
4.2
12M (%)
11.5
0.9
16.9
17.9
19.9
36.7
171.5
35.0
29.1
2.5
-10.0
32.6
53.2
36.6
30.2
55.0
57.9
18.8
19.6
38.0
31.8
-10.7
7.4
16.1
99.9
26.3
22.1
58.0
20.9
165.7
10.9
41.4
38.6
21.8
52.7
35.5
41.3
40.6
8.2
17.1
13.9
187.4
31.0
70.0
60.2
9.9
47.0
24.9
8.7
Company
Bharat Elec.
BHEL
CG Cons. Elec.
Crompton Grv.
Cummins
GE T&D
Havells
Inox Wind
K E C Intl
L&T
Pennar Eng.
Siemens
Solar Ind
Suzlon Energy
Thermax
Va Tech Wab.
Voltas
Cement
Ambuja Cem.
ACC
Birla Corp.
Dalmia Bharat
Grasim Inds.
India Cem
J K Cements
JK Lakshmi Ce
Ramco Cem
Orient Cem
Prism Cem
Shree Cem
Ultratech
Consumer
Asian Paints
Britannia
Colgate
Dabur
Emami
Godrej Cons.
GSK Cons.
HUL
ITC
Jyothy Lab
Marico
Nestle
Page Inds
Parag Milk
Pidilite Ind.
P&G Hygiene
Radico Khaitan
United Brew
United Spirits
Healthcare
Alembic Phar
Alkem Lab
Aurobindo
Biocon
Cadila
1 Day (%)
-1.0
-0.5
1.4
0.4
-1.1
0.4
-2.1
3.1
-0.5
0.3
-2.9
-0.4
0.4
3.1
2.3
-0.8
-0.1
-0.1
-0.2
1.5
-0.4
-0.9
-0.9
0.1
0.1
0.8
-1.2
-0.3
1.6
1.5
2.7
1.8
-0.4
0.1
-2.3
1.3
-0.1
1.6
1.2
1.0
-0.4
-0.3
-0.3
-0.2
-1.1
-0.4
1.9
1.9
6.5
0.4
0.0
0.3
-0.3
0.2
1M (%)
4.7
4.2
13.8
10.1
2.6
0.1
15.8
-7.6
8.1
6.4
-5.8
4.1
3.5
8.7
2.1
4.4
7.9
5.2
2.7
13.5
17.6
3.4
20.7
2.5
8.2
15.9
1.2
5.5
6.1
6.5
6.6
4.1
-0.3
2.3
3.0
7.1
-2.0
2.8
11.2
-4.5
2.4
-3.2
0.7
0.4
3.4
-2.0
5.9
0.4
7.5
-3.3
3.9
2.2
1.7
-7.0
12M (%)
20.0
-6.3
7.2
-13.4
-26.2
33.4
-41.0
14.2
30.8
-5.8
10.8
5.3
-20.9
-2.7
-19.7
22.8
9.8
8.1
61.6
128.3
20.7
53.0
40.4
28.2
62.5
-13.4
16.5
54.8
29.3
9.2
5.3
-0.9
10.4
6.3
27.3
-15.8
4.5
20.4
18.1
14.2
5.1
11.3
12.9
21.5
15.5
-3.8
-22.5
-3.3
16.8
-13.3
98.2
13.5
18 January 2017
19

Company
Cipla
Divis Lab
Dr Reddy’s
Fortis Health
Glenmark
Granules
GSK Pharma
IPCA Labs
Lupin
Sanofi India
Sun Pharma
Syngene Intl
Torrent Pharma
Logistics
Allcargo Logistics
Blue Dart
Concor
Gateway Distriparks
Gati
Transport Corp.
Media
Dish TV
D B Corp
Den Net.
Hathway Cab.
Hind. Media
HT Media
Jagran Prak.
PVR
Siti Net.
Sun TV
Zee Ent.
Metals
Hindalco
Hind. Zinc
JSPL
JSW Steel
Nalco
NMDC
SAIL
Vedanta
Tata Steel
Oil & Gas
BPCL
Cairn India
GAIL
Gujarat St. Pet.
HPCL
IOC
IGL
MRPL
Oil India
ONGC
PLNG
Reliance Ind.
1 Day (%)
-0.1
-0.2
-0.2
-2.3
-0.8
3.2
-0.4
1.0
-0.8
-0.3
0.7
-1.1
0.0
0.5
0.4
0.2
1.7
1.5
2.4
-0.2
0.1
2.3
-1.5
0.4
2.0
-0.4
1.3
-1.7
-0.3
-0.2
-1.0
-0.3
-1.9
-1.4
-1.8
-0.8
0.5
-2.9
-0.9
-0.5
-2.4
-0.4
6.3
-1.3
-0.6
0.2
1.0
-0.5
-1.7
-0.7
-3.3
1M (%)
3.6
-36.1
-4.2
1.9
-4.9
-3.8
-0.2
0.1
1.9
-3.7
0.2
1.1
1.8
7.2
0.6
9.3
1.7
8.5
-0.9
4.2
0.9
26.5
4.0
-1.3
15.1
8.7
14.6
-0.9
6.6
8.6
0.4
1.3
6.0
15.4
11.4
12.2
13.3
2.5
9.7
9.8
2.2
7.3
-0.3
13.5
18.4
0.6
16.2
3.7
-3.4
-4.1
-1.5
12M (%)
-3.4
-31.6
1.4
7.2
6.5
2.1
-14.6
-11.1
-12.0
-1.6
-17.5
54.9
0.4
-1.3
-30.1
-1.4
-30.5
-7.5
1.4
-0.5
12.6
-3.8
-9.7
-4.9
1.9
15.8
57.4
1.4
39.5
19.5
137.8
104.8
20.8
91.4
91.0
66.4
39.9
224.1
97.6
42.4
119.1
32.5
3.9
63.6
64.6
66.4
66.4
28.2
33.2
43.1
-3.0
Company
Retail
Jubilant Food
Shopper's Stop
Titan Co.
Technology
Cyient
HCL Tech.
Hexaware
Infosys
KPIT Tech
L&T Infotech
Mindtree
Mphasis
NIIT Tech
Persistent Sys
Tata Elxsi
TCS
Tech Mah
Wipro
Zensar Tech
Telecom
Bharti Airtel
Bharti Infratel
Idea Cellular
Utiltites
Coal India
CESC
JSW Energy
NTPC
Power Grid
Others
Arvind
Bata India
Castrol India
Century Ply.
Coromandel Intl
Dynamatic Tech
Eveready Inds.
Interglobe
Indo Count
Info Edge
Inox Leisure
Jain Irrigation
Just Dial
Kaveri Seed
Kitex Garm.
Manpasand
MCX
Monsanto
PI Inds.
SRF
S H Kelkar
Symphony
TTK Prestige
V-Guard
Wonderla
1 Day (%)
-0.3
0.0
-0.6
-1.2
0.7
0.2
0.0
0.3
-0.1
0.1
-0.2
-2.2
1.0
0.6
0.8
0.0
-0.5
0.6
-0.1
-0.7
-1.1
-2.1
-1.2
-1.2
3.1
-0.8
-0.5
-0.9
-0.8
3.0
-0.5
1.0
0.4
0.5
-1.5
1.7
0.8
0.5
-0.8
3.6
3.2
-1.1
-0.5
0.1
0.3
1.6
-0.6
0.6
4.7
-0.3
-0.7
1M (%)
-0.7
0.7
11.8
-4.2
1.9
-2.8
-4.8
4.6
0.0
-3.2
-7.8
-2.3
2.3
-1.6
-0.2
2.1
3.7
-10.8
2.5
-0.8
-9.2
6.5
8.8
6.6
9.8
7.3
9.1
12.8
6.2
8.9
16.8
2.2
10.1
5.9
11.0
-0.5
2.7
10.8
-2.8
19.3
3.5
-1.8
-10.0
-0.5
1.2
9.8
11.6
-4.0
7.7
-4.9
-1.0
12M (%)
-32.8
-22.2
7.4
11.0
-0.1
-9.7
-16.2
-2.7
-36.9
12.8
-19.5
1.4
-20.3
0.6
-6.4
-11.6
-8.3
3.7
-9.1
-38.6
-3.5
50.3
-11.8
28.6
41.8
16.8
2.3
-8.3
14.8
93.8
41.6
-8.6
-25.5
-17.8
8.8
9.3
53.9
-53.4
44.9
-26.7
23.8
41.8
-3.5
25.0
37.0
29.8
11.4
35.6
82.7
-3.1
18 January 2017
20

THEMATIC/STRATEGY RESEARCH GALLERY

REPORT GALLERY
RECENT INITIATING COVERAGE REPORTS

DIFFERENTIATED PRODUCT GALLERY

Disclosures
This document has been prepared by Motilal Oswal Securities Limited (hereinafter referred to as Most) to provide information about the company (ies) and/sector(s), if any, covered in the report and may be distributed by it and/or its
affiliated company(ies). This report is for personal information of the selected recipient/s and does not construe to be any investment, legal or taxation advice to you. This research report does not constitute an offer, invitation or
inducement to invest in securities or other investments and Motilal Oswal Securities Limited (hereinafter referred as MOSt) is not soliciting any action based upon it. This report is not for public distribution and has been furnished to
you solely for your general information and should not be reproduced or redistributed to any other person in any form. This report does not constitute a personal recommendation or take into account the particular investment
objectives, financial situations, or needs of individual clients. Before acting on any advice or recommendation in this material, investors should consider whether it is suitable for their particular circumstances and, if necessary, seek
professional advice. The price and value of the investments referred to in this material and the income from them may go down as well as up, and investors may realize losses on any investments. Past performance is not a guide for
future performance, future returns are not guaranteed and a loss of original capital may occur.
MOSt and its affiliates are a full-service, integrated investment banking, investment management, brokerage and financing group. We and our affiliates have investment banking and other business relationships with a some
companies covered by our Research Department. Our research professionals may provide input into our investment banking and other business selection processes. Investors should assume that MOSt and/or its affiliates are
seeking or will seek investment banking or other business from the company or companies that are the subject of this material and that the research professionals who were involved in preparing this material may educate investors
on investments in such business . The research professionals responsible for the preparation of this document may interact with trading desk personnel, sales personnel and other parties for the purpose of gathering, applying and
interpreting information. Our research professionals are paid on twin parameters of performance & profitability of MOSt.
MOSt generally prohibits its analysts, persons reporting to analysts, and members of their households from maintaining a financial interest in the securities or derivatives of any companies that the analysts cover. Additionally, MOSt
generally prohibits its analysts and persons reporting to analysts from serving as an officer, director, or advisory board member of any companies that the analysts cover. Our salespeople, traders, and other professionals or affiliates
may provide oral or written market commentary or trading strategies to our clients that reflect opinions that are contrary to the opinions expressed herein, and our proprietary trading and investing businesses may make investment
decisions that are inconsistent with the recommendations expressed herein. In reviewing these materials, you should be aware that any or all of the foregoingamong other things, may give rise to real or potential conflicts of interest.
MOSt and its affiliated company(ies), their directors and employees and their relatives may; (a) from time to time, have a long or short position in, act as principal in, and buy or sell the securities or derivatives thereof of companies
mentioned herein. (b) be engaged in any other transaction involving such securities and earn brokerage or other compensation or act as a market maker in the financial instruments of the company(ies) discussed herein or act as an
advisor or lender/borrower to such company(ies) or may have any other potential conflict of interests with respect to any recommendation and other related information and opinions.; however the same shall have no bearing
whatsoever on the specific recommendations made by the analyst(s), as the recommendations made by the analyst(s) are completely independent of the views of the affiliates of MOSt even though there might exist an inherent
conflict of interest in some of the stocks mentioned in the research report Reports based on technical and derivative analysis center on studying charts company's price movement, outstanding positions and trading volume, as
opposed to focusing on a company's fundamentals and, as such, may not match with a report on a company's fundamental analysis. In addition MOST has different business segments / Divisions with independent research
separated by Chinese walls catering to different set of customers having various objectives, risk profiles, investment horizon, etc, and therefore may at times have different contrary views on stocks sectors and markets.
Unauthorized disclosure, use, dissemination or copying (either whole or partial) of this information, is prohibited. The person accessing this information specifically agrees to exempt MOSt or any of its affiliates or employees from,
any and all responsibility/liability arising from such misuse and agrees not to hold MOSt or any of its affiliates or employees responsible for any such misuse and further agrees to hold MOSt or any of its affiliates or employees free
and harmless from all losses, costs, damages, expenses that may be suffered by the person accessing this information due to any errors and delays. The information contained herein is based on publicly available data or other
sources believed to be reliable. Any statements contained in this report attributed to a third party represent MOSt’s interpretation of the data, information and/or opinions provided by that third party either publicly or through a
subscription service, and such use and interpretation have not been reviewed by the third party. This Report is not intended to be a complete statement or summary of the securities, markets or developments referred to in the
document. While we would endeavor to update the information herein on reasonable basis, MOSt and/or its affiliates are under no obligation to update the information. Also there may be regulatory, compliance, or other reasons that
may prevent MOSt and/or its affiliates from doing so. MOSt or any of its affiliates or employees shall not be in any way responsible and liable for any loss or damage that may arise to any person from any inadvertent error in the
information contained in this report. MOSt or any of its affiliates or employees do not provide, at any time, any express or implied warranty of any kind, regarding any matter pertaining to this report, including without limitation the
implied warranties of merchantability, fitness for a particular purpose, and non-infringement. The recipients of this report should rely on their own investigations.
This report is intended for distribution to institutional investors. Recipients who are not institutional investors should seek advice of their independent financial advisor prior to taking any investment decision based on this report or for
any necessary explanation of its contents.
Most and it’s associates may have managed or co-managed public offering of securities, may have received compensation for investment banking or merchant banking or brokerage services, may have received any compensation
for products or services other than investment banking or merchant banking or brokerage services from the subject company in the past 12 months.
Most and it’s associates have not received any compensation or other benefits from the subject company or third party in connection with the research report.
Subject Company may have been a client of Most or its associates during twelve months preceding the date of distribution of the research report
MOSt and/or its affiliates and/or employees may have interests/positions, financial or otherwise of over 1 % at the end of the month immediately preceding the date of publication of the research in the securities mentioned in this
report. To enhance transparency, MOSt has incorporated a Disclosure of Interest Statement in this document. This should, however, not be treated as endorsement of the views expressed in the report.
Motilal Oswal Securities Limited is registered as a Research Analyst under SEBI (Research Analyst) Regulations, 2014. SEBI Reg. No. INH000000412
Pending Regulatory inspections against Motilal Oswal Securities Limited:
SEBI pursuant to a complaint from client Shri C.R. Mohanraj alleging unauthorized trading, issued a letter dated 29th April 2014 to MOSL notifying appointment of an Adjudicating Officer as per SEBI regulations to hold inquiry and
adjudge violation of SEBI Regulations; MOSL replied to the Show Cause Notice whereby SEBI granted us an opportunity of Inspection of Documents. Since all the documents requested by us were not covered we have requested to
SEBI vide our letter dated June 23, 2015 to provide pending list of documents for inspection.
List of associate companies of Motilal Oswal Securities Limited -Click
here to access detailed report
Analyst Certification
The views expressed in this research report accurately reflect the personal views of the analyst(s) about the subject securities or issues, and no part of the compensation of the research analyst(s) was, is, or will be directly or
indirectly related to the specific recommendations and views expressed by research analyst(s) in this report. The research analysts, strategists, or research associates principally responsible for preparation of MOSt research receive
compensation based upon various factors, including quality of research, investor client feedback, stock picking, competitive factors and firm revenues
Disclosure of Interest Statement
Analyst ownership of the stock
Served as an officer, director or employee
Companies where there is interest
No
No
A graph of daily closing prices of securities is available at www.nseindia.com and http://economictimes.indiatimes.com/markets/stocks/stock-quotes
Regional Disclosures (outside India)
This report is not directed or intended for distribution to or use by any person or entity resident in a state, country or any jurisdiction, where such distribution, publication, availability or use would be contrary to law, regulation or which
would subject MOSt& its group companies to registration or licensing requirements within such jurisdictions.
For Hong Kong:
This report is distributed in Hong Kong by Motilal Oswal capital Markets (Hong Kong) Private Limited, a licensed corporation (CE AYY-301) licensed and regulated by the Hong Kong Securities and Futures
Commission (SFC) pursuant to the Securities and Futures Ordinance (Chapter 571 of the Laws of Hong Kong) “SFO”. As per SEBI (Research Analyst Regulations) 2014 Motilal Oswal Securities (SEBI Reg No. INH000000412) has
an agreement with Motilal Oswal capital Markets (Hong Kong) Private Limited for distribution of research report in Kong Kong. This report is intended for distribution only to “Professional Investors” as defined in Part I of Schedule 1 to
SFO. Any investment or investment activity to which this document relates is only available to professional investor and will be engaged only with professional investors.” Nothing here is an offer or solicitation of these securities,
products and services in any jurisdiction where their offer or sale is not qualified or exempt from registration. The Indian Analyst(s) who compile this report is/are not located in Hong Kong & are not conducting Research Analysis in
Hong Kong.
For U.S
Motilal Oswal Securities Limited (MOSL) is not a registered broker - dealer under the U.S. Securities Exchange Act of 1934, as amended (the"1934 act") and under applicable state laws in the United States. In addition MOSL is not a
registered investment adviser under the U.S. Investment Advisers Act of 1940, as amended (the "Advisers Act" and together with the 1934 Act, the "Acts), and under applicable state laws in the United States. Accordingly, in the
absence of specific exemption under the Acts, any brokerage and investment services provided by MOSL, including the products and services described herein are not available to or intended for U.S. persons.
This report is intended for distribution only to "Major Institutional Investors" as defined by Rule 15a-6(b)(4) of the Exchange Act and interpretations thereof by SEC (henceforth referred to as "major institutional investors"). This
document must not be acted on or relied on by persons who are not major institutional investors. Any investment or investment activity to which this document relates is only available to major institutional investors and will be
engaged in only with major institutional investors. In reliance on the exemption from registration provided by Rule 15a-6 of the U.S. Securities Exchange Act of 1934, as amended (the "Exchange Act") and interpretations thereof by
the U.S. Securities and Exchange Commission ("SEC") in order to conduct business with Institutional Investors based in the U.S., MOSL has entered into a chaperoning agreement with a U.S. registered broker-dealer, Motilal Oswal
Securities International Private Limited. ("MOSIPL"). Any business interaction pursuant to this report will have to be executed within the provisions of this chaperoning agreement.
The Research Analysts contributing to the report may not be registered /qualified as research analyst with FINRA. Such research analyst may not be associated persons of the U.S. registered broker-dealer, MOSIPL, and therefore,
may not be subject to NASD rule 2711 and NYSE Rule 472 restrictions on communication with a subject company, public appearances and trading securities held by a research analyst account.
For Singapore
Motilal Oswal Capital Markets Singapore Pte Limited is acting as an exempt financial advisor under section 23(1)(f) of the Financial Advisers Act(FAA) read with regulation 17(1)(d) of the Financial Advisors Regulations and is a
subsidiary of Motilal Oswal Securities Limited in India. This research is distributed in Singapore by Motilal Oswal Capital Markets Singapore Pte Limited and it is only directed in Singapore to accredited investors, as defined in the
Financial Advisers Regulations and the Securities and Futures Act (Chapter 289), as amended from time to time.
In respect of any matter arising from or in connection with the research you could contact the following representatives of Motilal Oswal Capital Markets Singapore Pte Limited:
Varun Kumar
Varun.kumar@motilaloswal.com
Contact : (+65) 68189232
Office Address:21 (Suite 31),16 CollyerQuay,Singapore 04931
13 December 2016
Motilal Oswal Tower, Level 9, Sayani Road, Prabhadevi, Mumbai 400 025
Phone: +91 22 3982 5500 E-mail: reports@motilaloswal.com
Motilal Oswal Securities Ltd
22