19 January 2017
3QFY17 Results Update | Sector: Technology
MindTree
Neutral
BSE SENSEX
27,309
Bloomberg
Equity Shares (m)
M.Cap.(INRb)/(USDb)
52-Week Range (INR)
1, 6, 12 Rel. Per (%)
Avg Val, INRm
Free float (%)
S&P CNX
8,435
MTCL IN
50
38.9 / 0.8
804 / 400
-7/-11/-45
374
86.3
CMP: INR485
TP: INR530(+9%)
Deal wins strong, top clients and visibility not so
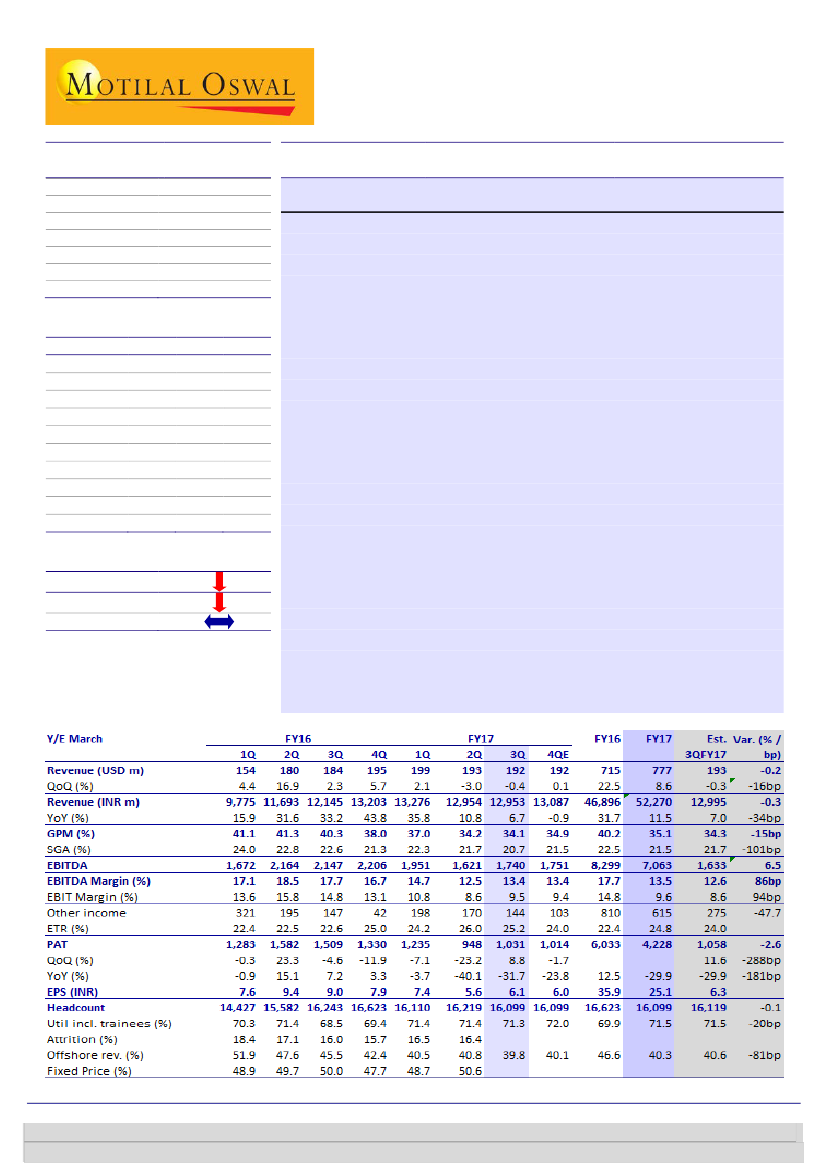
Continued revenue pressure…:
MTCL’s 3QFY17 revenue declined 0.4% QoQ
(+0.4% QoQ CC), in line with our estimate, led by project cancellations,
slower ramp-up at large clients and continued weakness in acquired entities.
With softness in top clients expected to continue, growth is not likely to pick
up in 4Q. Clarity on the FY18 outlook remains elusive, partly negating
confidence that deal wins could support growth recovery.
…but deal wins touching new highs:
Deal wins clocked USD314m in 3QFY17,
as against four-quarter average of USD222m, taking LTM deal wins to
~USD1b (+30% YoY). That said, it came on the back of a sluggish September
quarter and, consequently, 2HCY16 TCV of USD497m matches 1H’s
USD501m. 34% of TCV in the quarter came from Digital, with many of the
deals channeled through third-party advisers. Average deal sizes in Digital
continue to inch up, now at ~USD900k for new clients.
Profitability beat on lower headcount and SGA:
EBITDA margin expanded
90bp (v/s est. of flat margins) led by SGA optimization. PAT grew 8.8% QoQ
to INR1b (v/s est. of INR1.1b). While revenue revival remains the key, other
levers to achieve growth are offshoring, lesser sub-contracting, large
transformational deals to tackle pricing pressure, and improved profitability
in Bluefin and Magnet360.
Valuation view:
We cut earnings by 6.9%/0.2% for FY18/19E to factor in
delay in revenue recovery and consequent lowering of FY17E exit rate. While
MTCL is an attractive long-term Digital play, greater confidence in the same
will be a function of traction in revenues, especially from top clients. Valuing
it at 14x FY19E earnings, we maintain
Neutral
with a revised TP of INR530.
Financials & Valuations (INR b)
Y/E Mar
2016 2017E
Net Sales
46.9
52.3
EBITDA
8.3
7.1
PAT
6.0
4.2
EPS (INR)
35.9
25.1
Gr. (%)
12.4
-29.9
BV/Sh (INR)
142.4
151.2
RoE (%)
27.4
17.1
RoCE (%)
30.6
19.6
P/E (x)
13.5
19.2
P/BV (x)
3.4
3.2
2018E
58.6
8.5
5.7
33.7
34.2
170.5
21.0
22.8
14.3
2.8
Estimate change
TP change
Rating change
Quarterly Performance (Consolidated)
Investors are advised to refer through important disclosures made at the last page of the Research Report.
Motilal Oswal research is available on www.motilaloswal.com/Institutional-Equities, Bloomberg, Thomson Reuters, Factset and S&P Capital.
Ashish Chopra
(Ashish.Chopra@MotilalOswal.com); +91 22 6129 1530
Sagar Lele
(Sagar.Lele@MotilalOswal.com); +91 22 6129 1531

MindTree
Cancellations and slower ramp-ups weigh upon revenue growth
MTCL’s 3QFY17 revenue declined 0.4% QoQ to USD192m, compared to our
estimate of USD193m. In CC terms, revenue growth stood at 0.4% QoQ.
Revenue growth pressure was expected in 3Q, with it being a function of project
cancellations, slower ramp-up at a few large clients and continued weakness in
Bluefin.
The near-term weakness in outlook is expected to continue in 4Q too, with
acceleration in revenue growth likely from the beginning of FY17.
Exhibit 1: Revenue in line with expectations
Revenue (USD m)
4.2
5.4
2.5
4.5
6.4
4.0
0.5
0.1
4.4
QoQ Growth (%)
8.1
5.7
2.3
2.1
-0.4
-3.0
Source: MOSL, Company
Deal wins continue displaying relative strength
Deal wins clocked USD314m during the quarter against a four-quarter average
of USD222m, taking LTM deal wins to ~USD1b – a growth of 30% YoY.
That said, it came on the back of a sluggish September quarter, and
consequently 2HCY16 TCV of USD497m matches 1H’s USD501m.
34% of the TCV of deals won in the quarter were in Digital, with many of them
channeled through third-party advisers. Average deal sizes in Digital continue to
inch up, now at ~USD900k for new clients.
EBITDA margin expanded 90bp QoQ to 13.4%, compared to our estimate of
flattish margins. Our estimate of flat margins was based on lack of revival of
revenue growth in 3Q.
While gross margins remained flat QoQ, SGA expenses inched up by 90bp (as a
percentage of sales) leading to the margin beat.
Profitability: EBITDA margins beat estimates
Exhibit 2: Margin beat after four consecutive quarters of decline
EBITDA margin (%)
22.6 21.4 21.3
19.4
22.2 21.8 21.8 21.7
SGA (%)
24.0 22.8 22.6
21.3 22.3 21.7 20.7
18.4 20.8 19.5 21.5 20.0 19.8 20.5 19.5 17.1 18.5 17.7 16.7 14.7 12.5 13.4
Source: MOSL, Company
19 January 2017
2

MindTree
Utilization excluding trainees was down 80bp to 72.3% while utilization
including trainees was down by 10bp at 71.3%. The quarter saw a net decline of
120 people to 16,099.
Exhibit 3: Utilization excl. trainees down by 80bp QoQ
76
73
70
67
64
Incl. Trainees (%)
Excl. Trainees (%)
Source: MOSL, Company
While volume declined by 3% QoQ during the quarter, pricing declined by 1%
QoQ.
Onsite volume was down 2.2% and offshore volume declined by 3.2% QoQ.
In terms of pricing, while onsite grew by 0.6% QoQ, there was a decline of 3.3%
seen in offshore pricing.
Exhibit 4: Onsite composition has increased heavily in the last few quarters
100%
80%
60%
40%
20%
0%
Onsite (% of revenue)
Offshore (% of revenue)
48% 46% 42% 41% 41% 40%
61% 59% 57% 56% 56% 54% 54% 53% 52%
52% 55% 58% 60% 59% 60%
39% 41% 43% 44% 44% 46% 46% 47% 48%
Source: MOSL, Company
PAT for the quarter was INR1b, +8.8% QoQ, versus our expectation of INR1.1b,
growth of 11.6% QoQ. The miss was led by lower other income.
Revenue decline was seen across all verticals, with the most gravely impacted
being Travel & Hospitality (-6.9% QoQ), followed by BFSI (-3.8% QoQ).
Contr to
Rev. (%)
36.7
24.1
24.1
15.1
Growth -
QoQ (%)
-0.4
-2.8
-0.8
4.4
Contr to incr.
rev (%)
-37
-169
-48
154
Pockets of growth seen in the portfolio
Exhibit 5: Growth seen in Travel & Hospitality post steep decline in the previous quarter
Verticals
Technology, Media and Services
BFSI
Retail, CPG & Manufacturing
Travel & Hospitality
4 Qrtr CQGR
6.1
0.0
5.4
0.2
Source: MOSL, Company
19 January 2017
3

MindTree
Among Services, Development (-0.4% QoQ), Maintenance (-1.5% QoQ) and
Package Implementation (-5.7% QoQ) saw a decline. Growth during the quarter
was driven by IMS (+8% QoQ), which constituted 67% of incremental revenues.
Exhibit 6: Growth led by Consulting, IMS and IP licensing
Services
Development & Engg
Maintenance
Consulting
Package Implementation
Independent Testing
IMS
IP Licensing
Contr to
Rev. (%)
31.8
17.6
3.9
12.4
12.6
20.3
1.4
Growth -
QoQ (%)
-0.4
-1.5
2.2
-5.7
1.2
1.6
16.2
Contr to incr.
4 Qrtr CQGR
rev (%)
-32
0.9
-66
-1.9
20
11.8
-181
0.0
35
0.6
76
4.0
47
-5.1
Source: MOSL, Company
Among geographies, US grew 1.2% QoQ but Europe declined 3.2%, India by
11.8% and APAC by 1.7%
Exhibit 7: Europe under pressure
Geographies
US
Europe
India
RoW
Contr to Rev. Growth - QoQ
(%)
(%)
68.7
1.2
20.8
-3.2
3.1
-11.8
7.4
-1.7
Contr to incr.
rev (%)
197
-166
-100
-32
4 Qrtr CQGR
3.0
-4.8
4.6
1.0
Source: MOSL, Company
Takeaways from management commentary
Performance in 3Q:
Revenue growth was strong in some areas in 3Q. In terms of
geographies, while Europe declined in USD terms, this was largely on account of
cross-currency headwinds. In constant currency terms, Europe was stable QoQ.
The quarter saw robust deal wins, with the strongest signings in the history of
MTCL.
Outlook for 4Q:
Revenue growth for MTCL in 4Q is expected to be similar to
that in 3Q. More clarity on client budgets is expected to emerge in a couple of
months. Some large customers have been facing challenges in their own
business, in an environment of political and macroeconomic uncertainty.
Margins are likely to be stable given the trajectory on revenue growth.
Bluefin issues persist:
The restructuring in Bluefin has been progressing well.
The sales team at Bluefin has now been aligned to Mindtree’s verticals. The
acquisition has fit in well with Mindtree’s strategy, and gets substantiated from
the fact that two deal wins during the quarter were influenced by Bluefin. While
short-term challenges continue in Bluefin, its services are being expanded in the
US and in mainland Europe in order to mitigate it.
Profitability likely to improve in the medium term:
The management indicated
expectations of margin improvement going forward, especially with the seizure
of revenue decline starting next quarter. Higher utilization, cost optimization in
travel expenses, reduced dependency on subcontractors, higher offshoring, and
improved profitability in acquisitions are likely to result in improved margins
going forward.
19 January 2017
4

MindTree
Change in estimates
We have adjusted our revenue estimates to factor the flattish trend likely in 4Q,
which in turn impacts the exit rate for FY17E. We now model 7.8/10.1% USD
revenue growth over FY18/19E.
We have also cut our EBITDA margin estimates for FY18E to 14.5% (-90bp
compared to earlier) to factor the delayed recovery, and continued pressure in
Bluefin. Consequently, our earnings cut is to the tune of 6.9/0.2% for FY18/19E.
Revised
FY18E
70.0
838
7.8
14.5
10.8
33.7
Earlier
FY18E
70.0
861
10.2
15.4
11.7
36.2
Change
FY18E FY19E
0.0%
0.0%
-2.8% -4.7%
-241bp -230bp
-89bp
26bp
-95bp
5bp
-6.9% -0.2%
Exhibit 8: Change in estimates
FY17E
67.3
777
8.6
13.5
9.6
25.1
FY19E
70.4
922
10.1
14.5
10.7
38.1
FY17E
67.3
781
9.2
13.5
9.6
26.6
FY19E
70.4
968
12.4
14.3
10.7
38.1
FY17E
0.0%
-0.6%
-63bp
1bp
3bp
-5.5%
INR/USD
USD Revenue (m)
USD Rev growth (%)
EBITDA Margin (%)
EBIT Margin (%)
EPS (INR)
Source: Company, MOSL
Valuation and view
MTCL has been a focused mid-tier company with play on select verticals (BFSI,
Retail, Travel, Hi-Tech) and services (Digital, IMS, ADM). Its pragmatic strategy
has been backed by strong execution, which has helped the company grow
above industry in its IT Services business – at a CAGR of 17% over FY10-15.
The company remains actively focused on Digital, which continues to grow
ahead of company average. Proportion of Digital to overall revenues has
increased to 39% in 3QFY17, from 36% a year ago. MTCL has been investing to
improvise its early mover advantage in Digital through 4 acquisitions in the last
one year - around P&C Insurance, SAP HANA, CPG analytics and Salesforce. We
believe that acquisitive intent is the right approach in the Digital opportunity,
and that it will help a player of MTCL’s scale to keep extracting opportunities to
grow its share of clients’ wallet.
With continued traction in Digital / SMAC, MTCL should continue to grow at the
higher end of the industry band if not better – barring risk of slowdown in one
or more of its top accounts. ~40% revenue exposure to Digital augurs well for
company’s growth, and the company continues to actively invest in building
capabilities and leadership in this area. Moreover, Digital is becoming a key
aspect in mining existing accounts, and in getting an entry-point into new ones.
At 14.3/12.7x FY18/19E, EPS, the stock trades well above the average across its
listed history (9 years). We expect the company to grow its USD revenues at a
CAGR of 8.8% over FY16-19E and EPS at a CAGR of 2.0% during this period.
Although it has multiple margin levers in place, especially with current SGA run
rate of ~22% above other companies, and utilization including trainees at ~70%
below peers; pricing pressure in traditional services, and the onsite-centric
nature of incremental business are likely to cap margin expansion.
A premium to historical average is explained by: [1] the turnaround following
unfruitful past acquisitions, [2] strong execution in IT Services driving confidence
of above-industry growth, and so also strong book-to-bill in the last four
quarters and [3] capabilities and expansion in Digital.
19 January 2017
5

MindTree
However, the company has been facing pressure from multiple areas (client-
specific issues, spending delays by clients, project cancellations and pricing
pressure) that have been weighing upon overall performance – both in terms of
revenue and profitability. These issues have resulted in sub-par organic growth
in FY17, and sharp reduction in margins despite the superior revenue mix
compared to peers. We expect these pressures to keep valuations under check
despite the favorable positioning of the company. Our one-year forward target
price of INR530 discounts FY19E EPS by 14x. Maintain Neutral.
Key triggers
Uptick in margins on SGA rationalization and utilization expansion
Steady increase in revenue contribution from Digital
Faster uptick in BFSI/Retial & CPG
Key risk factors
Continued pressure from delayed project ramp-ups and project cancellations
Weakness in top clients
Pricing decline in traditional deals’ renewal
Exhibit 10: 1-year forward PB band
Avg(x)
Min(x)
27.3
15.2
5.5
4.5
12.7
3.5
2.5
1.5
4.0
0.5
2.6
0.6
PB (x)
Peak(x)
5.3
3.1
Avg(x)
Min(x)
Exhibit 9: 1-year forward PE band
30
25
20
15
10
5
0
PE (x)
Peak(x)
Source: MOSL
Source: MOSL
19 January 2017
6

MindTree
Story in charts
Exhibit 11: LTM deal wins up 30% YoY
Deal Wins (USDm)
281
165 165 152 164
133
207.9 193 204
220
183
314
32
32
33
33
Exhibit 12: ..driven by Digital/SMAC based revenues
Digital Revenues
In USD m
% of Revenues
38.6 39.9 40 39.4
34.7 36.6 36.1
32
Source: Company, MOSL
Exhibit 13: Deal wins have consistently bettered revenue
370
320
270
220
170
120
Deal Wins (USDm)
Revenue (USDm)
Exhibit 14: Efforts proportion at onsite has increased
steadily…
Efforts mix (%)
Onsite
Offshore
88.3
11.7
88.5
11.5
87.2
12.8
85.7
14.3
83.7
16.3
82.2
17.8
79.5
20.5
76.8
23.2
Source: Company, MOSL
Exhibit 15: …Putting margins under pressure…
EBITDA margin (%)
SGA (%)
Exhibit 16: …Despite improved utilization
79.0
75.5
72.0
68.5
65.0
Incl. Trainees (%)
Excl. Trainees (%)
Source: Company, MOSL
19 January 2017
7

MindTree
Operating metrics
Exhibit 17: Operating Metrics
2QFY15
Geographic Mix - %
US
Europe
India
APAC
Service Line Mix - %
Development
Maintenance
Consulting
Package Implementation
Independent Testing
IMS & Tech Support
IP Licensing
Vertical Mix - %
Retail, CPG & Manufacturing
BFSI
Travel & Hospitality
Hitech & Media
Others
Project Type - %
FPP
T&M
Efforts Mix - %
Onsite
Offshore
Revenue mix - %
Onsite
Offshore
Utilization - %
Including Trainees
Excluding Trainees
Client Metrics
No. Of Active Clients
New Clients added
Client Buckets
USD1m clients
USD5m clients
USD10m clients
USD20m clients
USD30m clients
USD50m clients
Client Contribution - %
Top client
Top 5
Top 10
Repeat business
60.4
26.1
4.0
9.6
33.4
21.2
4.2
5.4
15.5
18.7
1.6
21.6
22.8
17.1
32.7
5.8
43.6
56.4
17.6
82.4
45.6
54.4
73.5
74.2
200
8
77
27
13
7
4
0
9.1
32.4
48.8
99.7
3QFY15
63.1
24.2
4.1
8.6
34.0
21.4
4.1
5.8
15.4
17.6
1.6
22.2
23.5
16.2
32.7
5.4
46.5
53.5
18.2
81.8
45.8
54.2
71.8
74.2
201
5
83
27
13
6
4
1
9.6
32.5
48.1
99.4
4QFY15
64.9
23.7
3.6
7.8
33.2
20.8
3.9
7.5
17.5
15.4
1.7
21.7
25.0
16.0
32.6
4.7
46.5
53.5
18.5
81.5
47.1
52.9
70.2
71.1
217
8
88
28
14
6
4
1
10.1
32.3
47.3
99.2
1QFY16
67.5
21.9
3.4
7.2
33.4
21.7
3.7
7.2
17.7
14.9
1.4
22.1
26.9
15.6
35.4
0.0
48.9
51.1
18.6
81.4
48.1
51.9
70.3
71.9
218
16
88
28
13
6
0
2
11.0
33.2
48.5
98.9
2QFY16
63.2
26.6
3.2
7.0
31.8
21.0
2.8
13.3
12.8
17.0
1.3
20.6
24.7
13.9
30.4
10.5
49.7
50.3
20.0
80.0
52.4
47.6
71.4
73.3
296
18
92
29
13
6
0
2
10.7
31.8
45.5
98.9
3QFY16
63.5
26.4
2.7
7.4
32.0
19.8
2.6
12.9
12.8
18.1
1.8
20.3
25.1
15.6
30.2
8.7
50.0
50.0
21.1
78.9
54.5
45.5
68.5
69.9
294
23
93
29
13
5
0
2
10.9
32.1
46.2
98.5
4QFY16
65.9
24.5
2.8
6.8
33.0
18.0
4.0
13.6
12.6
17.5
1.3
23.8
24.4
16.4
35.3
0.0
47.7
52.3
22.3
77.7
57.6
42.4
69.4
70.6
348
37
101
31
15
6
0
2
11.7
29.7
42.7
96.0
1QFY17
66.7
23.1
3.1
7.1
32.5
17.3
4.1
13.9
12.8
18.4
1.0
24.1
24.9
15.0
36.1
0.0
48.7
51.3
22.9
77.1
59.5
40.5
71.4
72
343
17
98
31
16
5
0
2
13.1
29.6
42.6
98.2
2QFY17
67.6
21.4
3.5
7.5
31.8
17.8
3.8
13.1
12.4
19.9
1.2
24.2
24.7
14.4
36.7
0.0
50.6
49.4
23.3
76.7
59.2
40.8
71.4
73.1
337
18
107
30
16
6
0
2
14.4
30.0
42.5
97.8
3QFY17
68.7
20.8
3.1
7.4
31.8
17.6
3.9
12.4
12.6
20.3
1.4
24.1
24.1
15.1
36.7
0.0
52.5
47.5
23.5
76.5
60.2
39.8
71.3
72.3
348
21
106
30
17
4
1
1
14.1
30.1
42.3
98.7
Source: MOSL, Company
19 January 2017
8

MindTree
Financials and Valuations
Key assumption
INR/USD Rate
Revenues (USD m)
Offshore Revenue (%)
Total Headcount
Per Capita Productivity (USD)
Offshore Uilization (%)
Volume growth (%)
Blended Pricing Change (%)
2012
47.6
403
66.4
11,674
34,489
69.9
16.5
4.4
2012
19,152
26.9
2,930
15.3
695
2,235
5
385
0
2,615
430
16.4
0
2,185
2,185
101.4
2012
405
9,167
9,572
37
-321
9,288
5,820
3,272
2,548
85
7
10,342
0
4,078
602
5,662
3,737
3,737
0
6,605
9,288
2013
54.2
436
62.4
11,430
38,114
70.4
6.4
1.7
2013
23,618
23.3
4,860
20.6
624
4,236
10
10
0
4,236
847
20.0
0
3,389
3,389
55.1
2013
415
12,722
13,137
32
-360
12,809
6,457
3,896
2,561
571
230
13,160
0
4,508
1,252
7,400
3,741
3,741
0
9,419
12,809
2014
60.4
502
58.2
13,218
37,948
67.8
13.3
1.6
2014
30,316
28.4
6,102
20.1
809
5,293
4
496
0
5,785
1,275
22.0
0
4,510
4,510
33.1
2014
417
15,988
16,405
27
-402
16,030
6,886
3,621
3,265
496
175
16,485
0
6,004
1,184
9,297
4,561
4,561
0
11,924
16,030
2015
61.0
584
54.3
14,795
39,458
71.9
13.4
2.7
2015
35,619
17.5
7,092
19.9
1,018
6,074
1
835
0
6,908
1,545
22.4
0
5,363
5,363
18.9
2015
837
19,287
20,124
23
-449
19,702
8,879
4,366
4,513
354
8
20,183
0
6,963
3,763
9,457
6,398
6,398
0
13,785
19,702
2016
65.6
715
46.6
16,958
42,175
69.9
16.5
5.2
2016
46,896
31.7
8,299
17.7
1,332
6,967
3
810
0
7,774
1,741
22.4
0
6,033
6,033
12.5
2016
1,678
22,278
23,956
18
-602
23,372
10,323
5,698
4,625
232
58
20,279
0
9,728
2,332
8,219
9,013
9,013
0
11,266
23,787
2017E
67.3
777
40.3
16,219
47,885
71.5
4.6
3.8
2017E
52,270
11.5
7,063
13.5
1,869
5,194
185
615
0
5,624
1,396
24.8
0
4,228
4,228
-29.9
2017E
1,680
23,755
25,435
14
-514
24,935
11,352
7,290
4,062
214
58
22,475
0
10,399
814
11,262
9,058
9,058
0
13,417
24,935
2018E
70.0
838
40.1
17,937
46,692
72.7
7.1
0.7
2018E
58,596
12.1
8,511
14.5
2,085
6,426
114
1,154
0
7,466
1,792
24.0
0
5,674
5,674
34.2
2018E
1,680
26,992
28,672
14
-514
28,172
14,062
9,375
4,687
214
58
26,010
0
12,098
2,490
11,423
10,438
10,438
0
15,572
28,172
2019E
70.4
922
39.6
19,372
47,600
73.2
9.3
0.7
2019E
64,915
10.8
9,436
14.5
2,451
6,985
34
1,472
0
8,423
2,022
24.0
0
6,402
6,402
12.8
2019E
1,680
30,348
32,028
14
-514
31,528
16,772
11,826
4,946
214
58
29,716
0
13,322
4,856
11,539
11,504
11,504
0
18,211
31,528
Income Statement
Y/E Mar
Net Sales
Change (%)
EBITDA
EBITDA Margin (%)
Depreciation
EBIT
Interest
Other Income
Extraordinary items
PBT
Tax
Tax Rate (%)
Min. Int. & Assoc. Share
Reported PAT
Adjusted PAT
Change (%)
(INR Million)
Balance Sheet
Y/E Mar
Share Capital
Reserves
Net Worth
Debt
Deferred Tax
Total Capital Employed
Gross Fixed Assets
Less: Acc Depreciation
Net Fixed Assets
Capital WIP
Investments
Current Assets
Inventory
Debtors
Cash & Bank
Loans & Adv, Others
Curr Liabs & Provns
Curr. Liabilities
Provisions
Net Current Assets
Total Assets
(INR Million)
19 January 2017
9

MindTree
Financials and Valuations
Y/E Mar
Basic (INR)
EPS
Cash EPS
Book Value
DPS
Payout (incl. Div. Tax.)
Valuation(x)
P/E
Cash P/E
Price / Book Value
EV/Sales
EV/EBITDA
Dividend Yield (%)
Profitability Ratios (%)
RoE
RoCE
Turnover Ratios (%)
Fixed Asset Turnover (x)
Debtors (No. of Days)
Leverage Ratios (%)
Net Debt/Equity (x)
Ratios
2012
13.4
17.6
58.3
4.0
29.8
2013
20.4
24.0
78.6
3.0
14.7
2014
26.9
31.7
97.9
6.3
23.2
2015
31.9
38.0
119.8
8.5
26.6
2016
35.9
43.8
142.4
10.5
29.3
2017E
25.1
34.6
151.2
12.0
47.7
2018E
33.7
46.1
170.5
12.0
35.6
2019E
38.1
52.6
190.4
15.0
39.4
36.0
27.6
8.3
3.9
25.5
0.8
0.0
0.0
0.0
0.0
0.0
0.0
18.0
15.3
4.9
2.4
12.2
1.3
15.2
12.7
4.0
2.0
10.1
1.8
13.5
11.1
3.4
1.6
9.3
2.2
19.2
14.0
3.2
1.4
10.7
2.5
14.3
10.5
2.8
1.3
8.7
2.5
12.7
9.2
2.5
1.1
7.6
3.1
25.2
25.1
7.5
77.7
0.0
2012
2,930
175
-523
-554
0
2,028
-410
1,618
-2,038
121
-2,327
120
402
-4
-76
442
143
459
602
29.8
37.0
9.2
69.7
0.0
2013
4,860
-624
-603
-969
0
2,664
-1,057
1,607
-1,041
179
-1,919
322
-222
-11
-184
-95
650
602
1,252
30.5
35.5
9.3
72.3
0.0
2014
6,102
180
-1,766
-1,297
0
3,219
-1,517
1,702
-948
222
-2,243
63
-247
-5
-854
-1,043
-67
1,251
1,184
29.4
32.8
7.9
71.4
0.0
2015
7,092
-1
489
-1,545
0
6,035
-1,851
4,184
167
656
-1,028
420
-4
0
-1,909
-1,493
3,514
249
3,763
27.4
30.6
10.1
75.7
0.0
2016
8,299
-3
-1,207
-1,741
0
5,348
-1,322
4,026
-50
417
-955
841
-5
0
-2,129
-1,293
3,100
-768
2,332
17.1
19.6
12.9
72.6
0.0
2017E
7,063
-462
-37
-1,396
0
5,169
-1,011
4,158
0
554
-457
2
-4
0
-2,436
-2,438
2,274
-1,460
814
21.0
22.8
12.5
75.4
0.0
2018E
8,511
-114
-479
-1,792
0
6,126
-2,710
3,416
0
1,228
-1,482
0
0
0
-2,437
-2,437
2,207
283
2,490
21.1
22.4
13.1
74.9
0.0
2019E
9,436
-34
-274
-2,022
0
7,107
-2,710
4,397
0
1,629
-1,081
0
0
0
-3,046
-3,046
2,981
1,875
4,856
Cash Flow Statement
Y/E Mar
Adjusted EBITDA
Non cash opr. exp (inc)
(Inc)/Dec in Wkg. Cap.
Tax Paid
Other operating activities
CF from Op. Activity
(Inc)/Dec in FA & CWIP
Free cash flows
(Pur)/Sale of Invt
Others
CF from Inv. Activity
Inc/(Dec) in Net Worth
Inc / (Dec) in Debt
Interest Paid
Divd Paid (incl Tax) & Others
CF from Fin. Activity
Inc/(Dec) in Cash
Add: Opening Balance
Closing Balance
(INR Million)
19 January 2017
10

MindTree
Corporate profile
Company description
Exhibit 1: Sensex rebased
MindTree (MTCL) is a global information technology
solutions company, with revenue of over USD550m
(LTM) and over 13,000 employees. It is a strategic
partner to many Fortune 500 enterprises, providing
services in areas like Application Development,
Application Maintenance, Consulting, Testing and
Infrastructure Services, across industries like BFSI,
Travel and Retail. It enables customers to achieve
competitive advantage through flexible and next
generation global delivery models, agile
methodologies and expert frameworks.
Exhibit 2: Shareholding pattern (%)
Dec-16
Promoter
DII
FII
Others
13.7
7.2
39.0
40.1
Sep-16
13.7
6.6
39.4
40.3
Dec-15
13.8
6.8
44.3
35.1
Source: Capitaline
Source: MOSL/Bloomberg
Exhibit 3: Top holders
Holder Name
Coffee Day Enterprises Limited
Nalanda India Fund Limited
Coffee Day Trading Limited
Amansa Holdings Private Limited
Matthews India Fund
% Holding
10.4
9.4
6.3
4.3
3.3
Source: Capitaline
Note: FII Includes depository receipts
Exhibit 4: Top management
Name
Albert Hieronimus
Subroto Bagchi
Krishnakumar Natarajan
Rostow Ravanan
N S Parthasarathy
Vedavalli S
Designation
Vice Chairman & Director
Executive Chairman
CEO & Managing Director
Executive Director & CFO
Executive Vice Chairman
Company Secretary
Exhibit 5: Directors
Name
APURVA PUROHIT
Pankaj Chandra
Siddhartha V G
Milind Sarwate
Name
Manisha Girotra
Ramesh Ramanathan
Akshaya Bhargava
Source: Capitaline
*Independent
Exhibit 6: Auditors
Name
Deloitte Haskins & Sells
Type
Statutory
Exhibit 7: MOSL forecast v/s consensus
EPS
(INR)
FY17
FY18
MOSL
forecast
25.1
33.7
Consensus
forecast
31.6
38.4
Variation (%)
-20.4
-12.2
Source: Bloomberg
Source: Capitaline
19 January 2017
11

Disclosures
This document has been prepared by Motilal Oswal Securities Limited (hereinafter referred to as Most) to provide information about the company (ies) and/sector(s), if any, covered in the report and may be distributed by it
and/or its affiliated company(ies). This report is for personal information of the selected recipient/s and does not construe to be any investment, legal or taxation advice to you. This research report does not constitute an
offer, invitation or inducement to invest in securities or other investments and Motilal Oswal Securities Limited (hereinafter referred as MOSt) is not soliciting any action based upon it. This report is not for public distribution
and has been furnished to you solely for your general information and should not be reproduced or redistributed to any other person in any form. This report does not constitute a personal recommendation or take into
account the particular investment objectives, financial situations, or needs of individual clients. Before acting on any advice or recommendation in this material, investors should consider whether it is suitable for their
particular circumstances and, if necessary, seek professional advice. The price and value of the investments referred to in this material and the income from them may go down as well as up, and investors may realize losses
on any investments. Past performance is not a guide for future performance, future returns are not guaranteed and a loss of original capital may occur.
MOSt and its affiliates are a full-service, integrated investment banking, investment management, brokerage and financing group. We and our affiliates have investment banking and other business relationships with a some
companies covered by our Research Department. Our research professionals may provide input into our investment banking and other business selection processes. Investors should assume that MOSt and/or its affiliates are
seeking or will seek investment banking or other business from the company or companies that are the subject of this material and that the research professionals who were involved in preparing this material may educate
investors on investments in such business . The research professionals responsible for the preparation of this document may interact with trading desk personnel, sales personnel and other parties for the purpose of
gathering, applying and interpreting information. Our research professionals are paid on twin parameters of performance & profitability of MOSt.
MOSt generally prohibits its analysts, persons reporting to analysts, and members of their households from maintaining a financial interest in the securities or derivatives of any companies that the analysts cover.
Additionally, MOSt generally prohibits its analysts and persons reporting to analysts from serving as an officer, director, or advisory board member of any companies that the analysts cover. Our salespeople, traders, and
other professionals or affiliates may provide oral or written market commentary or trading strategies to our clients that reflect opinions that are contrary to the opinions expressed herein, and our proprietary trading and
investing businesses may make investment decisions that are inconsistent with the recommendations expressed herein. In reviewing these materials, you should be aware that any or all of the foregoing among other things,
may give rise to real or potential conflicts of interest. MOSt and its affiliated company(ies), their directors and employees and their relatives may; (a) from time to time, have a long or short position in, act as principal in, and
buy or sell the securities or derivatives thereof of companies mentioned herein. (b) be engaged in any other transaction involving such securities and earn brokerage or other compensation or act as a market maker in the
financial instruments of the company(ies) discussed herein or act as an advisor or lender/borrower to such company(ies) or may have any other potential conflict of interests with respect to any recommendation and other
related information and opinions.; however the same shall have no bearing whatsoever on the specific recommendations made by the analyst(s), as the recommendations made by the analyst(s) are completely independent
of the views of the affiliates of MOSt even though there might exist an inherent conflict of interest in some of the stocks mentioned in the research report
Reports based on technical and derivative analysis center on studying charts company's price movement, outstanding positions and trading volume, as opposed to focusing on a company's fundamentals and, as such, may not match with a report on a
company's fundamental analysis. In addition MOST has different business segments / Divisions with independent research separated by Chinese walls catering to different set of customers having various objectives, risk profiles, investment horizon,
etc, and therefore may at times have different contrary views on stocks sectors and markets.
Unauthorized disclosure, use, dissemination or copying (either whole or partial) of this information, is prohibited. The person accessing this information specifically agrees to exempt MOSt or any of its affiliates or employees
from, any and all responsibility/liability arising from such misuse and agrees not to hold MOSt or any of its affiliates or employees responsible for any such misuse and further agrees to hold MOSt or any of its affiliates or
employees free and harmless from all losses, costs, damages, expenses that may be suffered by the person accessing this information due to any errors and delays. The information contained herein is based on publicly
available data or other sources believed to be reliable. Any statements contained in this report attributed to a third party represent MOSt’s interpretation of the data, information and/or opinions provided by that third party
either publicly or through a subscription service, and such use and interpretation have not been reviewed by the third party. This Report is not intended to be a complete statement or summary of the securities, markets or
developments referred to in the document. While we would endeavor to update the information herein on reasonable basis, MOSt and/or its affiliates are under no obligation to update the information. Also there may be
regulatory, compliance, or other reasons that may prevent MOSt and/or its affiliates from doing so. MOSt or any of its affiliates or employees shall not be in any way responsible and liable for any loss or damage that may
arise to any person from any inadvertent error in the information contained in this report. MOSt or any of its affiliates or employees do not provide, at any time, any express or implied warranty of any kind, regarding any
matter pertaining to this report, including without limitation the implied warranties of merchantability, fitness for a particular purpose, and non-infringement. The recipients of this report should rely on their own
investigations.
This report is intended for distribution to institutional investors. Recipients who are not institutional investors should seek advice of their independent financial advisor prior to taking any investment decision based on this
report or for any necessary explanation of its contents.
Most and it’s associates may have managed or co-managed public offering of securities, may have received compensation for investment banking or merchant banking or brokerage services, may have received any
compensation for products or services other than investment banking or merchant banking or brokerage services from the subject company in the past 12 months.
Most and it’s associates have not received any compensation or other benefits from the subject company or third party in connection with the research report.
Subject Company may have been a client of Most or its associates during twelve months preceding the date of distribution of the research report
MOSt and/or its affiliates and/or employees may have interests/positions, financial or otherwise of over 1 % at the end of the month immediately preceding the date of publication of the research in the securities mentioned
in this report. To enhance transparency, MOSt has incorporated a Disclosure of Interest Statement in this document. This should, however, not be treated as endorsement of the views expressed in the report.
Motilal Oswal Securities Limited is registered as a Research Analyst under SEBI (Research Analyst) Regulations, 2014. SEBI Reg. No. INH000000412
Pending Regulatory inspections against Motilal Oswal Securities Limited:
SEBI pursuant to a complaint from client Shri C.R. Mohanraj alleging unauthorized trading, issued a letter dated 29th April 2014 to MOSL notifying appointment of an Adjudicating Officer as per SEBI regulations to hold inquiry
and adjudge violation of SEBI Regulations; MOSL replied to the Show Cause Notice whereby SEBI granted us an opportunity of Inspection of Documents. Since all the documents requested by us were not covered we have
requested to SEBI vide our letter dated June 23, 2015 to provide pending list of documents for inspection.
List of associate companies of Motilal Oswal Securities Limited -Click
here to access detailed report
Analyst Certification
The views expressed in this research report accurately reflect the personal views of the analyst(s) about the subject securities or issues, and no part of the compensation of the research analyst(s) was, is, or will be directly or
indirectly related to the specific recommendations and views expressed by research analyst(s) in this report. The research analysts, strategists, or research associates principally responsible for preparation of MOSt research
receive compensation based upon various factors, including quality of research, investor client feedback, stock picking, competitive factors and firm revenues
MindTree
Disclosure of Interest Statement
Analyst ownership of the stock
No
Served as an officer, director or employee -
No
A graph of daily closing prices of securities is available at www.nseindia.com and http://economictimes.indiatimes.com/markets/stocks/stock-quotes
Regional Disclosures (outside India)
This report is not directed or intended for distribution to or use by any person or entity resident in a state, country or any jurisdiction, where such distribution, publication, availability or use would be contrary to law,
regulation or which would subject MOSt & its group companies to registration or licensing requirements within such jurisdictions.
For Hong Kong:
This report is distributed in Hong Kong by Motilal Oswal capital Markets (Hong Kong) Private Limited, a licensed corporation (CE AYY-301) licensed and regulated by the Hong Kong Securities and Futures
Commission (SFC) pursuant to the Securities and Futures Ordinance (Chapter 571 of the Laws of Hong Kong) “SFO”. As per SEBI (Research Analyst Regulations) 2014 Motilal Oswal Securities (SEBI Reg No. INH000000412) has
an agreement with Motilal Oswal capital Markets (Hong Kong) Private Limited for distribution of research report in Kong Kong. This report is intended for distribution only to “Professional Investors” as defined in Part I of
Schedule 1 to SFO. Any investment or investment activity to which this document relates is only available to professional investor and will be engaged only with professional investors.” Nothing here is an offer or solicitation
of these securities, products and services in any jurisdiction where their offer or sale is not qualified or exempt from registration. The Indian Analyst(s) who compile this report is/are not located in Hong Kong & are not
conducting Research Analysis in Hong Kong.
For U.S.
Motilal Oswal Securities Limited (MOSL) is not a registered broker - dealer under the U.S. Securities Exchange Act of 1934, as amended (the"1934 act") and under applicable state laws in the United States. In addition MOSL is
not a registered investment adviser under the U.S. Investment Advisers Act of 1940, as amended (the "Advisers Act" and together with the 1934 Act, the "Acts), and under applicable state laws in the United States.
Accordingly, in the absence of specific exemption under the Acts, any brokerage and investment services provided by MOSL, including the products and services described herein are not available to or intended for U.S.
persons.
This report is intended for distribution only to "Major Institutional Investors" as defined by Rule 15a-6(b)(4) of the Exchange Act and interpretations thereof by SEC (henceforth referred to as "major institutional investors").
This document must not be acted on or relied on by persons who are not major institutional investors. Any investment or investment activity to which this document relates is only available to major institutional investors
and will be engaged in only with major institutional investors. In reliance on the exemption from registration provided by Rule 15a-6 of the U.S. Securities Exchange Act of 1934, as amended (the "Exchange Act") and
interpretations thereof by the U.S. Securities and Exchange Commission ("SEC") in order to conduct business with Institutional Investors based in the U.S., MOSL has entered into a chaperoning agreement with a U.S.
registered broker-dealer, Motilal Oswal Securities International Private Limited. ("MOSIPL"). Any business interaction pursuant to this report will have to be executed within the provisions of this chaperoning agreement.
The Research Analysts contributing to the report may not be registered /qualified as research analyst with FINRA. Such research analyst may not be associated persons of the U.S. registered broker-dealer, MOSIPL, and
therefore, may not be subject to NASD rule 2711 and NYSE Rule 472 restrictions on communication with a subject company, public appearances and trading securities held by a research analyst account.
For Singapore
Motilal Oswal Capital Markets Singapore Pte Limited is acting as an exempt financial advisor under section 23(1)(f) of the Financial Advisers Act(FAA) read with regulation 17(1)(d) of the Financial Advisors Regulations and is a
subsidiary of Motilal Oswal Securities Limited in India. This research is distributed in Singapore by Motilal Oswal Capital Markets Singapore Pte Limited and it is only directed in Singapore to accredited investors, as defined in
the Financial Advisers Regulations and the Securities and Futures Act (Chapter 289), as amended from time to time.
In respect of any matter arising from or in connection with the research you could contact the following representatives of Motilal Oswal Capital Markets Singapore Pte Limited:
Varun Kumar
Varun.kumar@motilaloswal.com
Contact : (+65) 68189232
Office Address:21 (Suite 31),16 Collyer Quay,Singapore 04931
MINDTREE
Motilal Oswal Tower, Level 9, Sayani Road, Prabhadevi, Mumbai 400 025
Phone: +91 22 3982 5500 E-mail: reports@motilaloswal.com
Motilal Oswal Securities Ltd
19 January 2017
12