KPIT Technologies
BSE SENSEX
27,309
Bloomberg
Equity Shares (m)
M.Cap.(INRb)/(USDb)
52-Week Range (INR)
1, 6, 12 Rel. Per (%)
Avg Val, INRm
Free float (%)
S&P CNX
8,435
KPIT IN
197
27.3 / 0.4
197 / 108
-3/5/-12
144
83.3
19 January 2017
3QFY17 Results Update | Sector: Technology
CMP: INR138
TP: INR150 (+9%)
Neutral
Recovery rolled forward!
Financials & Valuations (INR b)
2016 2017E
Y/E Mar
32.2
33.1
Net Sales
4.4
3.5
EBITDA
3.0
2.1
PAT
14.1
11.7
EPS (INR)
19.0
-16.9
Gr. (%)
69.0
79.8
BV/Sh (INR)
21.0
14.0
RoE (%)
24.3
16.0
RoCE (%)
10.3
12.4
P/E (x)
2.1
1.8
P/BV (x)
Estimate change
TP change
Rating change
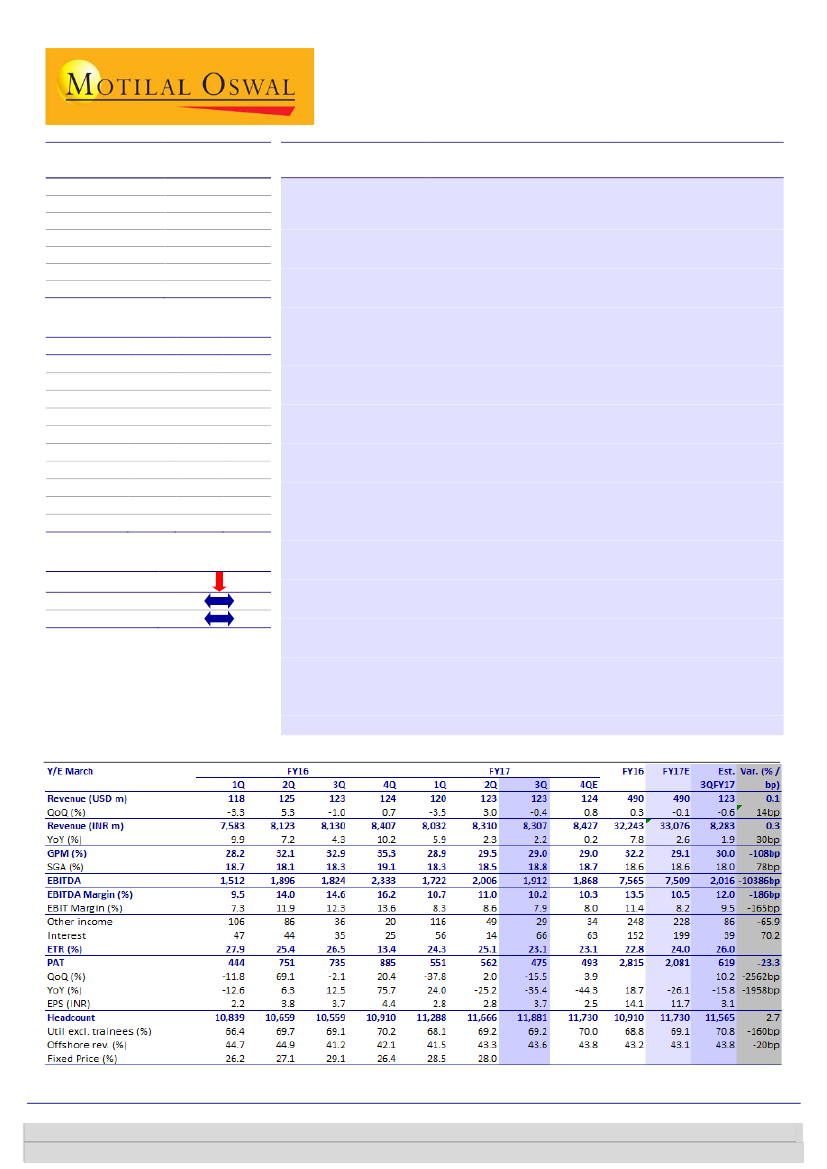
Revenue decline led by multiple issues:
KPIT’s 3QFY17 revenue of USD123m
(-0.6% QoQ) was in line with our estimate. Growth was bogged down by
seasonality, divestment in the functional safety business, cross-currency
headwinds and a decline in Telematics revenue. Even excluding non-
recurring factors, revenue came in flat. Revenue growth has failed to pick up
in 2H, despite investments made in the beginning of the year.
Recovery further delayed:
Organic revenue growth is not expected to pick
2018E
up in 4Q as well, pushing revival even further than initial estimates and
36.3
lowering the FY17 exit rate. Profitability took a hit as KPIT maintained hiring
4.4
for the last three quarters amid absence of revenue growth, resulting in
2.8
operational inefficiencies. Higher salary cost increases and lower utilization
13.8
18.2
impacted 3Q margins (-80bp QoQ to 10.2% v/s est. of 12.0%).
93.7
Product Engineering holding strong(er):
Portfolio issues have been weighing
15.9
on KPIT’s performance, with cloud migration impacting SBUs of SAP and IES.
18.6
Product Engineering, Products and Platforms have been consistent (growth
10.5
of 9.2% YoY) in 9MFY17 v/s flat overall revenue. In 3Q, it divested its
1.5
investment in Medini (functional safety product business) as the scope was
beyond focus verticals. It used the proceeds to invest in MicroFuzzy, an
electrical powertrain company, resulting in exceptional gains of INR261m.
Excluding this, PAT came in at INR475m (-16% QoQ), lower than our estimate
of INR619m (+10% QoQ).
Revenue revival key to re-rating:
Amid sluggish revenue growth momentum
and execution issues, profitability is likely to remain under pressure for a few
more quarters. We cut earnings by 11.5/6.1% for FY18/19E to factor in the
miss in 3Q and a further delay in recovery. Inconsistent revenue performance
and consequent volatility in profits are the key drags on valuation. We
maintain
Neutral
with a revised TP of INR150, discounting FY19E EPS by 10x.
Quarterly Performance (Consolidated)
Investors are advised to refer through important disclosures made at the last page of the Research Report.
Motilal Oswal research is available on www.motilaloswal.com/Institutional-Equities, Bloomberg, Thomson Reuters, Factset and S&P Capital.
Ashish Chopra
(Ashish.Chopra@MotilalOswal.com); +91 22 6129 1530
Sagar Lele
(Sagar.Lele@MotilalOswal.com); +91 22 6129 1531

KPIT Technologies
3QFY17: Flat revenue, led by seasonality and products
KPIT’s 3QFY17 revenue declined by 0.6% QoQ to USD123m, in line with our
expectation. The revenue decline was led by: [1] Seasonality: -2.5%; [2]
Divestment of functional safety business: -0.4%; and [3] Cross-currency
headwinds: -0.6%.
On a constant currency basis and excluding the impact of the divestment,
revenue grew by 0.6% in 3Q, in line with our estimate of 0.5% growth.
Revenue from the Telematics product was lower by USD0.5m, implying the
Services business was flat QoQ.
Earlier during the year, the management had guided for growth revival in
2HFY17, led by the sales and marketing hiring the company underwent in 1H.
However, growth hasn’t seen a pick-up yet.
In Rupee terms, revenue was INR8,307m, flat QoQ, v/s our estimate of
INR8,283m (-0.3% QoQ).
USD revenue - m
125.0
115.2
1.4%
8.5%
1.2%
126.4
122.4
-3.2%
118.3
5.3%
-3.3%
-1.0%
0.7%
-3.5%
124.6
Growth - QoQ (%)
123.3
124.2
119.8
123.4
3.0%
122.9
Exhibit 1: Revenue growth has faltered over the last couple of years
-0.4%
Source: MOSL, Company
Margins disappointment continues
Gross margin declined 50bp QoQ to 29.0% (estimate of 30%) and EBITDA
margins were down 80bp QoQ to 10.2% (estimate of 12.0%). EBITDA margins
declined by 440bp YoY, and revenue has remained flat.
Lower utilization and salary corrections to select people impacted profitability
during the quarter.
During the quarter, offshore utilization decreased to 67.8%, from 69.2% earlier.
Onsite utilization was steady at 89.2%, compared to 89.6% in the previous
quarter.
Exhibit 2: Wage hike and utilization weigh on margins
EBITDA margin (%)
20.7
16.4
17.2
18.7
18.1
18.3
SGA (%)
19.1
18.3
18.5
18.8
14.4
12.1
13.3
13.9
4.5
9.5
13.9
14.5
15.7
10.7
11.0
10.2
Source: MOSL, Company
19 January 2017
2

KPIT Technologies
Other income was at INR39m in 3Q, versus our estimate of INR86m. Interest
expenses were at INR66m in 3Q (expectation of INR39m).
Consequently, PAT declined by 15.5% QoQ to INR475m, against our expectation
of INR619m (10.2% QoQ).
Segment-wise performance: Growth led by SAP and Digital Transformation
In terms of geographies, while USA grew by 4.2% QoQ, Europe declined by
11.1% QoQ.
Among SBU’s, SAP (2.5% QoQ) and Digital Transformation (17.4% QoQ) saw
growth. However, all other SBUs declined, with the maximum de-growth seen in
Products & Platforms (-13.6% QoQ).
Amongst verticals, Automotive and Transportation declined by 4% QoQ, and
Energy & Utilities declined by 2.7% QoQ. There was growth seen in
manufacturing (5.5% QoQ).
Exhibit 3: Steep decline in Europe (sequential and annual)
Geographies
USA
Europe
Rest of the world
Contr. to
3Q Rev. (%)
70.1
14.4
15.5
Growth –
QoQ (%)
4.2
-11.1
-6.5
Growth –
YoY (%)
2.9
-15.8
22.2
Source: Company, MOSL
Exhibit 4: Growth in SAP and Digital Transformation
Lines of Business
IES
Product Engineering Services
Products & Platforms
SAP
Digital Transformation
Contr. to
3Q Rev. (%)
29.6
31.8
3.9
23.4
11.4
Growth –
QoQ (%)
-0.6
-4.5
-13.6
2.5
17.4
Growth –
YoY (%)
-2.3
4.0
38.3
-7.7
27.6
Source: Company, MOSL
Exhibit 5: Weakness seen in Automotive & Transportation
Verticals
Automotive & Transportation
Manufacturing
Energy & Utilities
Others
Contr. to
3Q Rev. (%)
39.3
37.2
14.1
9.4
Growth –
QoQ (%)
-4.0
5.5
-2.7
0.5
Growth –
YoY (%)
12.1
4.4
-29.0
27.8
Source: MOSL, Company
Revenues from the top client declined by 3.4% QoQ during the quarter. The
account had been under pressure for the last six quarters. The outlook for
growth in the top client remains subdued given the difficulties Cummins is facing
in multiple areas.
Top 2-5 customers declined by 1.9% QoQ and top 6-10 customers grew by 0.9%
QoQ.
Exhibit 6: Weakness aggravates in top client
Top Clients
Top Client - Cummins
Top 2-5 Clients
Top 6-10 Clients
Contr. to
3Q Rev. (%)
12.6
27.2
38.9
Growth –
QoQ (%)
-3.4
-1.9
0.9
Growth –
YoY (%)
-8.1
2.3
0.8
Source: Company, MOSL
19 January 2017
3

KPIT Technologies
Exhibit 7: Cummins under pressure since the past two years
Top Client - Cummins (USD m)
3.5
0.6
-6.2
-8.2
-5.2 -5.9 -5.3
YoY Growth (%)
8.7
-3.4
-8.6 -8.5
-10.4
26.0 28.2 29.5
-27.9
25.0 27.3 31.9 27.9 28.8 28.2 28.8
4.5
21.3
Exhibit 8: SAP performance volatile
SAP (USD m)
17.4
9.5
16.8
3.0
-12.5
-2.1
2.1
QoQ Gr (%)
0.2
18.3 18.6 18.4 18.3 16.8 17.7 17.3 17.3 15.3 16.2 15.5
Source: MOSL, Company
Takeaways from Management Commentary
Performance in 9MFY17:
Digital Transformation has been a strong area for KPIT,
with growth of 30% in 9MFY17, over the previous year. This now constitutes to
25% of IT revenue for KPIT. Apart from this, Product Engineering Services (PES)
has been better than company. While overall revenue has been flat YoY, PES
revenue has grown by 9% YoY.
Outlook for 4QFY17:
Revenue growth in 4Q is expected to be similar to that in
3Q. Top account pressures, absence of large implementation deals in the
market, pressure in the Energy vertical and completion of projects are expected
to weigh on revenue growth. Profitability too will consequently remain under
check.
Margin improvement could take 2-3 quarters:
Over the last three quarters, KPIT
has ramped up fresh hiring to rationalize its pyramid. In the process, it has hired
970 people YTD, of which 957 are freshers. However, revenue growth has failed
to revive creating operational inefficiencies. Margins are likely to be under
pressure till this equation stabilizes. Moreover, the company will be faced with a
wage hike in 1QFY18 which would also have a negative impact.
Account mining going well:
As planned, KPIT hired multiple account managers
to boost growth mining over the last three quarters. GAM accounts, in 9MFY17
grew by 9% YoY despite a decline in top client, validating the progress in the
strategy.
Change in estimates: Upward revision of 3/2% in FY17/18 estimates
Earlier, we were building in a recovery in both revenue growth and profitability
starting in 4QFY17. However, with guidance of a flattish 4Q, and margin
pressures for 2-3 quarters, our hopes of recovery have been pushed ahead.
The lower exit rate for FY17 has resulted in a cut in FY18/19E revenue estimates
of 1.7/2.7%. At the same time, right-shifting of profitability improvement has led
us to cut margin estimates by 130/60bp for FY18/19E.
Consequently, we have cut our EPS estimates for FY18/19E by 11.5/6.1%.
19 January 2017
4

KPIT Technologies
Exhibit 9: Change in estimates
FY16
INR/USD
67.5
USD Revenue (m)
490.0
USD revenue growth (%) (0.1)
EBITDA Margin (%)
10.5
EPS (INR)
11.7
EPS Growth (%)
(16.9)
Revised
FY17E
70.0
518.7
5.9
12.1
13.8
18.2
Earlier
Change
FY18E FY16 FY17E FY18E FY16
FY17E FY18E
70.4 67.5
70.0
70.4
0.0%
0.0%
0.0%
558.0 491.9 527.6 573.5 -0.4%
-1.7%
-2.7%
7.6
0.3
7.3
8.7
-40bp -140bp -110bp
12.4 12.1
13.4
13.0 -160bp -130bp -60bp
15.3 12.6
15.6
16.3
-7.4% -11.5% -6.1%
10.4 (10.3) 23.7
4.0
-660bp -550bp 640bp
Source: MOSL, Company
Valuation and view
KPIT has a sharp focus on Automotive Engineering Services, where it has seen
sustained growth over the last few years. Its leadership position in the segment,
and healthy growth potential in the foreseeable future auger well for overall
performance.
However, KPIT’s SAP segment has continued to elude stability – with a
significant slump (28% QoQ) in 4QFY15 revenues, followed by a strong rebound
of 7% YoY growth in FY16, and moderation at 2% YoY growth in 9MFY17. The
shift to cloud through Success Factors has hit deal sizes in the segment and KPIT
continues to grapple with the same. It has also started facing similar issues in
IES, leading to tepid growth expectations for both these segments. As a result,
Product Engineering Services remains the sole growth segment (which is also
currently under pressure because of client-specific issues).
4QFY15’s profitability miss was significant as margins plummeted to the lowest
levels in history. While this was marred by multiple one-offs, the company took
up the objective of profitability improvement and successfully managed to
regain lost ground through FY16. However, this proved out to be unsustainable
and reversed in 9MFY17 as the company faced revenue growth pressures.
With multiple pressure points on revenue, and the increasing need for
investments, both revenue growth and profitability are expected to be muted.
KPIT trades at 10.6x FY17E and 8.4x FY18E EPS. We expect the company to grow
its USD revenues at a CAGR of 4.4% over FY17-19E and EPS at a CAGR of 2.7%
during this period.
Relatively inferior performance and problems around consistency are likely to
keep valuations suppressed, especially in the absence of revenue growth.
Consequently, we maintain our NEUTRAL rating, with a revised one-year price
target of INR150, which discounts FY19E earnings by 10x.
Improved revenue growth outlook and consistency from segments
Progress on and acceleration in performance in ITS and Revolo
Reflection of growth measures in financial performance
Continued sluggishness in revenue growth
Risk from increasing adoption of cloud based Oracle services
Failure to resurrect profitability
Key triggers
Key risk factors
19 January 2017
5

KPIT Technologies
Exhibit 10: 1-year forward PE band
25
20
15
10
5
0
2.0
8.3
10.4
PE (x)
Peak(x)
Avg(x)
23.1
Min(x)
Exhibit 11: 1-year forward PB band
6.0
5.0
4.0
3.0
2.0
1.0
0.0
2.2
0.5
1.4
PB (x)
Peak(x)
Avg(x)
5.5
Min(x)
19 January 2017
6

KPIT Technologies
Story in charts
Exhibit 12: Offerings focused on select verticals, with mix of
IT and Engg
9.44
14.07
39.29
Automotive &
Transportation
Manufacturing
Energy & Utilities
37.2
Others
79.6
FY12
Source: Company, MOSL
99.0
FY13
Exhibit 13: Auto Engg to be the key growth driver going
forward
Auto & Engg Revenues (USD)
34.6%
24.4%
11.1%
110.1
FY14
147.7
FY15
34.2%
YoY growth
7.9%
159.4
FY16
9.3%
128.3
9MFY17
Source: Company, MOSL
Exhibit 14: SAP remains extremely volatile
SAP (USD m)
QoQ Gr (%)
17.4
16.8
9.5
3.0
-12.5
-27.9
26.0 28.2 29.5
21.3
25.0 27.3 31.9 27.9 28.8 28.2 28.8
Exhibit 15: Revenue growth revival not expected in FY17
USD revenue (m)
38.6
-2.1
2.1
33.6
YoY growth (%)
8.7
-3.4
4.5
8.3
10.1
0.3
(0.1)
490
5.9
519
7.6
558
307
FY12
Source: Company, MOSL
410
FY13
444
FY14
489
FY15
490
FY16
FY17E FY18E FY19E
Source: Company, MOSL
Exhibit 16: Margin recovery to be a function of revenue
growth
16.3%
13.9%
10.9%
15.7%
EBITDA margin
13.5%
10.5%
Exhibit 17: PAT decline in FY17E
PAT (INR m)
2,976
2,766
2,341
3,053
12.1% 12.4%
1,315
2,489
1,996
2,371
FY12
FY13
FY14
FY15
FY16
FY17E FY18E FY19E
Source: Company, MOSL
FY12
FY13
FY14
FY15
FY16
FY17E FY18E FY19E
Source: Company, MOSL
19 January 2017
7

KPIT Technologies
Exhibit 18: Operating metrics
3QFY15
Geography Analysis (%)
USA
Europe
ROW
LOB Analysis (%)
Integrated Enterprise Solutions
Auto & Engg
SAP
Business Transformation Unit
Customer Details
No. of Customers Added
No. of Active Customers
Customers with a runrate of > $1m
Top Customer - Cummins
Top 5 Customers (%)
Top 10 Customer (%)
Revenue Split (%)
Onsite Revenues
Offshore Revenues
Contract Type (%)
T&M
FP
Debtor Days
HR - Details
Development Team:
Onsite (Avg)
Offshore (Avg)
Onsite FTE
Offshore FTE
Total FTE
Development
Support
Marketing
Total
Utilization (%)
Onsite
Offshore (Incl. Trainees)
67.3
15.5
17.2
4QFY15
64.5
16.9
18.6
1QFY16
69.7
16.7
13.6
2QFY16
67.0
18.2
14.8
3QFY16
69.6
17.5
13.0
4QFY16
68.9
18.0
13.1
1QFY17
67.5
18.4
14.1
2QFY17
67.2
16.2
16.6
3QFY17
70.1
14.4
15.5
38.7
29.1
23.3
8.9
38.3
35.1
17.4
9.2
39.0
30.2
21.1
9.7
35.1
31.8
21.9
11.1
34.0
30.2
25.9
9.9
33.8
33.8
22.5
9.9
35.8
31.5
24.0
8.6
29.7
37.8
22.8
9.7
29.6
35.7
23.4
11.4
3
206
87
14.6
28.6
39.4
2
208
90
14.9
30.1
41.6
2
210
87
14.2
30.7
42.2
2
212
88
14.2
29.7
41.5
3
215
94
14.1
27.2
39.4
3
218
94
13.9
26.8
39.3
2
220
88
12.8
28.1
40.3
3
223
90
13.1
27.8
38.6
2
225
89
12.6
27.2
38.9
53.5
46.5
52.4
47.6
55.3
44.7
55.1
44.9
58.8
41.2
57.9
42.1
58.5
41.5
56.2
43.8
57.0
43.0
62.9
33.8
83
63.7
31.3
82
72.9
26.2
85
72.1
27.1
82
70.6
29.1
77
72.9
26.4
75
71.2
28.5
82
70.9
28.0
82
65.6
33.7
76
1,494
7,868
1,348
5,519
6,867
9,541
575
175
10,291
90.2
70.2
1,534
8,317
1,316
5,456
6,772
10,213
586
181
10,980
85.8
65.6
1,564
8,514
1,362
5,654
7,016
10,062
585
192
10,839
87.1
66.4
1,568
8,416
1,430
5,870
7,300
9,883
578
198
10,659
91.2
69.7
1,635
8,190
1,474
5,655
7,129
9,768
586
205
10,559
90.2
69.1
1,643
8,279
1,486
5,813
7,299
10,095
592
223
10,910
90.5
70.2
1,651
8,553
1,470
5,826
7,296
10,450
604
234
11,288
89.0
68.1
1,634
8,986
1,464
6,214
7,678
10,816
608
242
11,666
89.6
69.2
1,664
9,238
1,483
6,267
7,750
11,017
616
248
11,881
89.2
67.8
Source: Company, MOSL
19 January 2017
8

KPIT Technologies
Financials and Valuations
Key assumption
INR/USD Rate
Revenues (USD m)
Offshore Revenue (%)
Total Headcount
Net Addition
Per capita productivity (USD)
Offshore Utilization (%)
Onsite Utilization (%)
2012
48.5
307.3
52.1
7,719
1,205
39,808
72.6
91.9
2012
14,897
47.2
2,078
13.9
445
1,633
78
128
100
1,784
437
24.5
31
1,315
1,215
28.2
2012
356
6,769
7,125
334
1,189
8,649
1,853
0
6,983
4,380
1,838
766
4,714
2,269
8,649
2013
54.5
410.4
46.2
8,321
602
49,326
73.9
94.1
2013
22,386
50.3
3,650
16.3
466
3,184
154
-170
-13
2,847
766
26.9
86
1,996
2,009
65.3
2013
386
9,976
10,362
270
1,602
12,235
2,005
2,036
8,005
4,673
1,921
1,412
5,597
2,409
12,235
2014
60.6
444.3
46.0
9,296
975
47,798
72.1
91.1
2014
26,940
20.3
4,233
15.7
540
3,693
287
-74
98
3,430
941
27.4
0
2,489
2,391
19.1
2014
377
12,360
12,736
0
1,549
14,285
2,161
2,957
10,122
6,743
1,908
1,471
6,949
3,173
14,285
2015
61.1
489.0
46.5
10,980
1,684
44,536
69.3
89.5
2015
29,899
11.0
3,271
10.9
851
2,420
279
345
0
2,486
114
4.6
0
2,371
2,371
-0.8
2015
377
12,577
12,954
0
1,211
14,165
2,328
2,136
13,149
6,979
4,228
1,942
8,536
4,613
14,165
2016
65.8
490.3
43.2
10,910
(70)
44,942
68.8
89.7
2016
32,243
7.8
4,402
13.7
691
3,710
152
248
0
3,806
830
21.8
0
2,976
2,976
25.5
2016
383
13,424
13,807
0
2,189
15,996
2,850
2,300
12,777
6,861
4,333
1,583
5,956
6,821
15,996
2017E
67.5
490.0
43.1
11,730
820
41,773
69.1
89.0
2017E
33,076
2.6
3,485
10.5
778
2,707
199
228
261
2,998
657
21.9
0
2,341
2,080
-30.1
2017E
383
15,578
15,961
12
1,947
17,920
2,610
3,683
15,518
7,738
6,097
1,684
8,193
7,325
17,920
2018E
70.0
518.7
44.3
12,176
446
42,601
72.7
90.8
2018E
36,289
9.7
4,397
12.1
871
3,525
228
302
0
3,599
833
23.1
0
2,766
2,766
33.0
2018E
383
18,343
18,727
12
1,347
20,086
2,939
3,987
17,880
8,520
7,506
1,854
9,021
8,859
20,086
2019E
70.4
558.0
44.5
12,937
761
43,132
74.2
91.8
2019E
39,283
8.3
4,886
12.4
992
3,894
189
267
0
3,972
919
23.1
0
3,053
3,053
10.4
2019E
383
21,396
21,779
12
747
22,538
3,147
4,316
20,472
9,159
9,321
1,993
9,698
10,774
22,538
Income Statement
Y/E Mar
Net Sales
Change (%)
EBITDA
EBITDA Margin (%)
Depreciation
EBIT
Interest
Other Income
Extraordinary items
PBT
Tax
Tax Rate (%)
Min. Int. & Assoc. Share
Reported PAT
Adjusted PAT
Change (%)
(INR Million)
Balance Sheet
Y/E Mar
Share Capital
Reserves
Net Worth
Minority Interest
Debt
Total Capital Employed
Net Fixed Assets
Investments
Current Assets
Debtors
Cash & Bank
Loans & Adv, Others
Curr Liabs & Provns
Net Current Assets
Total Assets
(INR Million)
19 January 2017
9

KPIT Technologies
Financials and Valuations
Ratios
Y/E Mar
Basic (INR)
EPS
Cash EPS
Book Value
DPS
Payout (incl. Div. Tax.)
Valuation(x)
P/E
Cash P/E
Price / Book Value
EV/Sales
EV/EBITDA
Dividend Yield (%)
Profitability Ratios (%)
RoE
RoCE
RoIC
Turnover Ratios (%)
Fixed Asset Turnover (x)
Debtors (No. of Days)
Leverage Ratios (%)
Net Debt/Equity (x)
2012
8.0
9.1
39.0
0.7
8.7
2013
10.6
12.5
52.2
0.9
8.5
2014
12.9
14.9
64.6
1.1
8.6
2015
11.8
16.3
65.7
1.2
10.1
2016
14.1
17.5
69.0
1.5
10.6
2017E
11.7
14.3
79.8
2.0
17.1
2018E
13.8
18.2
93.7
2.0
14.5
2019E
15.3
20.2
108.9
2.0
13.1
18.1
15.9
3.7
1.7
12.1
0.5
18.5
20.6
20.3
8.8
107.3
-0.1
2012
1,978
-103
-870
0
1,005
-3,002
-1,998
174
0
-2,828
65
1,091
405
1,561
-263
2,100
1,838
13.7
11.6
2.8
1.2
7.6
0.6
23.0
30.5
27.2
11.5
76.2
0.0
2013
3,663
-1,377
-1,083
0
1,204
-1,730
-526
-1,769
0
-3,499
1,706
1,192
-148
2,749
454
1,467
1,921
11.3
9.8
2.2
1.0
6.4
0.8
20.5
27.5
23.0
12.9
91.4
0.0
2014
4,135
-1,375
-1,730
0
1,030
-2,023
-994
112
0
-1,912
75
951
-140
886
4
1,904
1,908
12.2
8.9
2.2
0.8
7.5
0.8
18.4
16.8
20.4
13.5
85.2
-0.2
2015
3,271
-121
880
0
4,029
-1,184
2,845
85
0
-1,099
0
-610
-184
-794
2,136
2,092
4,228
10.3
8.3
2.1
0.8
5.8
1.0
21.0
24.3
26.2
12.6
77.7
-0.2
2016
4,402
-1,004
-2,103
0
1,295
-1,214
81
0
0
-1,214
0
318
-2,970
-2,652
-2,571
6,904
4,333
12.4
10.1
1.8
0.7
6.6
1.4
14.0
16.0
17.5
12.2
85.4
-0.3
2017E
3,224
-331
1,259
0
4,152
-537
3,615
0
0
-537
0
-607
-4,282
-4,890
-1,274
7,371
6,097
10.5
8.0
1.5
0.6
4.8
1.4
15.9
18.6
22.2
13.2
85.7
-0.3
2018E
4,397
-709
-124
0
3,563
-1,200
2,363
0
0
-1,200
0
-828
-3,164
-3,992
-1,629
9,135
7,506
9.5
7.2
1.3
0.5
3.8
1.4
15.1
18.3
23.2
13.0
85.1
-0.4
2019E
4,886
-598
-101
0
4,187
-1,200
2,987
0
0
-1,200
0
-789
-3,422
-4,211
-1,224
10,544
9,321
Cash Flow Statement
Y/E Mar
Adjusted EBITDA
Non cash opr. exp (inc)
(Inc)/Dec in Wkg. Cap.
Other operating activities
CF from Op. Activity
(Inc)/Dec in FA & CWIP
Free cash flows
(Pur)/Sale of Invt
Others
CF from Inv. Activity
Inc/(Dec) in Net Worth
Inc / (Dec) in Debt
Divd Paid (incl Tax) & Others
CF from Fin. Activity
Inc/(Dec) in Cash
Add: Opening Balance
Closing Balance
(INR Million)
19 January 2017
10

KPIT Technologies
Corporate profile
Company description
KPIT Cummins is a leading technology solutions
partner for global manufacturing corporations, with
special focus on automotive, energy & utilities,
industrial
equipments
and
semiconductor
industries. With over USD463m revenue (LTM) and
9,933 employees, company continues to focus on
its chosen areas to grow, with equal thrust on
organic and inorganic approaches.
Exhibit 1: Sensex rebased
Source: MOSL/Bloomberg
Exhibit 2: Shareholding pattern (%)
Dec-16
Promoter
DII
FII
Others
16.7
1.1
57.4
24.8
Sep-16
16.7
1.4
55.8
26.0
Dec-15
17.3
1.9
53.1
27.7
Source: Capitaline
Exhibit 3: Top holders
Holder Name
Van Dyck
New Horizon Opportunites Master Fund
CX Partners Fund 1 Limited
Acacia Partners, LP
Acacia Institutional Partners, LP
% Holding
3.9
3.3
2.6
2.5
2.5
Source: Capitaline
Note: FII Includes depository receipts
Exhibit 4: Top management
Name
S B Ravi Pandit
Kishor Patil
Sneha Padve
Designation
Chairman & Group
CEO
Managing Director &
CEO
Company Secretary
Exhibit 5: Directors
Name
Adi Engineer
Anant Talaulicar
Lila Poonawalla
Sanjay Kukreja
Name
Alberto Sangiovanni Vincentelli
B V R Subbu
R A Mashelkar
Sachin Tikekar
*Independent
Source: Capitaline
Exhibit 6: Auditors
Name
BSR & Co LLP
Type
Statutory
Exhibit 7: MOSL forecast v/s consensus
EPS
(INR)
FY17
FY18
MOSL
forecast
11.7
13.8
Consensus
forecast
13.3
15.3
Variation (%)
-12.1
-10.1
Source: Bloomberg
Source: Capitaline
19 January 2017
11

Disclosures
This document has been prepared by Motilal Oswal Securities Limited (hereinafter referred to as Most) to provide information about the company (ies) and/sector(s), if any, covered in the report and may be distributed by it
and/or its affiliated company(ies). This report is for personal information of the selected recipient/s and does not construe to be any investment, legal or taxation advice to you. This research report does not constitute an
offer, invitation or inducement to invest in securities or other investments and Motilal Oswal Securities Limited (hereinafter referred as MOSt) is not soliciting any action based upon it. This report is not for public distribution
and has been furnished to you solely for your general information and should not be reproduced or redistributed to any other person in any form. This report does not constitute a personal recommendation or take into
account the particular investment objectives, financial situations, or needs of individual clients. Before acting on any advice or recommendation in this material, investors should consider whether it is suitable for their
particular circumstances and, if necessary, seek professional advice. The price and value of the investments referred to in this material and the income from them may go down as well as up, and investors may realize losses
on any investments. Past performance is not a guide for future performance, future returns are not guaranteed and a loss of original capital may occur.
MOSt and its affiliates are a full-service, integrated investment banking, investment management, brokerage and financing group. We and our affiliates have investment banking and other business relationships with a some
companies covered by our Research Department. Our research professionals may provide input into our investment banking and other business selection processes. Investors should assume that MOSt and/or its affiliates are
seeking or will seek investment banking or other business from the company or companies that are the subject of this material and that the research professionals who were involved in preparing this material may educate
investors on investments in such business . The research professionals responsible for the preparation of this document may interact with trading desk personnel, sales personnel and other parties for the purpose of
gathering, applying and interpreting information. Our research professionals are paid on twin parameters of performance & profitability of MOSt.
MOSt generally prohibits its analysts, persons reporting to analysts, and members of their households from maintaining a financial interest in the securities or derivatives of any companies that the analysts cover.
Additionally, MOSt generally prohibits its analysts and persons reporting to analysts from serving as an officer, director, or advisory board member of any companies that the analysts cover. Our salespeople, traders, and
other professionals or affiliates may provide oral or written market commentary or trading strategies to our clients that reflect opinions that are contrary to the opinions expressed herein, and our proprietary trading and
investing businesses may make investment decisions that are inconsistent with the recommendations expressed herein. In reviewing these materials, you should be aware that any or all of the foregoing among other things,
may give rise to real or potential conflicts of interest. MOSt and its affiliated company(ies), their directors and employees and their relatives may; (a) from time to time, have a long or short position in, act as principal in, and
buy or sell the securities or derivatives thereof of companies mentioned herein. (b) be engaged in any other transaction involving such securities and earn brokerage or other compensation or act as a market maker in the
financial instruments of the company(ies) discussed herein or act as an advisor or lender/borrower to such company(ies) or may have any other potential conflict of interests with respect to any recommendation and other
related information and opinions.; however the same shall have no bearing whatsoever on the specific recommendations made by the analyst(s), as the recommendations made by the analyst(s) are completely independent
of the views of the affiliates of MOSt even though there might exist an inherent conflict of interest in some of the stocks mentioned in the research report
Reports based on technical and derivative analysis center on studying charts company's price movement, outstanding positions and trading volume, as opposed to focusing on a company's fundamentals and, as such, may not match with a report on a
company's fundamental analysis. In addition MOST has different business segments / Divisions with independent research separated by Chinese walls catering to different set of customers having various objectives, risk profiles, investment horizon,
etc, and therefore may at times have different contrary views on stocks sectors and markets.
Unauthorized disclosure, use, dissemination or copying (either whole or partial) of this information, is prohibited. The person accessing this information specifically agrees to exempt MOSt or any of its affiliates or employees
from, any and all responsibility/liability arising from such misuse and agrees not to hold MOSt or any of its affiliates or employees responsible for any such misuse and further agrees to hold MOSt or any of its affiliates or
employees free and harmless from all losses, costs, damages, expenses that may be suffered by the person accessing this information due to any errors and delays. The information contained herein is based on publicly
available data or other sources believed to be reliable. Any statements contained in this report attributed to a third party represent MOSt’s interpretation of the data, information and/or opinions provided by that third party
either publicly or through a subscription service, and such use and interpretation have not been reviewed by the third party. This Report is not intended to be a complete statement or summary of the securities, markets or
developments referred to in the document. While we would endeavor to update the information herein on reasonable basis, MOSt and/or its affiliates are under no obligation to update the information. Also there may be
regulatory, compliance, or other reasons that may prevent MOSt and/or its affiliates from doing so. MOSt or any of its affiliates or employees shall not be in any way responsible and liable for any loss or damage that may
arise to any person from any inadvertent error in the information contained in this report. MOSt or any of its affiliates or employees do not provide, at any time, any express or implied warranty of any kind, regarding any
matter pertaining to this report, including without limitation the implied warranties of merchantability, fitness for a particular purpose, and non-infringement. The recipients of this report should rely on their own
investigations.
This report is intended for distribution to institutional investors. Recipients who are not institutional investors should seek advice of their independent financial advisor prior to taking any investment decision based on this
report or for any necessary explanation of its contents.
Most and it’s associates may have managed or co-managed public offering of securities, may have received compensation for investment banking or merchant banking or brokerage services, may have received any
compensation for products or services other than investment banking or merchant banking or brokerage services from the subject company in the past 12 months.
Most and it’s associates have not received any compensation or other benefits from the subject company or third party in connection with the research report.
Subject Company may have been a client of Most or its associates during twelve months preceding the date of distribution of the research report
MOSt and/or its affiliates and/or employees may have interests/positions, financial or otherwise of over 1 % at the end of the month immediately preceding the date of publication of the research in the securities mentioned
in this report. To enhance transparency, MOSt has incorporated a Disclosure of Interest Statement in this document. This should, however, not be treated as endorsement of the views expressed in the report.
Motilal Oswal Securities Limited is registered as a Research Analyst under SEBI (Research Analyst) Regulations, 2014. SEBI Reg. No. INH000000412
Pending Regulatory inspections against Motilal Oswal Securities Limited:
SEBI pursuant to a complaint from client Shri C.R. Mohanraj alleging unauthorized trading, issued a letter dated 29th April 2014 to MOSL notifying appointment of an Adjudicating Officer as per SEBI regulations to hold inquiry
and adjudge violation of SEBI Regulations; MOSL replied to the Show Cause Notice whereby SEBI granted us an opportunity of Inspection of Documents. Since all the documents requested by us were not covered we have
requested to SEBI vide our letter dated June 23, 2015 to provide pending list of documents for inspection.
List of associate companies of Motilal Oswal Securities Limited -Click
here to access detailed report
Analyst Certification
The views expressed in this research report accurately reflect the personal views of the analyst(s) about the subject securities or issues, and no part of the compensation of the research analyst(s) was, is, or will be directly or
indirectly related to the specific recommendations and views expressed by research analyst(s) in this report. The research analysts, strategists, or research associates principally responsible for preparation of MOSt research
receive compensation based upon various factors, including quality of research, investor client feedback, stock picking, competitive factors and firm revenues
KPIT Technologies
Disclosure of Interest Statement
Analyst ownership of the stock
No
Served as an officer, director or employee -
No
A graph of daily closing prices of securities is available at www.nseindia.com and http://economictimes.indiatimes.com/markets/stocks/stock-quotes
Regional Disclosures (outside India)
This report is not directed or intended for distribution to or use by any person or entity resident in a state, country or any jurisdiction, where such distribution, publication, availability or use would be contrary to law,
regulation or which would subject MOSt & its group companies to registration or licensing requirements within such jurisdictions.
For Hong Kong:
This report is distributed in Hong Kong by Motilal Oswal capital Markets (Hong Kong) Private Limited, a licensed corporation (CE AYY-301) licensed and regulated by the Hong Kong Securities and Futures
Commission (SFC) pursuant to the Securities and Futures Ordinance (Chapter 571 of the Laws of Hong Kong) “SFO”. As per SEBI (Research Analyst Regulations) 2014 Motilal Oswal Securities (SEBI Reg No. INH000000412) has
an agreement with Motilal Oswal capital Markets (Hong Kong) Private Limited for distribution of research report in Kong Kong. This report is intended for distribution only to “Professional Investors” as defined in Part I of
Schedule 1 to SFO. Any investment or investment activity to which this document relates is only available to professional investor and will be engaged only with professional investors.” Nothing here is an offer or solicitation
of these securities, products and services in any jurisdiction where their offer or sale is not qualified or exempt from registration. The Indian Analyst(s) who compile this report is/are not located in Hong Kong & are not
conducting Research Analysis in Hong Kong.
For U.S.
Motilal Oswal Securities Limited (MOSL) is not a registered broker - dealer under the U.S. Securities Exchange Act of 1934, as amended (the"1934 act") and under applicable state laws in the United States. In addition MOSL is
not a registered investment adviser under the U.S. Investment Advisers Act of 1940, as amended (the "Advisers Act" and together with the 1934 Act, the "Acts), and under applicable state laws in the United States.
Accordingly, in the absence of specific exemption under the Acts, any brokerage and investment services provided by MOSL, including the products and services described herein are not available to or intended for U.S.
persons.
This report is intended for distribution only to "Major Institutional Investors" as defined by Rule 15a-6(b)(4) of the Exchange Act and interpretations thereof by SEC (henceforth referred to as "major institutional investors").
This document must not be acted on or relied on by persons who are not major institutional investors. Any investment or investment activity to which this document relates is only available to major institutional investors
and will be engaged in only with major institutional investors. In reliance on the exemption from registration provided by Rule 15a-6 of the U.S. Securities Exchange Act of 1934, as amended (the "Exchange Act") and
interpretations thereof by the U.S. Securities and Exchange Commission ("SEC") in order to conduct business with Institutional Investors based in the U.S., MOSL has entered into a chaperoning agreement with a U.S.
registered broker-dealer, Motilal Oswal Securities International Private Limited. ("MOSIPL"). Any business interaction pursuant to this report will have to be executed within the provisions of this chaperoning agreement.
The Research Analysts contributing to the report may not be registered /qualified as research analyst with FINRA. Such research analyst may not be associated persons of the U.S. registered broker-dealer, MOSIPL, and
therefore, may not be subject to NASD rule 2711 and NYSE Rule 472 restrictions on communication with a subject company, public appearances and trading securities held by a research analyst account.
For Singapore
Motilal Oswal Capital Markets Singapore Pte Limited is acting as an exempt financial advisor under section 23(1)(f) of the Financial Advisers Act(FAA) read with regulation 17(1)(d) of the Financial Advisors Regulations and is a
subsidiary of Motilal Oswal Securities Limited in India. This research is distributed in Singapore by Motilal Oswal Capital Markets Singapore Pte Limited and it is only directed in Singapore to accredited investors, as defined in
the Financial Advisers Regulations and the Securities and Futures Act (Chapter 289), as amended from time to time.
In respect of any matter arising from or in connection with the research you could contact the following representatives of Motilal Oswal Capital Markets Singapore Pte Limited:
Varun Kumar
Varun.kumar@motilaloswal.com
Contact : (+65) 68189232
Office Address:21 (Suite 31),16 Collyer Quay,Singapore 04931
KPIT TECHNOLOGIES
Motilal Oswal Securities Ltd
19 January 2017
Motilal Oswal Tower, Level 9, Sayani Road, Prabhadevi, Mumbai 400 025
Phone: +91 22 3982 5500 E-mail: reports@motilaloswal.com
12