Jyothy Laboratories
BSE SENSEX
27,035
Bloomberg
Equity Shares (m)
M.Cap.(INRb)/(USDb)
52-Week Range (INR)
1, 6, 12 Rel. Per (%)
Avg Val, INRm/ Vol m
Free float (%)
S&P CNX
8,349
JYL IN
182
62.6 / 0.9
381 / 253
-3/22/13
47
33.1
20 January 2016
3QFY17 Results Update | Sector: Consumer
CMP: INR345
TP: INR365 (+6%)
Neutral
Resilient sales in a difficult environment; fabric care shines
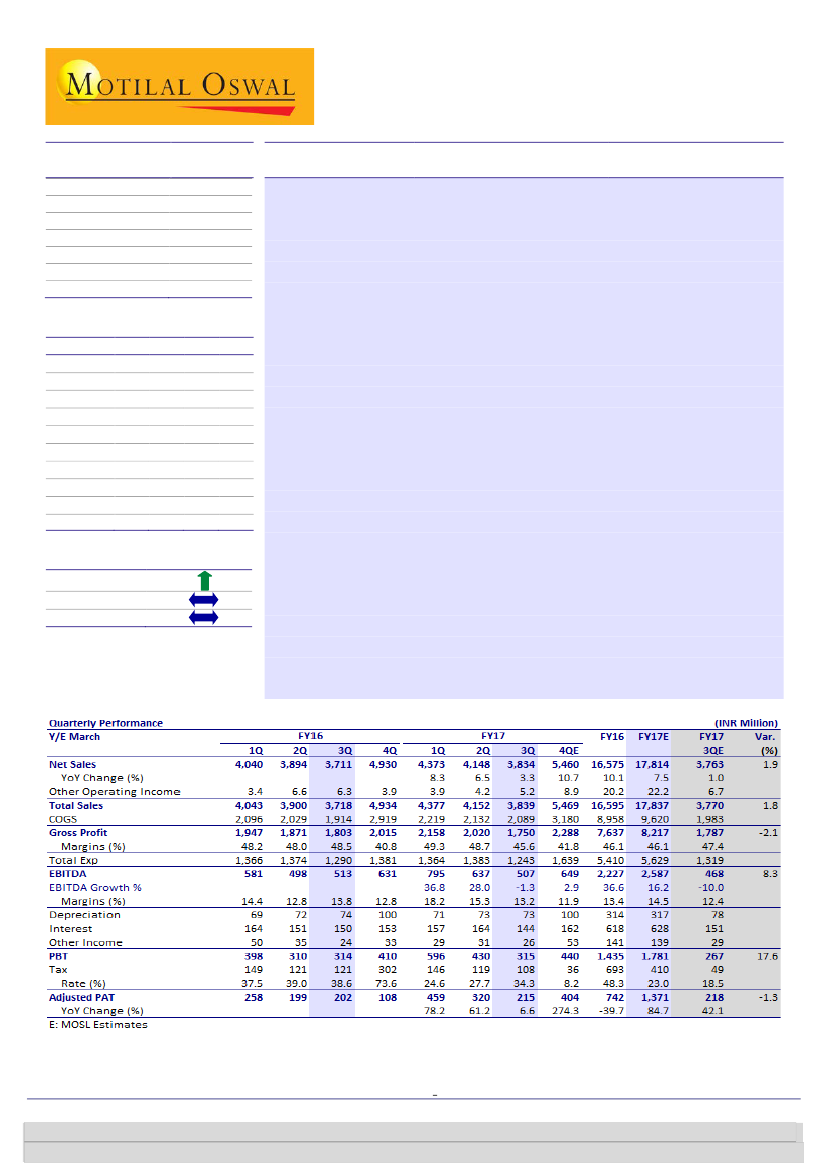
Consolidated net sales rose 3.3% YoY
to INR3.83b (Ind-AS; est. of +1% YoY to
INR3.76b). Overall volumes grew 3.6% YoY. Power brand sales rose 2.1% YoY,
with 2.6% volume growth. EBITDA declined 1.3% YoY to INR507m (est. of -10%
YoY to INR468m). PAT grew 6.6% YoY to INR215m (est. of 218m).
Consolidated gross margin contracted 290bp YoY
to 45.6% (est. of 47.4%), as
higher crude prices led to increased costs. However, savings on staff costs
(-50bp YoY) and lower A&P (-110bp YoY)/other expenses (-70bp YoY) restricted
consolidated EBITDA margin contraction to 60bp YoY to 13.2% (est. of 12.4%).
Segment-wise performance:
Fabric care sales grew 10.4% YoY, followed by
Dishwashing (+2.2%) and personal care (+1.4%). Mosquito repellent sales
(-15.2%), however, came in much lower than expectations. Among the major
brands, Ujala sales grew by 7.5% YoY, Henko by 20%, Exo by 2% and Pril by
2.7%. However, sales of Maxo (-15.2%) and Margo (-6%) disappointed.
Concall highlights:
(1) 3QFY17 was impacted by demonetization, but overall
demand is back to normal. (2) Input costs have started rising. Expect 5-7% price
increase/grammage reduction in 4QFY17 to protect margins. (3) A&P will be
back on track in 4Q at ~7-8% of sales (Ind-AS). (4) Henkel deal: 31
st
March 2017
is the deadline; can be extended by a couple of weeks if required.
Valuation and view:
JYL exhibited reasonable resilience in volume growth,
especially in a tough business environment post demonetization. However,
valuations are fair at 38.4x FY18 EPS and 22.4x FY18 EV/EBITDA. Upside on our
target price of INR364 (22x December 2018 EBITDA) is limited. Potential
speculation around Henkel call option will overshadow the underlying
fundamentals in the near term, in our view. Maintain
Neutral.
Financials & Valuations (INR b)
Y/E Mar
2016 2017E 2018E 2019E
Net Sales
16.6 17.8 20.2 23.3
EBITDA
2.2 2.6
2.9
3.2
PAT
0.7 1.4
1.6
1.9
EPS (INR)
4.1 7.6
9.0 10.5
Gr. (%)
-41.7 84.7 18.6 16.8
BV/Sh (INR) 46.7 49.8 54.3 60.4
RoE (%)
9.1 15.7 17.2 18.3
RoCE (%)
7.2 12.5 13.8 14.7
P/E (x)
84.1 45.5 38.4 32.9
EV/EBITDA
30.1 25.4 22.4 19.9
Estimate change
TP change
Rating change
Krishnan Sambamoorthy
(Krishnan.sambamoorthy@motilaloswal.com
); +91 22 3982 5428
Vishal Punmiya
(Vishal.Punmiya@motilaloswal.com ); +91 22 3980 4261
Investors are advised to refer through important disclosures made at the last page of the Research Report.
Motilal Oswal research is available on www.motilaloswal.com/Institutional-Equities, Bloomberg, Thomson Reuters, Factset and S&P Capital.

Jyothy Laboratories
Key quarterly charts
Exhibit 1: Category wise consolidated sales
Category
Fabric Care
Dishwashing
Household Insecticides
Personal Care
Other Products
Total
Laundry Service
Grand Total
* Sales are net of Excise duty
Q3FY16
1,566
1,222
534
343
81
3,746
130
3,876
Q3FY17
1,729
1,249
453
341
95
3,867
128
3,995
% Change
10.4
2.2
-15.2
-0.6
17.3
3.2
-1.5
3.1
Source: Company, MOSL
Exhibit 2: Brand wise consolidated sales
Brand
Ujala
Henko
Exo
Pril
Maxo
Margo
Total Power Brand
Others
Total
Laundry Services
Grand Total
* Sales are net of Excise duty
Q3FY16
914
363
929
297
534
297
3,334
411
3,745
130
3,875
Q3FY17
% Change
983
7.5
436
20.1
948
2.0
306
3.0
453
-15.2
279
-6.1
3,405
2.1
462
12.4
3,867
3.3
128
-1.5
3,995
3.1
Source: Company, MOSL
Key takeaways from the conference call
Demonetization impact
North and East business still remains challenging. Wholesale is much larger part
in these regions. Wholesale channel for Jyothy is 40% of sales. In November
wholesale channel sales were nearly zero after 8
th
November.
In December wholesale channel 75% back to Normal in South and East. In North
and East they will be at 50% of Normal. East is a particular problem.
Management believes demand will come back.
Consumers went on cash conservation mode and postponed discretionary
purchases.
Jyothy’s response to demonetization
Set up a daily monitoring cell at their office.
Focused on superior servicing especially in towns above 500,000 people.
Altered production plans to maximize production of small SKUs.
Did not extend any channel credit.
Company’s increased focus on modern trade also paid off.
November- Stemmed negative impact to 9% overall and 17% in General trade.
General trade was actually positive in December. Overall 13% growth in
December. Seeing double digit sales growth continuing in January. Part of these
sales may be channel filling.
Management believes that unorganized segment will continue to suffer.
Cut A&P in 3QFY17 to arrest margin impact. Did not hold back on innovation
however.
20 January 2017
2

Jyothy Laboratories
Input costs are going up affecting gross margins severely in 3QFY17. The
company held prices due to the difficult situation. Will take price increases in
4QFY17. Have already started price increases and grammage reduction.
Confident that gross margins will not dip YoY in 4QFY17. Expect 5-7% price
increase/ grammage reduction.
Appointing more distributors in smaller towns in North and East to check impact
on wholesale channel.
Key segment highlights
Fabric Care sales grew by 10% YoY and was helped by Henko which has a much
larger modern trade component and is mainly an urban product.
House Hold Insecticides has a large component in the wholesale channel
particularly in North and East and hence the 15% decline YoY.
Maxo for now struggling is a reality. Dip on EBIT margins was because both coils
and liquids suffered in 3QFY17 and there was no mix improvement. There will
be innovation in liquid vaporizer and continued A&P support behind this
segment.
Ujala Crisp and Shine growing at 20%. FY18 sales target INR 1bn. Sales was INR
409m in YTD FY17
Brands that need overhaul- Margo, will be restaged significantly going forward.
Ujala detergent will be rolled out to TN as well just like Crisp and Shine was.
Henko Matic 16% market share in Kerala.
Other key points
4QFY17 21% tax rate likely. FY18 also 21% tax rate guided for.
North East Capex will be as expected. 21% tax guidance is including tax benefits
from these units. Large part of manufacturing of key products will be shifted to
these units.
Amalgamation of subsidiary- Some final approvals awaited, expect this before
31
st
March 2017. Will have further tax benefits if the approval comes through.
A&P will be back on track in 4Q around 7-8% of sales (IND-AS).
Direct reach is just below 1 m outlets.
Henkel Deal
st
31 March 2017 is the deadline. Can be extended by a couple of weeks if
required.
Valuation and View
Company did well to report reasonable resilience on volume growth in a difficult
operating environment after implementation of demonetization. Valuations are
however fair at 38.4xFY18 EPS and 22.4xFY18 EV/EBITDA. Upside on our target
of INR364 (22x December 2018 EBITDA) is limited.
Potential speculation around Henkel call option will overshadow the underlying
fundamentals in the near term, in our view. Maintain Neutral.
20 January 2017
3

Jyothy Laboratories
Exhibit 3: Changes to the model have resulted in 5% change in FY17 and FY18 EPS
FY17E
17,814
2,587
1,371
New
FY18E
20,174
2,902
1,626
FY19E
23,256
3,242
1,899
FY17E
17,437
2,473
1,305
Old
FY18E
19,754
2,841
1,538
FY19E
22,779
3,185
1,820
FY17E
2.2%
4.6%
5.1%
Change (%)
FY18E
2.1%
2.1%
5.7%
FY19E
2.1%
1.8%
4.3%
Sales
EBITDA
PAT
Source: Company, MOSL
Exhibit 4: Valuation Matrix of coverage universe
Company
Consumer
Asian Paints
Britannia
Colgate
Dabur
Emami
Godrej Consumer
GSK Consumer
HUL
ITC
Jyothy Labs
Marico
Nestle
Page Industries
Parag Milk
Pidilite Inds.
P&G Hygiene
Radico Khaitan
United Brew.
United Spirits
Retail
Jubilant Foodworks
Shopper's Stop
Titan Company
Reco
Price
(INR)
Mkt Cap
EPS Growth YoY (%)
(USD M) FY16 FY17E FY18E
13,584
5,420
3,592
7,117
3,321
7,707
3,091
27,318
45,215
915
4,831
8,329
2,331
322
4,709
3,316
225
3,129
4,428
819
350
4,696
26.3
46.3
8.7
17.2
17.7
24.4
20.4
12.9
-3.5
-41.7
26.1
-7.3
18.7
-66.7
47.3
22.0
3.9
12.8
LP
-11.7
19.3
-13.4
7.7
0.8
-0.4
0.8
-1.9
10.8
-5.6
3.6
8.5
84.7
6.4
-7.0
18.6
4.6
10.9
6.6
-23.5
11.2
66.0
-28.1
-47.7
8.9
12.2
16.3
22.4
18.5
23.6
19.0
13.4
13.7
14.3
18.6
21.1
24.8
26.4
37.7
12.2
22.0
33.8
32.6
64.5
72.3
201.0
11.5
P/E (x)
EV/EBITDA (x)
RoE (%) Div. (%)
FY16 FY17E FY18E FY16 FY17E FY18E FY16
FY16
51.6
44.0
40.3
38.7
39.6
46.5
30.0
45.2
33.1
84.1
45.6
49.1
68.3
38.8
42.5
53.6
16.8
72.8
124.2
56.7
49.9
44.9
47.9
43.7
40.5
38.4
40.4
42.0
31.8
43.6
30.5
45.5
42.8
52.8
57.6
37.2
38.3
50.3
22.0
65.4
74.9
78.9
95.4
41.3
42.7
37.5
33.1
32.4
32.7
35.3
28.0
38.4
26.7
38.4
35.3
42.3
45.6
27.0
34.1
41.2
16.4
49.4
45.5
45.8
31.7
37.0
32.7
31.4
25.5
31.0
33.9
34.5
19.4
31.6
21.1
30.1
31.3
34.5
42.3
15.0
25.8
35.6
11.4
32.1
39.0
20.7
12.1
37.1
30.4
31.3
24.2
30.9
30.0
31.9
21.8
30.6
20.2
25.4
29.4
31.2
37.6
15.8
25.0
32.7
12.5
31.2
36.4
22.4
17.9
30.6
27.3
26.5
19.9
25.9
25.6
27.7
18.9
26.9
17.4
22.4
24.4
24.8
29.0
12.7
22.1
26.0
11.3
25.0
26.6
15.8
10.6
27.5
34.7
55.9
67.9
33.3
43.4
23.4
30.8
82.4
29.3
9.1
36.9
40.9
46.0
19.5
29.9
30.8
10.3
14.8
19.8
13.4
6.3
21.3
0.9
0.6
1.2
0.7
0.8
0.6
1.1
1.9
2.7
1.2
1.3
0.8
0.6
0.0
0.7
0.5
0.6
0.1
0.0
0.3
0.0
0.7
Neutral 966
Buy
3,082
Buy
901
Neutral 276
Buy
998
Neutral 1,544
Neutral 5,012
Neutral 861
Buy
255
Neutral 345
Buy
255
Neutral 5,891
Buy
14,250
Neutral 261
Buy
626
Buy
6,967
Neutral 116
Buy
807
Buy
2,078
Neutral
Neutral
Neutral
849
291
361
Note: For Nestle FY16 means CY15
Source: Company, MOSL
20 January 2017
4

Jyothy Laboratories
Financials and Valuations
Consolidated - Income Statement
Y/E March
Total Income from Operations
Change (%)
Other Operating Income
Total Income from Operations
Change (%)
Total Expenditure
% of Sales
EBITDA
Margin (%)
Depreciation
EBIT
Int. and Finance Charges
Other Income
PBT after EO Exp.
Current Tax
Tax Rate (%)
Less: Minority Interest
Adjusted PAT
Change (%)
FY13
11,042
21.0
18.0
11,060
21.1
9,760
88.4
1,299
11.8
224
1,075
682
50
12
-149
-1199.0
35
591
53.6
FY14
13,184
19.4
54.7
13,239
19.7
11,667
88.5
1,572
11.9
243
1,329
553
82
815
2
0.3
2
856
44.8
FY15
15,053
14.2
95.4
15,148
14.4
13,518
89.8
1,630
10.8
325
1,305
138
99
1,204
-6
-0.5
1
1,272
48.7
FY16
16,575
10.1
20.2
16,595
9.6
14,369
86.7
2,227
13.4
314
1,913
618
141
1,435
693
48.3
44
742
-41.7
FY17E
17,814
7.5
22.2
17,837
7.5
15,249
85.6
2,587
14.5
317
2,270
628
139
1,781
410
23.0
40
1,371
84.7
(INR Million)
FY18E
20,174
13.2
24.4
20,199
13.2
17,297
85.7
2,902
14.4
343
2,559
660
160
2,058
432
21.0
40
1,626
18.6
FY19E
23,256
15.3
26.9
23,283
15.3
20,041
86.2
3,242
13.9
362
2,880
660
183
2,403
505
21.0
40
1,899
16.8
Consolidated - Balance Sheet
Y/E March
Equity Share Capital
Total Reserves
Net Worth
Minority Interest
Deferred Liabilities
Total Loans
Capital Employed
Gross Block
Less: Accum. Deprn.
Net Fixed Assets
Capital WIP
Total Investments
Curr. Assets, Loans & Adv.
Inventory
Account Receivables
Cash and Bank Balance
Loans and Advances & Others
Curr. Liability & Prov.
Account Payables
Other Current Liabilities
Provisions
Net Current Assets
Appl. of Funds
E: MOSL Estimates
FY13
161
6,224
6,386
49
9
6,277
12,721
12,407
1,783
10,624
194
15
4,349
1,722
804
478
1,346
2,460
719
872
869
1,889
12,721
FY14
181
7,163
7,344
16
11
6,781
14,152
12,960
2,019
10,941
160
610
4,825
1,738
668
706
1,712
2,383
622
920
841
2,442
14,152
FY15
181
7,616
7,797
14
5
7,310
15,126
12,976
2,236
10,740
177
1,935
5,315
1,852
574
792
2,096
3,041
800
896
1,345
2,273
15,126
FY16
181
8,280
8,461
17
253
6,116
14,848
13,104
2,426
10,678
177
835
5,983
1,827
941
648
2,567
2,825
1,031
1,042
752
3,158
14,848
FY17E
181
8,844
9,025
17
253
6,116
15,410
13,354
2,743
10,610
177
835
7,564
1,980
707
2,026
2,852
3,777
919
1,303
1,555
3,788
15,410
(INR Million)
FY18E
181
9,662
9,843
17
253
6,116
16,229
14,104
3,087
11,017
177
835
8,538
2,102
761
2,679
2,996
4,338
1,061
1,628
1,648
4,200
16,229
FY19E
181
10,753
10,934
17
253
6,116
17,320
14,854
3,448
11,405
177
835
9,932
2,423
877
3,237
3,395
5,029
1,223
2,036
1,771
4,903
17,320
20 January 2017
5

Jyothy Laboratories
Financials and Valuations
Ratios
Y/E March
Basic (INR)
EPS
Cash EPS
BV/Share
DPS
Payout (%)
Valuation (x)
P/E
Cash P/E
P/BV
EV/Sales
EV/EBITDA
Dividend Yield (%)
FCF per share
Return Ratios (%)
RoE
RoCE
RoIC
Working Capital Ratios
Asset Turnover (x)
Inventory (Days)
Debtor (Days)
Creditor (Days)
Working Cap. Turnover (Days)
Debt/Equity
FY13
3.6
4.9
39.6
2.5
82.2
FY14
4.7
6.1
40.6
3.0
74.3
72.9
56.8
8.5
5.1
43.2
0.9
1.2
12.5
10.5
10.7
0.9
48.1
18.5
32.7
48.0
0.9
FY15
7.0
8.8
43.1
4.0
66.6
49.0
39.1
8.0
4.4
41.1
1.2
9.1
16.8
9.7
10.5
1.0
44.9
13.9
37.6
35.9
0.9
FY16
4.1
5.8
46.7
4.0
114.2
84.1
59.1
7.4
4.0
30.1
1.2
0.4
9.1
7.2
7.8
1.1
40.2
20.7
42.0
55.3
0.7
FY17E
7.6
9.3
49.8
4.0
61.8
45.5
37.0
6.9
3.7
25.4
1.2
12.3
15.7
12.5
13.7
1.2
40.6
14.5
34.9
36.1
0.7
FY18E
9.0
10.9
54.3
4.0
52.1
38.4
31.7
6.3
3.2
22.4
1.2
8.3
17.2
13.8
16.2
1.2
38.0
13.8
34.9
27.5
0.6
FY19E
10.5
12.5
60.4
4.0
44.6
32.9
27.6
5.7
2.8
19.9
1.2
7.8
18.3
14.7
17.8
1.3
38.0
13.8
34.7
26.1
0.6
0.7
-5.4
9.4
119.5
120.3
0.9
56.9
26.6
44.9
46.7
1.0
Consolidated - Cash Flow Statement
Y/E March
OP/(Loss) before Tax
Depreciation
Direct Taxes Paid
(Inc)/Dec in WC
CF from Operations
CF from Operating incl EO
(inc)/dec in FA
(Pur)/Sale of Investments
Others
CF from Investments
Issue of Shares
(Inc)/Dec in Debt
Interest Paid
Dividend Paid
Others
CF from Fin. Activity
Inc/Dec of Cash
Opening Balance
Closing Balance
E: MOSL Estimates
FY13
197
224
-152
-543
-274
-274
-594
0
-594
190
617
-486
341
664
-205
680
475
FY14
814
243
2
-324
736
736
-527
-595
-1,121
779
504
-635
-33
615
229
475
704
FY15
1,211
325
-6
254
1,785
1,785
-142
-1,326
-1,468
0
529
-847
90
-229
88
704
793
FY16
786
314
248
-1,029
319
319
-252
1,100
849
519
-1,694
-848
710
-1,313
-145
793
647
FY17E
1,411
317
0
748
2,477
2,477
-250
0
-250
501
-501
-848
1
-848
1,379
647
2,026
(INR Million)
FY18E
1,666
343
0
241
2,250
2,250
-750
0
-750
501
-501
-848
0
-848
652
2,026
2,679
FY19E
1,939
362
0
-145
2,156
2,156
-750
0
-750
501
-501
-848
0
-848
558
2,679
3,237
20 January 2017
6

Jyothy Laboratories
Corporate profile
Company description
Exhibit 1: Sensex rebased
Jyothy Labs was founded in 1983 by Mr M P
Ramachandran in Thrissur, Kerala. Traditionally a
single product company (Ujala Supreme), JYL has
grown to be a multi-brand, multi-category player,
with operations all over India.
Source: MOSL/Bloomberg
Exhibit 2: Shareholding pattern (%)
Dec-16
Promoter
DII
FII
Others
66.9
10.9
13.3
8.9
Sep-16
66.9
9.7
13.1
10.3
Dec-15
66.7
9.3
14.8
9.2
Source: Capitaline
Exhibit 3: Top holders
Holder Name
Icici Prudential Life Insurance Company Ltd
Fidelity Investment Trust - Fidelity Series
International Small Cap Fund
Emblem Fii
Parvest Equity India
Hasham Investment And Trading Company
Private Limited
% Holding
3.3
2.0
1.7
1.5
1.4
Source: Capitaline
Note: FII Includes depository receipts
Exhibit 4: Top management
Name
M P Ramachandran
S Raghunandan
M L Bansal
K Ullas Kamath
Designation
Chairman & Managing Director
Whole Time Director & CEO
Company Secretary
Joint MD & CFO
Exhibit 5: Directors
Name
Bipin R Shah
Nilesh B Mehta
M R Jyothy
Name
K P Padmakumar
Ramakrishnan
Lakshminarayanan
Source: Capitaline
*Independent
Exhibit 6: Auditors
Name
Mahajan & Aibara
R Nanabhoy & Co
Rathi & Associates
S R B C & Co LLP
Internal
Cost Auditor
Secretarial Audit
Statutory
Source: Capitaline
Type
Exhibit 7: MOSL forecast v/s consensus
EPS
(INR)
FY17
FY18
MOSL
forecast
7.6
9.0
Consensus
forecast
9.4
11.6
Variation (%)
-18.9
-22.6
Source: Bloomberg
20 January 2017
7

Disclosures
This document has been prepared by Motilal Oswal Securities Limited (hereinafter referred to as Most) to provide information about the company (ies) and/sector(s), if any, covered in the report and may be distributed by it and/or its
Jyothy Laboratories
affiliated company(ies). This report is for personal information of the selected recipient/s and does not construe to be any investment, legal or taxation advice to you. This research report does not constitute an offer, invitation or
inducement to invest in securities or other investments and Motilal Oswal Securities Limited (hereinafter referred as MOSt) is not soliciting any action based upon it. This report is not for public distribution and has been furnished to
you solely for your general information and should not be reproduced or redistributed to any other person in any form. This report does not constitute a personal recommendation or take into account the particular investment
objectives, financial situations, or needs of individual clients. Before acting on any advice or recommendation in this material, investors should consider whether it is suitable for their particular circumstances and, if necessary, seek
professional advice. The price and value of the investments referred to in this material and the income from them may go down as well as up, and investors may realize losses on any investments. Past performance is not a guide for
future performance, future returns are not guaranteed and a loss of original capital may occur.
MOSt and its affiliates are a full-service, integrated investment banking, investment management, brokerage and financing group. We and our affiliates have investment banking and other business relationships with a some
companies covered by our Research Department. Our research professionals may provide input into our investment banking and other business selection processes. Investors should assume that MOSt and/or its affiliates are
seeking or will seek investment banking or other business from the company or companies that are the subject of this material and that the research professionals who were involved in preparing this material may educate investors
on investments in such business . The research professionals responsible for the preparation of this document may interact with trading desk personnel, sales personnel and other parties for the purpose of gathering, applying and
interpreting information. Our research professionals are paid on twin parameters of performance & profitability of MOSt.
MOSt generally prohibits its analysts, persons reporting to analysts, and members of their households from maintaining a financial interest in the securities or derivatives of any companies that the analysts cover. Additionally, MOSt
generally prohibits its analysts and persons reporting to analysts from serving as an officer, director, or advisory board member of any companies that the analysts cover. Our salespeople, traders, and other professionals or affiliates
may provide oral or written market commentary or trading strategies to our clients that reflect opinions that are contrary to the opinions expressed herein, and our proprietary trading and investing businesses may make investment
decisions that are inconsistent with the recommendations expressed herein. In reviewing these materials, you should be aware that any or all of the foregoing among other things, may give rise to real or potential conflicts of interest.
MOSt and its affiliated company(ies), their directors and employees and their relatives may; (a) from time to time, have a long or short position in, act as principal in, and buy or sell the securities or derivatives thereof of companies
mentioned herein. (b) be engaged in any other transaction involving such securities and earn brokerage or other compensation or act as a market maker in the financial instruments of the company(ies) discussed herein or act as an
advisor or lender/borrower to such company(ies) or may have any other potential conflict of interests with respect to any recommendation and other related information and opinions.; however the same shall have no bearing
whatsoever on the specific recommendations made by the analyst(s), as the recommendations made by the analyst(s) are completely independent of the views of the affiliates of MOSt even though there might exist an inherent
conflict of interest in some of the stocks mentioned in the research report Reports based on technical and derivative analysis center on studying charts company's price movement, outstanding positions and trading volume, as
opposed to focusing on a company's fundamentals and, as such, may not match with a report on a company's fundamental analysis. In addition MOST has different business segments / Divisions with independent research
separated by Chinese walls catering to different set of customers having various objectives, risk profiles, investment horizon, etc, and therefore may at times have different contrary views on stocks sectors and markets.
Unauthorized disclosure, use, dissemination or copying (either whole or partial) of this information, is prohibited. The person accessing this information specifically agrees to exempt MOSt or any of its affiliates or employees from,
any and all responsibility/liability arising from such misuse and agrees not to hold MOSt or any of its affiliates or employees responsible for any such misuse and further agrees to hold MOSt or any of its affiliates or employees free
and harmless from all losses, costs, damages, expenses that may be suffered by the person accessing this information due to any errors and delays. The information contained herein is based on publicly available data or other
sources believed to be reliable. Any statements contained in this report attributed to a third party represent MOSt’s interpretation of the data, information and/or opinions provided by that third party either publicly or through a
subscription service, and such use and interpretation have not been reviewed by the third party. This Report is not intended to be a complete statement or summary of the securities, markets or developments referred to in the
document. While we would endeavor to update the information herein on reasonable basis, MOSt and/or its affiliates are under no obligation to update the information. Also there may be regulatory, compliance, or other reasons that
may prevent MOSt and/or its affiliates from doing so. MOSt or any of its affiliates or employees shall not be in any way responsible and liable for any loss or damage that may arise to any person from any inadvertent error in the
information contained in this report. MOSt or any of its affiliates or employees do not provide, at any time, any express or implied warranty of any kind, regarding any matter pertaining to this report, including without limitation the
implied warranties of merchantability, fitness for a particular purpose, and non-infringement. The recipients of this report should rely on their own investigations.
This report is intended for distribution to institutional investors. Recipients who are not institutional investors should seek advice of their independent financial advisor prior to taking any investment decision based on this report or for
any necessary explanation of its contents.
Most and it’s associates may have managed or co-managed public offering of securities, may have received compensation for investment banking or merchant banking or brokerage services, may have received any compensation
for products or services other than investment banking or merchant banking or brokerage services from the subject company in the past 12 months.
Most and it’s associates have not received any compensation or other benefits from the subject company or third party in connection with the research report.
Subject Company may have been a client of Most or its associates during twelve months preceding the date of distribution of the research report
MOSt and/or its affiliates and/or employees may have interests/positions, financial or otherwise of over 1 % at the end of the month immediately preceding the date of publication of the research in the securities mentioned in this
report. To enhance transparency, MOSt has incorporated a Disclosure of Interest Statement in this document. This should, however, not be treated as endorsement of the views expressed in the report.
Motilal Oswal Securities Limited is registered as a Research Analyst under SEBI (Research Analyst) Regulations, 2014. SEBI Reg. No. INH000000412
Pending Regulatory inspections against Motilal Oswal Securities Limited:
SEBI pursuant to a complaint from client Shri C.R. Mohanraj alleging unauthorized trading, issued a letter dated 29th April 2014 to MOSL notifying appointment of an Adjudicating Officer as per SEBI regulations to hold inquiry and
adjudge violation of SEBI Regulations; MOSL replied to the Show Cause Notice whereby SEBI granted us an opportunity of Inspection of Documents. Since all the documents requested by us were not covered we have requested to
SEBI vide our letter dated June 23, 2015 to provide pending list of documents for inspection.
List of associate companies of Motilal Oswal Securities Limited -Click
here to access detailed report
Analyst Certification
The views expressed in this research report accurately reflect the personal views of the analyst(s) about the subject securities or issues, and no part of the compensation of the research analyst(s) was, is, or will be directly or
indirectly related to the specific recommendations and views expressed by research analyst(s) in this report. The research analysts, strategists, or research associates principally responsible for preparation of MOSt research receive
compensation based upon various factors, including quality of research, investor client feedback, stock picking, competitive factors and firm revenues
Disclosure of Interest Statement
Analyst ownership of the stock
Served as an officer, director or employee
JYOTHY LABORATORIES
No
No
A graph of daily closing prices of securities is available at www.nseindia.com and http://economictimes.indiatimes.com/markets/stocks/stock-quotes
Regional Disclosures (outside India)
This report is not directed or intended for distribution to or use by any person or entity resident in a state, country or any jurisdiction, where such distribution, publication, availability or use would be contrary to law, regulation or which
would subject MOSt & its group companies to registration or licensing requirements within such jurisdictions.
For Hong Kong:
This report is distributed in Hong Kong by Motilal Oswal capital Markets (Hong Kong) Private Limited, a licensed corporation (CE AYY-301) licensed and regulated by the Hong Kong Securities and Futures
Commission (SFC) pursuant to the Securities and Futures Ordinance (Chapter 571 of the Laws of Hong Kong) “SFO”. As per SEBI (Research Analyst Regulations) 2014 Motilal Oswal Securities (SEBI Reg No. INH000000412) has
an agreement with Motilal Oswal capital Markets (Hong Kong) Private Limited for distribution of research report in Kong Kong. This report is intended for distribution only to “Professional Investors” as defined in Part I of Schedule 1 to
SFO. Any investment or investment activity to which this document relates is only available to professional investor and will be engaged only with professional investors.” Nothing here is an offer or solicitation of these securities,
products and services in any jurisdiction where their offer or sale is not qualified or exempt from registration. The Indian Analyst(s) who compile this report is/are not located in Hong Kong & are not conducting Research Analysis in
Hong Kong.
For U.S
Motilal Oswal Securities Limited (MOSL) is not a registered broker - dealer under the U.S. Securities Exchange Act of 1934, as amended (the"1934 act") and under applicable state laws in the United States. In addition MOSL is not a
registered investment adviser under the U.S. Investment Advisers Act of 1940, as amended (the "Advisers Act" and together with the 1934 Act, the "Acts), and under applicable state laws in the United States. Accordingly, in the
absence of specific exemption under the Acts, any brokerage and investment services provided by MOSL, including the products and services described herein are not available to or intended for U.S. persons.
This report is intended for distribution only to "Major Institutional Investors" as defined by Rule 15a-6(b)(4) of the Exchange Act and interpretations thereof by SEC (henceforth referred to as "major institutional investors"). This
document must not be acted on or relied on by persons who are not major institutional investors. Any investment or investment activity to which this document relates is only available to major institutional investors and will be
engaged in only with major institutional investors. In reliance on the exemption from registration provided by Rule 15a-6 of the U.S. Securities Exchange Act of 1934, as amended (the "Exchange Act") and interpretations thereof by
the U.S. Securities and Exchange Commission ("SEC") in order to conduct business with Institutional Investors based in the U.S., MOSL has entered into a chaperoning agreement with a U.S. registered broker-dealer, Motilal Oswal
Securities International Private Limited. ("MOSIPL"). Any business interaction pursuant to this report will have to be executed within the provisions of this chaperoning agreement.
The Research Analysts contributing to the report may not be registered /qualified as research analyst with FINRA. Such research analyst may not be associated persons of the U.S. registered broker-dealer, MOSIPL, and therefore,
may not be subject to NASD rule 2711 and NYSE Rule 472 restrictions on communication with a subject company, public appearances and trading securities held by a research analyst account.
For Singapore
Motilal Oswal Capital Markets Singapore Pte Limited is acting as an exempt financial advisor under section 23(1)(f) of the Financial Advisers Act(FAA) read with regulation 17(1)(d) of the Financial Advisors Regulations and is a
subsidiary of Motilal Oswal Securities Limited in India. This research is distributed in Singapore by Motilal Oswal Capital Markets Singapore Pte Limited and it is only directed in Singapore to accredited investors, as defined in the
Financial Advisers Regulations and the Securities and Futures Act (Chapter 289), as amended from time to time.
In respect of any matter arising from or in connection with the research you could contact the following representatives of Motilal Oswal Capital Markets Singapore Pte Limited:
Varun Kumar
Varun.kumar@motilaloswal.com
Contact : (+65) 68189232
Office Address:21 (Suite 31),16 Collyer Quay,Singapore 04931
Motilal Oswal Securities Ltd
20 January 2017
Motilal Oswal Tower, Level 9, Sayani Road, Prabhadevi, Mumbai 400 025
Phone: +91 22 3982 5500 E-mail: reports@motilaloswal.com
8