Ultratech Cement
BSE SENSEX
27,117
Bloomberg
Equity Shares (m)
M.Cap.(INRb)/(USDb)
52-Week Range (INR)
1, 6, 12 Rel. Per (%)
Avg Val, INRm
Free float (%)
S&P CNX
8,392
UTCEM IN
Volumes surprise led by market share gains
274.4
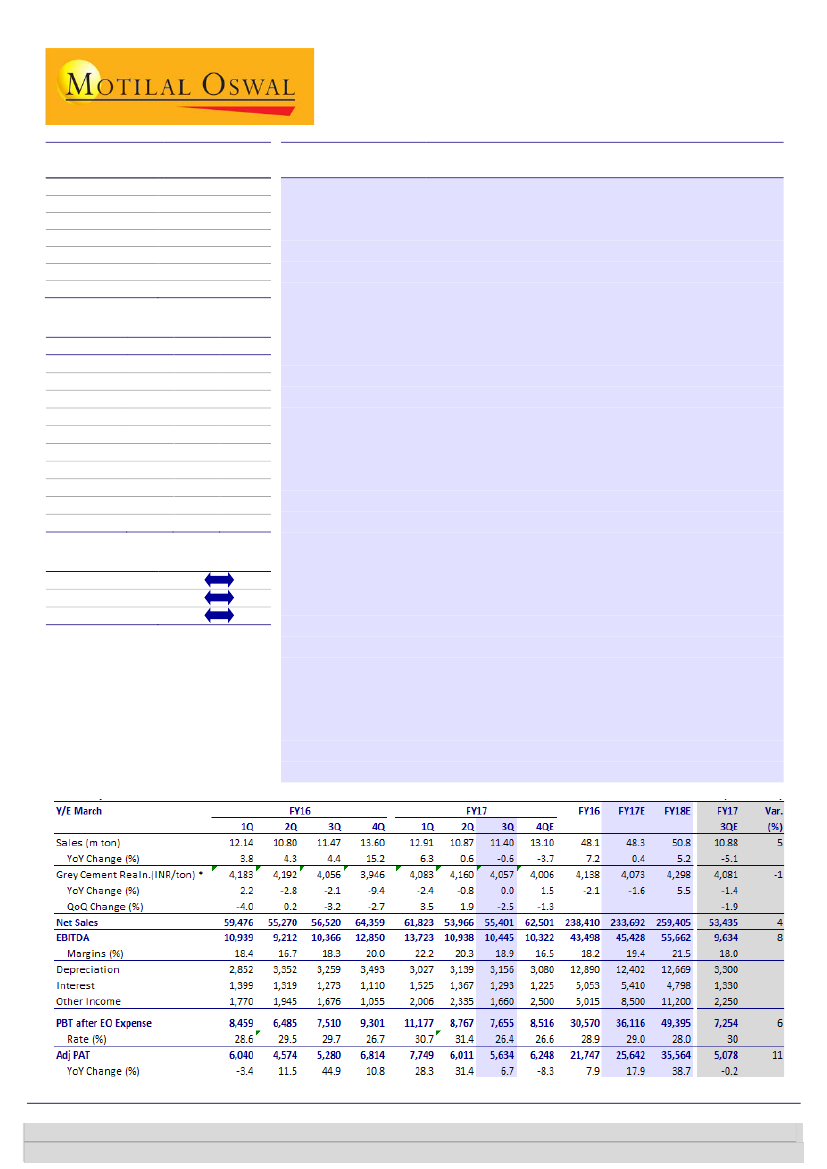
Modest volume decline:
UTCEM’s 3QFY17 revenue declined 2% YoY to
965.2 / 14.4
INR55.4b (estimate: INR53.43b). Its gray cement volume declined only 0.6%
4130 / 2680
YoY, led by higher exports (+90% YoY; ramp up of Gujarat unit). PAT grew 7%
9/0/18
1106
YoY to INR5.6b, aided by lower depreciation and lower tax expenses.
37.7
Cost control helps to partially offset weak realizations:
Gray cement
23 January 2017
3QFY17 Results Update | Sector: Cement
CMP: INR3,518
TP: INR4,058(+15%)
Buy
Financials & Valuations (INR b)
Y/E Mar
2016 2017E
Net Sales
238.4 233.7
EBITDA
43.5
45.4
PAT
21.7
25.6
EPS (INR)
79.3
93.5
Gr. (%)
7.9
17.9
BV/Sh (INR)
755.8 837.6
RoE (%)
11.0
11.7
RoCE (%)
9.3
10.1
P/E (x)
44.4
37.6
P/BV (x)
4.7
4.2
2018E
259.4
55.7
35.6
129.6
38.7
949.8
14.5
12.3
27.1
3.7
Estimate change
TP change
Rating change
Quarterly Performance (Consolidated)
realization declined 2.5% QoQ to INR4,057/ton due to weak realization in
December. However, UTCEM’s trend of consistent cost improvement
continued, with unitary cost at INR3,832/ton (-2% YoY; flat QoQ).The cost
savings were driven by lower power and fuel cost (better power
consumption) and freight cost (lower lead distance). EBITDA rose 1% YoY to
INR10.4b (our estimate: INR9.6b), translating to EBITDA/ton of INR903 (-
INR89 QoQ; +INR25 YoY) and margin of 18.9% (-1.4pp QoQ; +0.6pp YoY).
Other highlights:
(a) JPA assets operating at 30% utilization; acquisition to
be completed by end-FY17/1QFY18; (b) Capacity expansion of 3.5m tons in
Dhar in MP at cost of USD110/ton likely to be commissioned by 4QFY19; (c)
Capacity utilization at 67% for UTCEM v/s industry utilization of ~60%.
Management commentary:
(1) Demand in South/East markets to remain
buoyant; (2) North likely to see some pressure on volumes due to state
elections; (3) Demand growth in 4Q to be a challenge due to high base; (4)
December realization 4% lower than average of 3QFY17; (5) Impact of power
& fuel cost to the extent of USD5/ton increase in petcoke prices in 4QFY17.
Valuation and view:
Even in challenging times post demonetization,
UTCEM’s strong focus on market share gain and cost efficiency have helped
deliver better than estimated results. It is a strong bet on the cycle upturn,
and in our view, success in asset creation should overshadow any near-term
concerns for long-term investors. We factor in 5-6% volume CAGR and 21%
EBITDA CAGR over FY17-19. We value UTCEM at INR4,058 (EV of 15x FY19E
EBITDA and USD225/ton).
(INR Million)
Investors are advised to refer through important disclosures made at the last page of the Research Report.
Motilal Oswal research is available on www.motilaloswal.com/Institutional-Equities, Bloomberg, Thomson Reuters, Factset and S&P Capital.
Abhishek Ghosh
(Abhishek.Ghosh@motilaloswal.com); +91 22 3982 5436
Varun Gadia
(Varun.Gadia@motilaloswal.com); +91 22 3982 5446

Ultratech Cement
Volume decline restricted led by higher exports; realization impacted
UTCEM’s 3QFY17 domestic cement volume declined 2.2%YoY to 11.0mt (est. -
5% YoY) led by market share gain. Exports increased 90% YoY to 0.39mt led by
ramp up of its unit in West.
Pricing decline was lower than expectation at 2.5% QoQ (flat YoY), as December
realizations were impacted by demonetization. Exit prices of December-16 were
4% lower compared to average prices of 3QFY17 indicating weak pricing in
4QFY17. While there are some price hikes in select regions, we estimate
realization decline sequentially for Ultratech.
Cement revenue remained largely flattish at INR46.3b (-1% YoY), while RMC and
White cement revenues declined 5% and 12% YoY respectively due to the
impact of demonetization. Hence total revenue at
INR55.4b declined 2%YoY.
Exhibit 2: Grey cement realizations declined 2%QoQ
Realizations (INR/ton)
6
1
-1
15
4
-3
4 4
Growth (%)
Exhibit 1: Cement volume declined at 1% YoY
Volume (m ton)
16
12
9
10
1
-2 -4 -2
-1 0
5
Source: Company, MOSL
Exhibit 3: Total Costs per Tonne declined YoY due to lower power and fuel cost
Source: MOSL, Company
Cost savings partially negate impact of weak realizations
UTCEM recorded 0.6pp YoY expansion in margins at 18.9% (-1.4pp YoY), led by
significant improvement in unitary costs despite cost escalation in fuel prices.
UTCEM’s unitary cost was down 2% YoY on account of (a) savings in energy cost
led by higher petcoke consumption and improved consumption norm and (b)
lower freight cost led by 2% QoQ reduction in lead distance. Lead distance
reduction is also driven by ramp up of split grinding units commissioned in last
12-18 months.
Energy cost was down 9% YoY (+5% QoQ) led by (a) rise in WHRS (8% mix v/s 6%
YoY) (b) improved pet coke usage in kiln at 78% (v/s 74% in 2QFY17) (c) Power
consumption reduced by 400bps YoY/QoQ.
2
23 January 2017

Ultratech Cement
Consequently, EBITDA grew 1%YoY to INR 10.5b (v/s est of INR9.6b), leading
into EBITDA/ton of INR903 (-INR89 QoQ, +INR25 YoY).
Tax rate stood lower at 26% vs 30% in 3QFY16.
Hence PAT stood at INR5.6b up 7% YoY
Exhibit 5: Trend in EBITDA/ton (INR)
Exhibit 4: Margin expansion led by cost savings
EBITDA (INR m)
EBITDA (%)
Source: Company, MOSL
Exhibit 6: Trend in key operating parameters
INR/Ton
Realization
RM Cost
Power & Fuel
Staff Cost
Freight & Forwarding
Other Expenditure
Total Expenditure
EBITDA
3QFY17
4,723
787
826
311
1,160
748
3,832
903
3QFY16
4,787
777
905
296
1,184
747
3,909
878
YoY (%)
-1.3
1.3
-8.7
4.9
-2.0
0.2
-2.0
2.9
2QFY17
QoQ (%)
4,827
-2.2
770
2.2
787
5.0
320
-2.7
1,140
1.7
832
-10.0
3,849
-0.4
992
-9.0
Source: Company, MOSL
Conference Call highlights
South and East markets continue to shine
Demand in south markets has been strong led by minimal impact of
demonetization as also higher infrastructure spends by A.P/Telangana. Ultratech
volumes in south market have increased in double digit for 3QFY17.
East market is also continuing to grow at healthy rate. Ultratech’s east volumes
have increased at 5%YoY for 3QFY17. North market after initial impact of
demonetization is beginning to see some signs of growth led by DFCC. Ultratech
North volumes declined for 3QFY17. West market continues to be weakest
among all regions.
Volumes for north market could be impacted in 4QFY17 due to state elections in
Uttar Pradesh.
Ultratech’s continues to gain market share led by higher rural push and addition
dealer network.
Demand from IHB segment is most impacted particularly in tier II cities. Demand
from infrastructure and institutional segment is not impacted due to
demonetization.
Pricing in month of December was 4% lower than average prices for 3QFY17
indicating weak pricing sequentially for 4QFY17.
23 January 2017
3

Ultratech Cement
Cost efficiency initiatives to further bring down unitary cost
Petcoke Mix increased to 78% for its kiln operations and 73% for overall.
The impact of higher fuel prices would be seen in 4QFY17. The average prices of
petcoke for 3QFY17 stood at USD80/t while likely average prices for 4QFY17
would be USD85/t.
Transportation Mix at 72 (road) to 24 (Rail) and lead distance reduced to
435kms (-2%YoY). Lead distanc expected to further reduce due to ramp up of
split grinding units.
Capacity expansion to remain market leader
Announced capacity expansion of 3.5mt at South West MP in Dhar to be
completed by Q4 FY19 and to cater to Eastern Gujrat and North Eastern
Maharashtra markets. The total capex would be INR26bn (US$110/t).
Acquisition of Jaypee assets to be completed by the end of the FY17/1QFY18.
3QFY17 capacity utilization at 67% while utilization at Jaypee assets at 30%.
Exhibit 7: Key assumptions
Capacity (MT)
Dispatches (MT)
Growth (%)
Cap. Util (%)
Grey Realization (INR/ton)
Increase (INR/ton) YoY
Blended Realn (INR/ton)
RM Cost
Power & Fuel
Other Expenditure
Staff Cost
Freight & Forwarding
Total Expenditure
Growth (%)
Blended EBITDA/ton
FY12
49
41
8
84
3735
509
4457
618
1033
413
441
898
3399
13
961
FY13
51
41
0
80
4103
368
4920
698
1032
440
542
1014
3721
9
1079
FY14
54
41
2
77
4000
-102
4840
781
970
457
585
1075
3862
4
848
FY15
62
44
7
72
4226
226
5052
773
1029
473
626
1172
4067
5
850
FY16
66
48
8
72
4138
-88
4958
806
858
480
606
1201
3945
-3
880
FY17E
66
48
1
73
4073
-65
4841
790
794
432
617
1165
3799
-4
917
FY18E
66
51
5
76
4298
225
5110
806
834
460
617
1194
3911
3
1068
FY19E
66
54
6
81
4548
250
5411
846
875
483
625
1230
4059
4
1212
Source: Company, MOSL
23 January 2017
4

Ultratech Cement
Financials and Valuation
Income Statement
Y/E March
Net Sales
Change (%)
EBITDA
Margin (%)
Depreciation
EBIT
Int. and Finance Charges
Other Income - Rec.
PBT
EO Expense/(Income)
PBT after EO expense
Tax
Tax Rate (%)
Reported PAT
Adj PAT
Change (%)
Margin (%)
Balance Sheet
Y/E March
Equity Share Capital
Reserves
Net Worth
Deferred liabilities
Loans
Capital Employed
Goodwill
Gross Block
Less: Accum. Deprn.
Net Fixed Assets
Capital WIP
Investments
Curr. Assets
Inventory
Debtors
Cash & Bank Bal
Others
Curr. Liability & Prov.
Creditors
Provisions
Net Current Assets
Appl. of Funds
2012
181,664
37.6
40,039
22.0
9,026
31,013
2,239
4,568
33,343
-666
34,009
9,467
27.8
24,542
24,062
71.4
13.2
2012
2,741
125,858
128,598
17378
41,529
187,505
190,138
73,797
116,342
18,965
37,888
56,257
20,359
7,660
1,896
26,342
41,947
33,740
8,207
14,310
187,505
2013
199,991
10.1
44,946
22.5
9,454
35,492
2,097
4,620
38,015
0
38,015
11,700
30.8
26,315
26,315
9.4
13.2
2013
2,742
149,606
152,348
19059
54,085
225,493
213,822
82,599
131,224
35,054
51,087
56,723
23,505
10,172
1,427
21,619
48,595
37,903
10,692
8,128
225,493
2014
200,779
0.4
36,160
18.0
10,523
25,637
3,192
5,310
27,755
-956
28,711
7,266
25.3
21,445
20,731
-21.2
10.3
2014
2,742
168,233
170,975
22958
51,993
245,927
250,778
92,059
158,718
20,384
53,917
64,489
23,684
12,810
2,775
25,220
51,614
41,884
9,730
12,875
245,927
2015
226,565
12.8
39,153
17.3
11,331
27,822
5,475
6,515
28,863
0
28,863
8,715
30.2
20,147
20,147
-2.8
8.9
2015
2,744
185,833
188,576
27920
74,142
290,638
318,741
109,267
209,475
20,737
52,088
69,850
27,514
12,032
2,139
28,165
61,511
48,481
13,030
8,339
290,638
2016
238,410
5.2
43,498
18.2
12,890
30,608
5,053
5,015
30,570
0
30,570
8,823
28.9
21,747
21,747
7.9
9.1
2016
2,744
204,617
207,360
32274
76,607
316,241
354,478
122,157
224,483
15,000
51,081
87,956
24,261
14,149
22,351
27,195
62,280
51,013
11,267
25,677
316,241
2017E
233,692
-2.0
45,428
19.4
12,402
33,026
5,410
8,500
36,116
0
36,116
10,474
29.0
25,642
25,642
17.9
11.0
2017E
2,744
227,071
229,814
33899
71,607
335,320
0
364,478
134,559
229,919
15,000
29,500
118,524
24,330
12,805
55,779
25,610
57,623
48,019
9,604
60,901
335,320
(INR Million)
2018E
2019E
259,405
290,615
11.0
12.0
55,662
66,813
21.5
23.0
12,669
13,755
42,992
53,058
4,798
4,146
11,200
12,500
49,395
61,411
0
0
49,395
61,411
13,831
17,195
28.0
28.0
35,564
44,216
35,564
44,216
38.7
24.3
13.7
15.2
2018E
2,744
257,853
260,597
35628
71,607
367,831
0
359,478
147,228
212,250
40,000
29,500
142,226
27,007
12,793
76,131
26,296
56,145
46,906
9,239
86,081
367,831
2019E
2,744
295,693
298,437
37777
66,607
402,821
0
364,478
160,984
203,495
60,000
29,500
167,152
29,460
13,535
97,883
26,275
57,327
47,772
9,554
109,826
402,821
23 January 2017
5

Ultratech Cement
Financials and Valuation
Ratios
Y/E March
Basic (INR)
EPS
Cash EPS
BV/Share
DPS
Payout (%)
Valuation (x)
P/E
Cash P/E
P/BV
EV/Sales
EV/EBITDA
EV/Ton (Cap-USD)
Dividend Yield (%)
Return Ratios (%)
RoIC
RoE
RoCE
Working Capital Ratios
Fixed Asset Turnover (x)
Debtor (Days)
Creditor (Days)
Inventory (Days)
Wkg. Capital Turnover (Days)
Leverage Ratio
Current Ratio
Interest Cover Ratio
Debt/Equity
Cash Flow Statement
Y/E March
Op. Profit/(Loss) before Tax
Interest/Dividends Recd.
Direct Taxes Paid
(Inc)/Dec in WC
CF from Operations
EO expense
CF from Operating incl EO Exp.
(inc)/dec in FA
Free Cash Flow
(Pur)/Sale of Investments
CF from investments
Issue of Shares
(Inc)/Dec in Debt
Interest Paid
Dividend Paid
CF from Fin. Activity
Inc/Dec of Cash
Add: Beginning Balance
Closing Balance
2012
87.8
120.7
469.2
8.0
10.4
39.8
29.0
7.5
5.2
23.5
286
0.2
18.8
20.5
16.9
1.0
15
68
41
29
1.3
13.9
0.3
2012
41,304
478
-7,340
158
34,600
22
34,578
-31,575
3,003
2,159
-29,416
16
83
-2,907
-1,905
-4,714
448
1,448
1,896
2013
96.0
130.5
556
9.0
11.0
36.4
26.8
6.3
4.6
20.6
269
0.3
18.1
18.7
14.7
1.1
19
69
43
15
1.2
16.9
0.4
2013
46,244
566
-7,165
-3,887
35,759
32
35,727
-32,676
3,051
-10,349
-43,025
79
12,557
-3,268
-2,539
6,829
-469
1,896
1,427
2014
75.6
114.0
623
9.0
13.5
46.2
30.7
5.6
4.7
25.8
256
0.3
12.3
12.8
10.8
1.2
23
76
43
23
1.2
8.0
0.3
2014
36,160
5,310
-3,367
-3,399
34,704
-956
35,660
-23,348
12,312
-2,830
-26,178
69
-2,092
-3,192
-2,887
-8,102
1,380
1,427
2,775
2015
73.4
114.7
687
9.0
14.2
47.6
30.5
5.1
4
24.5
231
0.3
9.8
11.2
9.9
1.4
19
78
44
13
1.1
5.1
0.4
2015
39,153
6,515
-3,753
3,900
45,815
0
45,815
-62,440
-16,625
1,829
-60,611
323
22,149
-5,475
-2,869
14,128
-668
2,775
2,139
2016
79.3
126.2
756
9.5
13.9
44.1
27.7
4.6
4
21.8
213
0.3
9.4
11.0
9.3
1.5
22
78
37
39
1.4
6.1
0.4
2016
43,498
5,015
-4,470
2,875
46,918
0
46,918
-22,162
24,757
1,006
-21,155
66
2,465
-5,053
-3,029
-5,551
20,212
2,139
22,351
2017E
93.5
138.7
838
10.0
12.4
37.4
25.2
4.2
4.0
20.5
209
0.3
9.7
11.7
10.1
1.6
20
75
38
95
2.1
6.1
0.3
2017E
45,428
8,500
-8,848
-1,797
43,283
0
43,283
-17,839
25,444
21,581
3,743
0
-5,000
-5,410
-3,188
-13,598
33,428
22,351
55,779
2018E
129.6
175.8
950
15.0
13.4
27.0
19.9
3.7
3.4
15.9
199
0.4
13.0
14.5
12.3
1.4
18
66
38
121
2.5
9.0
0.3
2019E
161.2
211.3
1,088
20.0
14.4
21.7
16.5
3.2
2.9
12.5
188
0.6
16.7
15.8
13.5
1.3
17
60
37
138
2.9
12.8
0.2
(INR Million)
2018E
2019E
55,662
66,813
11,200
12,500
-12,102
-15,046
-4,828
-1,993
49,932
62,274
0
0
49,932
62,274
-20,000
-25,000
29,932
37,274
0
0
-20,000
-25,000
0
0
0
-5,000
-4,798
-4,146
-4,782
-6,376
-9,580
-15,522
20,353
21,751
55,779
76,131
76,131
97,883
23 January 2017
6

Ultratech Cement
Corporate profile
Company description
UltraTech Cement, the erstwhile cement division of
L&T Ltd, is a subsidiary of Grasim, a part of the
Aditya Birla Group. Post merger of Grasim’s cement
business, it is the largest cement company in India
with a total cements capacity of 61.5mt (by
1QFY16) with a pan-India presence. It is the largest
exporters of cement and clinker from India. Post
merger, it would be the largest cement company in
India and 10th largest in the world.
Source: MOSL/Bloomberg
Exhibit 1: Sensex rebased
Exhibit 2: Shareholding pattern (%)
Dec-16
Promoter
DII
FII
Others
62.3
6.3
20.8
10.6
Sep-16
62.3
6.1
20.6
11.0
Dec-15
62.8
7.6
18.4
11.2
Source: Capitaline
Exhibit 3: Top holders
Holder Name
LIC of India
Oppenheimer Developing Markets Fund
% Holding
2.3
1.4
Note: FII Includes depository receipts
Source: Capitaline
Exhibit 4: Top management
Name
Kumar Mangalam Birla
K K Maheshwari
Atul Daga
S K Chatterjee
Designation
Chairman
Managing Director
Whole Time Director & CFO
Company Secretary
Exhibit 5: Directors
Name
D D Rathi
Rajashree Birla
Alka Bharucha
Arun Adhikari
Sukanya Kripalu
Name
G M Dave
S B Mathur
O P Puranmalka
Renuka Ramnath
Source: Capitaline
*Independent
Exhibit 6: Auditors
Name
BSR & Co LLP
G P Kapadia & Co
N D Birla & Co
N I Mehta & Co
Type
Statutory
Statutory
Cost Auditor
Cost Auditor
Source: Capitaline
Exhibit 7: MOSL forecast v/s consensus
EPS
(INR)
FY17
FY18
MOSL
forecast
108.0
165.3
Consensus
forecast
115.5
149.8
Variation (%)
-6.5
10.3
Source: Bloomberg
23 January 2017
7

Disclosures
This document has been prepared by Motilal Oswal Securities Limited (hereinafter referred to as Most) to provide information about the company (ies) and/sector(s), if any, covered in the report and may be distributed by it
and/or its affiliated company(ies). This report is for personal information of the selected recipient/s and does not construe to be any investment, legal or taxation advice to you. This research report does not constitute an
offer, invitation or inducement to invest in securities or other investments and Motilal Oswal Securities Limited (hereinafter referred as MOSt) is not soliciting any action based upon it. This report is not for public distribution
and has been furnished to you solely for your general information and should not be reproduced or redistributed to any other person in any form. This report does not constitute a personal recommendation or take into
account the particular investment objectives, financial situations, or needs of individual clients. Before acting on any advice or recommendation in this material, investors should consider whether it is suitable for their
particular circumstances and, if necessary, seek professional advice. The price and value of the investments referred to in this material and the income from them may go down as well as up, and investors may realize losses
on any investments. Past performance is not a guide for future performance, future returns are not guaranteed and a loss of original capital may occur.
MOSt and its affiliates are a full-service, integrated investment banking, investment management, brokerage and financing group. We and our affiliates have investment banking and other business relationships with a some
companies covered by our Research Department. Our research professionals may provide input into our investment banking and other business selection processes. Investors should assume that MOSt and/or its affiliates are
seeking or will seek investment banking or other business from the company or companies that are the subject of this material and that the research professionals who were involved in preparing this material may educate
investors on investments in such business . The research professionals responsible for the preparation of this document may interact with trading desk personnel, sales personnel and other parties for the purpose of
gathering, applying and interpreting information. Our research professionals are paid on twin parameters of performance & profitability of MOSt.
MOSt generally prohibits its analysts, persons reporting to analysts, and members of their households from maintaining a financial interest in the securities or derivatives of any companies that the analysts cover.
Additionally, MOSt generally prohibits its analysts and persons reporting to analysts from serving as an officer, director, or advisory board member of any companies that the analysts cover. Our salespeople, traders, and
other professionals or affiliates may provide oral or written market commentary or trading strategies to our clients that reflect opinions that are contrary to the opinions expressed herein, and our proprietary trading and
investing businesses may make investment decisions that are inconsistent with the recommendations expressed herein. In reviewing these materials, you should be aware that any or all of the foregoing among other things,
may give rise to real or potential conflicts of interest. MOSt and its affiliated company(ies), their directors and employees and their relatives may; (a) from time to time, have a long or short position in, act as principal in, and
buy or sell the securities or derivatives thereof of companies mentioned herein. (b) be engaged in any other transaction involving such securities and earn brokerage or other compensation or act as a market maker in the
financial instruments of the company(ies) discussed herein or act as an advisor or lender/borrower to such company(ies) or may have any other potential conflict of interests with respect to any recommendation and other
related information and opinions.; however the same shall have no bearing whatsoever on the specific recommendations made by the analyst(s), as the recommendations made by the analyst(s) are completely independent
of the views of the affiliates of MOSt even though there might exist an inherent conflict of interest in some of the stocks mentioned in the research report
Reports based on technical and derivative analysis center on studying charts company's price movement, outstanding positions and trading volume, as opposed to focusing on a company's fundamentals and, as such, may not match with a report on a
company's fundamental analysis. In addition MOST has different business segments / Divisions with independent research separated by Chinese walls catering to different set of customers having various objectives, risk profiles, investment horizon,
etc, and therefore may at times have different contrary views on stocks sectors and markets.
Unauthorized disclosure, use, dissemination or copying (either whole or partial) of this information, is prohibited. The person accessing this information specifically agrees to exempt MOSt or any of its affiliates or employees
from, any and all responsibility/liability arising from such misuse and agrees not to hold MOSt or any of its affiliates or employees responsible for any such misuse and further agrees to hold MOSt or any of its affiliates or
employees free and harmless from all losses, costs, damages, expenses that may be suffered by the person accessing this information due to any errors and delays. The information contained herein is based on publicly
available data or other sources believed to be reliable. Any statements contained in this report attributed to a third party represent MOSt’s interpretation of the data, information and/or opinions provided by that third party
either publicly or through a subscription service, and such use and interpretation have not been reviewed by the third party. This Report is not intended to be a complete statement or summary of the securities, markets or
developments referred to in the document. While we would endeavor to update the information herein on reasonable basis, MOSt and/or its affiliates are under no obligation to update the information. Also there may be
regulatory, compliance, or other reasons that may prevent MOSt and/or its affiliates from doing so. MOSt or any of its affiliates or employees shall not be in any way responsible and liable for any loss or damage that may
arise to any person from any inadvertent error in the information contained in this report. MOSt or any of its affiliates or employees do not provide, at any time, any express or implied warranty of any kind, regarding any
matter pertaining to this report, including without limitation the implied warranties of merchantability, fitness for a particular purpose, and non-infringement. The recipients of this report should rely on their own
investigations.
This report is intended for distribution to institutional investors. Recipients who are not institutional investors should seek advice of their independent financial advisor prior to taking any investment decision based on this
report or for any necessary explanation of its contents.
Most and it’s associates may have managed or co-managed public offering of securities, may have received compensation for investment banking or merchant banking or brokerage services, may have received any
compensation for products or services other than investment banking or merchant banking or brokerage services from the subject company in the past 12 months.
Most and it’s associates have not received any compensation or other benefits from the subject company or third party in connection with the research report.
Subject Company may have been a client of Most or its associates during twelve months preceding the date of distribution of the research report
MOSt and/or its affiliates and/or employees may have interests/positions, financial or otherwise of over 1 % at the end of the month immediately preceding the date of publication of the research in the securities mentioned
in this report. To enhance transparency, MOSt has incorporated a Disclosure of Interest Statement in this document. This should, however, not be treated as endorsement of the views expressed in the report.
Motilal Oswal Securities Limited is registered as a Research Analyst under SEBI (Research Analyst) Regulations, 2014. SEBI Reg. No. INH000000412
Pending Regulatory inspections against Motilal Oswal Securities Limited:
SEBI pursuant to a complaint from client Shri C.R. Mohanraj alleging unauthorized trading, issued a letter dated 29th April 2014 to MOSL notifying appointment of an Adjudicating Officer as per SEBI regulations to hold inquiry
and adjudge violation of SEBI Regulations; MOSL replied to the Show Cause Notice whereby SEBI granted us an opportunity of Inspection of Documents. Since all the documents requested by us were not covered we have
requested to SEBI vide our letter dated June 23, 2015 to provide pending list of documents for inspection.
List of associate companies of Motilal Oswal Securities Limited -Click
here to access detailed report
Analyst Certification
The views expressed in this research report accurately reflect the personal views of the analyst(s) about the subject securities or issues, and no part of the compensation of the research analyst(s) was, is, or will be directly or
indirectly related to the specific recommendations and views expressed by research analyst(s) in this report. The research analysts, strategists, or research associates principally responsible for preparation of MOSt research
receive compensation based upon various factors, including quality of research, investor client feedback, stock picking, competitive factors and firm revenues
Ultratech Cement
Disclosure of Interest Statement
Analyst ownership of the stock
No
Served as an officer, director or employee -
No
A graph of daily closing prices of securities is available at www.nseindia.com and http://economictimes.indiatimes.com/markets/stocks/stock-quotes
Regional Disclosures (outside India)
This report is not directed or intended for distribution to or use by any person or entity resident in a state, country or any jurisdiction, where such distribution, publication, availability or use would be contrary to law,
regulation or which would subject MOSt & its group companies to registration or licensing requirements within such jurisdictions.
For Hong Kong:
This report is distributed in Hong Kong by Motilal Oswal capital Markets (Hong Kong) Private Limited, a licensed corporation (CE AYY-301) licensed and regulated by the Hong Kong Securities and Futures
Commission (SFC) pursuant to the Securities and Futures Ordinance (Chapter 571 of the Laws of Hong Kong) “SFO”. As per SEBI (Research Analyst Regulations) 2014 Motilal Oswal Securities (SEBI Reg No. INH000000412) has
an agreement with Motilal Oswal capital Markets (Hong Kong) Private Limited for distribution of research report in Kong Kong. This report is intended for distribution only to “Professional Investors” as defined in Part I of
Schedule 1 to SFO. Any investment or investment activity to which this document relates is only available to professional investor and will be engaged only with professional investors.” Nothing here is an offer or solicitation
of these securities, products and services in any jurisdiction where their offer or sale is not qualified or exempt from registration. The Indian Analyst(s) who compile this report is/are not located in Hong Kong & are not
conducting Research Analysis in Hong Kong.
For U.S.
Motilal Oswal Securities Limited (MOSL) is not a registered broker - dealer under the U.S. Securities Exchange Act of 1934, as amended (the"1934 act") and under applicable state laws in the United States. In addition MOSL is
not a registered investment adviser under the U.S. Investment Advisers Act of 1940, as amended (the "Advisers Act" and together with the 1934 Act, the "Acts), and under applicable state laws in the United States.
Accordingly, in the absence of specific exemption under the Acts, any brokerage and investment services provided by MOSL, including the products and services described herein are not available to or intended for U.S.
persons.
This report is intended for distribution only to "Major Institutional Investors" as defined by Rule 15a-6(b)(4) of the Exchange Act and interpretations thereof by SEC (henceforth referred to as "major institutional investors").
This document must not be acted on or relied on by persons who are not major institutional investors. Any investment or investment activity to which this document relates is only available to major institutional investors
and will be engaged in only with major institutional investors. In reliance on the exemption from registration provided by Rule 15a-6 of the U.S. Securities Exchange Act of 1934, as amended (the "Exchange Act") and
interpretations thereof by the U.S. Securities and Exchange Commission ("SEC") in order to conduct business with Institutional Investors based in the U.S., MOSL has entered into a chaperoning agreement with a U.S.
registered broker-dealer, Motilal Oswal Securities International Private Limited. ("MOSIPL"). Any business interaction pursuant to this report will have to be executed within the provisions of this chaperoning agreement.
The Research Analysts contributing to the report may not be registered /qualified as research analyst with FINRA. Such research analyst may not be associated persons of the U.S. registered broker-dealer, MOSIPL, and
therefore, may not be subject to NASD rule 2711 and NYSE Rule 472 restrictions on communication with a subject company, public appearances and trading securities held by a research analyst account.
For Singapore
Motilal Oswal Capital Markets Singapore Pte Limited is acting as an exempt financial advisor under section 23(1)(f) of the Financial Advisers Act(FAA) read with regulation 17(1)(d) of the Financial Advisors Regulations and is a
subsidiary of Motilal Oswal Securities Limited in India. This research is distributed in Singapore by Motilal Oswal Capital Markets Singapore Pte Limited and it is only directed in Singapore to accredited investors, as defined in
the Financial Advisers Regulations and the Securities and Futures Act (Chapter 289), as amended from time to time.
In respect of any matter arising from or in connection with the research you could contact the following representatives of Motilal Oswal Capital Markets Singapore Pte Limited:
Varun Kumar
Varun.kumar@motilaloswal.com
Contact : (+65) 68189232
Office Address:21 (Suite 31),16 Collyer Quay,Singapore 04931
ULTRATECH CEMENT
23 January 2017
Motilal Oswal Tower, Level 9, Sayani Road, Prabhadevi, Mumbai 400 025
Phone: +91 22 3982 5500 E-mail: reports@motilaloswal.com
Motilal Oswal Securities Ltd
8