Amara Raja Batteries
BSE SENSEX
27,035
Bloomberg
Equity Shares (m)
M.Cap.(INRb)/(USDb)
52-Week Range (INR)
1, 6, 12 Rel. Per (%)
Avg Val, INRm
Free float (%)
S&P CNX
8,349
AMRJ IN
170.8125
158.1 / 2.3
1077 / 776.5
0/3/1
293.9
47.94
23 January 2017
3QFY17 Results Update | Sector: Automobiles
CMP: INR902
TP: INR1,087(+20%)
Buy
Financials & Valuations (INR b)
2016 2017E 2018E
Y/E Mar
46.9
53.8
63.6
Net Sales
8.2
9.1
11.3
EBITDA
4.9
5.3
6.9
NP
28.7
30.9
40.1
EPS (INR)
19.8
7.8
30.0
EPS Gr. (%)
123.0 148.8 182.3
BV/Sh. (INR)
25.8
22.7
24.2
RoE (%)
24.2
21.6
23.1
RoCE (%)
32.0
29.7
22.8
Payout (%)
7.4
6.2
5.0
Div. Yield
Estimate change
TP change
Rating change
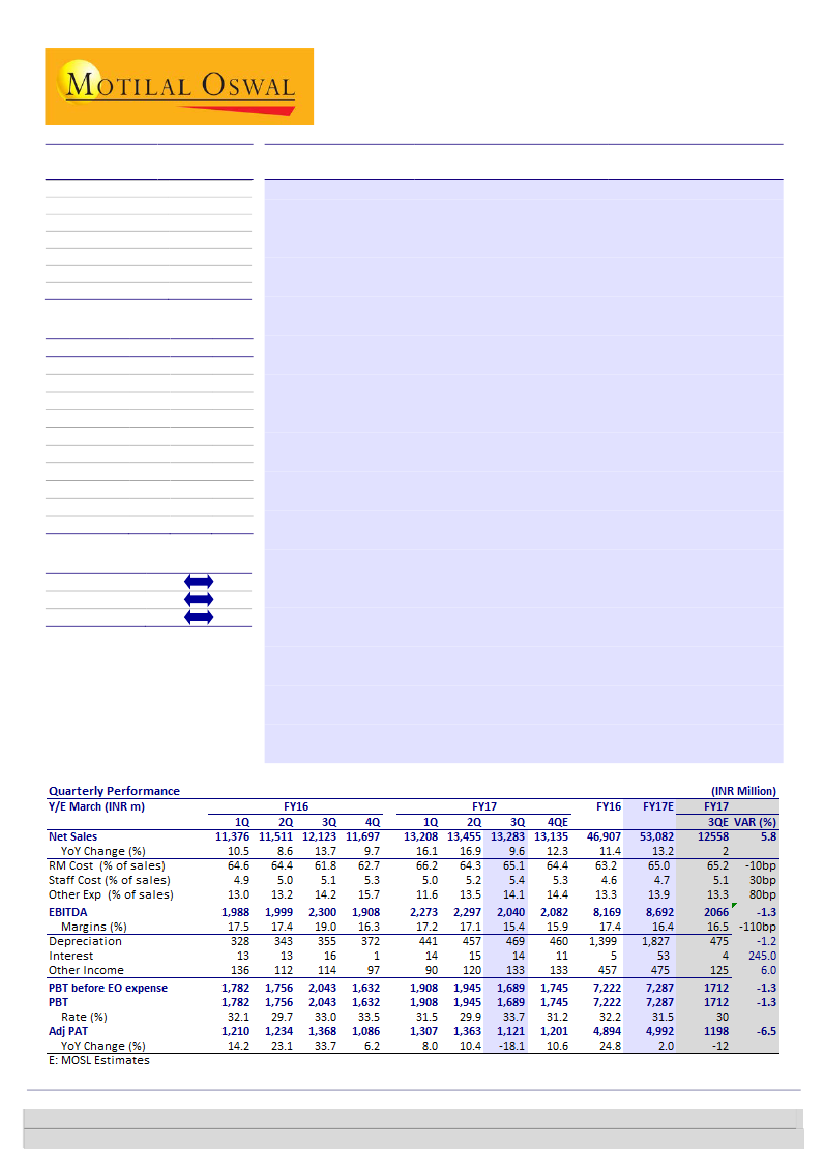
Operating performance in-line; sales grew ~10% YoY; EBITDA margin lowest in
14 quarters due to higher fixed cost; first PAT decline since 3QFY09
Net sales grew 10% YoY (but declined 1% QoQ) to INR13.3b (v/s our estimate
of ~INR12.6b), driven by 16-17% YoY growth in the automotive segment;
industrial segment grew by a modest 2-3% YoY.
EBITDA margin declined 170bp QoQ (and 360bp YoY) to 15.4% (v/s our
estimate of 16.5%) due to higher employee and other expenses, despite in-line
gross margin.
RM cost increased ~80bp QoQ (and 330bp YoY) due to increase in lead prices,
despite increase in prices by 3% in November and 4% in December in the
replacement market.
Fixed cost was higher due to new tubular plant, bonus provisioning for
employees and negative operating leverage. This translated into EBITDA
decline of ~11% YoY/QoQ to INR2.04b (v/s our estimate of INR2.06b).
Adjusted PAT declined 18% YoY/QoQ to INR1.12b (v/s our estimate of
INR1.2b), impacted by higher tax rate.
Takeaways from management interaction:
(a) Impact of demonetization felt in
2W segment, (b) Increased market share in both 2W and 4W replacement
segment, (c) Auto OEM growth in low single digit, implying strong growth in
replacement segment, (d) New tubular plant operated at ~30% utilization (off-
season), (e) Lead prices for 3QFY17 at USD1,950-2,000/ton, which could be over
USD2,150/ton for 4QFY17, (f) Expansion of 4W battery capacity by 2.4m units (to
10.8m) on track for commissioning in 4QFY17, (g) Inventory is slightly higher due
to lower demand in 2W batteries and on account of pre-season buildup of inverter
batteries, (h) Capex for FY17 to be at INR4.5b-5b for 2W and 4W battery capacity,
and (i) Net cash as at the end of December 2016 at INR2.5b.
Valuation and view:
We have cut our EPS estimates by 1.5-2.7% to factor in
stronger than estimated revenue growth and higher costs (RM and fixed costs). The
stock trades at 23.9x/19.9x FY18/19E EPS. Maintain
Buy
with a target price of
~INR1,087 (25x December 2018E EPS).
Investors are advised to refer through important disclosures made at the last page of the Research Report.
Motilal Oswal research is available on www.motilaloswal.com/Institutional-Equities, Bloomberg, Thomson Reuters, Factset and S&P Capital.
Jinesh Gandhi
(Jinesh@MotilalOswal.com); +91 22 6129 1524
Aditya Vora
(Aditya.Vora@MotilalOswal.com); +91 22 6129 1533

Amara Raja Batteries
Exhibit 1: Net sales grew by 9.3% YoY
Net sales (INR m)
31.4
23.6
15.1
13.7 10.5
20.1
10.5 8.6
13.7
9.7
16.1 16.9
9.6
Growth YoY (%)
Exhibit 2: Gross margins decline 330bp YoY (-80bp QoQ)
Gross margin (%)
Source: Company, MOSL
Exhibit 3: EBITDA margins at 14 quarter low
EBITDA
EBITDA (%)
Exhibit 4: PAT decline for the 1st time since 3QFY09
39
17
8
PAT (INR m)
24
6
8
23
Growth YoY (%)
34
6
8
10
-18
14
Source: Company, MOSL
Exhibit 5: Spot lead prices exhibiting high volatility
175,000
160,000
145,000
130,000
115,000
100,000
INR/Ton
Source: Company, MOSL
23 January 2017
2

Amara Raja Batteries
Valuation and view
Industry structure remains duopoly, but AMRJ is a strong No. 2:
While the
industry structure remains largely duopoly, AMRJ has emerged as a formidable
challenger to leader EXIDE, with market leadership in telecom (46% share) and
UPS (32%) segments, and a fast gaining share in Autos. Over FY04-16, AMRJ
clocked a CAGR of 34% and 68% in net sales and PAT respectively, far exceeding
EXID’s 20% CAGR each in net sales and PAT. This has been driven through a
combination of technological innovations (first to introduce maintenance-free,
factory charged, extended warranty batteries), witty advertising and unique
distribution model (franchisee based) supported with operational efficiency-led
competitive pricing.
AMRJ – gearing up to be leader:
AMRJ is gearing up to be a leader through i)
consolidating in existing areas, ii) entering new business opportunities within
battery space, mainly home UPS, Solar and Motive Power and iii) aided by
capacity and network expansion. Company aims to increase its share in the OEM
and replacement segments to 40% (from current 30%) and 30% (from current
24%) respectively over the medium term. In the telecom segment, AMRJ
expects to maintain its market share at current levels (60% currently).
Strong ~24% EPS CAGR over FY17-FY19E, robust return ratios and FCF; Buy:
We
have marginally revised our EPS estimate downwards by 1.5-2.7%, to factor in
stronger than estimated revenue growth and higher cost (RM and fixed cost).
Stable competitive environment, recovery in demand and stable margins would
drive ~24% CAGR in EPS over FY17-19E. Significant FCF generation (~INR5.8b
over FY17-19E) and stable RoE of 22-23% —coupled with potential shift from
unorganized to organized players due to GST would continue to drive stock re-
rating. The stock trades at 23.9x/19.9x FY18/19E EPS. Maintain Buy with a TP of
~INR1,087 (25x Dec-18E EPS).
Exhibit 6: Revised estimates
(INR M)
Net Sales
EBITDA (%)
Net Profit
EPS (INR)
Rev
53,082
16.4
4,992
29.2
FY17E
Old
52,537
16.7
5,067
29.7
Chg (%)
1.0
-30bp
-1.5
-1.5
Rev
62,927
17.0
6,443
37.7
FY18E
Old
62,294
17.6
6,619
38.8
Chg (%)
1.0
-60bp
-2.7
-2.7
Source: MOSL
23 January 2017
3

Amara Raja Batteries
Exhibit 7: Valuations trading above historical average, reflecting improving fundamentals
P/E (x)
40
30
20
10
0
18.8
13.0
11.2
25.7
5 Yrs Avg(x)
15 Yrs Avg(x)
10 Yrs Avg(x)
6.0
4.0
2.0
0.0
8.0
P/B (x)
5 Yrs Avg(x)
4.5
3.1
15 Yrs Avg(x)
10 Yrs Avg(x)
5.8
2.2
Source: MOSL
Source: MOSL
Exhibit 8: Comparative valuation
Auto OEM's
Bajaj Auto
Hero MotoCorp
TVS Motor
M&M
Maruti Suzuki
Tata Motors
Ashok Leyland
Eicher Motors
Auto Ancillaries
Bharat Forge
Exide Industries
Amara Raja Batteries
BOSCH
CMP
(INR)
2,698
3,057
379
1,192
5,672
523
86
22,744
924
195
902
21,290
Rating
Buy
Neutral
Buy
Buy
Buy
Buy
Buy
Buy
Buy
Buy
Buy
Neutral
TP
(INR)
3,097
3,288
407
1,497
6,121
473
92
28,755
974
213
1,087
20,937
P/E (x)
FY17E FY18E
20.3
17.0
18.0
15.9
31.3
23.0
18.1
14.2
21.9
18.2
18.0
11.5
17.7
13.0
37.1
26.2
36.9
24.9
30.9
41.9
25.4
20.6
23.9
32.4
EV/EBITDA (x)
FY17E FY18E
14.2
11.5
12.0
10.4
19.7
14.7
14.9
13.1
14.2
11.4
5.3
4.0
9.4
7.2
28.7
21.8
17.3
15.3
17.6
33.1
13.7
13.0
14.2
24.8
RoE (%)
FY17E FY18E
29.4
30.9
39.0
37.5
26.5
29.5
14.5
14.5
23.1
23.1
11.5
15.9
23.5
26.5
40.3
41.6
15.9
13.6
21.6
19.7
20.0
14.7
23.1
24.5
RoCE (%)
EPS CAGR (%)
FY17E FY18E FY16E-18E
28.6 30.0
9.8
38.1 36.7
10.2
27.4 32.1
34.7
12.1 12.3
11.9
31.1 31.0
31.4
8.8
11.9
11.3
17.3 20.8
29.7
27.1 30.7
32.8
10.9
14.0
20.6
27.9
14.4
15.3
22.1
33.6
13.8
13.5
14.7
16.7
Source: MOSL
23 January 2017
4

Amara Raja Batteries
Amara Raja| Story in charts: Robust ~24% EPS CAGR expected over FY16-19E
Exhibit 9: Capacity for various batteries
4W (mn units)
2W (mn units)
15.0
10.8
Exhibit 10: Expect net sales to register a CAGR of ~18% over
FY16-19E
34.3
25.2
16.0
11.4
Net sales (INR m)
Growth (%)
10.8
8.3
4.5
3.5
FY12
4.7
4.0
FY13
FY14
FY15
FY16
FY17E
6.0
8.4
8.4
8.4
10.8
11.0
22.5
13.2
18.5
FY18E
FY12
FY13
FY14
FY15
FY16
FY17E
FY18E
Source: Company, MOSL
Exhibit 11: Expect margins to sustain and improve to 18% by
FY18E
EBITDA (INR m)
16.3
16.7
EBITDA margins (%)
17.4
16.4
17.0
Exhibit 12: Strong EPS growth of ~20% over FY16-18E
45.2
36.2
26.3
19.8
10.4
12.6
17.2
FY13
21.7
FY14
23.9
FY15
28.7
FY16
29.2
2.0
FY17E
37.7
FY18E
29.1
EPS
Growth (%)
14.4
15.2
FY12
FY13
FY14
FY15
FY16
FY17E
FY18E
FY12
Source: Company, MOSL
Exhibit 13: FCF to turn positive in FY18E
CFO
Capex
FCF
Exhibit 14: Return ratios to remain strong
RoCE (%)
29.3
25.5
31.1
28.0
30.6
26.7
28.0
24.9
25.8
21.6
24.2
20.6
23.1
22.1
RoE (%)
-809
-1,463
-3,731
-4,062
FY15
-4,904
FY16
-5,000
FY17E
-5,000
FY18E
FY12
FY13
FY14
FY12
FY13
FY14
FY15
FY16
FY17E
FY18E
Source: Company, MOSL
23 January 2017
5

Amara Raja Batteries
Financials and Valuations
Standalone - Income Statement
Y/E March
Gross Revenues
Less: Excise Duty
Net Sales
Change (%)
Gross operating income
Total Expenditure
EBITDA
Margin (%)
Depreciation
EBIT
Int. and Finance Charges
Other Income - Rec.
PBT bef. EO Exp.
EO Expense/(Income)
PBT after EO Exp.
Tax Rate (%)
Reported PAT
PAT Adj for EO items
Change (%)
Margin (%)
FY10
16,904
2,259
14,645
11.5
16,904
11,760
2885
19.7
429
2,455
79
170
2,546
0
2,546
34.4
1,670
1,670
107.5
11.4
FY11
19,443
1,833
17,611
20.3
19,443
15,037
2574
14.6
417
2,157
31
78
2,204
0
2,204
32.8
1,481
1,481
-11.3
8.4
FY12
26,029
2,384
23,645
34.3
26,029
20,249
3396
14.4
465
2,931
25
280
3,186
0
3,186
32.5
2,151
2,151
45.2
9.1
FY13
33,110
3,496
29,614
25.2
33,110
25,099
4515
15.2
661
3,854
10
466
4,310
92
4,218
32.0
2,867
2,929
36.2
9.9
FY14
38,372
4,005
34,367
16.0
38,372
28,764
5603
16.3
646
4,957
7
455
5,405
39
5,367
31.5
3,674
3,701
26.3
10.8
FY15
46,372
4,258
42,113
22.5
46,372
35,095
7018
16.7
1,340
5,678
2
423
6,099
73
6,026
33.0
4,036
4,084
10.4
9.7
FY16
52,418
5,511
46,907
11.4
52,418
38,738
8,169
17.4
1,399
6,770
5
457
7,222
0
7,222
32.2
4,894
4,894
19.8
10.4
FY17E
59,452
6,370
53,082
13.2
59,452
44,390
8,692
16.4
1,827
6,865
53
475
7,287
0
7,287
31.5
4,992
4,992
2.0
9.4
(INR Million)
FY18E
69,219
6,293
62,927
18.5
69,219
52,223
10,704
17.0
2,228
8,476
51
650
9,074
0
9,074
29.0
6,443
6,443
29.1
10.2
FY19E
79,860
7,260
72,600
15.4
79,860
59,914
12,686
17.5
2,643
10,043
46
850
10,847
0
10,847
28.5
7,756
7,756
20.4
10.7
Standalone - Balance Sheet
Y/E March
Equity Share Capital
Total Reserves
Net Worth
Deferred Liabilities
Total Loans
Capital Employed
Gross Block
Less: Accum. Deprn.
Net Fixed Assets
Capital WIP
Total Investments
Curr. Assets, Loans&Adv.
Inventory
Account Receivables
Cash and Bank Balance
Loans and Advances
Curr. Liability & Prov.
Account Payables
Other Current Liabilities
Provisions
Net Current Assets
Appl. of Funds
FY10
171
5,266
5,436
216
912
6,565
4,911
1,854
3,057
227
161
6,311
2,176
2,423
625
1,087
3,191
1,376
281
1,535
3,120
6,565
FY11
171
6,289
6,459
205
1,000
7,664
5,388
2,237
3,151
375
161
7,472
2,847
3,057
451
1,117
3,496
1,091
937
1,468
3,977
7,664
FY12
171
8,064
8,235
220
855
9,310
6,213
2,667
3,546
315
161
9,493
2,666
3,197
2,292
1,339
4,206
949
1,196
2,061
5,288
9,310
FY13
171
10,427
10,598
195
881
11,674
6,803
3,214
3,589
1,030
161
12,925
2,929
3,807
4,108
2,082
6,030
1,577
1,960
2,493
6,895
11,674
FY14
171
13,456
13,627
301
843
14,772
9,955
3,860
6,096
1,447
161
13,691
3,350
4,528
2,946
2,867
6,623
1,577
1,858
3,188
7,068
14,771
FY15
171
16,825
16,996
368
741
18,106
14,414
4,970
9,444
863
161
13,414
4,181
5,541
2,222
1,469
5,775
2,616
1,521
1,639
7,638
18,106
FY16
171
20,846
21,016
588
725
22,330
19,147
5,984
13,163
1,199
161
14,560
6,017
5,922
1,503
1,120
6,754
3,301
2,471
983
7,806
22,330
FY17E
171
25,004
25,174
698
725
26,597
24,346
7,810
16,536
1,000
161
15,574
6,108
6,701
1,498
1,267
6,674
2,472
2,796
1,406
8,900
26,597
(INR Million)
FY18E
171
30,395
30,565
788
725
32,079
29,346
10,038
19,308
1,000
161
19,511
6,896
7,944
3,170
1,502
7,901
2,931
3,314
1,656
11,610
32,079
FY19E
171
36,884
37,055
897
725
38,677
34,346
12,682
21,664
1,000
161
24,982
7,757
9,165
6,327
1,733
9,130
3,381
3,824
1,925
15,851
38,677
23 January 2017
6

Amara Raja Batteries
Financials and Valuations
Ratios
Y/E March
Basic (INR)
EPS
Cash EPS
BV/Share
DPS
Payout (%)
Valuation (x)
P/E
Cash P/E
P/BV
EV/Sales
EV/EBITDA
Dividend Yield (%)
Return Ratios (%)
RoE
RoCE
RoIC
Working Capital Ratios
Gross Fixed Asset Turnover (x)
Inventory (Days)
Debtor (Days)
Creditor (Days)
Working Capital Turnover (Days)
Leverage Ratio (x)
Current Ratio
Debt/Equity
FY10
9.8
12.3
31.8
1.5
17.4
FY11
8.7
11.1
37.8
2.3
30.9
FY12
12.6
15.3
48.2
1.9
17.4
FY13
17.2
21.0
62.0
2.5
17.6
FY14
21.7
25.4
79.8
3.6
19.3
FY15
23.9
31.8
99.5
3.6
18.4
37.7
28.4
9.1
3.6
21.8
0.4
35.2
25.2
29.1
3.0
54.2
52
34
62
2.0
0.2
24.9
21.1
23.7
3.3
59.0
57
23
73
2.1
0.2
29.3
25.5
29.9
3.8
41.2
45
15
46
2.3
0.1
31.1
28.0
40.6
4.4
36.1
42
19
34
2.1
0.1
30.6
28.0
40.9
3.5
35.6
43
17
44
2.1
0.1
26.7
24.9
30.3
2.9
36.2
44
23
47
2.3
0.0
FY16
28.7
36.8
123.0
4.3
17.8
31.5
24.5
7.3
3.3
18.8
0.5
25.8
24.2
26.7
2.4
46.8
41
26
49
2.2
0.0
FY17E
29.2
39.9
147.4
4.1
16.7
30.9
22.6
6.1
2.9
17.6
0.5
21.6
20.6
21.7
2.2
42.0
41
17
51
2.3
0.0
FY18E
37.7
50.8
179.0
5.1
16.3
23.9
17.8
5.0
2.4
14.2
0.6
23.1
22.1
23.3
2.1
40.0
42
17
49
2.5
0.0
FY19E
45.4
60.9
216.9
6.2
16.3
19.9
14.8
4.2
2.0
11.7
0.7
22.9
22.0
24.4
2.1
39.0
42
17
48
2.7
0.0
Standalone - Cash Flow Statement
Y/E March
Net P/L Before Tax and E/O Items
Depreciation
Interest & Finance Charges
Direct Taxes Paid
(Inc)/Dec in WC
CF from Operations
(inc)/dec in FA
Free Cash Flow
Others
CF from Investments
(Inc)/Dec in Debt
Interest Paid
Dividend Paid
CF from Fin. Activity
Inc/Dec of Cash
Add: Beginning Balance
Closing Balance
FY10
2,546
430
61
785
-260
1,992
-515
1,628
338
-177
-1,908
-68
-68
-2,044
-78
703
625
FY11
2,204
417
9
776
-1,138
716
-667
195
54
-612
17
-21
-419
-422
-174
625
451
FY12
3,187
470
-28
1,026
120
2,723
-809
2,176
82
-727
-271
84
-222
-409
1,848
444
2,292
FY13
4,218
577
-110
1,366
-94
3,225
-1,463
1,892
269
-1,194
3
-17
-323
-336
1,825
2,283
4,108
FY14
5,366
637
-808
1,606
-1,315
2,273
-3,731
-943
294
-3,437
-87
-14
-430
-531
-1,180
4,138
2,958
FY15
6,099
1,245
-29
1,922
-1,475
3,917
-4,062
-180
176
-3,886
-112
-84
-552
-748
-751
2,897
2,146
FY16
7,222
1,399
-452
2,327
-887
4,954
-4,904
50
457
-4,447
203
-5
-874
-675
-169
2,146
1,977
FY17E
7,287
1,827
-422
2,295
-1,098
5,298
-5,000
298
475
-4,525
109
-53
-834
-777
-4
1,977
1,972
(INR Million)
FY18E
9,074
2,228
-599
2,632
-1,038
7,034
-5,000
2,034
650
-4,350
91
-51
-1,052
-1,012
1,672
1,972
3,644
FY19E
10,847
2,643
-804
3,091
-1,084
8,511
-5,000
3,511
850
-4,150
108
-46
-1,266
-1,204
3,157
3,644
6,801
23 January 2017
7

Amara Raja Batteries
Corporate profile
Company description
Commencing operations in 1992, AMRJ has become
India’s second-largest lead-acid battery
manufacturer (next to market leader EXID), with
market leadership in telecom and UPS segments. It
is reckoned as one of the pioneers in VRLA (valve
regulated lead acid) batteries. Johnson Control USA
(JC) is an equal partner and acquired 26% equity in
AMRJ in 1997.
Source: MOSL/Bloomberg
Exhibit 1: Sensex rebased
Exhibit 2: Shareholding pattern (%)
Dec-16
Promoter
DII
FII
Others
52.1
8.0
21.7
18.3
Sep-16
52.1
7.8
21.5
18.6
Dec-15
52.1
9.3
19.5
19.1
Source: Capitaline
Exhibit 3: Top holders
Holder Name
Franklin Templeton Investment Funds
ICICI Prudential Value Discovery Fund
Smallcap World Fund, Inc
Baron Emerging Markets Fund
% Holding
2.8
2.0
1.1
1.2
Source: Capitaline
Note: FII Includes depository receipts
Exhibit 4: Top management
Name
Ramachandra N Galla
Jayadev Galla
M R Rajaram
Designation
Chairman
Vice Chairman & M.D.
Company Secretary
Exhibit 5: Directors
Name
N Sri Vishnu Raju*
Raymond J Brown*
T R Narayanaswamy*
Raphael John Shemanski
Name
Nagarjun Valluripalli*
Shu Qing Yang
Bhairavi Tushar Jain
Source: Capitaline
*Independent
Exhibit 6: Auditors
Name
Brahmayya & Co
Deloitte Haskins & Sells LLP
Sagar & Associates
Type
Statutory
Statutory
Cost Auditor
Source: Capitaline
Exhibit 7: MOSL forecast v/s consensus
EPS
(INR)
FY18
MOSL forecast
29.2
37.7
Consensus
forecast
33.9
41.6
Variation
(%)
-13.9
-9.3
Source: Bloomberg
FY17
23 January 2017
8

Amara Raja Batteries
NOTES
23 January 2017
9

Disclosures
This document has been prepared by Motilal Oswal Securities Limited (hereinafter referred to as Most) to provide information about the company (ies) and/sector(s), if any, covered in the report and may
Raja Batteries
its
Amara
be distributed by it and/or
affiliated company(ies). This report is for personal information of the selected recipient/s and does not construe to be any investment, legal or taxation advice to you. This research report does not constitute an offer, invitation or
inducement to invest in securities or other investments and Motilal Oswal Securities Limited (hereinafter referred as MOSt) is not soliciting any action based upon it. This report is not for public distribution and has been furnished to
you solely for your general information and should not be reproduced or redistributed to any other person in any form. This report does not constitute a personal recommendation or take into account the particular investment
objectives, financial situations, or needs of individual clients. Before acting on any advice or recommendation in this material, investors should consider whether it is suitable for their particular circumstances and, if necessary, seek
professional advice. The price and value of the investments referred to in this material and the income from them may go down as well as up, and investors may realize losses on any investments. Past performance is not a guide for
future performance, future returns are not guaranteed and a loss of original capital may occur.
MOSt and its affiliates are a full-service, integrated investment banking, investment management, brokerage and financing group. We and our affiliates have investment banking and other business relationships with a some
companies covered by our Research Department. Our research professionals may provide input into our investment banking and other business selection processes. Investors should assume that MOSt and/or its affiliates are
seeking or will seek investment banking or other business from the company or companies that are the subject of this material and that the research professionals who were involved in preparing this material may educate investors
on investments in such business . The research professionals responsible for the preparation of this document may interact with trading desk personnel, sales personnel and other parties for the purpose of gathering, applying and
interpreting information. Our research professionals are paid on twin parameters of performance & profitability of MOSt.
MOSt generally prohibits its analysts, persons reporting to analysts, and members of their households from maintaining a financial interest in the securities or derivatives of any companies that the analysts cover. Additionally, MOSt
generally prohibits its analysts and persons reporting to analysts from serving as an officer, director, or advisory board member of any companies that the analysts cover. Our salespeople, traders, and other professionals or affiliates
may provide oral or written market commentary or trading strategies to our clients that reflect opinions that are contrary to the opinions expressed herein, and our proprietary trading and investing businesses may make investment
decisions that are inconsistent with the recommendations expressed herein. In reviewing these materials, you should be aware that any or all of the foregoing among other things, may give rise to real or potential conflicts of interest.
MOSt and its affiliated company(ies), their directors and employees and their relatives may; (a) from time to time, have a long or short position in, act as principal in, and buy or sell the securities or derivatives thereof of companies
mentioned herein. (b) be engaged in any other transaction involving such securities and earn brokerage or other compensation or act as a market maker in the financial instruments of the company(ies) discussed herein or act as an
advisor or lender/borrower to such company(ies) or may have any other potential conflict of interests with respect to any recommendation and other related information and opinions.; however the same shall have no bearing
whatsoever on the specific recommendations made by the analyst(s), as the recommendations made by the analyst(s) are completely independent of the views of the affiliates of MOSt even though there might exist an inherent
conflict of interest in some of the stocks mentioned in the research report
Reports based on technical and derivative analysis center on studying charts company's price movement, outstanding positions and trading volume, as opposed to focusing on a company's fundamentals and, as such, may not
match with a report on a company's fundamental analysis. In addition MOST has different business segments / Divisions with independent research separated by Chinese walls catering to different set of customers having various
objectives, risk profiles, investment horizon, etc, and therefore may at times have different contrary views on stocks sectors and markets.
Unauthorized disclosure, use, dissemination or copying (either whole or partial) of this information, is prohibited. The person accessing this information specifically agrees to exempt MOSt or any of its affiliates or employees from,
any and all responsibility/liability arising from such misuse and agrees not to hold MOSt or any of its affiliates or employees responsible for any such misuse and further agrees to hold MOSt or any of its affiliates or employees free
and harmless from all losses, costs, damages, expenses that may be suffered by the person accessing this information due to any errors and delays. The information contained herein is based on publicly available data or other
sources believed to be reliable. Any statements contained in this report attributed to a third party represent MOSt’s interpretation of the data, information and/or opinions provided by that third party either publicly or through a
subscription service, and such use and interpretation have not been reviewed by the third party. This Report is not intended to be a complete statement or summary of the securities, markets or developments referred to in the
document. While we would endeavor to update the information herein on reasonable basis, MOSt and/or its affiliates are under no obligation to update the information. Also there may be regulatory, compliance, or other reasons that
may prevent MOSt and/or its affiliates from doing so. MOSt or any of its affiliates or employees shall not be in any way responsible and liable for any loss or damage that may arise to any person from any inadvertent error in the
information contained in this report. MOSt or any of its affiliates or employees do not provide, at any time, any express or implied warranty of any kind, regarding any matter pertaining to this report, including without limitation the
implied warranties of merchantability, fitness for a particular purpose, and non-infringement. The recipients of this report should rely on their own investigations.
This report is intended for distribution to institutional investors. Recipients who are not institutional investors should seek advice of their independent financial advisor prior to taking any investment decision based on this report or for
any necessary explanation of its contents.
Most and it’s associates may have managed or co-managed public offering of securities, may have received compensation for investment banking or merchant banking or brokerage services, may have received any compensation
for products or services other than investment banking or merchant banking or brokerage services from the subject company in the past 12 months.
Most and it’s associates have not received any compensation or other benefits from the subject company or third party in connection with the research report.
Subject Company may have been a client of Most or its associates during twelve months preceding the date of distribution of the research report
MOSt and/or its affiliates and/or employees may have interests/positions, financial or otherwise of over 1 % at the end of the month immediately preceding the date of publication of the research in the securities mentioned in this
report. To enhance transparency, MOSt has incorporated a Disclosure of Interest Statement in this document. This should, however, not be treated as endorsement of the views expressed in the report.
Motilal Oswal Securities Limited is registered as a Research Analyst under SEBI (Research Analyst) Regulations, 2014. SEBI Reg. No. INH000000412
Pending Regulatory inspections against Motilal Oswal Securities Limited:
SEBI pursuant to a complaint from client Shri C.R. Mohanraj alleging unauthorized trading, issued a letter dated 29th April 2014 to MOSL notifying appointment of an Adjudicating Officer as per SEBI regulations to hold inquiry and
adjudge violation of SEBI Regulations; MOSL replied to the Show Cause Notice whereby SEBI granted us an opportunity of Inspection of Documents. Since all the documents requested by us were not covered we have requested to
SEBI vide our letter dated June 23, 2015 to provide pending list of documents for inspection.
List of associate companies of Motilal Oswal Securities Limited -
Click here to access detailed report
Analyst Certification
The views expressed in this research report accurately reflect the personal views of the analyst(s) about the subject securities or issues, and no part of the compensation of the research analyst(s) was, is, or will be directly or
indirectly related to the specific recommendations and views expressed by research analyst(s) in this report. The research analysts, strategists, or research associates principally responsible for preparation of MOSt research receive
compensation based upon various factors, including quality of research, investor client feedback, stock picking, competitive factors and firm revenues
Disclosure of Interest Statement
Analyst ownership of the stock
Served as an officer, director or employee -
AMARA RAJA BATTERIES
YES
No
A graph of daily closing prices of securities is available at www.nseindia.com and http://economictimes.indiatimes.com/markets/stocks/stock-quotes
Regional Disclosures (outside India)
This report is not directed or intended for distribution to or use by any person or entity resident in a state, country or any jurisdiction, where such distribution, publication, availability or use would be contrary to law, regulation or which
would subject MOSt & its group companies to registration or licensing requirements within such jurisdictions.
For Hong Kong:
This report is distributed in Hong Kong by Motilal Oswal capital Markets (Hong Kong) Private Limited, a licensed corporation (CE AYY-301) licensed and regulated by the Hong Kong Securities and Futures
Commission (SFC) pursuant to the Securities and Futures Ordinance (Chapter 571 of the Laws of Hong Kong) “SFO”. As per SEBI (Research Analyst Regulations) 2014 Motilal Oswal Securities (SEBI Reg No. INH000000412) has
an agreement with Motilal Oswal capital Markets (Hong Kong) Private Limited for distribution of research report in Kong Kong. This report is intended for distribution only to “Professional Investors” as defined in Part I of Schedule 1 to
SFO. Any investment or investment activity to which this document relates is only available to professional investor and will be engaged only with professional investors.” Nothing here is an offer or solicitation of these securities,
products and services in any jurisdiction where their offer or sale is not qualified or exempt from registration. The Indian Analyst(s) who compile this report is/are not located in Hong Kong & are not conducting Research Analysis in
Hong Kong.
For U.S.
Motilal Oswal Securities Limited (MOSL) is not a registered broker - dealer under the U.S. Securities Exchange Act of 1934, as amended (the"1934 act") and under applicable state laws in the United States. In addition MOSL is not a
registered investment adviser under the U.S. Investment Advisers Act of 1940, as amended (the "Advisers Act" and together with the 1934 Act, the "Acts), and under applicable state laws in the United States. Accordingly, in the
absence of specific exemption under the Acts, any brokerage and investment services provided by MOSL, including the products and services described herein are not available to or intended for U.S. persons.
This report is intended for distribution only to "Major Institutional Investors" as defined by Rule 15a-6(b)(4) of the Exchange Act and interpretations thereof by SEC (henceforth referred to as "major institutional investors"). This
document must not be acted on or relied on by persons who are not major institutional investors. Any investment or investment activity to which this document relates is only available to major institutional investors and will be
engaged in only with major institutional investors. In reliance on the exemption from registration provided by Rule 15a-6 of the U.S. Securities Exchange Act of 1934, as amended (the "Exchange Act") and interpretations thereof by
the U.S. Securities and Exchange Commission ("SEC") in order to conduct business with Institutional Investors based in the U.S., MOSL has entered into a chaperoning agreement with a U.S. registered broker-dealer, Motilal Oswal
Securities International Private Limited. ("MOSIPL"). Any business interaction pursuant to this report will have to be executed within the provisions of this chaperoning agreement.
The Research Analysts contributing to the report may not be registered /qualified as research analyst with FINRA. Such research analyst may not be associated persons of the U.S. registered broker-dealer, MOSIPL, and therefore,
may not be subject to NASD rule 2711 and NYSE Rule 472 restrictions on communication with a subject company, public appearances and trading securities held by a research analyst account.
For Singapore
Motilal Oswal Capital Markets Singapore Pte Limited is acting as an exempt financial advisor under section 23(1)(f) of the Financial Advisers Act(FAA) read with regulation 17(1)(d) of the Financial Advisors Regulations and is a
subsidiary of Motilal Oswal Securities Limited in India. This research is distributed in Singapore by Motilal Oswal Capital Markets Singapore Pte Limited and it is only directed in Singapore to accredited investors, as defined in the
Financial Advisers Regulations and the Securities and Futures Act (Chapter 289), as amended from time to time.
In respect of any matter arising from or in connection with the research you could contact the following representatives of Motilal Oswal Capital Markets Singapore Pte Limited:
Varun Kumar
Varun.kumar@motilaloswal.com
Contact : (+65) 68189232
Office Address:21 (Suite 31),16 Collyer Quay,Singapore 04931
23 January 2017
Motilal Oswal Tower, Level 9, Sayani Road, Prabhadevi, Mumbai 400 025
Phone: +91 22 3982 5500 E-mail: reports@motilaloswal.com
Motilal Oswal Securities Ltd
10