25 January 2017
3QFY17 Results Update | Sector: Technology
Wipro
BSE SENSEX
27,708
Bloomberg
Equity Shares (m)
M.Cap.(INRb)/(USDb)
52-Week Range (INR)
1, 6, 12 Rel. Per (%)
Avg Val, INRm
Free float (%)
S&P CNX
8,603
WPRO IN
India/ME and Healthcare headwinds cast shadow over near term
2,431
Organic revenue declines QoQ CC:
WPRO’s 3QFY17 CC revenue growth of
1,150.9 / 16.9
0.6% QoQ was marginally below our estimate of +1.3% QoQ, and in the
607 / 410
lower half of the company’s guided band of 0-2%. Five weeks of revenue
-3/-13/-27
from the Appirio integration (~1.1% contribution) meant that organic
845
26.8
revenue declined 0.5% QoQ CC. Energy & Natural Resources grew 2.1% QoQ
CMP: INR474
TP: INR540(+14%)
Neutral
Financials & Valuations (INR b)
2016 2017E
Y/E Mar
512.4
550.8
Net Sales
108.1
109.6
EBITDA
88.9
82.4
PAT
36.1
33.4
EPS (INR)
2.9
-7.4
Gr. (%)
189.7
204.5
BV/Sh (INR)
20.3
17.0
RoE (%)
16.7
13.7
RoCE (%)
13.1
14.2
P/E (x)
2.5
2.3
P/BV (x)
2018E
595.8
124.6
90.1
37.2
11.1
229.4
17.0
14.4
12.7
2.1
Estimate change
TP change
Rating change
CC, while all other verticals grew below 1%. In terms of geographies, India &
ME declined 4.2% QoQ CC, while other geographies grew between 1-2%.
Strong execution aids margin beat:
IT Services EBIT margin was 18.3%
(+50bp QoQ), above our estimate of 17.2%, led by strong execution despite
headwinds from lower working days. Overall EBIT margin was 16.4%, in line
with our estimate of 16.2%, implying continued losses in products segment.
PAT grew 2.0% QoQ to INR21b, marginally below our estimate of INR21.9b.
Headwinds to India/ME and Healthcare mar guidance:
For 4QFY17, WPRO
guided for growth of 1-2% QoQ CC. However, excluding ~7 weeks of
expected Appirio revenues (~1.5%), the guidance for organic revenue is
-0.5% to +0.5% QoQ CC, or flat at the midpoint. WPRO’s restructuring in
India/ME business is expected to complete in a few quarters, and Healthcare
is reeling from uncertainty around the future of Affordable Care Act under
the new US President. These segments together contribute 26% of WPRO’s
revenues assuming no overlap.
Valuation view:
We cut forward revenue estimates by 2.4-2.9% and
earnings estimates by 5.4-5.9%, factoring in fresh concerns around
Healthcare in addition to ongoing India restructuring. Over FY16-19, we
expect USD revenue/EPS CAGR of 5%/6%. While valuations at 12.7x FY18E
appear inexpensive, multiple re-rating will elude as long as portfolio issues
drag growth. Our TP of INR540 discounts FY19E earnings by 13x.
Neutral.
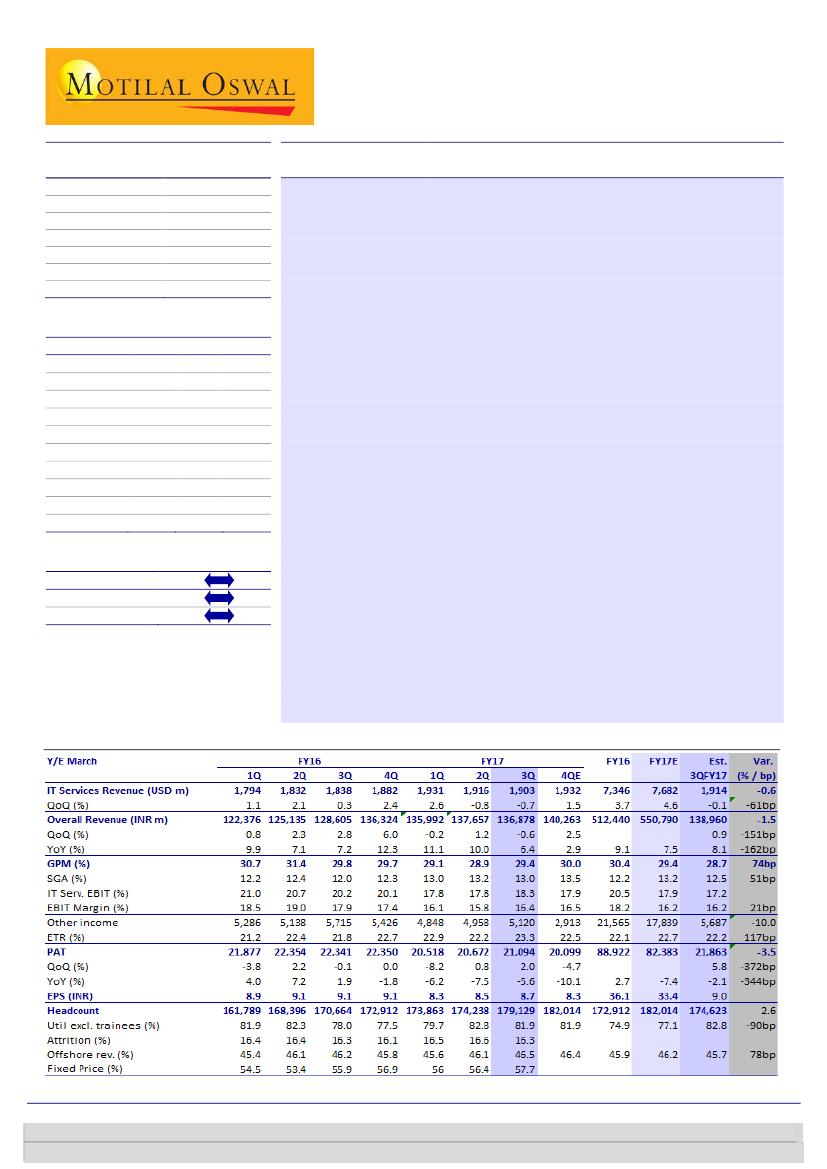
Quarterly Performance (Consolidated)
Investors are advised to refer through important disclosures made at the last page of the Research Report.
Motilal Oswal research is available on www.motilaloswal.com/Institutional-Equities, Bloomberg, Thomson Reuters, Factset and S&P Capital.
Ashish Chopra
(Ashish.Chopra@MotilalOswal.com); +91 22 6129 1530
Sagar Lele
(Sagar.Lele@MotilalOswal.com); +91 22 6129 1531
 Motilal Oswal Financial Services
Wipro
3QFY17:
Revenue in guided range; but decline in organic CC terms
USD Revenue declined 0.7% QoQ to USD1,903m, marginally below our estimate
of USD1,914m.
In constant currency, revenue grew 0.6% QoQ v/s our estimate of 1.2%.
The quarter included revenue from Appirio for five weeks. This implies a
contribution of ~1.1pp, implying organic revenue decline of 0.5% QoQ CC.
In Rupee terms, overall revenues were INR136.88b, -0.7% QoQ, compared to
our estimate of INR138.96b, -0.1% QoQ.
Exhibit 1: Revenue growth of 0.6% QoQ CC in IT services (-0.5% QoQ CC organically)
IT Services (USD m)
2.7
0.2
2.9
2.5
QoQ Growth (%)
2.1
2.4
0.3
2.6
-0.8
-0.7
1.2
1.8
1.3
-1.2
1.1
Source: Company, MOSL
IT Services EBIT margin was 18.3%, +50bp QoQ, above our estimate of 17.2%.
Overall EBIT margin was 16.4%, in line with our estimate of 16.2%, implying
continued losses in the products segment.
Exhibit 3: Utilization steady in the 80-82% range
Utilization % (incl. trainees)
Utilization % (excl. trainees)
Exhibit 2: IT Services EBIT margin expanded by 50bp to
18.3%
IT Services EBIT margin (%)
IT Services SGA as % of Sales
Source: Company, MOSL
Lower revenue growth, better profitability and lower than expected other
income together led to PAT of INR21.1b (+2% QoQ), lower than our estimate of
INR21.9b (+5.8% QoQ).
Headwinds to India / ME and Healthcare mar guidance
For 3QFY17, WPRO guided for sequential growth of 1-2% QoQ CC. However,
excluding ~7 weeks of expected Appirio revenues (~1.5%), the guidance for
organic revenue is -0.5% to +0.5% QoQ CC, or flat at the midpoint.
25 January 2017
2
 Motilal Oswal Financial Services
Wipro
WPRO’s restructuring in the India / ME business is expected to complete in a
couple of quarters and Healthcare is reeling from uncertainty around the future
of Affordable Care Act under the new US President. These segments together
contribute 25.6% to WPRO’s revenues assuming no overlap.
The guidance is in constant currency and is based on the average realized rates
during for 3QFY17, at GBP/USD at 1.23, Euro/USD at 1.04, AUD/USD at 0.74,
USD/INR at 67.73 and USD/CAD at 1.34.
Segmental analysis
During the quarter, Energy & Natural Resources grew 2.1% QoQ CC while all
other verticals grew below 1%
In terms of Geographies, India & ME declined 4.2% QoQ CC while other
geographies grew between 1-2%
Exhibit 4: Revival seen in Energy & Natural Resources
Verticals
Communications
Consumer Business Unit
Energy, Natural Resources & Utilities
Finance Solutions
Healthcare, Life Sciences and Services
Manufacturing & Technology
Contri to
Rev. (%)
7.0
15.8
13.0
25.5
16.0
22.3
CC Growth
- QoQ (%)
0.8
0.1
2.1
0.8
0.1
0.1
CC Growth
- YoY (%)
4.2
0.5
-0.3
4.3
39.0
0.0
Source: Company, MOSL
Exhibit 5: US/Europe grow by 1.0/1.7% QoQ CC
Geographies
US
Europe
India & Middle East business
Other emerging markets
Contri to
Rev. (%)
55.5
10.9
23.6
10.0
CC Growth
- QoQ (%)
1.0
1.7
1.3
-4.2
CC Growth
- YoY (%)
9.0
-1.3
8.5
-5.2
Source: Company, MOSL
Takeaways from Management Commentary
Expect pick-up in CTB spending:
Amid issues around Brexit and some decision
delays prior to US elections this fiscal, spending on Change-the-business (CTB)
initiatives had not picked up despite Digital Transformation thrust. WPRO
expects that to change in CY17 and there should be an uptick in client
investments. WPRO is getting disproportionate share of the CTB segment.
Watchful on two headwinds:
There is some uncertainty around the Healthcare
segment following the US elections, given the cloudy future of the Affordable
Care Act. This may drag on for a while, impacting clients decisions and
consequently, performance of WPRO’s HPS acquisition, in particular. Secondly,
the ongoing restructuring of India & ME business may take another couple of
quarters.
Energy vertical should improve in CY17:
Conversations with clients suggest that
there is a higher level of confidence in the Energy segment as the OPEC
agreement is standing its ground. WPRO is optimistic on the segment in CY17.
On decline in top 2-10 clients:
Revenue from top 2-5 clients declined 4.7% QoQ
and that in top 6-10 clients declined 7.4% QoQ. WPRO attributed the same to
25 January 2017
3
 Motilal Oswal Financial Services
Wipro
seasonality during the quarter, and impact in one large Healthcare customer
amid the slowing environment.
Change in Estimates: Cutting revenue 2.4-3% and earnings 5.4-6%
We have cut our forward revenue estimates by 2.4-2.9% and earnings estimates
by 5.4-5.9%, factoring fresh concerns around the Healthcare vertical in addition
to ongoing India restructuring.
We now model USD revenue growth 7.2% in FY18E and 8.0% in FY19E. Given the
strides in Automation through HOLMES, and execution in last couple of
quarters, we build IT services margin expansion of 20bp in FY18E and 40bp in
FY19E.
Consequently, we expect WPRO to grow its USD revenues at a CAGR of 5% and
EPS at a CAGR of 6%.
Exhibit 6: Change in estimates
Revised
Earlier
Change
FY17E FY18E FY19E FY17E FY18E FY19E FY17E FY18E FY19E
INR/USD
68.8
70.3
70.7
68.1
70.3 70.7 1.0% 0.0% 0.0%
USD Revenue - m
7,682 8,125 8,777 7,802 8,366 8,992 -1.5% -2.9% -2.4%
Growth (%)
4.6
5.8
8.0
6.2
7.2
8.0 -164bp -146bp -1bp
EBIT Margin - Overall (%)
16.2
17.0
17.6
16.5
17.8 17.3
-35bp -77bp 25bp
EBIT Margin - IT Services (%)
17.9
18.2
18.7
17.7
18.5 18.1
26bp -32bp 61bp
EPS - INR (IT Serv & Products)
33.4
37.2
41.7
34.2
39.5 44.1
-2.1% -5.9% -5.4%
Source: Company, MOSL
Valuation and view - No structural turnaround on the anvil just yet
The change in leadership at WPRO has been followed by some tweaks to the
organization structure, while role redundancies and senior exits are a natural
consequence of the process. WPRO to its credit got through with most of those
changes swiftly, to shift focus on execution of the strategy than the distraction
from getting the team in place.
As WPRO’s new leader, Mr. Abid Ali has chalked out an aggressive plan for
WPRO, targeting to reach USD15b revenues with 23% EBIT margin. That implies
revenue CAGR of ~20% over the next four years, and if the margins attain the
300bp expansion, then even higher CAGR for earnings.
That said, given the exit in FY16, performance in 9MFY17, and clouded near-
term outlook, the company remains well short of the run-rate implied in the
aspiration (revenues and operating margins), thereby making the goal post
steeper for the remainder of the period.
Growth underperformance to peers is only a part of WPRO’s problems. What is
also notable is that the single digit CC organic growth had been lopsided in favor
of India / Middle East (+20.7% YoY CC in FY16) and APAC (+11% YoY CC), along
with Healthcare, and two of those three segments are now expected to be weak
in the foreseeable future. Lest that is addressed, even the margins will be at risk.
Moreover, the company is in the middle of active investment mode where
spending is aimed towards building capabilities, training and incentivizing
people, acquiring businesses, and investing in strategic accounts leading to
dilution of rates and margins. The banking of margin resurrection on medium-
term levers like automation and productivity improvement, especially in the
4
25 January 2017
 Motilal Oswal Financial Services
Wipro
absence of strong revenue growth will only result in additional pressure on
earnings.
Over FY16-19, we expect WPRO to grow its USD revenues at a CAGR of 5% and
EPS at a CAGR of 6%. While valuations at 12.7x FY18 appear inexpensive,
multiple re-rating will elude as long as portfolio issues drag growth. Our price
target of INR540 discounts FY19E earnings by 13x.
Neutral.
Key triggers
Pick-up in YoY CC growth guidance ex-acquisitions
Broad-basing of growth across verticals
Uptick in margins from automation and productivity initiatives
Key risk factors
Prolonged weakness in Energy & Utilities / Manufacturing vertical
Continued weakness in top accounts
Continued softness in the Americas and Europe
Exhibit 8: 1-year forward PB band
Avg(x)
Min(x)
7.5
6.5
5.5
4.5
3.5
2.5
1.5
0.5
PB (x)
Peak(x)
Avg(x)
6.3
3.2
1.4
2.2
Min(x)
Exhibit 7: 1-year forward PE band
32
25
18
11
4
15.0
6.0
12.4
PE (x)
Peak(x)
25.1
Source: Bloomberg, MOSL
25 January 2017
5
 Motilal Oswal Financial Services
Wipro
Story in charts
Exhibit 9: Growth guidance not picking up materially…
Exhibit 10: …limiting confidence of growth closer to industry
average
Revenue (USD m)
18.9
3.0
2.7
3.0
2.9 3.0
2.0
0.6
0.9
0.3
2.5
1.5
3.0
2.0
0.5
1.0
13.4
1.5
5.0
6.4
7.0
3.7
4.6
5.8
8.0
Growth (%)
Midpoint of QoQ CC growth guidance (%)
5,221 5,921 6,218 6,618 7,082 7,346 7,682 8,125 8,777
FY11 FY12 FY13 FY14 FY15 FY16 FY17E FY18E FY19E
Source: Company, MOSL
Exhibit 11: E&U has weighed upon performance so far
17.4
10.8
13.5 14.2
15.5
10.3
9.0
269
(1.3)(2.1)
265
(4.2)
(6.5)(8.2)
(6.6)
(9.5)
(10.1)
263 255 247 247
Exhibit 12: Utilization has been inching up
Utilization % (incl. trainees)
Utilization % (excl. trainees)
253 258 270 279 278 298 294 275 273
Source: Company, MOSL
Exhibit 13: Visible uptick in investments (indexed at 100)
140
130
120
110
100
90
80
S&M (IT Serv)
USD revenues
120
116
Exhibit 14: Lever of FPP continues to play…
Revenue proportion fron Fixed price contracts (%)
Source: Company, MOSL
25 January 2017
6
 Motilal Oswal Financial Services
Wipro
Exhibit 1: Operating metrics
3QFY15
Services Composition (%)
IMS
BPO
Product Engg and Mobility
Wipro Analytics
Application Services
Total
R&D
Consulting
Verticals (%)
Global Media & Telecom
Finance Solutions
Manufacturing & Hitech
Healthcare Lifescience
Retail & Transportation
Energy, Natural Resources & Utilities
Communications
Consumer
Manufacturing & Technology
4QFY15
27.9
9.4
7.6
7.1
48.0
100.0
10.2
1.8
13.5
26.5
18.3
11.7
14.5
15.5
1QFY16
28.0
9.3
7.7
7.5
47.5
100.0
10.3
1.7
2QFY16
28.0
9.8
7.9
7.5
46.8
100.0
10.5
1.9
3QFY16
28.1
9.8
8.0
7.4
46.7
100.0
10.4
1.6
4QFY16 1QFY17 2QFY17 3QFY17
28.9
10.6
8.0
7.2
45.3
100.0
10.3
1.4
27.9
12.9
7.1
7.4
44.7
100.0
-
-
28.2
13.4
7.3
7.3
43.8
100.0
-
-
28.1
13.3
7.2
7.0
44.4
100.0
-
-
27.7
9.5
7.1
7.0
48.7
100.0
9.8
1.9
13.8
25.7
18.3
11.7
14.1
16.4
26.8
11.2
15.2
7.4
16.2
23.2
52.5
25.6
10.6
11.3
10
17
30
86
151
244
314
537
99.6
36
1071
3.3
12.2
20.1
26.7
11.4
14.7
7.6
16.2
23.4
53.0
25.2
10.6
11.2
10
17
31
85
154
244
321
533
98.5
67
1100
3.1
11.7
19.8
26.2
12.0
14.4
7.7
16.5
23.2
52.8
24.8
11.0
11.4
9
17
32
85
154
247
325
536
97.9
39
1105
3.2
11.5
19.3
25.4
13.3
14.0
7.7
16.4
23.2
52.5
25.6
11.0
10.9
9
18
33
89
160
248
331
550
96.5
119
1223
2.7
11.0
18.2
25.6
15.3
13.2
7.6
15.8
22.5
53.5
25.4
10.4
10.7
9
19
33
91
170
252
336
565
99.7
50
1208
2.5
10.3
17.6
25.5
16.0
12.9
7.5
15.7
22.4
54.8
24.0
10.4
10.8
8
19
33
91
171
258
341
571
98.6
47
1180
2.6
10.1
17.5
25.5
16.0
13.0
7.4
15.8
22.3
55.5
23.6
10.0
10.9
9
17
33
90
170
264
349
576
87.6
108
1259
2.8
10.0
16.9
Geography (%)
Americas
Europe
India & Middle East business
APAC and Other Emerging Markets
Customer size distribution (TTM)
> $100M
> $75M
> $50M
> $20M
> $10M
> $5M
> $3M
> $1M
Customer metrics
Revenue from Existing customers %
Number of new customers
Total Number of active customers
Customer Concentration (%)
Top customer
Top 5
Top 10
51.4
27.6
9.6
11.4
10
16
31
84
153
226
300
526
97.7
44
1018
3.8
12.7
21.0
51.7
26.3
10.7
11.3
11
15
31
86
150
231
311
542
96.7
65
1054
3.8
12.6
20.6
Source: MOSL, Company
25 January 2017
7
 Motilal Oswal Financial Services
Wipro
Exhibit 2: Operating metrics
3QFY15
EMPLOYEE METRICS
Closing Headcount - IT Services
156,866
Sales & Support staff - IT Services (average)
11,603
Utilization (IT Services excl. BPO, IFOX and I&ME)
Gross Utilization (%)
68.5
Net Utilization (excl support) (%)
75.9
Net Utilization (excl trainees) (%)
78.8
Attrition
IT Services excluding BPO and I&ME
Voluntary TTM
16.5
Voluntary Quarterly Annualized
16.4
Involuntary Quarterly Annualized
-
BPO - Quarterly
13.1
BPO - Post training
9.1
IT SERVICES (EXCL INFOX, BPO, I&ME)
Service Delivery
Revenue from FPP
55.1
% of onsite revenue
54.3
% of offshore revenue
45.7
IMS
3.2
BPO
4.7
Product Engg and Mobility
2.8
Wipro Analytics
-1.5
Application Services
-0.1
R&D
Consulting
Vertical wise
Global Media and Telecom
Finance Solutions
Manufacturing and Hi-Tech
Healthcare, Life Sciences and Services
Retail and Transportation
Energy and Utilities
Communications
Consumer
Manufacturing & Technology
Geography wise
US
Europe
India & Middle East business
Other Emerging markets
Client Concentration
Top client
top 2-5 clients
Top 6-10 clients
Non top 10 clients
3.9
1.8
0.6
0.2
1.9
5.9
2.8
-1.1
4QFY15
158,217
11,629
70.5
78.0
80.5
1QFY16
161,789
12,517
71.3
79.4
81.9
2QFY16
163,396
13,068
69.5
77.2
82.3
3QFY16
170,664
13,239
66.4
73.8
78.0
4QFY16
172,912
13,737
68.1
76.1
77.5
1QFY17
173,863
14,324
69.9
78.8
79.7
2QFY17
174,238
14,543
71.2
80.2
82.8
3QFY17
174,238
14,543
71.6
80.0
81.9
16.5
15.6
-
13.3
9.6
16.4
16.4
-
12.0
9.3
16.4
16.8
-
10.2
8.5
16.3
16.3
-
9.9
8.8
16.1
14.9
-
11.1
9.9
16.5
17.9
-
11.7
9.0
16.6
17.2
-
12.2
10.8
16.3
15.4
-
10.7
8.2
55.5
53.7
46.3
-0.5
-2.2
5.8
0.2
-2.6
2.4
-3.7
-3.3
1.9
-1.2
-1.2
1.6
-6.6
54.5
54.6
45.4
1.5
0.0
2.4
6.8
0.1
2.9
-6.4
-1.1
2.2
2.8
-3.2
4.6
-0.9
53.4
53.9
46.1
2.1
7.6
4.8
2.1
0.6
4.1
14.1
55.9
53.8
46.2
0.7
0.3
1.6
-1.0
0.1
-0.6
-15.5
56.9
54.2
45.8
5.3
10.7
2.4
-0.4
-0.7
1.4
-10.4
56.0
54.4
45.6
-1.0
24.9
-8.9
5.4
1.2
-
-
56.4
53.9
46.1
0.3
3.1
2.0
-2.1
-2.7
-
-
57.7
53.5
46.5
-1.1
-1.4
-2.1
-4.8
0.7
-
-
1.7
3.9
-1.3
4.9
2.1
3.0
3.1
0.5
2.1
1.2
-4.1
-1.3
4.7
2.5
-1.5
5.6
-1.7
1.7
2.2
-0.5
0.0
-1.2
4.1
2.1
3.6
-3.2
-3.4
1.0
-0.7
13.5
-0.5
2.4
1.8
2.4
1.8
5.7
2.4
-2.1
-13.6
2.4
-5.5
3.8
3.4
18.0
-3.3
1.3
-1.2
-0.5
4.5
1.8
-3.0
0.7
-5.0
-3.6
4.0
3.3
-1.1
3.8
-3.0
-2.1
-1.4
-1.2
1.7
-6.2
-0.8
0.2
3.2
-4.6
0.6
-0.6
-0.7
-0.7
0.1
-2.0
-0.1
-1.1
0.6
-2.4
-4.5
0.2
6.9
-4.7
-7.4
0.0
2.1
0.6
5.8
-3.7
10.0
-4.0
-2.2
2.0
-0.6
-5.8
10.2
-2.0
-1.2
-2.3
-4.7
-0.7
2.7
-1.6
0.2
1.1
-12.2
2.3
-0.2
1.7
Source: MOSL, Company
25 January 2017
8
 Motilal Oswal Financial Services
Wipro
Financials and Valuations
Key assumption
INR/USD Rate
Revenues (USD m)
Offshore Revenue (%)
Total Headcount
Net Addition
Per Capita Productivity (USD)
Gross Utilization (%)
IT Services EBIT Margin (%)
2012
48.0
5,921
46.2
135,920
13,535
43,563
69.0
20.8
2012
318,747
2.5
66,713
20.9
10,129
56,584
0
8,939
0
65,523
12,955
19.8
243
52,325
52,325
-14.2
2012
4,917
280,397
285,314
58,958
0
345,121
113,369
54,381
58,988
0
41,961
262,886
10,662
110,353
77,666
64,205
90,880
90,880
0
172,006
345,121
2013
54.3
6,218
46.4
145,812
9,892
42,643
66.7
20.5
2013
374,256
17.4
77,996
20.8
10,650
67,346
0
11,250
0
78,596
16,912
21.5
322
61,362
61,362
17.3
2013
4,926
278,886
283,812
63,816
0
348,799
115,556
65,031
50,525
0
69,222
263,513
3,263
108,623
87,869
63,758
90,931
90,931
0
172,582
348,799
2014
60.4
6,618
45.9
146,053
241
45,312
66.4
22.6
2014
434,269
16.0
97,099
22.4
11,106
85,993
0
15,012
0
101,005
22,601
22.4
438
77,966
77,966
27.1
2014
4,932
338,567
343,499
51,592
0
396,478
127,586
76,137
51,449
0
60,843
324,654
2,293
124,726
117,862
79,773
105,826
105,826
0
218,828
396,478
2015
62.2
7,082
46.0
158,217
12,164
44,759
68.7
22.0
2015
469,545
8.1
104,609
22.3
12,823
91,786
0
19,897
0
111,683
24,594
22.0
531
86,558
86,558
11.0
2015
4,937
403,045
407,982
78,913
0
488,541
143,166
88,960
54,206
0
57,775
412,043
4,849
133,869
164,017
109,308
111,492
111,492
0
300,551
488,541
2016
66.3
7,346
45.9
172,912
14,695
42,486
68.9
20.5
2016
512,440
9.1
108,119
21.1
14,965
93,154
0
21,565
0
114,719
25,305
22.1
492
88,922
88,922
2.7
2016
4,941
461,137
466,078
125,221
0
593,523
168,877
103,925
64,952
0
137,851
404,286
5,390
150,653
104,724
143,519
131,398
131,398
0
272,888
593,523
2017E
68.8
7,682
46.2
182,014
9,102
42,204
71.2
17.9
2017E
550,790
7.5
109,599
19.9
20,437
89,162
0
17,839
0
107,001
24,334
22.7
284
82,383
82,383
-7.4
2017E
4,861
497,714
502,575
154,324
0
659,362
211,462
124,362
87,100
0
250,568
272,930
2,718
153,682
19,729
128,413
133,525
133,525
0
139,405
659,362
2018E
70.3
8,125
46.3
197,514
15,500
41,138
71.3
18.2
2018E
595,801
8.2
124,610
20.9
23,031
101,579
0
15,039
0
116,618
26,239
22.5
327
90,052
90,052
9.3
2018E
4,861
549,764
554,625
142,521
0
699,609
247,873
147,393
100,480
0
282,181
309,142
2,940
166,168
5,174
134,860
142,870
142,870
0
166,272
699,609
2019E
70.7
8,777
46.3
213,014
15,500
41,203
71.2
18.7
2019E
646,307
8.5
137,803
21.3
24,338
113,465
0
17,414
0
130,879
29,448
22.5
327
101,104
101,104
12.3
2019E
4,861
607,020
611,881
130,521
0
744,865
285,591
171,731
113,860
0
282,181
350,892
3,189
180,239
25,437
142,026
152,744
152,744
0
198,148
744,865
Income Statement
Y/E Mar
Net Sales
Change (%)
EBITDA
EBITDA Margin (%)
Depreciation
EBIT
Interest
Other Income
Extraordinary items
PBT
Tax
Tax Rate (%)
Min. Int. & Assoc. Share
Reported PAT
Adjusted PAT
Change (%)
(INR Million)
Balance Sheet
Y/E Mar
Share Capital
Reserves
Net Worth
Debt
Deferred Tax
Total Capital Employed
Gross Fixed Assets
Less: Acc Depreciation
Net Fixed Assets
Capital WIP
Investments
Current Assets
Inventory
Debtors
Cash & Bank
Loans & Adv, Others
Curr Liabs & Provns
Curr. Liabilities
Provisions
Net Current Assets
Total Assets
(INR Million)
25 January 2017
9
 Motilal Oswal Financial Services
Wipro
Financials and Valuations
Ratios
Y/E Mar
Basic (INR)
EPS
Cash EPS
Book Value
DPS
Payout (incl. Div. Tax.)
Valuation(x)
P/E
Cash P/E
Price / Book Value
EV/Sales
EV/EBITDA
Dividend Yield (%)
Profitability Ratios (%)
RoE
RoCE
RoIC
Turnover Ratios (%)
Asset Turnover (x)
Debtors (No. of Days)
Leverage Ratios (%)
Net Debt/Equity (x)
2012
21.3
25.4
116.5
6.0
28.2
2013
24.9
29.3
115.6
7.0
28.1
2014
31.7
36.2
139.9
8.0
25.3
2015
35.1
40.3
166.1
12.0
34.2
13.5
11.7
2.9
2.2
9.8
2.5
19.9
17.1
0.0
5.7
112
21.6
18.9
0.0
7.0
107
24.9
22.5
0.0
8.8
98
23.0
20.2
0.0
9.3
101
2016
36.1
42.2
189.7
6.0
16.6
13.1
11.2
2.5
2.0
9.7
1.3
20.3
16.7
0.0
9.0
101
2017E
33.4
41.7
204.5
9.8
29.4
14.2
11.3
2.3
1.9
9.6
2.1
17.0
13.7
0.0
7.5
101
2018E
37.2
46.7
229.4
13.0
35.0
12.7
10.1
2.1
1.7
8.0
2.7
17.0
14.4
0.0
6.5
98
2019E
41.7
51.8
253.1
15.0
36.0
11.3
9.1
1.9
1.5
7.0
3.2
17.3
15.2
0.0
6.2
98
-0.1
2012
66,713
3,998
-16,462
0
0
54,249
-14,023
40,226
-11,691
0
-25,714
10,663
2,780
0
-25,454
-12,010
16,525
61,141
77,666
-0.1
2013
77,996
2,872
7,501
0
0
88,369
-2,187
86,182
-8,949
0
-11,136
-42,436
4,368
0
-28,962
-67,030
10,203
77,666
87,869
-0.2
2014
97,099
-57
-11,909
0
0
85,133
-12,030
73,103
-5,753
0
-17,783
4,919
-11,324
0
-30,952
-37,357
29,993
87,869
117,862
-0.2
2015
104,609
-24,594
-40,250
0
0
39,765
-15,580
24,185
41,476
0
25,896
0
30,937
0
-50,443
-19,506
46,155
117,862
164,017
0.0
2016
108,119
-7,970
-36,478
0
0
63,671
-25,711
37,960
-124,079
0
-149,790
-12,421
53,336
0
-14,088
26,826
-59,293
164,017
104,724
0.3
2017E
109,599
4,614
21,381
0
0
135,594
-42,585
93,009
-184,747
0
-227,332
-16,416
32,171
0
-40,625
-24,870
-116,608
104,724
-11,884
0.2
2018E
124,610
11,435
-8,322
0
0
127,723
-36,411
91,312
-1,487
0
-37,898
0
-11,803
0
-60,964
-72,767
17,057
-11,884
5,174
0.2
2019E
137,803
14,073
-9,960
0
0
141,917
-37,718
104,198
-1,653
0
-39,372
0
-12,000
0
-70,282
-82,282
20,263
5,174
25,437
Cash Flow Statement
Y/E Mar
Adjusted EBITDA
Non cash opr. exp (inc)
(Inc)/Dec in Wkg. Cap.
Tax Paid
Other operating activities
CF from Op. Activity
(Inc)/Dec in FA & CWIP
Free cash flows
(Pur)/Sale of Invt
Others
CF from Inv. Activity
Inc/(Dec) in Net Worth
Inc / (Dec) in Debt
Interest Paid
Divd Paid (incl Tax) & Others
CF from Fin. Activity
Inc/(Dec) in Cash
Add: Opening Balance
Closing Balance
(INR Million)
25 January 2017
10
 Motilal Oswal Financial Services
Wipro
Corporate profile
Company description
Wipro is the third largest Indian IT services
company and the largest third-party BPO operator
in India. It is the largest third-party R&D services
provider globally, employing over 156,000
employees. It offers among the widest range of IT
and ITeS services and its corporate governance and
transparency are at the highest level in the industry.
Source: MOSL/Bloomberg
Exhibit 1: Sensex rebased
Exhibit 2: Shareholding pattern (%)
Sep-16
Promoter
DII
FII
Others
73.3
5.8
11.1
9.9
Jun-16
55.5
4.9
6.9
32.7
Sep-15
73.4
4.6
12.6
9.4
Source: Capitaline
Exhibit 3: Top holders
Holder Name
LIC of India
JP Morgan Chase Bank NA - ADR's
National Westminster Bank PLC
NA
NA
% Holding
2.5
2.0
1.1
0.0
0.0
Source: Capitaline
Note: FII Includes depository receipts
Exhibit 4: Top management
Name
Azim H Premji
Abidali Z Neemuchwala
T K Kurien
M Sanaulla Khan
Designation
Chairman & Managing
Director
Executive Director &
CEO
Executive
Vice
Chairman
Company Secretary
Exhibit 5: Directors
Name
Ashok S Ganguly
Jagdish N Sheth
N Vaghul
Patrick J Ennis
William Arthur Owens
Name
Ireena Vittal
M K Sharma
Patrick Dupuis
Vyomesh Joshi
Rishad Azim Premji
*Independent
Source: Capitaline
Exhibit 6: Auditors
Name
BSR & Co LLP
Type
Statutory
Exhibit 7: MOSL forecast v/s consensus
EPS
(INR)
FY17
FY18
FY19
Source: Capitaline
MOSL
forecast
33.9
37.1
41.6
Consensus
forecast
34.7
37.9
41.3
Variation (%)
-2.3
-2.2
0.7
Source: Bloomberg
25 January 2017
11
 Motilal Oswal Financial Services
Disclosures
This document has been prepared by Motilal Oswal Securities Limited (hereinafter referred to as Most) to provide information about the company (ies) and/sector(s), if any, covered in the report and may be distributed by it
and/or its affiliated company(ies). This report is for personal information of the selected recipient/s and does not construe to be any investment, legal or taxation advice to you. This research report does not constitute an
offer, invitation or inducement to invest in securities or other investments and Motilal Oswal Securities Limited (hereinafter referred as MOSt) is not soliciting any action based upon it. This report is not for public distribution
and has been furnished to you solely for your general information and should not be reproduced or redistributed to any other person in any form. This report does not constitute a personal recommendation or take into
account the particular investment objectives, financial situations, or needs of individual clients. Before acting on any advice or recommendation in this material, investors should consider whether it is suitable for their
particular circumstances and, if necessary, seek professional advice. The price and value of the investments referred to in this material and the income from them may go down as well as up, and investors may realize losses
on any investments. Past performance is not a guide for future performance, future returns are not guaranteed and a loss of original capital may occur.
MOSt and its affiliates are a full-service, integrated investment banking, investment management, brokerage and financing group. We and our affiliates have investment banking and other business relationships with a some
companies covered by our Research Department. Our research professionals may provide input into our investment banking and other business selection processes. Investors should assume that MOSt and/or its affiliates are
seeking or will seek investment banking or other business from the company or companies that are the subject of this material and that the research professionals who were involved in preparing this material may educate
investors on investments in such business . The research professionals responsible for the preparation of this document may interact with trading desk personnel, sales personnel and other parties for the purpose of
gathering, applying and interpreting information. Our research professionals are paid on twin parameters of performance & profitability of MOSt.
MOSt generally prohibits its analysts, persons reporting to analysts, and members of their households from maintaining a financial interest in the securities or derivatives of any companies that the analysts cover.
Additionally, MOSt generally prohibits its analysts and persons reporting to analysts from serving as an officer, director, or advisory board member of any companies that the analysts cover. Our salespeople, traders, and
other professionals or affiliates may provide oral or written market commentary or trading strategies to our clients that reflect opinions that are contrary to the opinions expressed herein, and our proprietary trading and
investing businesses may make investment decisions that are inconsistent with the recommendations expressed herein. In reviewing these materials, you should be aware that any or all of the foregoing among other things,
may give rise to real or potential conflicts of interest. MOSt and its affiliated company(ies), their directors and employees and their relatives may; (a) from time to time, have a long or short position in, act as principal in, and
buy or sell the securities or derivatives thereof of companies mentioned herein. (b) be engaged in any other transaction involving such securities and earn brokerage or other compensation or act as a market maker in the
financial instruments of the company(ies) discussed herein or act as an advisor or lender/borrower to such company(ies) or may have any other potential conflict of interests with respect to any recommendation and other
related information and opinions.; however the same shall have no bearing whatsoever on the specific recommendations made by the analyst(s), as the recommendations made by the analyst(s) are completely independent
of the views of the affiliates of MOSt even though there might exist an inherent conflict of interest in some of the stocks mentioned in the research report
Reports based on technical and derivative analysis center on studying charts company's price movement, outstanding positions and trading volume, as opposed to focusing on a company's fundamentals and, as such, may not match with a report on a
company's fundamental analysis. In addition MOST has different business segments / Divisions with independent research separated by Chinese walls catering to different set of customers having various objectives, risk profiles, investment horizon,
etc, and therefore may at times have different contrary views on stocks sectors and markets.
Unauthorized disclosure, use, dissemination or copying (either whole or partial) of this information, is prohibited. The person accessing this information specifically agrees to exempt MOSt or any of its affiliates or employees
from, any and all responsibility/liability arising from such misuse and agrees not to hold MOSt or any of its affiliates or employees responsible for any such misuse and further agrees to hold MOSt or any of its affiliates or
employees free and harmless from all losses, costs, damages, expenses that may be suffered by the person accessing this information due to any errors and delays. The information contained herein is based on publicly
available data or other sources believed to be reliable. Any statements contained in this report attributed to a third party represent MOSt’s interpretation of the data, information and/or opinions provided by that third party
either publicly or through a subscription service, and such use and interpretation have not been reviewed by the third party. This Report is not intended to be a complete statement or summary of the securities, markets or
developments referred to in the document. While we would endeavor to update the information herein on reasonable basis, MOSt and/or its affiliates are under no obligation to update the information. Also there may be
regulatory, compliance, or other reasons that may prevent MOSt and/or its affiliates from doing so. MOSt or any of its affiliates or employees shall not be in any way responsible and liable for any loss or damage that may
arise to any person from any inadvertent error in the information contained in this report. MOSt or any of its affiliates or employees do not provide, at any time, any express or implied warranty of any kind, regarding any
matter pertaining to this report, including without limitation the implied warranties of merchantability, fitness for a particular purpose, and non-infringement. The recipients of this report should rely on their own
investigations.
This report is intended for distribution to institutional investors. Recipients who are not institutional investors should seek advice of their independent financial advisor prior to taking any investment decision based on this
report or for any necessary explanation of its contents.
Most and it’s associates may have managed or co-managed public offering of securities, may have received compensation for investment banking or merchant banking or brokerage services, may have received any
compensation for products or services other than investment banking or merchant banking or brokerage services from the subject company in the past 12 months.
Most and it’s associates have not received any compensation or other benefits from the subject company or third party in connection with the research report.
Subject Company may have been a client of Most or its associates during twelve months preceding the date of distribution of the research report
MOSt and/or its affiliates and/or employees may have interests/positions, financial or otherwise of over 1 % at the end of the month immediately preceding the date of publication of the research in the securities mentioned
in this report. To enhance transparency, MOSt has incorporated a Disclosure of Interest Statement in this document. This should, however, not be treated as endorsement of the views expressed in the report.
Motilal Oswal Securities Limited is registered as a Research Analyst under SEBI (Research Analyst) Regulations, 2014. SEBI Reg. No. INH000000412
Pending Regulatory inspections against Motilal Oswal Securities Limited:
SEBI pursuant to a complaint from client Shri C.R. Mohanraj alleging unauthorized trading, issued a letter dated 29th April 2014 to MOSL notifying appointment of an Adjudicating Officer as per SEBI regulations to hold inquiry
and adjudge violation of SEBI Regulations; MOSL replied to the Show Cause Notice whereby SEBI granted us an opportunity of Inspection of Documents. Since all the documents requested by us were not covered we have
requested to SEBI vide our letter dated June 23, 2015 to provide pending list of documents for inspection.
List of associate companies of Motilal Oswal Securities Limited -Click
here to access detailed report
Analyst Certification
The views expressed in this research report accurately reflect the personal views of the analyst(s) about the subject securities or issues, and no part of the compensation of the research analyst(s) was, is, or will be directly or
indirectly related to the specific recommendations and views expressed by research analyst(s) in this report. The research analysts, strategists, or research associates principally responsible for preparation of MOSt research
receive compensation based upon various factors, including quality of research, investor client feedback, stock picking, competitive factors and firm revenues
Wipro
Disclosure of Interest Statement
Analyst ownership of the stock
No
Served as an officer, director or employee -
No
A graph of daily closing prices of securities is available at www.nseindia.com and http://economictimes.indiatimes.com/markets/stocks/stock-quotes
Regional Disclosures (outside India)
This report is not directed or intended for distribution to or use by any person or entity resident in a state, country or any jurisdiction, where such distribution, publication, availability or use would be contrary to law,
regulation or which would subject MOSt & its group companies to registration or licensing requirements within such jurisdictions.
For Hong Kong:
This report is distributed in Hong Kong by Motilal Oswal capital Markets (Hong Kong) Private Limited, a licensed corporation (CE AYY-301) licensed and regulated by the Hong Kong Securities and Futures
Commission (SFC) pursuant to the Securities and Futures Ordinance (Chapter 571 of the Laws of Hong Kong) “SFO”. As per SEBI (Research Analyst Regulations) 2014 Motilal Oswal Securities (SEBI Reg No. INH000000412) has
an agreement with Motilal Oswal capital Markets (Hong Kong) Private Limited for distribution of research report in Kong Kong. This report is intended for distribution only to “Professional Investors” as defined in Part I of
Schedule 1 to SFO. Any investment or investment activity to which this document relates is only available to professional investor and will be engaged only with professional investors.” Nothing here is an offer or solicitation
of these securities, products and services in any jurisdiction where their offer or sale is not qualified or exempt from registration. The Indian Analyst(s) who compile this report is/are not located in Hong Kong & are not
conducting Research Analysis in Hong Kong.
For U.S.
Motilal Oswal Securities Limited (MOSL) is not a registered broker - dealer under the U.S. Securities Exchange Act of 1934, as amended (the"1934 act") and under applicable state laws in the United States. In addition MOSL is
not a registered investment adviser under the U.S. Investment Advisers Act of 1940, as amended (the "Advisers Act" and together with the 1934 Act, the "Acts), and under applicable state laws in the United States.
Accordingly, in the absence of specific exemption under the Acts, any brokerage and investment services provided by MOSL, including the products and services described herein are not available to or intended for U.S.
persons.
This report is intended for distribution only to "Major Institutional Investors" as defined by Rule 15a-6(b)(4) of the Exchange Act and interpretations thereof by SEC (henceforth referred to as "major institutional investors").
This document must not be acted on or relied on by persons who are not major institutional investors. Any investment or investment activity to which this document relates is only available to major institutional investors
and will be engaged in only with major institutional investors. In reliance on the exemption from registration provided by Rule 15a-6 of the U.S. Securities Exchange Act of 1934, as amended (the "Exchange Act") and
interpretations thereof by the U.S. Securities and Exchange Commission ("SEC") in order to conduct business with Institutional Investors based in the U.S., MOSL has entered into a chaperoning agreement with a U.S.
registered broker-dealer, Motilal Oswal Securities International Private Limited. ("MOSIPL"). Any business interaction pursuant to this report will have to be executed within the provisions of this chaperoning agreement.
The Research Analysts contributing to the report may not be registered /qualified as research analyst with FINRA. Such research analyst may not be associated persons of the U.S. registered broker-dealer, MOSIPL, and
therefore, may not be subject to NASD rule 2711 and NYSE Rule 472 restrictions on communication with a subject company, public appearances and trading securities held by a research analyst account.
For Singapore
Motilal Oswal Capital Markets Singapore Pte Limited is acting as an exempt financial advisor under section 23(1)(f) of the Financial Advisers Act(FAA) read with regulation 17(1)(d) of the Financial Advisors Regulations and is a
subsidiary of Motilal Oswal Securities Limited in India. This research is distributed in Singapore by Motilal Oswal Capital Markets Singapore Pte Limited and it is only directed in Singapore to accredited investors, as defined in
the Financial Advisers Regulations and the Securities and Futures Act (Chapter 289), as amended from time to time.
In respect of any matter arising from or in connection with the research you could contact the following representatives of Motilal Oswal Capital Markets Singapore Pte Limited:
Varun Kumar
Varun.kumar@motilaloswal.com
Contact : (+65) 68189232
Office Address:21 (Suite 31),16 Collyer Quay,Singapore 04931
WIPRO
Motilal Oswal Securities Ltd
25 January 2017
Motilal Oswal Tower, Level 9, Sayani Road, Prabhadevi, Mumbai 400 025
Phone: +91 22 3982 5500 E-mail: reports@motilaloswal.com
12