31 January 2017
Market snapshot
Equities - India
Close
Chg .%
Sensex
27,850
-0.1
Nifty-50
8,633
-0.1
Nifty-M 100
15,639
0.0
Equities-Global
Close
Chg .%
S&P 500
2,281
-0.6
Nasdaq
9,448
0.3
FTSE 100
7,118
-0.9
DAX
11,682
-1.1
Hang Seng
9,804
-0.5
Nikkei 225
19,369
-0.5
Commodities
Close
Chg .%
Brent (US$/Bbl)
54
-0.7
Gold ($/OZ)
1,196
0.4
Cu (US$/MT)
5,811
-1.2
Almn (US$/MT)
1,797
-1.0
Currency
Close
Chg .%
USD/INR
67.9
-0.1
USD/EUR
1.1
0.0
USD/JPY
113.8
-1.2
YIELD (%)
Close 1MChg
10 Yrs G-Sec
6.4
0.0
10 Yrs AAA Corp
7.6
0.0
Flows (USD b)
30-Jan
MTD
FIIs
0.1
-0.1
DIIs
0.0
0.6
Volumes (INRb) 30-Jan MTD*
Cash
226
219
F&O
2,080
4,001
Note: YTD is calendar year, *Avg
YTD.%
4.6
5.5
9.0
YTD.%
1.9
2.1
-0.3
1.7
4.4
1.3
YTD.%
-1.7
3.8
5.2
5.4
YTD.%
0.0
1.7
-2.7
YTDchg
-0.1
0.0
CY16
2.9
5.3
CY16*
220
3,447
Today’s top research ideas
v
Vodafone and Idea Cellular issued a press release on 30 January 2017 highlighting
that they are in a preliminary discussion to explore merger opportunities. This deal
is likely to have large-scale ramifications in the telecom industry, as the merged
company may emerge as a leader with ~42% revenue market share and a strong
broadband network.
v
It would also help reduce their annual capex by ~20-25% and improve EBITDA
margin by ~500bp. Assuming both Vodafone and Idea have an equal stake, the
combined entity should be valued at ~7x EV/EBITDA, reducing leverage by 10-15%,
albeit with a low post-tax RoCE of 5%. We believe Idea’s stock is not a play on
valuation, but on the likely improvement in its market standing post the merger,
which should address the key concern around its earnings visibility.
Idea: Vodafone-Idea merger; Telecom behemoth in the making
Research covered
Cos/Sector
Idea Cellular
HDFC 3QFY17
Bajaj Fin. 3QFY17
Shree Cement 3QFY17
Godrej Cons. 3QFY17
Tech Mah. 3QFY17
Grasim Ind. 3QFY17
Emami 3QFY17
Info Edge 3QFY17
Dish TV 3QFY17
Just Dial 3QFY17
Granules 3QFY17
Results Flash
Results Expectation
Key Highlights
Vodafone-Idea merger: Telecom behemoth in the making
Pick-up in corporate business leads strong core PBT beat
Profit beat led by strong AUM growth
Steady performance in challenging environment
Domestic branded volume growth down 3%; healthy margin performance
Continuum of recovery in Telecom and margins
VSF continues to shine; Chemical under pressure
Robust domestic performance; margin expansion continues
Slump in Recruitment drives significant miss
Demonetization impacts recharges and subscriber additions
Focus on core business; advertisement campaign launch soon
Continued margin improvement; multiple levers ahead
GE T&D | V-Guard | Monsanto | Kitex Garments
BJAUT | CDH | DABUR | IOCL | ICICIBC | INDIGO | JSTL | KSCL | MPHL |
ONGC | OINL | SHOP | SHTF | TTKPT
Quote of the day
A business that makes nothing but
money is a poor business
Piping hot news
Vodafone confirms Idea merger talks, could create India’s biggest telecom firm
v
Consolidation in India’s $27 billion telecom industry received a massive boost
with Vodafone Group Plc. confirming that it is in talks for a merger of its
Indian unit with Aditya Birla Group’s Idea Cellular Ltd.
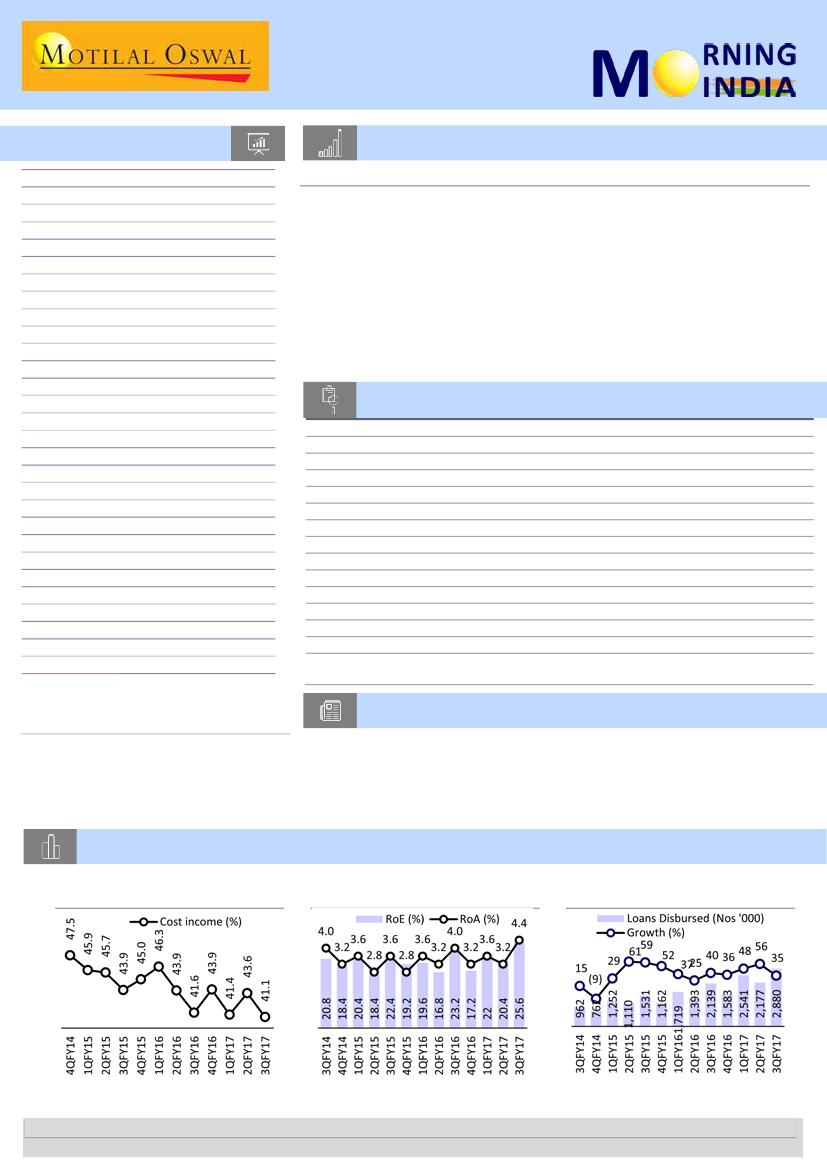
Chart of the Day: Bajaj Finance - Profit beat led by strong AUM growth
Cost/income ratio on a downward
trajectory
Trend in RoE and RoA
Nos. of loan disb. grew at healthy 35%
YoY
Research Team (Gautam.Duggad@MotilalOswal.com)
Motilal Oswal research is available on www.motilaloswal.com/Institutional-Equities, Bloomberg, Thomson Reuters, Factset and S&P Capital.
Investors are advised to refer through important disclosures made at the last page of the Research Report.

In the news today
Kindly click on numbers for the detailed news link
1
US President Donald Trump is
expected to sign a new executive
order aimed at strangulating
work-visa programmes, including
the H1B and L1 visas used by
Indian IT professionals, as part of
a larger immigration reform
effort, a top White House …
2
Rs 7,400 cr debt: SBI looks to SC to recover loans from Jindal Steel
and Power
In another attempt to recover its outstanding dues of Rs 7,400 crore, a
consortium of eight banks, led by State Bank of India (SBI) has urged the
Supreme Court to implead it as a party in the mining case related to Jindal
Steel and Power (JSPL), saying any direction to refuse permission to the
firm to lift and transport iron ore lying at its long time supplier Sarda
Mines Private Ltd (SMPL) plant in the Keonjhar district of Orissa will bleak
its chances of recovery…
Donald Trump’s new executive
order to clamp down on H1B
visas
3
Tata Steel Ltd is now looking to
ramp up the contribution of direct
sales to consumers from 20% of
revenue to 30%. Such sales, which
Narendran refers to as B2C or
business-to-consumer, are more
profitable for Tata Steel. In 5-8
years, he expects its contribution
to go up to 30% of revenue…
4
Tata Motors reshuffles senior
management for a leaner
structure
Tata Motors Ltd is reshuffling the
roles of its top executives as part
of a restructuring exercise it
initiated a few months ago to
make the firm more efficient, said
three people aware of the
developments. All of them
declined to be identified…
Tata Steel will seek board nod
to raise Kalinganagar plant
capacity to 8 mt
5
ATM cash withdrawal limit
eased further
Facing criticism from the Election
Commission (EC) for not allowing
candidates contesting the coming
Assembly polls to withdraw cash
up to their legal limit, the Reserve
Bank of India (RBI) on Monday
removed withdrawal restrictions
on current, cash credit and
overdraft accounts with
immediate effect. ATM
withdrawal restrictions will also
be eased from Wednesday, RBI
said. A savings account holder
may now withdraw up to Rs
24,000 at one go from ATMs…
6
Telenor joins M&A rush, seeks
Aircel-Reliance
Communication tieup
Norway’s Telenor has approached
Aircel and Reliance
Communication to explore a
merger possibility through share
swap as consolidation grips the
Indian telecom industry, said
three executives aware of the
matter...
7
Piramal to acquire specialty
products of UK's Mallinckrodt
for $170 million
Ajay Piramal, the billionaire who
had sold his drug formulation
company to Abbott Pharma for Rs
17,000 crore about seven years
ago, on Monday said his critical
care company in the UK will
acquire specialty products of US
drug maker Mallinkrodt for $170
31 January 2017
2

Idea Cellular
BSE SENSEX
27,850
S&P CNX
8,633
30 January 2017
Update
| Sector:
Telecom
CMP: INR98
Under review
Vodafone-Idea merger: Telecom behemoth in the making
The merger to address key concern around Idea’s earnings visibility
Stock Info
Bloomberg
Equity Shares (m)
52-Week Range (INR)
1, 6, 12 Rel. Per (%)
M.Cap. (INR b)
M.Cap. (USD b)
Avg Val, INRm
Free float (%)
Financials Snapshot (INR b)
Y/E Mar
2016
2017E
2018E
IDEA IN
3,601
128 / 66
28/-5/-17
352.7
5.2
860
57.6
Vodafone and Idea Cellular issued a press release on 30 January 2017 highlighting that
they are in a preliminary discussion to explore merger opportunities. This deal is likely to
have large-scale ramifications in the telecom industry, as the merged company may
emerge as a leader with ~42% revenue market share and a strong broadband network. It
would also help reduce their annual capex by ~20-25% and improve EBITDA margin by
~500bp. Assuming both Vodafone and Idea have an equal stake, the combined entity
should be valued at ~7x EV/EBITDA, reducing leverage by 10-15%, albeit with a low post-
tax RoCE of 5%. We believe Idea’s stock is not a play on valuation, but on the likely
improvement in its market standing post the merger, which should address the key
concern around its earnings visibility.
Large-scale ramifications on competitive landscape
Net Sales
EBITDA
NP
EPS (INR)
EPS Gr. (%)
BV/Sh. (INR)
RoE (%)
RoCE (%)
P/E (x)
P/BV (x)
359.8 355.5 358.9
130.3 101.5
96.4
30.8 -22.6 -46.4
8.6
-6.3 -12.9
56.5 -170.7 -250.7
71.6
65.3
52.4
12.6
-9.2 -21.9
7.1
2.7
0.3
11.5 -15.6
-7.6
1.4
1.5
1.9
Shareholding pattern (%)
As On
Dec-16 Sep-16 Dec-15
Promoter
42.5
42.2
42.2
DII
6.9
6.6
5.4
FII
24.3
25.1
24.1
Others
26.3
26.1
28.3
FII Includes depository receipts
Stock Performance (1-year)
Idea Cellular
Sensex - Rebased
140
120
100
80
60
Challenges: Spectrum and revenue caps remain the key hurdles
Vodafone and Idea currently are the second and third largest telecom
operators, respectively, in the Indian telecom industry. We thus believe that
the merged entity could emerge as an industry leader, with combined revenue
and subscriber market share of 42% and 36%, respectively, and blended ARPU
of INR178.
Bharti and RJio currently hold the highest spectrum (20% of market) and cell
sites. They are also the most aggressive players in the industry, given their
deep network and low capacity utilization. However, the merged company
could pose a major challenge with combined spectrum share of ~23% and
broadband cell sites of over 1,60,000 (close to Bharti’s 1,70,000 sites and
~40,000 lesser for RJio).
Post-merger, the three strong operators – the merged company, Bharti and
RJio – could be equipped with equal armory to compete in the market. This
scenario could support our expectation of an improving competitive landscape
and industry ARPU accretion in 2HFY18.
In our view, the deal could face two key challenges: India’s telecom M&A rules
do not allow revenue and subscriber market shares above 50%. Similarly,
spectrum holding in each band is not allowed above 50%. The merger
company’s revenue/subscriber caps and spectrum caps may get triggered in 7
and 6 circles, respectively. However, the merged company’s
revenue/subscriber share is more than 60% in only one circle – Kerala. In the
rest of the circles, it is between 50% and 60%. This may get resolved once RJio
starts charging subscribers and taking revenue market share.
Based on the current 50% band-wise spectrum cap, the merged company has
~33 MHz of excess spectrum, of which ~15 MHz is 900 MHz paired spectrum.
Based on latest spectrum valuation (pro-rata for the remaining license term),
the merged company may be able to generate over INR75b from the excess
spectrum. This should support the merged company’s cash outflow toward
liberalizing the administered spectrum, which is ~20% of the merged
company’s spectrum.
31 January 2017
3

How would the combined entity look
The merged company should have revenue of INR745b (1HFY17 annualized),
assuming 20% lower revenue due to the weak outlook and revenue market
share shrinkage. We expect the merged company to garner healthy EBITDA
margin of 35%, at ~500bp discount to Bharti India wireless’ FY17E EBITDA
margin. This implies about 500bp margin improvement, which could potentially
come from network synergies, employee costs and SG&A.
Improving combined EBITDA could improve Idea’s leverage, albeit by a
moderate 10-15%. Current net debt to EBITDA of 5x could reduce to ~4x. This
would still remain high for the merged company.
Assuming about 20% synergy on total assets as well as EBITDA synergies, the
merged company’s post-tax RoCE could improve to 5%, from 3-4% for Idea and
Vodafone.
Valuation: Assuming 50% Vodafone stake, the merged company could trade
at about 7x EV/EBITDA
Assuming Vodafone is an equal shareholder, the combined entity should be
valued at about 7x EV/EBITDA, factoring in 500bp EBITDA margin improvement.
Vodafone should fetch EV of INR917b and equity value of INR360b.
We have not changed our estimates for Idea on the back of limited clarity on the
deal. We put the stock under review until we gather more clarity on the
likelihood of the deal and the potential impact of the same on valuations and
earnings. We believe Idea is no more a play on valuation at potentially ~7x
EV/EBITDA for the merged company. If the deal goes through, the merged
company’s wherewithal to stand in the highly competitive market will be a key
monitorable. Given the merged company’s superior spectrum/network position,
higher revenue market share and ~20-25% lower capex requirement, the high
FCF could be used to strengthen its market position.
The merger should impact Bharti Infratel’s tenancies
We expect Bharti Infratel to grow tenancies and rental revenues at ~7% and 9%,
respectively, over FY16-19E. We believe if this deal goes through, it will impact
Bharti Infratel’s tenancies given that ~85% of the tenancies are derived from the
top three operators. As the merged company may pair down unwanted network
overlaps between the two entities, we suspect a one-time ~10% tenancy
reduction. Also, as the merged company may have higher geographical
coverage, we expect it to offer potentially 30-40% reduction in annual tenancy.
31 January 2017
4

Exhibit 1:
Proforma vs Synergies (INR m)
1H FY17Annualised
Revenue
EBITDA
EBITDA margin
EBIT
EBIT Margin
Net Debt
Market Cap
EV
Total Assets
EV/EBITDA (x)
Net Debt to EBITDA (x)
ROCE (post tax)
Share price
No of shares (m)
Idea
Vodafone Idea + Vodafone
413,665
125,417
30.3%
36,414
9%
1,116,070
720,161
1836,231
1,583,922
7.3
4.4
3%
100
7,202
Idea + Vodafone +
Synergy (annualized)
744,596
260,609
35%
82,602
11%
1,116,070
720,161
1,836,231
1,267,137
7.0
4.3
5%
100
7,202
Assuming 30% tax
CMP
Assuming Vodafone to get equal
shareholding in overall entity
Source: Company, MOSL
Assuming -10% net current asset for
Vodafone and 20% synergy on combined assets
500bp discount to Bharti India Wireless margin
Comments
20% lower on 1HFY17 numbers factoring
competitive intensity
187,869 225,796
59,143
31%
20,409
11%
66,273
29%
16,005
7%
5592,77 556,793
360,080 360,080
919,358 916,873
735,625 848,297
7.8
4.7
4%
100
3,601
6.9
4.2
3%
100
3,601
Exhibit 2:
Potential Pre and Post Shareholding
Particulars
Promoter holding
Axiata
Public
Total
Pre Merger
Post Merger
% holdings No. of shares (m)
Particulars
% holdings No. of shares (m)
42.45%
1,529
Vodafone
50%
3,601
19.77%
712
Idea promoters
21%
1,529
37.8%
1,360
Axiata
10%
712
Public
19%
1,360
100.0%
3,601
Total
100%
7,202
Source: Company, MOSL
Exhibit 3:
Vodafone Valuation (Annualized FY17 figures)
Particulars
EBITDA (NR m)
Market Cap (NR m)
Debt (NR m)
EV (NR m)
EV/EBITDA (x)
132547
360,080
556,793
916,873
6.92
Source: Company, MOSL
31 January 2017
5

30 January 2017
3QFY17 Results Update | Sector:
Financials
HDFC
BSE SENSEX
27,850
Bloomberg
Equity Shares (m)
M.Cap. (INR b) / (USD b)
52-Week Range (INR)
1, 6, 12 Rel. Per (%)
12M Avg Val (INR M)
Free float (%)
S&P CNX
8,633
HDFC IN
1,574.7
2,155.8/31.7
1,463/1,012
4/2/4
3,609
100.0
2018E
106.5
81.7
38.4
6.2
288.2
237.1
2.3
17.1
43.5
19.9
4.7
3.2
1.4
CMP: INR1,369
TP: INR1,580 (+16%)
Buy
Pick-up in corporate business leads strong core PBT beat
Financials & Valuation (INR Billion)
Y/E MAR
2016
2017E
NII
87.0
99.6
PAT
70.9
74.0
Adj. EPS (INR)
32.6
36.1
EPS Gr. (%)
2.7
10.9
BV/Sh. (INR)
239.6
262.5
ABV/Sh. (INR)
188.4
211.4
RoAA (%)
2.6
2.4
Core RoE (%)
18.9
18.1
Payout (%)
43.9
43.5
Valuation
AP/E (x)
30.2
23.6
P/BV (x)
5.7
5.2
AP/ABV (x)
5.2
4.0
Div. Yield (%)
1.2
1.3
3QFY17 core PBT beat our estimate by 8%. However, a tax rate of 32%,
higher than our estimate of 30%, led to just 3% PAT beat. Key highlights:
a) Spreads improvement of 6bp to 2.34% (9M v/s 1H). b) Strong AUM
growth of 17% YoY (+4% QoQ), best in last 12 quarters. c) Individual
disbursement growth of 14% YoY in 9MFY17; growth slowed to 3% YoY
in 3QFY17 due to demonetization. d) GNPA % increase of 10bp YoY to
0.8%.
After 15 quarters, corporate loans grew more than 15% YoY to 17%.
Corporate loans grew 7% QoQ, driving ~45% of incremental growth for
3Q. Large part of this growth was driven by lease rental discounting,
which is relatively a safe product. Share of corporate loans in overall
AUM was up 30bp QoQ to 27.3%. However, we expect marginal
moderation in 4Q growth due to high base.
Retail AUM grew 17% YoY, in line with the trend over past several
quarters. We believe that this is commendable in the competitive
environment and that HDFC should be able to sustain this growth (led
by benefit on cost of funds) as its loans are priced in line with large
banks.
Other highlights
a) Share of off-balance sheet AUM in overall AUM up
110bp QoQ to 12.5%. d) Sold loans worth INR33.55b v/s INR19.4b the
previous quarter to HDFC Bank. e) Tier-I capital at 13.4%.
Valuation view:
HDFC’s retail loan growth is impressive, despite intense
competition. Over past three quarters, corporate loan growth has also
picked up smartly – this remains a key for overall spreads, considering
individual spreads are under pressure. We largely maintain our FY17
estimates, but cut FY18E/19E by 4% to factor in high competitive intensity in
the retail segment. We expect AUM CAGR of ~14% with core PBT CAGR ~9%.
We have considered DTL on special reserve as a part of networth.
31 January 2017
6

30 January 2017
3QFY17 Results Update | Sector:
Financials
Bajaj Finance
Buy
BSE SENSEX
27,850
Bloomberg
Equity Shares (m)
M.Cap.(INR b)/(USD b)
52-Week Range (INR)
1, 6, 12 Rel. Per (%)
Avg Val, (INR m)
Free float (%)
S&P CNX
8,633
BAF IN
Profit beat led by strong AUM growth; Maintain Buy
535.5
Bajaj Finance’s (BAF) 3QFY17 PAT increased 36% YoY to INR5.6b (26%
564.4/8.3
above estimate), led by robust AUM growth of 33% YoY (est. of +27%)
1180 / 560
and better-than-expected margins performance. Marginal improvement
21/-3/66
in costs and asset quality also offered support.
1297
Despite demonetization, AUM continued its robust growth trajectory
41.9
CMP: INR1,054
TP: INR1,276 (+21%)
Financials & Valuations (INR b)
Y/E March
2016 2017E 2018E
NII
40.3
53.7
71.2
PPP
25.1
35.1
46.7
PAT
12.8
18.3
23.9
EPS (INR)
23.9
34.1
44.6
EPS Gr. (%)
33.4
42.8
30.9
BV/Sh. (INR)
136.8 165.9 204.0
RoA on AUM (%)
3.2
3.4
3.4
RoE (%)
21.1
22.5
24.1
Payout (%)
2.9
14.0
14.0
Valuations
P/E (x)
44.1
30.9
23.6
P/BV (x)
7.7
6.4
5.2
Div. Yield (%)
0.2
0.2
0.3
(+33% YoY, +10% QoQ) to reach INR576b. Growth continues to be
impressive in consumer durables and personal loan segments.
Surprisingly, 2W/3W loan book also grew 36% YoY, with BAF increasing
its financing penetration within Bajaj Auto sales to 45% from 32% earlier.
Consumer durables loan book grew 5% YoY due to demonetization as
well as intentional scale-back in this segment as mentioned by
management earlier. Mortgage book grew by a sluggish 9% YoY, in line
with management guidance. We, however, expect growth in this segment
to pick up from FY18 as the base effect plays out.
Personal cross-sell loans grew 59% YoY to INR56b. It was the eighth
consecutive quarter of 50%+ AUM growth in this segment. Rural loan
book also grew 100%+ YoY, but on a small base (4% of AUM).
Asset quality remained healthy, with GNPLs at 1.47% v/s 1.58% in 2QFY17
and 1.29% (150dpd) in 3QFY16. The impact of demonetization on the
GNPL ratio, if any, will be seen in 4QFY17.
Valuation and view:
BAF – a dominant player in the consumer durables
financing segment – continues to reap the benefits of healthy consumer
demand, increasing its market share in consumer as well as other
businesses. At the same time, it is proactive in detecting early warning
signals with regard to asset quality. While yields are likely to remain
under pressure due to lower share of CD financing, BAF continues to
diversify its liability mix – bank borrowings account for 37% of total
borrowings. The stock trades at 6.4x/5.2x FY17E/18E BV. We raise FY17E-
19E EPS by 5-7%, and increase TP to INR1,276.
Buy.
(INR Million)
FY17
2Q
3QE
21,802
25,271
1,668
1,749
23,470
39.7
9,562
13,909
41.2
190
14,098
6,144
7,954
40.8
1,691
6,263
2,185
4,078
45.9
37.8
43.4
43.6
34.9
27,020
31.1
9,802
17,218
31.2
271
17,489
7,192
10,297
33.5
1,797
8,500
2,944
5,557
36.0
32.6
30.2
41.1
34.6
FY16
4Q
23,900
1,707
25,607
33.6
10,716
14,891
34.0
394
15,285
6,785
8,500
31.7
1,824
6,676
2,296
4,380
39.0
35.5
34.9
44.4
34.4
69,566
3,477
73,043
35.7
29,269
43,775
39.7
792
44,566
19,492
24,283
42.4
5,429
18,854
6,861
12,785
42.4
38.8
38.7
44.5
34.1
FY17E
92,633
6,329
98,961
35.5
38,913
60,048
37.2
1,001
61,049
25,986
34,063
40.3
7,109
26,954
9,700
18,254
42.8
32.5
34.9
43.3
35.1
Quarterly Performance
Y/E March
Income from operations
Other Operating Income
Operating Income
YoY Growth (%)
Interest expenses
Net Income
YoY Growth (%)
Other income
Total Income
Operating Expenses
Operating Profit
YoY Growth (%)
Provisions and Cont.
Profit before Tax
Tax Provisions
Net Profit
YoY Growth (%)
Loan Growth (%)
Borrowings Growth (%)
Cost to Income Ratio (%)
Tax Rate (%)
E: MOSL Estimates
1Q
15,716
746
16,462
32.4
6,771
9,692
30.3
96
9,788
4,531
5,257
30.3
1,033
4,224
1,468
2,756
30.4
32.0
34.7
46.3
34.8
FY16
2Q
3Q
15,921
19,717
878
897
16,799
36.3
6,947
9,853
43.3
206
10,059
4,411
5,648
49.1
1,368
4,280
1,486
2,794
41.7
35.6
30.0
43.9
34.7
20,614
39.6
7,493
13,121
48.4
83
13,203
5,490
7,714
54.0
1,462
6,252
2,167
4,085
58.1
41.0
37.2
41.6
34.7
4Q
18,212
957
19,168
34.1
8,058
11,110
35.9
406
11,516
5,061
6,455
40.9
1,565
4,890
1,740
3,150
36.4
36.5
38.7
43.9
35.6
1Q
21,659
1,205
22,864
38.9
8,833
14,031
44.8
147
14,178
5,865
8,312
58.1
1,797
6,515
2,275
4,240
53.8
39.5
40.5
41.4
34.9
31 January 2017
7

30 January 2017
3QFY17 Results Update | Sector: Cement
Shree Cement
Buy
BSE SENSEX
27,850
Bloomberg
Equity Shares (m)
M.Cap.(INRb)/(USDb)
52-Week Range (INR)
1, 6, 12 Rel. Per (%)
Avg Val, INRm
Free float (%)
S&P CNX
8,633
SRCM IN
Steady performance in challenging environment
35
Strong volume growth and lower realizations:
3QFY17 volumes increased
546.2 / 8.2
~5% YoY (+7% QoQ) to 4.91mt, led by capacity ramp-up in east. Realizations
18519 / 9850
fell 7% QoQ (+7% YoY) due to weak realizations in its focus markets of north
2/-8/38
and east and also led by higher proportion of ex-factory sales.
220
Margin deterioration led by weak realization:
EBITDA of INR4.7b (+2% YoY)
35.2
CMP: INR15,677
TP: INR19,006(+21%)
Financials & Valuations (INR b)
Y/E Mar
2016
2017E
Net Sales
72.5
84.9
EBITDA
17.3
23.9
PAT
8.3
13.5
EPS (INR)
238.5
387.1
Gr. (%)
79.1
62.3
BV/Sh (INR)
1,774.0 2,120.0
RoE (%)
14.5
19.9
RoCE (%)
14.3
19.5
P/E (x)
65.7
40.5
P/BV (x)
8.8
7.4
2018E
99.8
30.5
20.3
582.8
50.5
2,656.2
24.4
23.5
26.9
5.9
Estimate change
TP change
Rating change
missed estimate of INR4.9b, with margins at 25.4% (-7.26pp QoQ, flat YoY)
due to higher-than-expected other expenses. Unitary cost rose 6% YoY (+2%
QoQ), led by higher power/fuel cost and other expenses. Freight cost/t
declined 4% QoQ, despite higher diesel prices QoQ, due to higher proportion
of ex-factory sales which resulted in lower lead distance.
Power incurs EBITDA losses:
Cement EBITDA of INR976/t (+12/-25%
YoY/QoQ) was impacted by weak realizations in north. Power business
incurred EBITDA loss of INR100m because lower realizations led to reduced
off-take in merchant power.
Strong earnings CAGR and return ratio improvement warrant valuation
premium:
Led by profitability improvement and market share gains due to
aggressive capacity addition, we expect EBITDA CAGR of 24% over FY17-
FY19. It is likely to generate operating cash flow of INR108b over FY17-FY19,
with margin improvement and better asset turnover resulting in earnings
CAGR of 37% over FY17-FY19. We thus believe valuations of 13x FY19E
EV/EBITDA are attractive, given superior return ratios and strong earnings
CAGR. We value SRCM at 16x FY19E EV/EBITDA due to its higher exposure
to north markets, which should see highest improvement in realizations. We
derive a target price of INR19,006 (+21% from current levels).
31 January 2017
8

Godrej Consumer
BSE SENSEX
27,850
Bloomberg
Equity Shares (m)
M.Cap.(INRb)/(USDb)
52-Week Range (INR)
1, 6, 12 Rel. Per (%)
Avg Val, INRm/ Vol ‘000
Free float (%)
S&P CNX
8,633
GCPL IN
340.6
546.3 / 8.3
1710 / 1138
2/1/19
370
36.7
30 January 2017
3QFY17 Results Update | Sector: Consumer
CMP: INR1,604 TP:INR1,655(3%)
Neutral
Domestic branded volume growth down 3%; healthy margin performance
GCPL’s 3QFY17 consol. net sales grew 8.9% YoY
(est. of +10%) to INR23.9b.
Consol. EBITDA grew 12.0% YoY (est. of +1.7%) to INR5.06b, while adj. PAT rose
5.0% YoY (est. of -1.2%) to INR3.48b. Organic consol. constant currency (CC)
sales grew 2% YoY, while India business sales were flat. Gross margin expanded
100bp YoY to 55.8%, with EBITDA margin expansion of 60bp YoY to 21.2%.
9MFY17 sales, EBITDA and adj. PAT grew 9%/14.9%/8.9% YoY.
Domestic branded business’ volume fell 3% YoY, leading to 0.2% sales
decline.
All three key domestic segments reported YoY sales decline.
Household Insecticides’ sales fell 2% YoY. Revenue declined by 6% YoY in Soaps
and 2% YoY in Hair Color. Soaps volume fell 8% YoY due to withdrawal of
promotions and impact of demonetization. Organic CC sales growth in India
business was flat, with operating margin expansion of 360bp YoY.
International organic CC sales grew 13% YoY
(4% organic sales growth), with
operating margin contracting 110bp YoY to 17.0%. Indonesia EBITDA margin
shrunk by 110bp, Africa (Incl SON) by 160bp and LATAM by 390bp. On the
other hand, Europe EBITDA margin expanded 60bp YoY.
Concall highlights:
(1) Management revealed that domestic sales growth was
positive YoY in December and January. (2) Secondary sales growth in the
domestic market was at 2% in 3QFY17 v/s flat primary sales growth. (3) Price
hike of 2% taken in the domestic soaps business in 3QFY17.
Valuation and view:
There is no material change to our EPS forecast. At 33.4x
Dec-2018 EPS, the stock trades close to its three-year average multiple of
34.5x. With its exposure to various geographies, associated currency risks and
relatively low RoE (mid-20s), the stock does not warrant a higher multiple, in
our view. Maintain
Neutral
with TP of INR1,655 (34.5x Dec-2018 EPS).
Financials & Valuation (INR b)
Y/E Mar
2016 2017E 2018E
Net Sales
89.7
93.1 105.1
EBITDA
16.2
18.4
21.0
PAT
11.3
12.5
14.6
EPS (INR)
33.2
36.8
42.8
Gr. (%)
24.4
11.0
16.2
BV/Sh (INR)
152.2 177.1 208.2
RoE (%)
23.4
22.4
22.2
RoCE (%)
16.7
15.3
15.2
P/E (x)
48.4
43.6
37.5
P/BV (x)
10.5
9.1
7.7
Estimate change
TP change
Rating change
31 January 2017
9

30 January 2017
3QFY17 Results Update | Sector: Technology
Tech Mahindra
Buy
BSE SENSEX
27,850
Bloomberg
Equity Shares (m)
M.Cap.(INRb)/(USDb)
52-Week Range (INR)
1, 6, 12 Rel. Per (%)
Avg Val, INRm
Free float (%)
S&P CNX
8,633
TECHM IN
Continuum of recovery in Telecom and margins; Strong deal wins
973
RoW and BFSI drive revenue beat:
TECHM’s 3QFY17 revenue growth of
459.0 / 6.8
5.4% QoQ CC beat estimate of +3.1%, led by strong pick-up in BFSI and RoW.
557 / 403
Organic CC revenue growth of ~4% QoQ exceeded our estimate of +2.5%.
-8/-5/-18
1062
Growth included incremental contribution from Target of ~1%, slightly
63.8
CMP: INR472
TP: INR550 (+17%)
Financials & Valuations (INR b)
2016 2017E
Y/E Mar
264.9
293.7
Net Sales
43.4
44.6
EBITDA
31.2
28.9
PAT
35.1
32.5
EPS (INR)
19.7
-7.3
Gr. (%)
165.6
175.1
BV/Sh (INR)
23.4
20.1
RoE (%)
20.1
16.6
RoCE (%)
13.5
14.5
P/E (x)
2.8
2.7
P/BV (x)
2018E
330.9
52.3
32.6
36.6
12.8
198.2
20.0
17.0
12.9
2.4
Estimate change
TP change
Rating change
higher than our expectation (+0.6%).
Encouraging deal wins:
Deal wins in the quarter totaled USD350m, the best
in last six quarters. Strength in wins is reflected in LTM deal wins of USD1.3b,
signifying growth of 16% YoY. The broad-based nature of wins and a couple
of large deals (in BFSI and Telecom) are encouraging signs and lend
confidence to our expectation of sustained steady growth going forward.
Profitability expansion in line:
EBITDA margin expanded 80bp to 15.7% (in-
line). Tailwind from absence of restructuring expenses (100bp) was partly
offset by cross-currency headwinds, furloughs and uptick in fresher hiring.
Revenue beat and higher other income (INR1.55b v/s est. of INR820m) drove
PAT of INR8.6b (+12.8% YoY; est. of INR7.1b).
Valuation and view:
Our thesis of a gradual recovery in Communications
and margins, along with continued traction in Enterprise, was demonstrated
in TECHM’s 3Q performance. ~1.5% 3Q revenue beat does not drive upward
estimates revision on account of some more portfolio pruning anticipated in
LCC. We expect USD revenue/earnings CAGR of 9/13% over FY17-19. Our TP
of INR550 discounts FY19E earnings by 13x (17% upside).
Buy.
Quarterly Performance (Consolidated)
31 January 2017
10

Grasim Industries
BSE SENSEX
27,850
Bloomberg
Equity Shares (m)
M.Cap.(INRb)/(USDb)
52-Week Range (INR)
1, 6, 12 Rel. Per (%)
Avg Val, INRm
Free float (%)
S&P CNX
8,633
GRASIM IN
VSF continues to shine; Chemical under pressure
467
Strong realization drives profits:
Standalone 3Q EBITDA rose 19% YoY (-4%
452.9 / 6.7
QoQ) to INR5.1b, translating into margin of 20.5% (-0.8pp QoQ, +1.9pp YoY),
1070 / 648
led by realization improvement. Revenue grew 8% YoY to INR24.9b, while
8/-2/31
599
PAT rose 22% YoY to INR3.3b on lower interest and depreciation expense.
68.7
VSF – margin improvement led by better pricing:
VFS revenue grew 10%
30 January 2017
3QFY17 Results Update | Sector: Cement
CMP: INR970
TP: INR1,067(+10%)
Neutral
Financials & Valuations (INR b)
Y/E Mar
2016 2017E
Net Sales
365.9
373.0
EBITDA
60.2
69.5
PAT
22.6
32.8
EPS (INR)
48.3
70.2
Gr. (%)
26.8
45.2
BV/Sh (INR)
553.4
618.3
RoE (%)
9.2
12.0
RoCE (%)
10.0
12.1
P/E (x)
20.1
13.8
EV/Ton (US$)
148
130
2018E
398.7
81.6
40.4
86.5
23.2
699.8
13.1
13.8
11.2
121
Estimate change
TP change
Rating change
YoY to INR17.6b (est. of INR17.4b) on realization boost of 9% YoY and
modest volume growth of 1% YoY (est. of +2% YoY), translating into margin
of 22.8% (v/s 19.2% in 3QFY16). Realization improvement was driven by
uptrend in global prices (outage of capacity in China due to environmental
issues) and favorable product mix (higher proportion of specialty products).
Chemical segment performance impacted:
Chemical revenues stood at
INR9.2b (+6% YoY). Realizations improved 5% YoY due to firm caustic prices
led by lower supply. However, volumes fell 5% YoY in 3QFY17 due to lower
demand for chlorine. Margins were healthy at 20.2% (flat YoY, -3.0pp QoQ).
Management outlook:
VSF pricing is expected to be stable over longer term
due to slower capacity addition and macro tailwinds. However, prices could
face short-term headwinds with some capacity coming back to the system.
Caustic capacity should increase by 208K by FY18 through 144K brownfield
expansion at Vilayat and 64K tonnes debottlenecking exercise. Margin could
be subdued in 4Q as pulp prices are likely to increase with lag effect.
Valuation and view:
We believe GRASIM post proposed restructuring
exercise with Aditya Birla Nuvo will be the holding company for multiple
diversified lines of business, including cement, finance, chemical and retail.
This is likely to attract higher discount than earlier. We thus value its stake in
Ultratech Cement at 40% discount and VSF business at 5x EV/EBITDA,
arriving at a TP of INR1,067 (upside of 10 %.) Downgrade to
Neutral.
31 January 2017
11

30 January 2017
3QFY17 Results Update | Sector: Consumer
Emami
Buy
BSE SENSEX
27,850
Bloomberg
Equity Shares (m)
M.Cap.(INRb)/(USDb)
52-Week Range (INR)
1, 6, 12 Rel. Per (%)
Avg Val, INRm/ Vol m
Free float (%)
S&P CNX
8,633
HMN IN
227.0
230.2 / 3.4
1261 / 901
2/-11/-11
191
27.3
CMP: INR1,014
TP: INR1,260(+24%)
Robust domestic performance; margin expansion continues
Financials & Valuations (INR b)
Y/E Mar
2016 2017E 2018E
Net Sales
23.9
25.4
29.1
EBITDA
6.8
7.6
8.6
PAT
5.7
5.6
6.8
EPS (INR)
25.2
24.5
29.8
Gr. (%)
17.7
-2.9
22.0
BV/Sh (INR)
61.8
82.8
97.8
RoE (%)
43.4
33.8
33.0
RoCE (%)
37.9
31.5
35.0
P/E (x)
40.3
41.5
34.0
P/BV (x)
16.4
12.2
10.4
Estimate change
TP change
Rating change
Emami's (HMN) sales were flat at INR7.3b (+0.2% YoY v/s est. of +5%)
in
3QFY17. EBITDA grew 3.7% YoY (est. of +1.9%), while PAT before amortization
rose 4.8% YoY (est. of -6.8%) to INR2.05b. Domestic sales increased 3% YoY, led
by volume growth of 0.2% YoY. Overall volumes declined 2.6% YoY.
International and CSD business sales declined 16% and 12% YoY, respectively.
Gross margin expansion of 130bp YoY to 67.9%
led to EBITDA margin
improvement of 120bp YoY to 35.6%. Sharp increase in staff costs (+120bp YoY)
was offset by lower A&P spends (-80bp YoY) and other expenses (-30bp YoY).
EBITDA thus grew 3.7% YoY to INR2.58b. Lower-than-expected tax rate
resulted in adj. PAT growth of 4.8% to INR2.05b.
Portfolio performance:
Among winter products, BoroPlus antiseptic cream
sales grew by 13% YoY and moisturizing lotions sales by 10% YoY. Among other
products, Balm sales declined 5% YoY. Kesh King grew only 2% YoY, but
maintained volume market share at 29.8%. Navratna Cool oil sales declined 4%
YoY. Fair and Handsome sales dropped sharply by 18% YoY. Zandu HCD fell 6%
YoY, led by a 15% decline in Pancharishta sales (on a high base).
Concall highlights:
a) Sales were impacted in rural as well as north and south
regions due to demonetization. Expect wholesale sales to be back to normal in
two months. b) Management expects double-digit volume growth for FY18.
Valuation and view:
Changes to the model have resulted in 2%/3% cut in
FY18E/FY19E EPS – management stated that EBITDA margin may not expand
further as HMN will invest potential gross margin gains on brand building. We
continue to like HMN, given its strong medium-term earnings visibility post the
Kesh King acquisition (45% EBITDA margin business turning EPS-accretive in
second year). The stock trades at 29.4x Dec-2018 EPS. We maintain
Buy
target
price of INR1,260 (36.5x Dec-2018 EPS, in line with three year average).
-17%
4Q
18.0
6,026
2,193
3,833
63.6
1,992
33.1
1,841
30.6
169
136
88
1,623
87
5.4
1,541
727
850
1Q
18.0
6,444
19.9
2,287
4,157
64.5
2,684
41.7
1,473
22.9
49.2
106
125
51
1,292
117
9.1
1,175
18.0
609
596
FY17
2Q
11.0
5,846
10.2
1,929
3,916
67.0
2,164
37.0
1,752
30.0
15.1
111
160
87
1,568
230
14.7
1,336
9.6
680
690
3Q
0.2
7,260
0.2
2,331
4,928
67.9
2,343
32.3
2,585
35.6
3.7
112
127
82
2,428
381
15.7
2,046
4.8
705
1,377
4QE
-4.0
5,898
-2.1
2,174
3,724
63.1
1,937
32.8
1,787
30.3
-2.9
164
104
86
1,605
614
38.2
992
-35.6
606
385
FY16
14.0
23,937
8.0
8,513
15,424
64.4
8,580
35.8
6,844
28.6
26.7
450
543
449
6,301
459
7.3
5,841
20.7
2,100
3,741
FY17E
6.5
25,447
6.3
8,722
16,725
65.7
9,128
35.9
7,597
29.9
11.0
493
516
305
6,894
1,341
19.5
5,552
-4.9
2,600
2,952
(INR Million)
FY17
Var.
3QE
(%)
1.0
7,608
-4.6%
5.0
2,582
-9.7%
5,026
-2.0%
66.1
2,484
-5.7%
32.6
2,543
1.7%
33.4
1.9
111
110
105
2,427
0.1%
607
25.0
1,820
12.4%
-6.8
600
1,220
Quarterly Performance
Y/E MARCH
Domes ti c vol ume Growth (%)
Net Sales
YoY Cha nge (%)
COGS
Gross Profit
Gros s ma rgi n (%)
Other Expendi ture
% to s a l es
EBITDA
Ma rgi ns (%)
YoY Cha nge
Depreci a ti on
Interes t
Other Income
PBT
Ta x
Ra te (%)
PAT
YoY Cha nge (%)
Amorti za ti on
Reported PAT
E: MOSL Estimates
1Q
15.0
5,372
2,114
3,258
60.6
2,271
42.3
987
18.4
88
44
187
1,041
42
4.0
996
137
866
FY16
2Q
3Q
13.5
9.3
5,306
7,249
1,783
3,523
66.4
2,001
37.7
1,523
28.7
92
192
122
1,361
139
10.2
1,219
620
631
2,417
4,831
66.6
2,337
32.2
2,494
34.4
99
172
53
2,276
320
14.0
1,953
617
1,367
31 January 2017
12

30 January 2017
3QFY17 Results Update | Sector: Technology
Info Edge India
Buy
BSE SENSEX
27,850
Bloomberg
Equity Shares (m)
M.Cap.(INRb)/(USDb)
52-Week Range (INR)
1, 6, 12 Rel. Per (%)
Avg Val, INRm
Free float (%)
S&P CNX
8,633
INFOE IN
121
104.6 / 1.5
1012 / 690
-9/7/-3
69
57.4
2018E
9.0
2.6
2.3
19.0
12.2
170.8
11.5
11.5
45.4
5.1
CMP: INR863
TP: INR1,075(+25%)
Slump in Recruitment segment drives significant miss
3QFY17 performance significantly below expectations:
INFOE’s standalone
3QFY17 revenue growth decelerated to 7.3% YoY to INR1.86b, sharply below
our estimate of INR2.13b. EBITDA margin was 25.3% (+310bp YoY), well
below our estimate of 29.7%, led by the revenue miss. Adj. PAT was
INR471m (+25% YoY), missing our estimate of INR573m (+52% YoY).
Broad-based demonetization impact:
Revenue miss was broad-based, with
recruitment segment at INR1.4b (+8.5% YoY; est. of INR1.59b), 99acres.com
at INR261m (+0.6% YoY; est. of INR285m) and others at INR196m (est. of
INR254m). This was the first quarter of single-digit YoY growth in standalone
revenues in last four years.
Segmental performance:
INFOE’s policy change in the middle of 1Q in
recruitment segment (of not pushing sales at the end of quarters) also
played a part in weak revenues. This may manifest till 1QFY18. 99acres.com
was hit directly by demonetization. Long-term RERA initiatives hold
potential, while near term remains clouded. Cash burn in Zomato is down to
USD1/month. Whether the launch of UberEats in India changes this remains
to be seen.
Valuation View:
We cut earnings estimate for FY18/19 by 6%/7% owing to
the hawkish outlook on revenue growth, considering the combination of
factors like demonetization and internal policy changes around discounts.
We see Naukri.com (from pick-up in economic growth), 99acres.com
(lowering competitive intensity) and Zomato.com (focus on driving
monetization and profitability) as the key drivers of valuation at INFO. Our
SOTP-based price target of INR1,075 implies 25% upside. Maintain
Buy.
Financials & Valuations (INR b)
2016 2017E
Y/E Mar
7.2
7.9
Net Sales
1.6
2.2
EBITDA
1.6
2.1
PAT
13.0
16.9
EPS (INR)
-5.3
30.5
Gr. (%)
145.3
159.4
BV/Sh (INR)
9.2
11.1
RoE (%)
9.2
11.1
RoCE (%)
66.5
51.0
P/E (x)
5.9
5.4
P/BV (x)
Estimate change
TP change
Rating change
Quarterly Performance (Consolidated)
31 January 2017
13

30 January 2017
Q3FY17 Results Update | Sector: Media
Dish TV India
Buy
BSE SENSEX
27,882
Bloomberg
Equity Shares (m)
M.Cap.(INRb)/(USDb)
52-Week Range (INR)
1, 6, 12 Rel. Per (%)
Avg Val, INRm
Free float (%)
S&P CNX
8,641
DITV IN
Demonetization impacts recharges and subscriber additions
1,066
Broader story intact, Maintain TP
94.2 / 1.4
110 / 65
Operational performance disappoints:
Demonetization was expected to
take a toll on DITV’s 3QFY17 operational performance. However, we note
-1/-15/-16
523
that the results missed the already lower expectations. 3QFY17 EBITDA
35.6
declined ~6% QoQ to INR2.49b (8.6% below est. of INR2.73b), primarily led
CMP: INR88
TP: INR115(+30%)
Financials & Valuations (INR b)
Y/E Mar
2016 2017E
Net Sales
30.6
31.0
EBITDA
10.2
10.6
PAT
6.9
1.8
EPS (INR)
6.5
1.7
Gr. (%)
NA -74.0
BV/Sh (INR)
3.6
5.3
RoE (%)
NA
38
RoCE (%)
12.7
11.3
P/E (x)
14
52
P/BV (x)
NA
16.7
2018E
35.3
13.0
3.4
3.2
87.0
8.4
46
13.5
28
10.5
Estimate change
TP change
Rating change
by lower-than-expected subscription revenue and subsequent unfavorable
operating leverage. Subscription revenue declined 5% QoQ to INR6.92b
(6.7% lower than est. of INR7.42b) as demonetization adversely impacted
both DTH recharges and subscriber additions. Management estimates
subscription to be 8% higher (ex-demonetization impact), with 8-10% impact
on subscriber addition due to the
“note ban drive”
Key performance indicators sub-par:
DITV added 204k net subscribers in
3QFY17 (est. of +0.28m). It now seems unlikely that DITV will meet its FY17
guidance of 1.5-1.9m net sub adds. ARPU fell 6.5% QoQ to ~INR152 (est. of
INR162). We largely maintain net subs addition estimate of 1.29m, but
revise down ARPU for FY17E by 2% to INR159 per subscriber per month.
EBITDA margin contracted 55bp QoQ to 33.4% (106bp below est.),
largely
led by lower-than-expected subscription income and consequent
unfavorable operating leverage. Content payout declined 8% QoQ to
INR2.2b (est. of INR2.4b) as the lack of sporting events and subscriber down-
trading of packs kept content costs low. While DITV round of content
renewals in September were deferred given the regulatory uncertainty
around content pricing, management is confident of containing content cost
escalation to 6-8% YoY in FY17 and FY18. We revise our content escalation
assumptions from 12% YoY to 8% YoY for FY17.
3Q net debt remained largely unchanged QoQ at ~INR6b. 9MFY17 capex
stood at INR7.3b.
FCF declined from INR0.79b in 2Q to INR0.49b.
Valuation and view:
We largely maintain FY18E/FY19E EBITDA, and expect
15% EBTDA CAGR over FY16-19E, led by 9% net subs CAGR, 3.6% ARPU CAGR
over FY17-19E and operating leverage-led EBITDA margin expansion. DITV
trades at 7.2x FY18E/5.7x FY19E. Maintain our DCF-based TP of INR115.
Buy.
31 January 2017
14

30 January 2017
3QFY17 Results Update | Sector: Technology
Just Dial
Buy
BSE SENSEX
27,850
Bloomberg
Equity Shares (m)
M.Cap.(INRb)/(USDb)
52-Week Range (INR)
1, 6, 12 Rel. Per (%)
Avg Val, INRm
Free float (%)
S&P CNX
8,633
JUST IN
Focus on core business; advertisement campaign launch soon
70
PAT exceeds estimate driven by other income:
JUST’s 3QFY17 revenue grew
26.5 / 0.4
8.5% YoY to INR1,803m (est. of INR1,713m), with paid campaigns growing
903 / 318
19.5% YoY (+3.7% QoQ) to 424,830. EBITDA fell 18% YoY to INR257m (est. of
8/-24/-49
1408
INR274m), with margin contracting 470bp to 14.3% (est. of 16%) due to
66.7
higher employee expenses (+440bp as % of sales). Other income of INR197m
CMP: INR382
TP: INR443(+16%)
Financials & Valuations (INR b)
Y/E Mar
2016 2017E
Net Sales
6.9
7.3
EBITDA
1.7
1.1
PAT
1.4
1.2
EPS (INR)
20.4
17.2
Gr. (%)
3.7
-15.9
BV/Sh (INR)
96.7
111.5
RoE (%)
21.1
16.5
RoCE (%)
21.1
16.5
P/E (x)
18.7
22.2
P/BV (x)
4.0
3.4
2018E
8.4
1.0
1.3
18.5
7.5
127.1
15.5
15.5
20.7
3.0
Estimate change
TP change
Rating change
was higher than our estimate of INR130m. Consequently, PAT grew 6% YoY
to INR274m (est. of INR221m).
Omni sales on hold; focus on core business:
JD Omni recorded turnover of
INR10m in 3QFY17; sales of this product are put on hold as JUST is reviewing
its distribution strategy. Management will now focus on its core business
(i.e. Search and Search Plus) by expanding its salesforce and rationalizing the
bottom line. Ad campaigns are also ready to be launched, which should aid
growth and help increase the depth and breadth of database.
Employee addition and ad spends to hit margins hard:
For reviving growth
in listing business and growing Search Plus, the company has earmarked
~INR1b (phased out over several quarters) for ad spends, which should
contribute to overall brand building. Also, addition of new employees will
impact EBITDA.
Valuation and view:
We believe EBITDA margin will be under pressure in
FY18 as JUST is in an investment mode (employee addition, increased ad
spends) to revive growth in core business and promote Search Plus. We cut
FY18E EBITDA by 29%; however, its impact on PAT will be offset by lower tax
rate at 16% in FY18 due to benefits from the merger of JD Global. We thus
maintain earnings for FY18E and introduce FY19 estimates. We expect
revenue CAGR of 11.5% and PAT CAGR of 2.7% over FY16-19E. Maintain
Buy
with a TP of INR443 (20x FY19E EPS).
31 January 2017
15

30 January 2017
3QFY17 Results Update | Sector: Healthcare
Granules India
BSE SENSEX
27,850
Bloomberg
Equity Shares (m)
M.Cap.(INRb)/(USDb)
52-Week Range (INR)
1, 6, 12 Rel. Per (%)
Avg Val, INRm
Free float (%)
S&P CNX
8,633
GRAN IN
Continued margin improvement; multiple levers ahead
221
After growing in low-to-mid single-digits for four quarters, revenue grew
25.7 / 0.4
11% YoY to INR3.6b (in-line) in 3QFY17. EBITDA margin came in at 21.2%
151 / 91
(+160bp YoY, +80bp QoQ; est. of 20.2%), much higher than ~11% in FY13,
3/-17/-12
172
led by product mix change and capacity expansion. EBITDA rose 17% YoY to
48.1
INR761m, implying a 4% beat. PAT grew 43% YoY to INR391m (in-line).
CMP: INR116
TP: INR160(+38%)
Buy
Financials & Valuations (INR b)
2016
2017E
Y/E Mar
14.3
14.3
Net Sales
2.8
2.9
EBITDA
1.2
1.6
PAT
5.5
7.0
EPS (INR)
22.8
27.8
Gr. (%)
30.7
40.9
BV/Sh (INR)
21.6
19.9
RoE (%)
14.0
11.7
RoCE (%)
21.0
16.5
P/E (x)
3.7
2.8
P/BV (x)
2018E
Finished dosage continues to deliver robust growth:
Finished dosage
16.8
3.5
2.0
8.0
15.2
59.3
16.6
9.9
14.3
1.9
Estimate change
TP change
Rating change
segment’s revenue grew 33% YoY to ~INR1.6b, driven by scale-up in Rx
business. Revenue of PFI segment declined ~7% YoY, while that of API
segment fell 11% YoY to INR1.2b. Capacity constraints, along with captive
consumption of API, led to muted revenue growth. GRAN expects revenues
to bounce back, led by expanded capacity in API and PFI segments.
Concall takeaways:
1) Plans to file six ANDAs by end-FY17 (including two
complex fillings from Virginia facility). 2) Plans to incur INR9b as capex over
FY17 and FY18 (spent ~INR2.65b in 9MFY17). 3) Re-inspection of the
Gagilapur-based CRAMS JV facility to start from tomorrow; the company
expects resolution over next few days. 4) Fixed asset to reach to INR16b post
FY18. The company expects asset turnover to reach ~2x over next few years.
Earnings acceleration to drive valuation upside:
GRAN trades at ~10x
FY19E EPS. We believe the stock has the potential deliver >50% return over
next 12-18 months, led by multiple re-rating (to >15x forward earnings) and
strong EPS CAGR of ~30%. Our TP of INR160 is based on 16x 1HFY19E PER.
FY17
2Q
3,638
3.1
2,896
742
20.4
185
83
39
513
156
30.4
-51
408
408
43.1
11.2
Est.
3QE
3,621
5.0
2,890
732
20.2
189
92
35
486
145
29.9
-50
391
391
43.8
10.8
-0.2%
Y/E March
(Consolidated)
Net Sales
YoY Change (%)
Total Expenditure
EBITDA
Margins (%)
Depreciation
Interest
Other Income
PBT before EO expense
Tax
Rate (%)
Minority Interest & Profit/
Loss of Asso. Cos.
Reported PAT
Adj PAT
YoY Change (%)
Margins (%)
Quarterly Performance (Consolidated)
1Q
3,226
3.7
2,599
627
19.4
139
81
14
420
133
31.6
2
285
285
24.8
8.8
FY16
2Q
3Q
3,529
3,449
14.7
7.9
2,844
2,772
685
677
19.4
19.6
144
167
88
114
10
26
462
422
144
151
31.1
35.7
-4
323
323
46.2
9.1
0
272
272
15.2
7.9
(INR Million)
Var.
vs Est
-0.7%
4Q
3,723
5.0
2,940
783
21.0
174
99
14
525
193
36.7
0
332
332
48.2
8.9
1Q
3,498
8.4
2,813
685
19.6
163
79
30
472
154
32.5
-71
390
390
36.5
11.1
3Q
3,595
4.2
2,832
763
21.2
187
84
43
535
176
32.9
-31
390
390
43.5
10.8
4QE
3,605
-3.2
2,856
749
20.8
188
100
28
489
151
30.9
-67
405
405
49.2
11.2
FY16
14,295
11.2
11,571
2,725
19.1
643
399
77
1,759
617
35.1
2
1,140
1,140
36.9
8.0
FY17E
14,336
0.3
11,397
2,939
20.5
723
346
140
2,010
637
31.7
-220
1,593
1,593
39.7
11.1
4.3%
10.1%
31 January 2017
16

RESULTS
FLASH
30January 2017
Results Flash | Sector: Engineering
GE T&D
Neutral
BSE SENSEX
27850
S&P CNX
8633
CMP: INR312
TP: INR320(+2.5%)
We will revisit our estimates post
earnings call/management
interaction.
Beat at operating level driven by strong execution
But gross margin disappoints
Sales increased 63% YoY to INR11.6b, exceeding our estimate of INR8.5b and
consensus of INR8.7b. Strong execution was likely driven by commissioning of
Phase 1 of the Champa-Kurukshetra HVDC line, which was being executed for
PGCIL.
Gross margin contracted 210bp YoY to 27.4%.
EBITDA stood at INR0.72b. Margin of 6.2% was higher than our estimate of
4.4% and consensus of 5.6%, driven by better operating leverage.
Other income of INR0.52b was above our estimate of INR0.13b.
PAT of INR0.44b too came in higher than our estimate of INR40m and
consensus of INR0.16b.
Valuation and view:
We will revisit our estimates post the earnings call. Outlook on
growth and margin resurrection will be keenly sought. Based on current estimates,
the stock trades at 35/31x FY18E/19E EPS of INR10.2/11.4. Maintain
Neutral.
Conference Call Details
Date:
31 January 2017
Time:
4:00pm
IST
Dial-in details:
+91-22-39600603
st
Financials & Valuations (INR b)
2016
2017E
Y/E Mar
Net Sales
34.1
39.5
EBITDA
2.3
2.4
NP
0.8
1.4
EPS (INR)
3.0
5.5
EPS Gr. (%)
-35.7
82.6
BV/Sh. (INR)
52.1
50.2
RoE (%)
5.9
-7.0
RoCE (%)
10.1
13.1
Payout (%)
59.5
40.0
Div. Yield
0.5
-0.4
2018E
44.8
4.9
2.6
10.2
83.7
55.5
19.2
23.7
40.0
1.2
Quarterly Performance
Y/E March
Sales
Change (%)
EBITDA
Change (%)
As of % Sales
Depreciation
Interest
Other Income
Extra-ordinary Items
PBT
Tax
Effective Tax Rate (%)
Reported PAT
Change (%)
Adj PAT
Change (%)
1Q
7,660
1.2
72
-90.4
0.9
212
117
412
0
155
54
34.7
102
-67.5
102
-64.4
FY16
2Q
3Q
8,729
7,141
1.2
1.2
680
-532
-22.4
NA
7.8
-7.4
215
215
143
168
213
326
0
0
536
-589
174
-205
32.6
NA
361
-384
1.8 -1,582.6
361
-384
1.8
NA
4Q
1Q
9,715
8,546
-28.6
11.6
850
21
-18.5
-70.3
8.7
0.2
216
217
189
226
64
326
0
2,330
509
-2,425
210
-455
41.3
18.8
299
-1,970
-44.8 -2,041.0
299
360
-44.8
254.6
FY17
2Q
3Q
8,340 11,623
-4.4
62.8
339
722
-50.1
-235.7
4.1
6.2
220
221
239
343
435
522
0
0
315
679
109
236
34.6
34.7
206
443
-43.0
-215.4
206
443
-43.0
-215.4
FY16E
4QE
10,977
13.0
1,292
52.0
11.8
233
98
-322
0
640
233
36.4
407
36.2
407
36.2
34,135
-7.8
2,324
-9.0
6.8
873
589
427
0
1,289
508
39.4
781
0.0
781
2.0
FY17E
39,486
15.7
2,374
-9.0
6.0
873
589
427
0
1,339
508
37.9
831
0.0
831
2.0
(INR Million)
MOSL
Var.
3QE Vs Est
8,500
37
14.3
370
95
-2,706
4.4
220
220
130
0
60 1,032
20
33.3
40 1,008
-122.0
40 1,008
-122.0
31 January 2017
17

RESULTS
FLASH
30January 2017
Results Flash | Sector: Telecom
V Guard
Neutral
BSE SENSEX
27,850
S&P CNX
8,633
CMP: INR193
TP: INR179(-7%)
We will revisit our estimates post
earnings call/management
interaction.
Results beat estimates; measures to counter cash crunch offer support
V Guard’s (VGRD) revenue increased 10.4% to INR4.59b (est. of INR4.16b) in
3QFY17 from INR4.16b in 3QFY16. Management commented that
demonetization took a toll to an extent on some product segments. To counter
this, the company arranged for financing facilities through NBFCs, installed
debit/credit card machines and offered cash discounts to channel partners.
Sales in Tamil Nadu were impacted due to the cyclone Vardah and the
deteriorating socioeconomic situation.
EBITDA grew 11% YoY to INR386m (est. of INR283m) from INR346m in the
year-ago period. EBITDA margin largely remained flat at 8.4%.
Other income grew to INR33m from INR18m in 3QFY16, while finance cost
declined from INR15m to INR5m.
Aided by higher other income and lower finance cost, PAT grew strongly by
30% to INR280m (est. of INR183) from INR215m in 3QFY16.
The board of VGRD recommended a bonus issue of two equity shares of INR1
each for every five shares held.
VGRD announced commencement of commercial production of stabilizers and
electric water heaters from March 2017 with an investment of INR375m.
Key questions for management
Details on revenue growth/margins in each segment, new product launches
and geographical expansion.
Whether the company will continue facing the impact of demonetization in
4QFY17.
Outlook for stabilisers business, considering the upcoming summer season.
Valuation and view:
We will revisit our estimates post the earnings call. Based on
our current estimates, at CMP of INR193, the stock trades at 34x/27x P/E on
FY18E/FY19E EPS. We currently have a
Neutral
rating on the stock.
Conference Call Details
Date:
31st Jan 2017
Time:
3:30pm IST
Dial-in details:
+91-22-3361 3410
Financials & Valuations (INR b)
2016
2017E
Y/E Mar
Sales
18.6
19.5
EBITDA
1.8
2.0
NP
1.1
1.4
Adj EPS (INR)
3.7
4.5
EPS Gr. (%)
57.5
21.6
BV/Sh (INR)
15.6
19.0
RoE (%)
26.3
26.1
RoCE (%)
24.9
25.9
Payout (%)
22.7
26.7
Valuations
P/E (x)
52.0
42.7
P/BV (x)
12.3
10.2
EV/EBITDA (x) 28.9
25.2
Div Yield (%)
0.4
0.5
2018E
22.5
2.5
1.7
5.8
27.7
23.2
27.4
27.4
27.2
33.5
8.3
19.8
0.7
31 January 2017
18

RESULTS
FLASH
Monsanto India
BSE SENSEX
27,850
S&P CNX
8,633
30January 2017
Results Flash | Sector: Telecom
CMP: INR2327
Revenue miss, but EBITDA and PAT beat estimates
Under Review
We will revisit our estimates post
earnings call/management
interaction.
Financials & Valuations (INR b)
2016
2017E
Y/E Mar
Sales
5.4
6.1
EBITDA
1.1
1.3
NP
1.0
1.2
Adj EPS (INR)
60.1
68.4
EPS Gr. (%)
-2.3
13.8
BV/Sh (INR)
239.4
235.6
RoE (%)
26.4
28.8
RoCE (%)
26.5
28.8
Payout (%)
61.6
105.6
Valuations
P/E (x)
38.7
34.0
P/BV (x)
9.7
9.9
EV/EBITDA (x) 37.2
30.1
Div Yield (%)
1.3
2.6
2018E
7.3
1.7
1.5
87.2
27.5
250.6
35.9
35.9
82.8
26.7
9.3
23.7
2.6
MCHM’s revenue increased 6.7% to INR1,639m (est. of INR1,767m) in 3QFY17
from INR1,537m in 3QFY16.
EBITDA grew to INR600m (est. of INR498m) from INR466m in 3QFY16, implying
growth of 29%. Margin expanded to 36.6% (est. of 28.2%) from 30.3% in
3QFY16, driven by employee costs at 6.5% of sales (down 450bp from 3QFY16)
and raw material costs at 32.9% of sales (down 300bp from 3QFY16).
Consequently, adjusted PAT stood at INR599m (est. of INR448m), as against
INR463m in 3QFY16, implying growth of 30% YoY.
Valuation and view:
We will revisit our estimates post our interaction with
management. Based on our current estimates, at CMP of INR2,327, the stock
trades at 34x/27x P/E on FY17E/FY18E EPS. We currently have the stock rating
Under Review.
31 January 2017
19

RESULTS
FLASH
Kitex Garments
BSE SENSEX
27,850
S&P CNX
8,633
30January 2017
Results Flash | Sector: Telecom
CMP: INR422
TP: INR631(+50%)
Buy
We will revisit our estimates post
earnings call/management
interaction.
Revenue in line, but miss on EBITDA margin and PAT
Kitex Garments’ (KTG) revenue increased 20.5% to INR1,424m (est. of
INR1,394m) in 3QFY17 from INR1,181m in 3QFY16.
Revenue of garments segment grew 19% YoY to INR1,253m, while that of
fabrics (net of inter segment sales) grew 31% to INR171m.
EBITDA grew 17% to INR486m (est. of INR506m) from INR417m in 3QFY16,
with margin contracting 120bp to 34.1% (est. of 36.3%) from 35.3%.
Interest cost declined to INR23m from INR42m in 3QFY16.
Consequently, PAT improved 32% YoY to INR318m (est. of INR345m) from
INR241m.
Conference Call Details
Date:
31st Jan 2017
Time:
12:00pm IST
Dial-in details:
+91-22-3938 1079
Financials & Valuations (INR b)
2016
2017E
Y/E Mar
Sales
5.5
6.0
EBITDA
1.9
2.1
NP
1.1
1.4
Adj EPS (INR)
23.6
29.3
EPS Gr. (%)
13.8
24.0
BV/Sh (INR)
77.3
99.6
RoE (%)
35.5
33.1
RoCE (%)
27.4
30.3
Payout (%)
14.9
24.0
Valuations
P/E (x)
17.9
14.4
P/BV (x)
5.5
4.2
EV/EBITDA (x)
9.9
8.4
Div Yield (%)
0.7
1.4
2018E
6.8
Key questions for management
2.4
Impact of additional duty drawback on margins in 3QFY17. EBITDA margin
1.7
excluding the impact.
35.1
Order visibility for garments business (base quarter had impact of
19.8
discontinuance of jockey business).
126.5
31.0
Traction from new clients and in-licensed brand.
30.8
23.4
Valuation and view:
We will revisit our estimates post the earnings call. Based on
12.0
3.3
6.9
1.7
our current estimates, at CMP of INR422, the stock trades at 14x/12x P/E on
FY17E/FY18E EPS. We currently have a
Buy
rating on the stock.
31 January 2017
20

December 2016 Results Preview | Sector: Automobiles
Bajaj Auto
Bloomberg
Equity Shares (m)
M. Cap. (INR b)/(USD b)
52-Week Range (INR)
1,6,12 Rel Perf. (%)
BJAUT IN
289.4
778 / 11
3122 / 2173
-3 / 4 / 4
CMP: INR2,689
TP: INR3,097 (+18%)
Buy
Financial Snapshot (INR b)
Y/E MARCH
2016 2017E 2018E 2019E
Sales
EBITDA
NP
Adj. EPS (INR)
EPS Gr. (%)
BV/Sh. (INR)
RoE (%)
RoCE (%)
Payout (%)
Valuation
P/E (x)
P/BV (x)
EV/EBITDA (x)
Div. Yield (%)
20.4
6.3
14.1
2.0
20.2
5.6
14.1
2.4
16.9
4.9
11.5
2.8
14.4
4.3
9.6
3.6
225.9
47.8
38.1
131.8
25.1
424.8
33.2
32.3
50.2
221.4
45.1
38.5
133.0
0.9
479.7
29.4
28.6
58.7
259.8
53.3
46.0
158.9
19.4
548.4
30.9
30.0
56.7
298.6
61.0
54.0
186.5
17.4
623.0
31.8
30.7
60.0
Overall volume declined 10.5% YoY (-17% QoQ) to 851.6k units due
to a 17.5% YoY fall in exports, while domestic sales volumes
declined 5% YoY due to the impact of demonetization in November
and December. Total 2W sales declined 10% YoY in 3QFY17. 3W
volumes fell sharply by 17% YoY primarily due to a fall in exports as
currency issues in African markets continued along with a decline in
domestic 3Ws.
We expect realization to grow 1% YoY (+1% QoQ) as the launch of
premium products in 2Ws is shadowed by a decline in 3Ws. As a
result, net revenues are expected to decline by 9.3% YoY.
EBITDA margin should contract 160bp YoY (-200bp QoQ) to 19.4%
due to deterioration of product mix as well as negative operating
leverage.
We expect PAT to decline ~5.7% YoY (-24% QoQ) to INR8.4b.
We have lowered our total volume estimates by 4%, resulting in EPS
cut of 5% for FY17E/FY18E.
The stock trades at 16.9x FY18E and 14.4x FY19E EPS; maintain
Buy.
Key issues to watch
Update on demand environment at the retail level, channel inventory;
outlook for FY18 based on impact of demonetization.
Outlook for export demand and pricing, especially the Nigerian market
(sharp currency depreciation); outlook for FY18.
Quarterly Performance
Volumes ('000 units)
Growth YoY (%)
Realization (INR/unit)
Growth YoY (%)
Net Sales
Change (%)
RM/Sales %
Staff cost/Sales %
Oth. Exp./Sales %
EBITDA
EBITDA Margins (%)
Other Income
Interest
Depreciation
PBT
Tax
Effective Tax Rate (%)
Adj. PAT
Change (%)
1Q
1,013
2.5
55,273
4.0
55,993
6.6
67.4
4.3
8.0
11,402
20.4
3,063
1
784
13,680
4,106
30.0
9,574
29.4
FY16
2Q
3Q
1,057
951
0.1
-3.4
57,543 58,486
1.9
1.8
60,799 55,649
2.0
-1.6
66.7
66.4
4.0
4.1
7.7
8.5
13,167 11,713
21.7
21.0
2,680
1,997
3
3
780
746
15,063 12,961
4,540
3,947
30.1
30.5
10,524
9,013
26.4
4.7
4Q
872
11.4
61,490
1.5
53,627
13.2
65.9
3.8
8.9
11,534
21.5
2,569
4
761
13,338
3,844
28.8
9,493
52.7
1Q
995
-1.8
57,784
4.5
57,480
2.7
67.2
4.7
7.7
11,763
20.5
2,671
2
775
13,657
3,873
28.4
9,784
2.2
FY17
2Q
3QE
1,032
852
-2.3
-10.5
58,676 59,263
2.0
1.3
60,545 50,471
-0.4
-9.3
67.0
67.5
4.3
5.2
7.4
8.0
12,961
9,788
21.4
19.4
3,420
2,900
7
3
770
800
15,605 11,885
4,378
3,387
28.1
28.5
11,228
8,498
6.7
(5.7)
(INR Million)
FY16E
4QE
848
-2.8
62,455
1.6
52,949
-1.3
66.7
4.8
8.5
10,637
20.1
2,873
-3
817
12,696
3,707
29.2
8,989
(5.3)
3,893
2.2
58,274
2.8
226,876
5.0
66.3
4.0
8.2
48,835
21.5
10,736
11
3,072
56,488
17,328
30.7
39,124
28.4
FY17
3,726
(4.3)
59,432
2.0
221,444
-2.4
66.8
4.7
7.9
45,746
20.7
11,864
9
3,161
54,439
15,345
28.2
38,498
-1.6
31 January 2017
21

December 2016 Results Preview | Sector: Healthcare
Cadila Healthcare
Bloomberg
Equity Shares (m)
M. Cap. (INR b)/(USD b)
52-Week Range (INR)
1,6,12 Rel Perf. (%)
Financial Snapshot (INR Billion)
y/e march
2016 2017E
Sales
EBITDA
NP
EPS (INR)
EPS Gro. (%)
BV/Sh. (INR)
RoE (%)
RoCE (%)
Valuations
P/E (x)
P/BV (x)
EV/EBITDA (x)
Div. Yield(%)
23.5
6.9
16.7
0
26.6
5.9
17.5
0
19.4
4.8
13.0
0
15.8
3.8
10.6
0
CDH IN
1023.7
370 / 5
429 / 296
-10 / 11 / 9
CMP: INR362
TP: INR450 (+24%)
Buy
2018E
120.5
28.9
19.2
18.7
37.5
75.9
27.2
22.8
2019E
141.4
34.6
23.4
22.9
22.2
94.4
26.8
23.7
97.5
23.0
15.8
15.4
37.7
52.3
32.8
23.3
100.3
22.0
13.9
13.6
-11.8
61.5
23.9
18.9
Cadila Healthcare's (CDH) 3QFY17 revenue is likely to grow 6.4%
YoY to INR25.8b, driven by 5% YoY growth in the US formulations
business. Growth in the US formulations business is expected to be
largely driven by the recent launch of authorized generic of Asacol
HD.
Overall export formulations are expected to grow 5.4% YoY to
INR13.7b, while domestic formulation is likely to grow 13.4% YoY to
INR10.1b.
We expect EBITDA to decline 4% YoY to INR5.5b and the margin to
contract 230bp. Adj. PAT is also likely to decline 5.5% YoY to
INR3.7b.
We believe CDH has made investments in the right areas, and will
start accruing benefits over next 2-3 years. We expect sharp ramp-
up in the US business post successful remediation of Moraiya
warning letter. We estimate 10% EPS CAGR for FY16-18E, with
better return ratios over next two years.
The stock trades at 19.3x FY18E EPS. Maintain Buy.
Key issues to watch out
Update on US FDA resolution for Moraiya facility.
Outlook for recovery in domestic formulations.
Progress on improvement in balance sheet.
Quarterly Performance
Y/E March
Net Revenues
YoY Change (%)
EBITDA
Margins (%)
Depreciation
Interest
Other Income
PBQ before EO Income
EO Exp/(Inc)
PBQ after EO Income
Tax
Rate (%)
Min. Int/Adj on Consol
Adj PAT
YoY Change (%)
Margins (%)
E: MOSL Estimates
1Q
23,159
23.7
5,111
22.1
691
119
240
4,541
-506
5,047
577
11.4
-132
4,096
103.2
17.7
FY16
2Q
3Q
23,308
24,284
10.6
10.9
5,907
5,787
25.3
23.8
725
770
130
126
200
255
5,252
5,146
-155
9
5,407
5,137
736
1,149
13.6
22.4
-79
92
4,595
3,903
64.6
38.6
19.7
16.1
4Q
24,491
7
5,814
23.7
783
100
241
5,172
-8
5,180
1,259
24.3
34
3,881
-15.7
15.8
1Q
22,871
-1.2
5,239
22.9
843
140
153
4,409
2
4,407
966
21.9
-121
3,564
-13
15.6
FY17E
2Q
3QE
23,531
25,827
1
6.4
5,160
5,553
21.9
21.5
864
860
187
140
236
215
4,345
4,768
0
0
4,345
4,768
1,068
1,200
24.6
25.2
-99
-120
3,376
3,688
-26.5
-5.5
14.3
14.3
(INR Million)
FY16
FY17E
4QE
28,059
14.6
6,011
21.4
906
99
188
5,194
0
5,194
1,071
20.6
-140
4,263
9.9
15.2
95,242
12.9
20,695
21.7
3,022
463
918
18,128
-660
18,788
4,298
22.9
300
14,350
22.4
15.1
100,288
5.3
21,963
21.9
3,473
566
792
18,716
0
18,716
4,305
23
-480
14,891
3.8
14.8
31 January 2017
22

December 2016 Results Preview | Sector: Consumer
Dabur
Bloomberg
Equity Shares (m)
M. Cap. (INR b)/(USD b)
52-Week Range (INR)
1,6,12 Rel Perf. (%)
DABUR IN
1761.5
487 / 7
320 / 231
-4 / -8 / -4
CMP: INR277
TP: INR300 (+8%)
Neutral
Financial Snapshot (INR b)
Y/E March
Sales
EBITDA
Adj. PAT
Adj. EPS (INR)
EPS Gr. (%)
BV/Sh.(INR)
RoE (%)
RoCE (%)
Payout (%)
Valuations
P/E (x)
P/BV (x)
EV/EBITDA (x)
Div. Yield (%)
38.9
11.7
31.1
0.7
38.6
9.9
31.0
0.9
32.6
8.4
26.0
1.1
27.8
7.1
22.0
1.3
2016 2017E 2018E 2019E
77.6
15.0
12.5
7.1
17.2
23.6
33.3
27.7
28.0
79.9
15.0
12.6
7.2
0.8
27.9
27.8
23.7
35.0
91.0
17.5
14.9
8.5
18.5
32.9
27.9
24.1
35.0
103.7
20.3
17.5
10.0
17.2
38.8
27.8
24.7
35.0
We expect sales to grow 2% YoY to INR19.9b, led by ~5% domestic
organic volume growth.
We expect Dabur’s EBITDA margin to contract 150bp.
Hence, we have modeled EBITDA and PAT decline of 6% and 5%,
respectively, in 3QFY17.
The stock trades at 32.6x FY18E EPS of INR8.5; maintain Neutral.
Key issues to watch for
Domestic volume growth and outlook for rural demand.
Update on project CORE.
Margin performance in international business.
Competitive intensity, especially from Patanjali.
Quarterly Performance (Consolidated, INR m)
49%
Y/E March
Domestic Vol Growth (%)
Net Sales
YoY Change (%)
Total Exp
EBITDA
Margins (%)
YoY Growth (%)
Depreciation
Interest
Other Income
PBT
Tax
Rate (%)
Minority Interest
Adjusted PAT
YoY Change (%)
E: MOSL Estimates
1Q
8.1
19,017
15,861
3,157
16.6
325
118
531
3,244
620
19.1
10
2,615
22%
FY16
2Q
3Q
5.5
-2.5
19,553 19,552
15,551
4,001
20.5
328
125
558
4,106
744
18.1
0
3,362
12%
15,822
3,730
19.1
320
111
655
3,953
783
19.8
3
3,167
4%
0%
4Q
7.0
19,800
15,688
4,112
20.8
358
132
578
4,201
868
20.7
15
3,318
27%
1Q
4.1
19,239
1.2
15,796
3,443
17.9
9.1
343
118
655
3,637
701
19.3
8
2,927
12.0
FY17
2Q
3QE
4.5
5.0
19,757 19,943
1.0
2.0
15,730 16,437
4,028
3,505
20.4
17.6
0.7
-6.0
357
384
166
113
893
753
4,397
3,762
873
752
19.9
20.0
11
3
3,513
3,007
4.5
-5.1
FY16
4QE
3.5
20,919
5.7
16,915
4,004
19.1
-2.6
442
122
522
3,962
793
20.0
4
3,165
-4.6
4.5
77,616
-0.6
62,614
15,002
19.3
15.8
1,332
485
2,352
15,538
2,999
19.3
27
12,512
17.4
FY17
4.3
79,858
2.9
64,878
14,980
18.8
-0.1
1,527
519
2,823
15,757
3,120
19.8
26
12,612
0.8
31 January 2017
23

December 2016 Results Preview | Sector: Oil & Gas
IoC
Bloomberg
Equity Shares (m)
M. Cap. (INR b)/(USD b)
52-Week Range (INR)
1,6,12 Rel Perf. (%)
IOCL IN
4855.9
1666 / 24
352 / 173
17 / 46 / 58
CMP: INR343
TP: INR464 (+35%)
Buy
We expect OMCs’ (IOCL, BPCL, HPCL) core earnings to improve, led
by improvement in refining margins QoQ. Also, on a reported basis,
earnings would increase due to inventory gains during 3QFY17.
We model nil subsidy-sharing for OMCs; the subsidy in 3QFY17
would entirely be borne by the government.
We peg refinery throughput at 15.7mmt for 3QFY17 (+8.8% YoY) –
higher due to contribution from Paradip refinery.
We expect IOCL to report net profit of INR64b in 3QFY17 (+105%
QoQ, +109% YoY).
IOCL trades at 8.6x FY18E EPS and at 1.7x FY18E BV. Dividend yield is
~4%. Buy.
Financial snapshot (INR b)
y/e march
2016 2017E 2018E 2019E
Sales
EBITDA
Adj. PAT
Adj. EPS (INR)
EPS Gr. (%)
BV/Sh.(INR)
RoE (%)
RoCE (%)
Payout (%)
Valuations
P/E (x)
P/BV (x)
EV/EBITDA (x)
Div. Yield (%)
16.9
2.2
9.9
2.0
7.0
1.9
5.5
4.2
8.6
1.7
6.0
3.5
8.2
1.5
5.6
3.6
3,544 3,574 4,203 4,547
217.0 395.2 367.6 384.3
98.5 239.5 194.5 203.3
20.3
49.3
40.1
41.9
4.6
19.2
14.3
34.6
203.8 143.0 (18.8)
13.6
10.3
36.4
29.3
19.8
34.5
20.8
14.9
34.7
156.5 179.8 205.2 230.3
Key issues to watch for
(a)
Update on Paradip refinery, (b) GRM, (c) capex plans, and (d)
forex/inventory changes.
Standalone - Quarterly Earning Model
Y/E March
Net Sales
YoY Change (%)
Total Expenditure
EBITDA
Margins (%)
Depreciation
Interest
Other Income
PBT
Tax
Rate (%)
Reported PAT
Adj PAT
YoY Change (%)
Margins (%)
Key Assumptions
Refining throughput (mmt)
GRM (USD/bbl)
Mkt sales volume incl exports (mmt)
Blended marketing GM (INR/lit)
1Q
1,010,089
-19.0
912,062
98,027
9.7
11,435
5,922
6,604
91,999
27,642
30.0
64,357
64,357
155.1
6.4
13.6
10.8
19.4
3.4
(INR Million)
FY16
FY17
FY16
2Q
3Q
4Q
1Q
2Q
3QE
4QE
851,148 831,788 800,189 856,553 800,435 900,208 944,128 3,493,214
-23.5
-22.2
-14.4
-15.2
-6.0
8.2
18.0
-20.0
846,899 782,198 764,053 723,972 745,979 791,881 869,982 3,305,213
4,249 49,589 36,136 132,581 54,456 108,326 74,146 188,001
0.5
6.0
4.5
15.5
6.8
12.0
7.9
5.4
11,286 11,693 14,114 14,350 15,048 15,070 15,070
48,528
7,293
6,104 10,682
6,800
6,147
6,249
6,249
30,001
8,465
9,331 10,881
8,957 11,807
8,849
8,849
35,280
-1,604 45,854 22,146 120,388 45,069 95,856 61,676 158,395
1,688 15,286
9,789 37,698 13,850 31,949 20,557
54,405
-105.2
33.3
44.2
31.3
30.7
33.3
33.3
34.3
-3,292 30,569 12,356 82,690 31,219 63,907 41,120 103,991
-3,292 30,569 12,356 82,690 31,219 63,907 41,120
95,034
-63.4
-215.9
-80.3
28.5 -1,048.4
109.1
232.8
127.7
-0.4
3.7
1.5
9.7
3.9
7.1
4.4
2.7
13.7
0.8
18.1
3.4
14.4
6.0
19.1
3.5
15.0
3.0
20.5
3.4
16.1
10.0
20.4
3.4
15.6
4.3
18.5
3.5
15.7
9.0
18.9
3.5
15.3
5.1
18.9
3.5
56.7
5.1
77.1
3.4
FY17E
3,501,323
0.2
3,131,814
369,509
10.6
59,537
25,445
38,462
322,989
104,053
32.2
218,935
218,935
130.4
6.3
62.7
7.1
76.7
3.5
31 January 2017
24

December 2016 Results Preview | Sector:
Financials - Banks
ICICI Bank
Bloomberg
Equity Shares (m)
M. Cap. (INR b)/(USD b)
52-Week Range (INR)
1,6,12 Rel Perf. (%)
Financial Snapshot (INR b)
Y/E March
2016 2017E
NII
212.2 208.3
OP
238.6 260.7
NP
97.3 100.1
NIM (%)
3.6
3.2
EPS (INR)
16.7
17.2
EPS Gr (%)
-13.2
2.9
BV/Sh (INR)*
132.9 145.2
ABV/Sh (INR)* 117.3 118.3
RoE (%)
11.3
10.4
RoA (%)
1.4
1.3
Valuations
AP/E (x)
11.7
10.5
AP/BV (x)
1.5
1.2
AP/ABV (x)
1.7
1.5
Div. Yield (%)
2.0
1.8
* BV adj for invt in subsidiaries
ICICIBC IN
5813.3
1460 / 21
298 / 181
-5 / 4 / -6
CMP: INR251
TP: INR332 (+32%)
Buy
2018E
242.9
230.5
104.7
3.3
18.0
4.6
158.0
127.6
10.0
1.2
9.4
1.1
1.3
1.9
2019E
282.3
265.4
126.4
3.3
21.7
20.8
173.4
145.7
11.3
1.3
7.2
0.9
1.1
2.3
We expect loan growth to moderate to 4.5% YoY. Retail loan growth
has picked up over the last two years. However, demonetization
may have resulted in a temporary moderation.
Slower growth, coupled with a YoY decline in NIM (due to lower C-D
ratio) should lead to moderate growth in NII on a YoY basis.
Fee income growth will remain muted. We have factored in ~2%
YoY growth in fee income, led by low corporate fees. Trading gains
should be healthy. Overall, we expect non-interest income to
decline 12% YoY owing to gains booked on stake sale in PruLife in
3QFY16.
Gross slippages are expected to remain high in 3QFY17, with
slippage ratio estimated at ~7%. Outstanding watch list (fund based
and non-fund based) stood at INR324.9b in 2QFY17.
We expect PAT to decline 26% YoY, led by higher operating
expenses and elevated credit costs. ICICIBC trades at 1.1x FY18E
core BV and 9.4x FY18E EPS. Buy.
Key issues to watch for
Movement of watch list accounts.
Plans on monetization of stakes in various ventures.
Outlook on asset quality and trend on further relapse from RL.
Quantum of loans rescheduled under the 5/25 scheme.
Quarterly Performance
1Q
51,151
13.9
29,899
81,050
30,672
50,378
11.5
9,554
40,824
11,063
29,762
12.1
3.5
3.7
9.6
15.2
151.4
3.7
FY16
2Q
3Q
4Q
52,515 54,530 54,045
12.8
13.3
6.4
30,074 42,169 51,089
82,588 96,698 105,134
31,004 31,100 34,059
51,584 65,598 71,075
9.8
30.2
30.0
9,422 28,441 69,262
42,163 37,158
1,813
11,862
6,976
-5,206
30,301 30,181
7,019
11.9
4.5
-76.0
3.5
3.7
9.2
13.3
158.6
3.8
3.5
3.7
14.6
15.8
211.5
4.7
3.4
3.5
16.6
12.3
262.2
5.8
1Q
51,585
0.8
34,293
85,878
33,731
52,147
3.5
25,145
27,002
4,679
22,324
-25.0
3.2
3.3
15.3
12.4
271.9
5.9
FY17
2Q
3QE
52,533 51,555
0.0
-5.5
91,197 37,216
143,730 88,771
37,369 37,492
106,361 51,278
106.2
-21.8
70,827 25,000
35,534 26,278
4,511
3,942
31,023 22,336
2.4
-26.0
3.1
3.3
16.8
10.9
321.8
6.8
4QE
52,667
-2.6
38,309
90,976
40,074
50,903
-28.4
21,985
28,917
4,528
24,389
247.5
(INR Million)
FY16
FY17E
212,240
11.5
153,231
365,471
126,836
238,635
21.0
116,678
121,957
24,694
97,263
-13.0
3.5
3.6
16.6
12.3
262.2
5.8
208,340
-1.8
201,014
409,354
148,666
260,689
9.2
142,958
117,731
17,660
100,072
2.9
Net Interest Income
% Change (YoY)
Other Income
Net Income
Operating Expenses
Operating Profit
% Change (YoY)
Other Provisions
Profit before Tax
Tax Provisions
Net Profit
% Change (YoY)
Operating Parameters
NIM (Reported,%)
NIM (Cal, %)
Deposit Growth (%)
Loan Growth (%)
Asset Quality
Gross NPA (INR b)
Gross NPA (%)
E: MOSL Estimates
3.1
15.2
4.5
364.9
7.8
3.1
18.6
10.2
391.7
7.9
3.2
18.6
10.2
391.7
7.9
31 January 2017
25

December 2016 Results Preview | Sector: Aviation
InterGlobe Aviation
Bloomberg
Equity Shares (m)
M. Cap. (INR b)/(USD b)
52-Week Range (INR)
INDIGO IN
360.4
304 / 4
1372 / 702
-2 / -17 / -37
CMP: INR843
TP: INR1,015 (+20%)
Neutral
We expect INDIGO to report revenue of INR58.2b in 3QFY17 (+35%
YoY, +40% QoQ) and EBITDAR of INR22.2b (+34% YoY, +130% QoQ).
We model yield at INR4.1 and RPK at 12.2b (+35% YoY). Any
deviation in yield would have a meaningful impact on our
estimates.
We expect net profit to grow 44% YoY to INR9.4b.
We model ASK at 55.9b/69.9b in FY17/FY18 v/s 42.8b in FY16, and
RPK at 46.6b/58.5b in FY17/FY18 v/s 35.9b in FY16, driven by an
increase in fleet size.
We model INDIGO’s fleet at 127 aircraft as at end-3QFY17 (v/s 107
aircraft as at end-FY16), and at 136/154 aircraft by end-FY17/FY18.
The stock trades at 14.4x/11.6x FY17E/FY18E reported EPS of
INR58.3/INR72.5 and at an EV of 8.4x/7.2x FY17E/FY18E adjusted
EBITDAR. Maintain
Neutral.
1,6,12 Rel Perf. (%)
Financial Snapshot (INR Billion)
Y/E March
2016 2017E 2018E 2019E
Sales
EBITDA
NP
EPS (INR)
EPS Gr. (%)
BV/Sh (INR)
RoE (%)
RoCE (%)
Payout (%)
Valuations
P/E (x)
P/BV (x)
EV/EBITDAR(x)
Div. Yield (%)
15.3
16.6
8.5
9.8
14.4
14.0
8.4
9.9
11.6
11.8
7.2
7.5
9.2
9.8
6.6
6.1
161.4 202.1 277.1 325.8
30.1
19.9
55.2
52.1
50.9
42.9
93.4
30.1
21.0
58.3
5.7
60.1
46.8
84.3
38.4
26.1
72.5
24.3
71.5
55.2
84.3
46.9
32.9
91.2
25.9
85.9
83.0
84.3
176.5 105.1 110.2 116.0
Key issues to watch for
Induction of new aircraft in the fleet.
Fuel costs and their impact on yields.
Quarterly performance
Y/E March
Net Sales
YoY Change (%)
Fuel cost
Employee cost
Other expenses
Total Expenditure
EBITDAR
Margins (%)
Net Rentals
EBITDA
Margins (%)
Depreciation
Interest
Other Income
PBT
Tax
Rate (%)
Reported PAT
EPS
YoY Change (%)
E: MOSL Estimates
1Q
42,115
NA
13,477
3,825
9,072
26,374
15,741
37
6,017
9,724
23.1
1,200
328
1,057
9,253
2,762
29.9
6,491
18.0
FY16
2Q
3Q
35,399 42,978
NA
NA
12,421 11,659
4,472
4,670
9,809
9,989
26,703 26,318
8,697 16,660
25
39
6,324
6,782
2,373
9,878
6.7
23.0
1,283
1,307
382
340
891
1,097
1,599
9,329
473
2,756
29.5
29.5
1,127
6,573
3.1
18.2
23.7
4Q
40,907
7.0
10,236
4,932
10,689
25,858
15,049
37
6,999
8,050
19.7
1,242
269
1,569
8,108
2,315
28.6
5,793
16.1
0.3
1Q
45,789
8.7
13,674
4,789
12,046
30,509
15,279
33
7,127
8,152
17.8
1,148
1,163
1,626
7,467
1,549
20.7
5,918
16.4
-8.8
FY17
2Q
3QE
41,669 58,156
17.7
35.3
15,524 17,247
5,080
5,547
11,388 13,107
31,992 35,902
9,677 22,255
23
38
7,721
8,740
1,956 13,514
4.7
23.2
1,189
1,289
610
690
1,608
1,585
1,765 13,120
367
3,674
20.8
28.0
1,398
9,446
3.9
26.2
24.1
43.7
(INR Million)
FY16
FY17E
4QE
56,496
38.1
20,665
6,187
14,069
40,921
15,575
28
9,071
6,504
11.5
1,330
771
1,517
5,919
1,657
28.0
4,262
11.8
-26.4
161,399
15.9
47,793
17,899
39,560
105,252
56,147
35
26,122
30,025
18.6
5,031
1,319
4,614
28,290
8,306
29.4
19,983
55.5
53.2
202,110
25.2
67,110
21,603
50,611
139,324
62,786
31
32,660
30,126
14.9
4,956
3,234
6,335
28,271
7,247
25.6
21,024
58.3
5.2
31 January 2017
26

December 2016 Results Preview | Sector: Metals
JSW Steel
Bloomberg
Equity Shares (m)
M. Cap. (INR b)/(USD b)
52-Week Range (INR)
1,6,12 Rel Perf. (%)
Financial Snapshot (INR Billion)
Y/E March
Sales
EBITDA
Adj. PAT
Adj. EPS (INR)
EPS Gr(%)
BV/Sh. (INR)
RoE (%)
RoCE (%)
Payout (%)
Valuation
P/E (x)
P/BV
EV/EBITDA (x)
Div. Yield (%)
-4,521.9 12.9
2.0
14.6
0.7
1.8
7.5
0.8
8.5
1.5
5.9
0.8
8.3
1.3
5.4
0.8
2016
418.8
60.7
-0.1
0.0
-100.5
77.5
0.0
2.7
-36.6
2017E 2018E 2019E
580.4
115.7
29.6
12.3
-
87.2
14.9
7.6
12.4
651.6
138.1
45.2
18.7
52.4
103.3
19.6
9.0
8.0
654.2
139.0
46.1
19.1
2.0
119.9
17.1
8.4
7.8
JSTL IN
2417.2
394 / 6
189 / 95
-2 / 13 / 52
CMP: INR163
TP: INR195 (+20%)
Buy
Consolidated EBITDA is estimated to decline by 17% QoQ to
INR24.4b due to increase in raw material cost and impact on
volumes due to demonetization of currency. Adj. PAT is estimated
to decline by 43% QoQ to INR4.2b.
Standalone EBITDA is estimated to decline 16% QoQ to INR22.8b.
Volumes are estimated to be down 7% QoQ (+40% YoY) to 3.6mt
due impact of demonetization. Realization is estimated to increase
12% QoQ to ~INR35,700/t, coming off a weaker base (monsoon in
2Q) and cost pressure-led price increases. EBITDA margin estimated
at INR6,392/t, down from INR7,077/t in 2Q.
Key issues to watch for
Steel price hikes and impact of coking coal.
Domestic steel demand growth.
Quarterly Performance (Consolidated)
Y/E March
Net Sales
Change (YoY %)
EBITDA
Change (YoY %)
Interest
Depreciation
Other Income
PBT (before EO Item)
EO Items
PBT (after EO Item)
Total Tax
% Tax
Reported PAT
MI (Profit)/Loss
Share of P/(L) of Ass.
Pref. Dividend
Adjusted PAT
Change (YoY %)
E: MOSL Estimates
1Q
115,762
-12.7
16,273
-37.7
8,222
9,385
258
-1,077
-7
-1,084
166
-15.3
-1,250
199
-17
70
-1,135
-117.5
FY16
2Q
3Q
4Q
109,069 86,983 106,975
-21.5
-34.2
-15.1
17,293
8,918 18,246
-38.5
-61.2
8.4
8,363
8,107
8,335
6,822
7,734
7,938
390
226
808
2,498 -6,696
2,781
-14 -21,221
-11
2,483 -27,917
2,770
1,424 -18,100
1,270
57.3
64.8
45.8
1,060 -9,817
1,500
132
610
10
-22
-26
203
70
70
70
1,105 -1,701
1,649
-85.2 -152.8
161.4
1Q
117,080
1.1
32,694
100.9
9,358
8,315
334
15,356
0
15,356
4,507
29.4
10,848
112
130
0
11,090
-1,076.8
(INR Million)
FY17
FY16
FY17E
2Q
3QE
4QE
132,278 149,227 181,785 418,789 580,370
21.3
71.6
69.9
-20.9
38.6
29,586 24,441 29,023 60,730 115,744
71.1
174.1
59.1
-35.4
90.6
9,646 10,047 10,139 33,027 39,191
8,915
9,075
9,236 31,879 35,541
296
830
836
1,682
2,296
11,320
6,149 10,482 -2,494 43,307
0
0
0 -21,254
0
11,320
6,149 10,482 -23,748 43,307
4,734
2,657
4,044 -15,241 15,941
41.8
43.2
38.6
64.2
36.8
6,587
3,492
6,439 -8,508 27,366
-117
-117
-117
950
-240
795
795
795
138
2,516
0
0
0
279
0
7,265
4,170
7,117
-84 29,641
557.5 -345.2
331.6 -100.5
nm
31 January 2017
27

December 2016 Results Preview | Sector: Agri
Kaveri Seed
Bloomberg
Equity Shares (m)
M. Cap. (INR b)/(USD b)
52-Week Range (INR)
1,6,12 Rel Perf. (%)
KSCL IN
69.1
29 / 0
472 / 300
0 / -5 / 9
CMP: INR414
TP: INR489 (+18%)
Buy
We expect revenue to grow 15% YoY to INR1.06b.
We estimate EBITDA at INR63m, with 6% margin in 3QFY17 v/s
EBITDA of INR129m and margin of 14% in 3QFY16.
We expect adjusted PAT of INR26m in 3QFY17.
Buy.
Financial Snapshot (INR Billion)
Y/E March
2016 2017E 2018E 2019E
Sales
EBITDA
NP
EPS (INR)
EPS Gr. (%)
BV/Sh (INR)
RoE (%)
RoCE (%)
Payout (%)
Valuations
P/E (x)
P/BV (x)
EV/EBITDA (x)
Div Yield (%)
16.5
3.1
15.0
2.5
17.8
3.0
16.5
3.2
14.2
2.7
12.5
3.7
11.3
2.5
9.7
4.2
8.9
1.9
1.7
24.9
-42.9
20.7
22.2
48.1
7.2
1.7
1.6
23.1
-7.6
17.1
18.5
67.6
8.7
2.2
2.0
28.8
25.1
20.0
21.7
62.4
10.5
2.7
2.5
36.3
25.9
23.1
25.0
56.1
131.3 138.8 149.6 165.5
Key things to watch for
Impact on cotton acreages due to reduced sowing.
Cotton yields.
Any write-offs.
Quarterly Performance
Y/E March
Net Sales
YoY Change (%)
Total Expenditure
EBITDA
Margins (%)
Depreciation
Interest
Other Income
PBT before EO expense
PBT
Tax
Rate (%)
Minority Interest & Profit/Loss of Asso. Cos.
Reported PAT
Adj PAT
YoY Change (%)
Margins (%)
E: MOSL Estimates
1Q
5,394
-34.8
3,137
2,256
41.8
52
0
21
2,225
2,225
34
1.5
0
2,191
2,191
-5.1
40.6
FY16
2Q
3Q
663
919
-67.5
1.3
1,109
790
-446
129
-67.3 14.0
53
81
1
1
29
42
-470
89
-470
89
11
-1
-2.4
-0.7
0
-3
-482
92
-482
92
NM -74.2
-72.7 10.0
4Q
438
9.7
486
-47
-10.8
75
1
57
-66
-66
12
-17.7
-3
-75
-75
NM
-17.0
1Q
4,940
-8.4
3,357
1,583
32.0
78
0
54
1,559
1,559
15
1.0
0
1,544
1,544
-29.6
31.3
FY17
2Q
3QE
678 1,057
2.2
15.0
644
994
34
63
5.0
6.0
72
82
0
0
170
48
132
29
132
29
54
3
41.1
10.0
0
0
77
26
77
26
NM
NM
11.4
2.5
4QE
504
15.0
514
-10
-2.0
84
0
50
-44
-44
-4
10.0
0
-40
-40
NM
-7.9
(INR Million)
FY16 FY17E
7,414
-36.2
5,522
1,892
25.5
261
2
148
1,777
1,777
56
3.2
1,721
1,721
-42.8
23.2
7,244
-2.3
5,578
1,666
23.0
317
2
312
1,659
1,659
66
4.0
1,593
1,593
-7.5
22.0
31 January 2017
28

December 2016 Results Preview | Sector: Technology
Mphasis
Bloomberg
Equity Shares (m)
M. Cap. (INR b)/(USD b)
52-Week Range (INR)
1,6,12 Rel Perf. (%)
MPHL IN
210.1
112 / 2
622 / 404
1 / -3 / 4
CMP: INR534
TP: INR560 (+5%)
Neutral
In 2QFY17, HP channel revenue grew for the first time in 20
quarters. This is expected to remain stable with the renewed MSA
coming into effect after the completion of the transaction between
HPE and Blackstone.
We expect revenue growth of 0.7% QoQ (1.4% QoQ CC), driven by
stability in HP channel and Digital Risk and continued traction in the
Direct International business.
Margins are likely to be lower in 3Q on account of wage hikes. We
estimate a 160bp decline in EBIT margin to 13%.
MPHL had raised its EBIT margin guidance by 100bp at the end of
4QFY16 to 14-16% for FY17, and expressed confidence in achieving
the higher end of the range.
Our PAT estimate is INR1.9b (-9.9% QoQ).
The stock trades at 12.7x FY17E and 9.9x FY18E EPS. Neutral.
Outlook for Digital Risk given an interest rate cycle reversal.
Deal TCV during the quarter in Direct Channel (organic business), and
focus areas.
Financial Snapshot (INR b)
Y/E Mar
2016 2017E 2018E 2019E
Sales
EBITDA
PAT
EPS (INR)
EPS Gr. (%)*
BV/Sh. (INR)
RoE (%)
RoCE (%)
Payout (%)
Valuations
P/E (x)
P/BV (x)
EV/EBITDA (x)
Div yld (%)
60.9
9.0
7.2
34.5
6.8
299.4
12.3
11.2
0.0
15.5
1.8
9.8
0.0
60.6
9.5
8.9
42.2
22.4
317.2
13.7
12.8
87.7
12.7
1.7
2.1
6.9
66.8
10.5
11.3
54.0
28.1
344.7
16.3
15.8
40.7
9.9
1.5
1.3
4.1
73.4
11.3
12.0
57.2
5.9
375.5
15.9
15.6
38.4
9.3
1.4
0.6
4.1
Key issues to watch for
*Annualized values for 5m FY14
Performance in Direct International business, and outlook for the year.
Quarterly Performance
Y/E March
Jun 15
Revenue (USD m)
234
QoQ (%)
1.7
Revenue (INR m)
14,945
YoY (%)
0.3
GPM (%)
26.2
SGA (%)
11.9
EBITDA Margin (%)
14.1
EBIT Margin (%)
12.7
Other income
440
ETR (%)
29.2
PAT
1,658
QoQ (%)
-6.7
YoY (%)
-5.1
EPS (INR)
8.3
Headcount
34,159
Net Additions
100
HP Channel rev. (%)
28.8
Fixed Price (%)
12.3
E: MOSL Estimates
(INR m)
FY17E
905
-2.3
60,590
-0.5
27.6
11.9
15.7
14.7
3,445
27.7
8,852
22.2
42.2
21,647
-677
FY16
Sep 15
237
1.2
15,575
6.3
26.9
11.9
15.1
13.9
492
26.4
1,900
14.6
18.6
9.0
24,169
-9990
26.5
14.0
Dec 15
229
-3.4
15,167
7.5
25.6
11.3
14.3
13.2
456
27.7
1,736
-8.6
5.1
8.3
23,563
-606
24.2
19.2
Mar 16
225
-1.7
15,160
6.1
27.9
12.2
15.7
14.5
490
31.1
1,920
10.6
8.0
9.2
22,324
-1239
24.3
21.1
Jun 16
224
-0.3
15,167
1.5
28.1
12.0
16.1
15.2
572
27.7
2,043
6.4
23.2
9.7
22,374
50
23.4
19.8
FY17E
Sep 16
Dec 16
224
226
-0.2
0.7
15,176
14,904
-2.6
-1.7
28.1
26.6
11.8
11.9
16.2
14.7
15.3
13.7
711
670
27.7
27.7
2,166
1,952
6.0
-9.9
14.0
-25.1
10.3
9.3
22,284
21,202
-90
-1082
23.9
19.1
FY16
Mar 17
230
2.1
15,343
1.2
27.5
11.8
15.7
14.6
1,492
27.7
2,691
37.9
-6.6
12.8
21,647
445
926
-2.2
60,879
5.1
26.6
11.8
14.7
13.5
1,954
27.1
7,242
6.9
34.5
22,324
-11735
31 January 2017
29

December 2016 Results Preview | Sector: Oil & Gas
ONGC
Bloomberg
Equity Shares (m)
M. Cap. (INR b)/(USD b)
52-Week Range (INR)
1,6,12 Rel Perf. (%)
ONGC IN
12833.3
2494 / 37
210 / 125
-2 / 28 / 18
CMP: INR194
TP:INR223 (+15%)
Neutral
We expect ONGC to report adjusted PAT of INR44.5b in 3QFY17
(v/s INR49.7b in 2QFY17 and INR40.8b in 3QFY16).
We estimate EBITDA at INR97.1b (v/s INR95.4b in 2QFY17 and
INR86.4b in 3QFY16). We estimate gross and net realization at
USD50.1/bbl, as we expect the entire subsidy to be borne by the
government.
The stock trades at 9.7x FY18E consolidated EPS of INR20, with
implied dividend yield of 3-4%. Neutral.
Financial snapshot (INR b)
y/e march
2016 2017E 2018E 2019E
Sales
EBITDA
PAT
EPS (INR)
EPS Gr. (%)
BV/Sh.(INR)
RoE (%)
RoCE (%)
Payout (%)
Valuation
P/E (x)
P/BV (x)
EV/EBITDA,x
Div. Yield (%)
14.3
1.4
6.1
4.4
13.1
1.3
6.0
4.6
9.7
1.3
4.7
6.7
8.2
1.2
4.0
7.7
1,293
452
176
13.6
-0.7
144
9.5
8.7
73.2
1,293
505
193
14.8
9.9
150
10.1
8.5
71.0
1,573
659
263
20.0
36.3
155
13.1
10.8
75.9
1,646
730
312
23.8
18.7
161
15.1
12.4
73.6
Key issues to watch for
(a) Subsidy sharing, (b) DD&A charges, (c) oil & gas production
volumes, and (d) new investments in KG Basin following new deep
water gas pricing policy.
Quarterly performance (Standalone)
Y/E March
Net Sales
Change (%)
EBITDA
% of Net Sales
Change (%)
D,D & A
Interest
Other Income
(Impairment) / writeback
PBT
Tax
Rate (%)
PAT
Change (%)
Adjusted PAT
Adj. EPS
Key Assumptions (USD/bbl)
Fx rate (INR/USD)
Gross Oil Realization
Subsidy
Net Oil Realization
Subsidy (INR b)
E: MOSL Estimates
1Q
227.0
4.4
120.0
52.9
-4.7
45.8
0.0
9.4
83.5
28.9
34.6
54.6
14.2
54.6
4.3
63.7
63.8
4.9
58.9
11.3
FY16
2Q
205.6
1.0
103.9
50.5
-4.3
46.1
0.0
12.5
70.4
22.0
31.2
48.4
-11.1
48.4
3.8
65.0
51.2
2.4
48.8
6.0
3Q
184.0
-1.7
86.4
47.0
-8.0
39.5
0.0
9.6
-39.9
16.6
3.7
22.3
12.9
-64.0
40.8
3.2
66.0
44.3
0.0
44.3
0.0
4Q
161.4
-24.2
59.7
37.0
-39.9
41.0
0.1
20.9
24.0
63.5
19.3
30.4
44.2
12.2
27.5
2.1
67.3
34.9
0.0
34.9
0.0
1Q
176.7
-22.1
92.8
52.5
-22.7
37.0
2.9
10.7
0.0
63.5
21.2
33.4
42.3
-22.5
42.3
3.3
67.0
46.1
0.0
46.1
0.0
FY17E
2Q
182.9
-11.1
95.4
52.2
-8.2
34.5
3.0
12.9
0.0
70.7
21.0
29.7
49.7
2.7
49.7
3.9
67.0
47.9
0.0
47.9
0.0
(INR Billion)
3QE
193.3
5.1
97.1
50.2
12.4
34.3
3.0
9.6
0.0
69.4
24.9
35.9
44.5
245.8
44.5
3.5
67.4
50.1
0.0
50.1
0.0
4QE
197.6
22.4
97.8
49.5
63.9
58.1
3.0
6.3
0.0
43.0
19.2
44.7
23.8
-46.2
23.8
1.9
68.0
55.1
0.0
55.1
0.0
FY16
778.0
-5.3
370.0
47.6
-13.5
172.4
0.1
52.4
-15.9
233.9
73.9
31.6
160.0
-9.7
171.3
13.3
65.5
48.6
1.8
46.7
17.3
FY17E
750.4
-3.5
383.0
51.0
3.5
163.9
12.0
39.5
0.0
246.6
86.3
35.0
160.3
0.2
160.3
12.5
67.4
49.8
0.0
49.8
0.0
31 January 2017
30

December 2016 Results Preview | Sector: Oil & Gas
Oil India
Bloomberg
Equity Shares (m)
M. Cap. (INR b)/(USD b)
52-Week Range (INR)
1,6,12 Rel Perf. (%)
OINL IN
601.1
275 / 4
465 / 301
4 / 25 / 11
CMP: INR457
TP: INR508 (+11%)
Buy
We expect OINL to report adjusted PAT of INR5.6b (v/s INR4.1b in
3QFY16 and INR5.8b in 2QFY17).
We estimate EBITDA at INR7.8b (up 25% YoY and 5% QoQ). We
estimate gross and net realization at USD47.8/bbl, with no subsidy
sharing burden.
Our Brent price assumption is USD49.3/60/bbl for FY17/18.
The stock trades at 8.4x FY18E EPS of INR54. We remain positive on
OINL due to attractive valuations and high dividend yield of ~4%.
Buy.
Financial snapshot (INR b)
y/e march
2016 2017E 2018E 2019E
Sales
EBITDA
Adj. PAT
Adj. EPS (INR)
EPS Gr. (%)
BV/Sh.(INR)
RoE (%)
RoCE (%)
Payout (%)
Valuations
P/E (x)
P/BV (x)
EV/EBITDA,x
Div. Yield (%)
11.8
1.2
8.9
3.5
10.2
1.1
7.0
3.7
8.4
1.1
6.3
4.6
8.2
1.0
6.0
4.8
92.7
31.2
23.3
38.8
-7.2
377.9
10.5
8.3
48.3
91.8
39.4
26.9
44.7
15.3
402.2
11.5
8.5
45.6
114.2
43.6
32.5
54.1
21.1
431.7
13.0
9.6
45.6
118.4
45.1
33.5
55.7
2.8
461.9
12.5
9.3
45.6
Key issues to watch for
(a) Subsidy sharing, (b) DD&A charges, and (c) oil & gas production
volumes.
Quarterly Performance
Y/E March
Net Sales
Change (%)
EBITDA
% of Net Sales
Change (%)
D,D&A
Interest
OI (incl. Oper. other inc)
PBT before exceptionals
Exceptional item
PBT after exceptionals
Tax
Rate (%)
PAT
Change (%)
Adj. EPS (INR)
Key Assumptions(USD/bbl)
Exchange rate (INR/USD)
Gas Price (USD/bbl)
Gross Oil Realization
Subsidy
Net Oil Realization
Subsidy (INR b)
1Q
27.5
9.4
10.8
39.4
-2.7
1.9
0.8
4.1
12.2
0.0
12.2
4.5
36.7
7.8
-9.0
12.9
63.5
4.7
61.9
4.4
57.4
1.7
FY16
2Q
24.0
15.2
7.7
32.1
10.4
2.2
0.9
5.6
10.2
0.0
10.2
3.4
33.8
6.7
10.9
11.2
65.0
4.7
48.7
2.3
46.4
0.8
3Q
22.2
7.6
6.3
28.4
21.3
2.5
0.9
3.7
6.6
0.0
6.6
2.5
37.6
4.1
-17.6
6.8
65.9
4.2
42.0
-
42.0
-
4Q
19.0
-26.2
6.3
33.2
-7.6
3.1
0.9
5.4
7.8
2.2
5.6
0.9
11.7
4.7
-14.9
11.4
67.5
4.2
32.6
-
32.6
(1.0)
1Q
21.3
-22.4
7.8
36.3
-28.5
2.3
1.0
3.3
7.7
0.0
7.7
2.8
36.2
4.9
-36.2
8.2
66.9
3.4
43.1
-
43.1
-
FY17
2Q
22.4
-6.5
7.5
33.3
-2.9
2.5
1.0
4.8
8.8
0.0
8.8
2.9
33.7
5.8
-14.0
9.7
67.0
3.4
44.6
-
44.6
-
(INR Billion)
3QE
23.2
4.4
8.0
34.3
26.4
2.3
1.0
3.8
8.4
0.0
8.4
2.8
33.0
5.6
37.5
9.4
67.4
2.6
47.8
-
47.8
-
4QE
24.9
31.0
16.3
65.4
157.6
2.3
0.9
2.6
15.6
0.0
15.6
5.2
33.0
10.5
123.2
17.4
68.0
2.6
52.8
-
52.8
-
FY16
92.7
0.4
31.2
33.6
3.4
9.7
3.5
18.8
36.8
2.2
34.6
11.3
30.8
23.3
-7.2
42.3
65.5
4.4
46.3
1.7
44.6
1.6
FY17E
91.8
-0.9
39.4
43.0
26.6
9.5
3.9
14.5
40.6
0.0
40.6
13.7
33.8
26.9
15.3
44.7
67.3
3.0
47.0
-
47.0
-
31 January 2017
31

December 2016 Results Preview | Sector: Retail
Shoppers Stop
Bloomberg
Equity Shares (m)
M. Cap. (INR b)/(USD b)
52-Week Range (INR)
1,6,12 Rel Perf. (%)
Financial Snapshot (INR b)
Y/E March
Sales
EBITDA
Adj. PAT
Adj. EPS (INR)
EPS Gr. (%)
BV/Sh.(INR)
RoE (%)
RoCE (%)
Payout (%)
Valuations
P/E (x)
P/BV (x)
EV/EBITDA (x)
50.6
3.1
12.0
96.9
2.9
17.9
32.2
2.7
10.6
21.5
2.4
7.8
2016 2017E 2018E 2019E
34.1
2.2
0.5
5.8
19.3
95.6
6.3
6.2
0.0
36.2
1.4
0.3
3.0
-47.7
3.1
4.3
0.0
41.6
2.4
0.8
9.2
201.0
8.8
7.8
0.0
47.8
3.1
1.1
13.8
50.0
11.9
9.8
0.0
SHOP IN
82.2
24 / 0
420 / 265
-2 / -21 / -30
CMP: INR295
TP: INR300 (+2%)
Neutral
We expect SHOP’s revenue to grow 5% YoY to INR9.6b.
Same-store sales (SSS) are estimated to be flat on a base of 17.4%
LTL sales growth.
EBITDA margin is likely to contract 250bp to 5.3% in 3QFY17; we
have factored in EBITDA decline of 28.8% and PAT decline of 52% to
INR113m.
The stock trades at 32.2x FY18E EPS of INR9.2; maintain Neutral.
101.1 110.4 124.4
Key issues to watch for
Comments on same-store performance; margin outlook.
Update on Omni-channel strategy.
Guidance on HyperCITY’s breakeven.
Quarterly performance
Y/E March
1Q
LTL Sales Gr %
Deptt Stores
Net Sales
YoY Change (%)
Total Exp
EBITDA
Growth %
Margins (%)
Depreciation
Interest
Other Income
PBT
Tax
Rate (%)
Adjusted PAT
YoY Change (%)
E: MOSL Estimates;
12.7
73
6,846
11.8
6,677
169
-45.2
2.5
199
139
207
37
16
41.9
22
188.1
FY16
2Q
0.1
74
8,769
2.5
8,359
410
-26.2
4.7
309
135
242
207
87
42.0
120
-24.5
3Q
17.4
76
9,118
19.1
8,405
712
33.0
7.8
211
158
58
402
166
41.2
236
71.3
4Q
5.9
77
8,959
9.7
8,437
523
6.5
5.8
258
141
50
174
72
41.5
102
-1.2
1Q
5.5
81
7,559
10.4
7,485
74
-56.4
1.0
372
159
237
-220
-85
38.5
-136
-726.9
FY17
2Q
2.2
82
9,395
7.1
9,065
330
-19.3
3.5
243
143
225
170
63
37.1
107
-11.0
3QE
0.0
81
9,573
5.0
9,066
507
-28.8
5.3
226
155
58
185
72
39.0
113
-52.2
4QE
2.7
82
9,652
7.7
9,152
500
-4.3
5.2
163
105
50
282
112
39.7
170
67.2
9.0
77
34,132
11.9
31,960
2,173
15.0
6.4
977
573
213
836
346
41.4
490
20.3
2.6
82
36,180
6.0
34,768
1,412
-35.0
3.9
1,003
562
570
417
163
39.0
254
-48.1
FY16
FY17E
31 January 2017
32

December 2016 Results Preview | Sector: Financials
Shriram Transport Finance
Bloomberg
Equity Shares (m)
M. Cap. (INR b)/(USD b)
52-Week Range (INR)
1,6,12 Rel Perf. (%)
SHTF IN
226.9
207 / 3
1325 / 737
0 / -24 / 4
CMP: INR939
TP: INR1,282 (+37%)
Buy
Financial Snapshot (INR b)
Y/E March
2016 2017E 2018E 2019E
Net Inc.
50.7 57.0 66.1 76.8
PPP
38.4 42.9 49.8 58.0
PAT
11.8 14.4 18.4 22.6
Cons.PAT
12.1 14.4 18.7 23.0
EPS (INR)
51.9 63.3 81.2 99.7
Cons. EPS (INR)
53.3 63.5 82.3 101.4
BV/Sh (INR)
447.5 497.3 561.1 639.5
Cons. BV (INR)
449.6 499.6 564.5 644.6
RoA on AUM (%)
2.1
2.2
2.5
2.7
RoE (%)
12.2 13.4 15.4 16.6
Payout (%)
22.3 21.2 21.2 21.2
Valuations
P/Cons. EPS (x)
17.6 14.8 11.4
9.3
P/Cons. BV (x)
2.1
1.9
1.7
1.5
Div. Yield (%)
1.1
1.2
1.6
1.9
SHTF’s AUM is expected to continue to slow down to 13% YoY.
Calculated margins on AUMs will decline QoQ given higher share
of newer vehicles.
Cost to income is likely to increase ~100bp YoY to 26%, given
sluggish NII growth
GNPLs would remain elevated at +6.5%. We expect the company
to use the RBI dispensation provision regarding NPA recognition.
Recoveries in the construction equipment financing business also
remain a key monitorable.
We factor in provisions of INR4.8b, as against INR4.6b in 2QFY17.
The stock trades at 1.7x FY17E and 1.5x FY18E consolidated BV.
Maintain Buy.
Key issues to watch for
Business growth and momentum, and management commentary on
the same.
Movement in borrowing costs and margins.
Asset quality trends given impact of demonetization
Recoveries in equipment financing portfolio.
SHTF: Quarterly Performance
Y/E March
(INR Million)
FY16
95,300
50,744
44,556
32.0
6,171
50,727
23.3
762
51,489
23.1
13,089
38,400
23.7
20,586
17,814
6,032
11,782
-4.8
23.1
12.0
25.4
33.9
FY17
103,634
55,608
48,026
7.8
8,984
57,010
12.4
800
57,810
12.3
14,893
42,917
11.8
20,973
21,944
7,571
14,373
22.0
14.2
15.5
25.8
34.5
FY16
FY17
1Q
2Q
3Q
4Q
1Q
2Q
3QE
4QE
Interest Income
22,015
22,402
23,675
27,207
24,764
24,626
25,611
28,633
Interest expenses
11,972
12,059
12,239
14,474
13,165
13,358
13,893
15,191
Net Interest Income
10,043
10,343
11,436
12,733
11,598
11,268
11,719
13,441
YoY Growth (%)
39.3
31.3
24.5
34.3
15.5
8.9
2.5
5.6
Securitization income
1,313
1,586
1,567
1,705
1,863
2,262
2,285
2,575
Net Income (Incl. Securitization)
11,356
11,929
13,002
14,438
13,461
13,530
14,003
16,016
YoY Growth (%)
17.4
18.4
23.5
33.0
18.5
13.4
7.7
10.9
Fees and Other Income
162
211
193
197
167
169
250
242
Net Operating Income
11,519
12,140
13,195
14,635
13,628
13,699
14,253
16,258
YoY Growth (%)
16.2
18.6
23.6
32.9
18.3
12.8
8.0
11.1
Operating Expenses
2,905
3,001
3,287
3,896
3,341
3,168
3,700
4,684
Operating Profit
8,613
9,139
9,909
10,739
10,287
10,531
10,553
11,574
YoY Growth (%)
16.4
19.3
24.3
33.9
19.4
15.2
6.5
7.8
Provisions
3,823
3,997
4,199
8,567
4,591
4,591
4,780
7,012
Profit before Tax
4,790
5,142
5,710
2,172
5,697
5,940
5,773
4,562
Tax Provisions
1,579
1,761
1,959
733
1,956
2,063
1,992
1,560
Net Profit
3,211
3,381
3,751
1,439
3,741
3,877
3,781
3,002
YoY Growth (%)
4.8
11.9
20.1
-54.6
16.5
14.7
0.8
108.6
AUM Growth (%)
11.3
13.8
16.6
23.1
23.6
19.1
0.0
0.0
Securitization Inc. / Net Inc. (%)
11.4
13.1
11.9
11.7
13.7
16.5
16.0
15.8
Cost to Income Ratio (%)
25.2
24.7
24.9
26.6
24.5
23.1
26.0
28.8
Tax Rate (%)
33.0
34.3
34.3
33.7
34.3
34.7
34.5
34.2
E: MOSL Estimates; * Quarterly nos. and full year nos. will not tally due to different way of reporting financial nos
31 January 2017
33

December 2016 Results Preview | Sector: Consumer
TTK Prestige
Bloomberg
Equity Shares (m)
M. Cap. (INR b)/(USD b)
52-Week Range (INR)
1,6,12 Rel Perf. (%)
Financial Snapshot (INR Billion)
Y/E March
Sales
EBITDA
NP
EPS (Rs)
EPS Gr. (%)
Sales
RoE (%)
RoCE (%)
Valuations
P/E (x)
P/BV (x)
EV/EBITDA (x)
EV/Sales (x)
56.7
9.2
36.3
4.3
53.0
8.5
32.5
3.9
40.8
7.6
25.1
3.3
32.0
6.7
20.3
2.9
2016
15.3
1.8
1.2
29.6
17.2
17.3
2017 2018E 2019E
17.3
2.1
1.3
7.0
16.6
16.2
20.1
2.7
1.6
29.8
19.7
18.7
22.7
3.2
2.1
27.7
22.4
22.1
TTKPT IN
11.7
67 / 1
6550 / 4010
8 / 25 / 17
CMP: INR5,717 TP: INR4,896 (-14%)
Hold
We expect revenue to grow 12% YoY to INR5.1b in 3QFY17. The
impact of demonetization will not be very sharp on TTK, as the
current year will include incremental sales from the acquired entity,
Horwood (a high margin business). There was disruption in demand
in November. However, healthy sales in October and demand
recovery in December have softened the impact.
We expect EBITDA margin to decline 50bp YoY to 12.5%. EBITDA
should increase 8% YoY to INR627m.
We expect adjusted PAT to be flattish at INR377m.
100.7 107.8 139.9 178.6
620.3 675.1 748.7 849.1
Key things to watch for
Performance of the appliances division post demonetization.
Outlook on exports and recent acquisition of Horwood Homeware.
Quarterly Performance (INR m)
Y/E March
Net Sales
YoY Change (%)
Total Expenditure
EBITDA
Margins (%)
Depreciation
Interest
Other Income
PBT before EO expense
Extra-Ord expense
PBT
Tax
Rate (%)
Reported PAT
Adj PAT
YoY Change (%)
Margins (%)
E: MOSL Estimates
1Q
3,404
1.2
3,026
378
11.1
47
6
28
354
37
317
97
30.6
220
246
-7.4
7.2
FY16
2Q
3Q
4,099
4,478
7.3
16.7
3,575
3,897
524
581
12.8
13.0
49
52
7
5
24
20
492
544
0
0
492
544
152
172
30.8
31.7
340
372
340
372
21.7
32.6
8.3
8.3
4Q
3,077
7.5
2,740
338
11.0
62
2
30
303
0
303
87
28.6
216
216
131.2
7.0
1Q
3,790
11.3
3,320
470
12.4
56
23
18
409
82
327
109
33.4
217
272
10.8
7.2
FY17
2Q
3QE
5,011
5,016
22.2
12.0
4,389
4,389
621
627
12.4
12.5
55
82
22
18
17
25
561
552
0
0
561
552
172
175
30.6
31.7
389
377
389
377
14.3
1.4
7.8
7.5
FY16
4QE
3,508
14.0
3,140
368
10.5
82
18
25
293
0
293
84
28.6
209
209
-3.1
6.0
15,059
8.5
13,238
1,821
12.1
209
20
102
1,693
37
1,656
508
30.7
1,148
1,174
29.6
7.8
FY17E
17,311
15.0
15,233
2,077
12.0
279
79
91
1,810
82
1,728
529
30.6
1,199
1,256
7.0
7.3
31 January 2017
34

In conversation
1. Omnichem will grow at not less than 20 per cent: Krishna
Prasad, CMG, Granules India
These margins will definitely keep up for the rest of the year, another three
months to go and quarter-on-quarter have been improving and expect further
improvement in margins.
FY17 is strong and FY18 will be stronger than that and estimate that OmniChem
is going to do anywhere from 180-200 crores revenues with an EBITDA of not
less than 20 per cent.
OTC has been growing on slowly and we have been getting more and more
orders. It is a slow ramp up, actually, it is a little slower than what we expected
but internal estimates enough to say that in the next four to five years we
should be touching about 100 crores on that division alone.
Anything on quality is concerning, these are all procedural issues, nothing with
data integrity and each agency looks at things differently and this has been a
great learning for us and we have learned and we have implemented all the
corrective actions and have responded within the stipulated time.
2. Expect revenue to grow at 24% for brands business: Arvind;
Kulin Lalbhai, ED
For the third quarter of FY17, textile manufacturer Arvind reported a 14.4
percent increase in revenue to Rs 2323 crore year-on-year (YoY) and its EBITDA
fell 8.2 percent to Rs 235 crore (YoY).
Drop in EBITDA was on the back of trade channels that witnessed a liquidity
crisis.
Post the temporary shock due to demonetisation, business is now seeing a
strong recovery.
Expects revenue to grow at 24 percent for its brands business.
3. Note ban hit new customer additions by 7-8%: Justdial;
Ramkumar Krishnamachari, CFO
Impact of demonetisation had turned out to be neutral as the local search
service had witnessed better payouts from existing clients.
Core search business had grown better than in the previous quarter and expects
sales growth to improve in the final quarter.
Bottom performers have been weeded out from the sales force, Justdial will
undertake hiring in Q4, saying it takes six to eight months for new employees to
become productive.
Going into the next financial year, the focus would be on core business, which
has immense potential
31 January 2017
35

From the think tank
1. Modi’s ‘Think West’ strategy is taking off
Since Prime Minister Narendra Modi got Barack Obama, then US president, to
participate as chief guest at the Republic Day parade in 2015, the invitee each
year is seen to carry weight in India’s strategic calculus. This certainly was the
case last week with the state visit of Sheikh Mohammed bin Zayed Al Nahyan,
the crown prince of Abu Dhabi and deputy supreme commander of the United
Arab Emirates (UAE) armed forces. Relations with the UAE in particular and
India’s “Think West” strategy in general have been under-appreciated successes
of Modi’s foreign policy.
2. Union budget’s false dilemma
The tears that politicians of different hues shed for the poor and the
underprivileged make an average citizen extremely cynical. At the risk of
caricaturing, after every budget the plethora of opinion that one tends to hear
could perhaps be segmented into two corner positions: (a) this budget is a
populist budget catering to vote-bank politics; and/or (b) this budget looks into
the needs of long-term investment and is a growth-oriented budget. Is such
branding the result of a false dichotomy? Are there fiscal measures that could be
populist but still capable of generating long-term investment? Such questions
often remain unanswered.
3. Push growth without fiscal imbalance
Three out of four engines of aggregate demand for India — private
consumption, private investment, and external demand — are stuttering.
Government spending is the only component of demand that is relatively
robust. Capital inflows into India by foreign institutional investors (FIIs) have
been slowing. There is considerable uncertainty over estimates of
macroeconomic variables such as GDP, which makes the task of preparing
budget estimates difficult.
4. Thorough, demonstrable preparedness is key to save gaar from
scuttling
The finance ministry has done well to both stick to its timetable for
implementing the general anti-avoidance rules (Gaar) and assuage foreign
investors’ fears over their implementation. A law is already in place, along with
clarifications, to curb sharp practices. Foreign portfolio investors coming
through Mauritius and Singapore will be spared, so long as the sole purpose of
an FPI arrangement is not be to obtain tax benefits. India does have a specific
anti-avoidance rule, called the limitation of benefit (LoB), in the revised tax
treaties with the two countries, to curb treaty shopping. The tax department has
said that Gaar will not be invoked if a case of avoidance is “sufficiently”
addressed by the LoB clause. Gaar would entail discretion and hence safeguards
must be in place to prevent arbitrariness.
31 January 2017
36

5. Deal with dal: how processors jack-up prices during lean
seasons
Arrivals of tur or pigeon pea at the Gulbarga (aka Kalaburagi) mandi in North
Karnataka speak of a harvest blessed by favourable weather and low incidence of
pest and disease attacks unlike a year ago. On January 12, when this correspondent
visited the wholesale market-yard, 5,035 quintals arrived versus 3,405 quintals the
same day the previous year. Expanded supply has dampened prices. The weighted
average rate in the Gulbarga yard on January 12 was R4,326 a quintal against
R9,536 a year ago.
International
6. TPP IS DEAD, LONG LIVE RCEP, ER WTO
On his first day in office, President Donald Trump withdrew America from a
mega-free trade agreement called the Trans Pacific Partnership (TPP). India
must work double hard to strengthen the World Trade Organization and its
multilateral framework, which is also likely to come under attack from new
protectionism in the US. India should also pursue other trade deals, like the
Asean plus six Regional Comprehensive Economic Partnership (RCEP). However,
such trade deals are no substitute for a strong, rule-based multilateral
framework, which the WTO represents. The WTO has been languishing and
needs the active support of a country like India.
31 January 2017
37

Click excel icon
for detailed
valuation guide
CMP
(INR)
Valuation snapshot
Company
Automobiles
Amara Raja
Ashok Ley.
Bajaj Auto
Bharat Forge
Bosch
Eicher Mot.
Endurance Tech.
Escorts
Exide Ind
Hero Moto
M&M
Mahindra CIE
Maruti Suzuki
Tata Motors
TVS Motor
Aggregate
Banks - Private
Axis Bank
DCB Bank
Equitas Hold.
Federal Bank
HDFC Bank
ICICI Bank
IDFC Bank
IndusInd
J&K Bank
Kotak Mah. Bk
RBL Bank
South Indian
Yes Bank
Aggregate
Banks - PSU
BOB
BOI
Canara
IDBI Bk
Indian Bk
OBC
PNB
SBI
Union Bk
Aggregate
NBFCs
Bajaj Fin.
Bharat Fin.
Dewan Hsg.
GRUH Fin.
HDFC
Indiabulls Hsg
LIC Hsg Fin
Manappuram
M&M Fin.
Muthoot Fin
PFC
Reco
Buy
Buy
Buy
Buy
Neutral
Buy
Buy
Buy
Buy
Neutral
Buy
Not Rated
Buy
Buy
Buy
TP
% Upside
EPS (INR)
P/E (x)
P/B (x)
ROE (%)
(INR) Downside FY16 FY17E FY18E FY17E FY18E FY17E FY18E FY16 FY17E FY18E
19
24
10
15
-6
23
14
11
15
-6
20
15
15
19
28.7
3.9
131.8
28.1
483.3
492.9
20.7
11.1
7.4
158.3
53.6
4.2
177.6
36.9
9.1
29.2
4.8
133.0
25.8
507.6
608.7
22.6
20.7
8.2
169.5
66.0
6.2
247.5
29.0
11.9
37.7
6.4
158.9
36.4
657.7
869.5
28.7
34.2
9.7
192.2
83.7
9.7
307.5
45.6
15.4
31.3
19.1
21.2
36.9
43.8
38.3
27.7
17.8
24.5
18.9
18.9
30.9
23.8
18.4
32.6
23.6
33.6
16.7
28.2
16.9
22.6
15.7
20.2
25.6
Loss
29.5
31.5
7.7
17.5
22.9
13.6
Loss
12.0
51.3
8.9
6.2
16.2
26.8
9.4
17.3
33.2
16.3
9.2
42.8
39.9
11.0
14.9
21.1
33.0
11.7
5.6
24.2
14.4
17.8
26.1
33.8
26.8
21.8
10.8
20.9
16.6
14.9
19.7
19.2
11.7
25.2
17.8
18.9
13.8
24.7
14.1
18.8
15.1
15.7
21.1
4.4
24.0
22.3
6.9
14.3
18.0
8.9
6.5
7.8
12.2
8.4
5.6
10.5
11.3
4.9
11.0
25.5
17.1
8.0
34.2
37.1
8.9
12.5
18.8
25.2
10.0
5.3
6.2
4.1
5.9
5.6
9.1
13.4
5.1
1.9
3.5
6.8
1.5
2.1
5.4
2.0
7.9
4.0
2.0
1.7
2.5
1.5
3.9
1.3
1.5
3.7
0.6
3.7
3.4
0.7
3.6
2.7
1.1
0.5
0.6
0.7
0.9
0.3
0.8
1.1
0.5
0.8
6.4
3.7
1.4
12.1
5.6
2.7
2.6
2.4
2.5
2.0
0.9
5.1
3.5
5.2
4.9
7.6
9.5
4.2
1.7
3.1
5.8
1.4
1.9
4.5
1.7
6.3
3.4
1.9
1.5
2.3
1.4
3.4
1.2
1.4
3.2
0.5
3.2
3.0
0.7
3.0
2.5
1.0
0.5
0.5
0.7
0.8
0.3
0.7
1.1
0.4
0.8
5.3
3.0
1.2
10.0
5.0
2.4
2.3
2.2
2.4
1.8
0.8
25.8
20.9
33.2
18.7
19.4
35.8
22.4
6.1
14.1
43.6
15.4
4.5
19.9
18.3
24.1
18.8
17.1
11.8
13.3
6.0
18.3
11.3
16.6
6.6
10.9
11.2
9.3
19.9
13.7
Loss
Loss
Loss
Loss
5.5
1.2
Loss
7.6
7.0
-2.7
21.1
24.9
15.1
31.5
21.4
27.1
19.6
10.8
11.4
15.1
18.3
21.6
23.1
29.4
15.9
19.7
40.3
19.9
10.9
14.2
39.0
14.5
7.7
22.8
11.5
26.4
16.9
6.3
10.9
11.2
9.4
18.6
10.4
7.4
15.5
Loss
13.5
12.6
9.7
22.1
12.0
8.1
Loss
4.9
1.4
10.4
4.8
4.8
7.5
5.2
4.7
21.1
30.0
16.6
31.0
19.5
26.0
19.1
11.4
7.7
18.4
16.8
23.1
26.3
30.9
20.0
24.5
41.6
21.1
16.3
14.9
37.5
14.5
10.3
23.2
15.9
27.9
19.2
10.3
11.8
9.7
10.4
19.3
10.0
8.9
16.4
12.4
14.5
14.4
10.0
22.6
13.6
11.5
7.5
7.2
5.8
10.2
5.1
7.0
9.2
9.5
7.0
22.8
19.4
16.6
32.1
18.9
28.9
19.5
12.2
9.7
19.0
16.2
914
1,087
92
114
2,825 3,097
951
1,096
22,226 20,937
23,301 28,755
626
715
369
410
202
233
3,197 3,011
1,246 1,497
191
-
5,901 6,808
533
613
387
462
Neutral
Neutral
Buy
Buy
Buy
Buy
Neutral
Buy
Neutral
Buy
Buy
Neutral
Buy
472
119
169
77
1,285
271
62
1,239
64
773
392
21
1,389
535
134
240
105
1,510
332
68
1,430
68
940
450
21
1,575
13
13
42
36
18
23
10
15
6
22
15
-2
13
34.5
6.8
6.2
2.8
48.6
16.7
38.4
8.6
18.9
9.0
2.5
60.4
14.1
7.1
6.0
4.6
56.9
17.2
3.1
48.4
Loss
26.3
12.4
2.8
79.3
25.0
8.6
6.8
5.5
68.3
18.0
3.9
58.7
14.5
32.3
17.5
3.1
97.0
Buy
Neutral
Neutral
Neutral
Buy
Neutral
Buy
Buy
Buy
167
120
287
79
271
119
138
263
147
223
125
300
49
330
108
172
338
168
33
4
4
-37
22
-9
25
29
14
Loss
Loss
Loss
Loss
14.8
4.9
Loss
15.7
19.7
12.3
Loss
23.9
1.5
30.4
19.3
8.5
9.8
15.6
18.8
18.5
36.7
6.4
32.2
21.3
13.2
23.3
30.4
Buy
Buy
Buy
Neutral
Buy
Buy
Buy
Not Rated
Buy
Buy
Neutral
1,054
739
284
336
1,369
767
559
81
279
321
135
1,096
883
405
348
1,553
1,015
693
-
323
373
117
4
20
43
4
13
32
24
16
16
-13
23.9
23.8
25.0
6.7
30.6
55.7
32.9
3.5
11.9
20.3
23.8
31.8
45.2
30.7
7.9
34.3
69.5
37.6
3.8
8.4
27.5
24.0
41.3
43.2
35.6
9.8
36.9
86.2
44.7
4.3
11.1
32.0
25.5
31 January 2017
38

Click excel icon
for detailed
valuation guide
CMP
(INR)
661
147
2,020
977
Valuation snapshot
FY18E
19.6
19.5
15.3
15.4
17.9
14.5
19.0
3.9
73.3
6.0
23.1
20.1
23.6
18.6
16.7
12.0
14.6
12.6
19.0
Loss
12.5
15.4
16.4
12.2
7.1
10.9
9.8
10.3
13.3
7.6
13.7
10.5
18.6
6.8
16.0
24.3
14.5
12.8
32.3
38.8
60.1
27.9
33.6
22.7
24.7
78.4
28.1
17.2
33.1
39.2
42.7
10.5
Company
Reco
Repco Home
Buy
REC
Neutral
Shriram City Union Buy
STF
Buy
Aggregate
Capital Goods
ABB
Neutral
Bharat Elec.
Buy
BHEL
Sell
CG Cons. Elec.
Buy
Crompton Grv.
Sell
Cummins
Neutral
GE T&D
Neutral
Havells
Buy
Inox Wind
Neutral
K E C Intl
Buy
L&T
Buy
Pennar Eng.
Not Rated
Siemens
Neutral
Solar Ind
Neutral
Suzlon Energy
Not Rated
Thermax
Sell
Va Tech Wab.
Buy
Voltas
Neutral
Aggregate
Cement
Ambuja Cem.
Buy
ACC
Neutral
Birla Corp.
Buy
Dalmia Bharat
Buy
Grasim Inds.
Under Review
India Cem
Neutral
J K Cements
Buy
JK Lakshmi Ce
Buy
Ramco Cem
Buy
Orient Cem
Buy
Prism Cem
Buy
Shree Cem
Buy
Ultratech
Buy
Aggregate
Consumer
Asian Paints
Neutral
Britannia
Buy
Colgate
Buy
Dabur
Neutral
Emami
Buy
Godrej Cons.
Neutral
GSK Cons.
Neutral
HUL
Neutral
ITC
Buy
Jyothy Lab
Neutral
Marico
Buy
Nestle
Neutral
Page Inds
Buy
Parag Milk
Neutral
TP
% Upside
EPS (INR)
P/E (x)
P/B (x)
ROE (%)
(INR) Downside FY16 FY17E FY18E FY17E FY18E FY17E FY18E FY16 FY17E
842
27
24.0 25.7
37.7 25.7
17.5
3.8
3.2
17.0 15.7
134
-9
28.5 29.4
35.3
5.0
4.2
0.9
0.8
21.0 18.8
2,500
24
80.4 100.7 124.8 20.1
16.2
2.6
2.3
12.3 13.9
1,282
31
53.3 63.5
82.3 15.4
11.9
2.0
1.7
12.2 13.4
15.6 13.4
2.7
2.4
17.8 17.4
1,125
1,800
110
205
48
836
320
440
200
160
1,620
-
1,260
690
-
706
620
370
2
13
-20
11
-27
-2
1
5
7
7
12
7
-2
-11
25
10
15.8
56.9
Loss
1.9
2.1
27.2
3.0
7.8
20.7
7.4
44.7
8.8
16.9
18.4
Loss
23.5
16.3
11.7
18.2
61.9
3.9
4.6
0.6
26.0
5.6
8.9
17.5
10.1
53.1
10.5
17.0
19.3
Loss
24.8
25.2
11.8
26.9
73.3
5.5
5.5
1.9
30.2
10.7
12.0
20.0
12.1
63.7
12.4
25.3
22.9
0.6
27.6
32.6
14.0
60.5
25.6
35.0
40.7
117.8
32.7
56.0
47.1
10.7
14.8
27.2
14.7
69.2
36.7
Loss
31.9
19.7
28.5
31.8
40.9
21.6
25.1
34.0
35.4
28.1
29.6
35.2
9.3
12.4
22.7
12.5
46.5
30.9
30.9
28.7
15.3
24.0
25.2
33.1
29.1
16.7
36.7
10.9
13.8
20.2
30.5
21.2
40.6
26.7
26.9
28.5
23.0
42.4
38.3
34.3
33.0
33.2
36.7
29.0
39.7
26.9
39.5
35.8
42.4
46.3
27.6
6.9
4.7
1.0
30.8
0.9
6.8
6.3
9.2
1.9
2.2
2.8
2.1
6.4
6.4
Loss
3.7
2.5
4.2
3.3
1.7
3.1
1.7
4.0
1.6
1.2
2.9
3.3
4.3
2.9
4.6
7.4
4.4
3.5
14.7
16.8
21.3
10.0
12.2
9.1
7.7
30.5
8.1
7.1
12.9
17.9
25.1
3.1
5.9
4.1
1.0
20.9
0.9
6.2
5.7
8.3
1.6
1.9
2.6
1.8
5.9
5.5
Loss
3.4
2.2
3.7
3.1
1.6
3.2
1.6
3.6
1.4
1.1
2.6
3.2
3.7
2.7
4.0
5.9
3.9
2.9
12.8
13.3
20.0
8.5
10.3
7.7
6.7
31.7
7.1
6.5
11.0
15.5
19.7
2.7
11.1
15.6
Loss
52.1
3.0
24.9
5.9
19.0
27.9
13.5
9.9
14.2
11.8
20.2
Loss
12.5
9.7
15.3
7.6
8.3
7.2
5.9
5.5
9.2
3.9
6.3
0.3
19.5
6.2
0.7
12.2
11.0
9.3
34.7
55.9
68.9
33.3
43.4
23.4
30.8
82.4
29.3
9.1
36.9
40.9
46.0
19.5
11.4
19.7
2.9
94.3
4.2
22.0
-6.8
19.5
19.3
16.0
10.8
14.5
9.2
18.6
Loss
12.2
13.2
15.4
10.5
5.9
7.2
8.5
7.6
12.9
5.8
10.9
4.2
20.6
Loss
4.5
20.2
11.7
11.5
32.5
42.2
54.9
27.8
34.1
22.3
25.1
67.6
28.4
15.7
32.8
35.9
42.9
10.8
1,101
1,586
138
185
66
850
316
421
187
150
1,443
154
1,177
707
17
790
498
337
229
246
1,423 1,321
741
759
1,853 1,736
970
-
147
138
738
767
371
440
668
698
135
175
94
102
15,677 17,096
3,693 4,058
7
-7
2
-6
-6
4
19
4
29
9
9
10
5.5
5.7
6.9
40.5
32.0 32.6
48.9 43.7
20.4 33.8
44.5 21.9
21.5 34.2
50.4 54.2
48.3 76.1
88.7 12.7
4.4
7.3
10.7 20.0
14.5 26.4
36.5 27.9
0.4
4.7
12.2 78.7
23.4 29.4
31.5 22.7
3.0
Loss
3.3
Loss
0.1
0.9
3.5 105.0
201.1 394.3 582.0 39.8
79.3 93.5 129.6 39.5
30.4
18.7 20.2
22.9
70.1 70.6
82.1
22.7 21.7
25.8
7.1
7.2
8.5
25.2 24.7
30.6
33.2 36.8
43.8
167.1 157.7 178.8
19.0 19.3
21.5
7.7
8.4
9.5
4.1
7.6
9.0
5.6
6.0
7.2
119.9 111.5 139.2
208.6 247.4 312.7
6.7
7.0
9.7
48.0
44.5
40.8
39.1
41.0
43.6
32.9
44.3
30.6
46.9
43.4
52.9
58.5
37.9
971
1,035
3,144 3,380
884
1,115
280
300
1,014 1,240
1,604 1,655
5,193 5,465
854
865
256
295
355
365
259
300
5,900 6,410
14,465 17,100
267
285
7
8
26
7
22
3
5
1
15
3
16
9
18
7
31 January 2017
39

Click excel icon
for detailed
valuation guide
CMP
(INR)
677
6,968
115
802
2,241
Valuation snapshot
FY18E
25.6
29.4
9.1
16.9
24.0
29.7
24.7
21.8
27.2
14.1
27.2
13.9
26.5
16.1
3.8
19.1
22.7
40.8
14.1
23.4
19.4
23.9
22.5
29.9
26.1
16.9
48.6
10.3
12.8
19.4
17.8
13.5
46.3
27.1
2.1
-6.1
17.8
7.1
20.6
16.4
23.5
27.6
30.3
20.8
18.1
22.6
Loss
19.6
8.7
14.2
Company
Pidilite Ind.
P&G Hygiene
Radico Khaitan
United Brew
United Spirits
Aggregate
Healthcare
Alembic Phar
Alkem Lab
Aurobindo
Biocon
Cadila
Cipla
Divis Lab
Dr Reddy’s
Fortis Health
Glenmark
Granules
GSK Pharma
IPCA Labs
Lupin
Sanofi India
Sun Pharma
Syngene Intl
Torrent Pharma
Aggregate
Logistics
Allcargo Logistics
Blue Dart
Concor
Gateway
Distriparks
Gati
Transport Corp.
Aggregate
Media
Dish TV
D B Corp
Den Net.
Hathway Cab.
Hind. Media
HT Media
Jagran Prak.
PVR
Siti Net.
Sun TV
Zee Ent.
Aggregate
Metals
Hindalco
Hind. Zinc
JSPL
JSW Steel
Nalco
NMDC
Reco
Buy
Buy
Neutral
Buy
Buy
TP
% Upside
EPS (INR)
P/E (x)
P/B (x)
ROE (%)
(INR) Downside FY16 FY17E FY18E FY17E FY18E FY17E FY18E FY16 FY17E
700
3
14.8 16.4
18.4 41.4
36.9
10.5
8.6
29.9 27.6
8,340
20
129.9 138.5 168.9 50.3
41.3
13.0
11.3 30.8 27.7
120
4
6.9
5.3
7.1
21.9
16.3
1.6
1.4
10.3
7.3
1,065
33
11.1 12.3
16.4 65.0
49.0
8.9
7.7
14.8 14.5
2,885
29
16.7 28.6
47.0 78.3
47.7
14.8
11.4 19.8 20.8
39.7 34.2 11.6 10.1 31.9 29.2
630
1,800
1,050
750
450
525
975
3,000
240
990
160
3,150
540
1,825
5,200
925
-
1,750
12
8
51
-26
20
-10
39
-1
28
8
38
15
1
22
25
43
34
38.2 23.2
27.9
64.7 77.3
84.4
33.9 42.0
49.9
23.2 33.2
35.6
15.4 13.6
18.7
18.8 18.1
25.6
41.9 45.4
51.0
132.3 82.7 141.7
Loss Loss
3.5
24.9 41.4
49.7
5.5
7.1
10.0
44.2 50.4
61.8
10.5 17.0
29.4
50.4 61.6
77.0
103.2 142.2 172.8
19.6 27.8
37.9
11.1 13.0
16.1
59.7 57.7
78.4
24.1
21.5
16.6
30.7
27.6
32.1
15.5
36.5
Loss
22.1
16.4
54.1
31.5
24.3
29.3
23.2
43.0
22.6
25.2
16.7
42.9
33.2
25.4
13.0
9.4
28.3
44.6
17.4
Loss
Loss
10.2
10.0
16.9
61.7
Loss
21.0
40.6
30.8
10.3
13.9
Loss
Loss
20.9
13.3
20.1
19.7
14.0
28.7
20.1
22.7
13.8
21.3
53.1
18.4
11.6
44.2
18.2
19.4
24.1
17.0
34.7
16.6
19.1
13.7
33.8
26.2
15.6
6.9
7.6
21.5
26.3
15.4
47.4
-48.1
9.2
9.8
14.8
35.1
14.6
17.6
28.2
22.2
8.7
11.8
Loss
10.5
16.1
13.5
5.5
4.7
4.4
4.5
6.1
3.6
3.9
3.7
2.2
4.5
2.9
16.0
2.7
5.1
5.2
4.5
8.7
5.5
6.0
2.5
19.0
2.8
2.1
2.0
1.5
3.2
Loss
4.4
1.0
2.8
1.8
0.7
3.3
6.2
4.1
5.3
9.6
5.4
1.7
2.9
0.5
2.3
1.4
1.9
4.5
4.0
3.4
4.1
4.9
3.2
3.4
3.2
1.9
3.5
2.4
18.0
2.4
4.1
4.7
3.7
7.1
4.5
5.0
2.2
14.5
2.6
1.9
1.8
1.2
2.9
9.9
3.9
1.0
3.1
1.5
0.7
2.9
5.4
2.8
4.9
7.7
4.6
1.4
2.5
0.5
1.9
1.4
1.9
38.8
23.8
32.5
11.5
32.8
12.8
28.6
18.8
Loss
16.4
21.6
22.1
5.9
22.9
14.2
16.5
23.3
34.4
25.8
13.2
55.5
10.2
10.1
5.1
15.4
11.6
NM
22.6
Loss
Loss
21.9
7.7
24.7
18.7
0.1
23.4
27.0
18.2
11.6
20.7
Loss
Loss
5.4
15.9
24.8
23.9
29.9
14.7
23.9
11.2
26.7
10.6
Loss
20.4
20.5
29.6
9.0
22.8
17.8
20.3
22.2
26.4
23.9
13.3
50.5
8.6
8.3
12.4
16.7
11.3
43.2
27.0
Loss
Loss
19.3
7.7
20.7
10.4
Loss
25.3
31.3
17.5
17.3
22.5
Loss
14.9
7.1
12.8
Neutral
Neutral
Buy
Sell
Buy
Neutral
Neutral
Neutral
Buy
Neutral
Buy
Neutral
Neutral
Buy
Buy
Buy
Not Rated
Buy
561
1,660
696
1,019
376
581
701
3,017
188
915
116
2,728
536
1,497
4,162
645
560
1,305
Buy
Not Rated
Neutral
Buy
Not Rated
Not Rated
175
4,395
1,203
244
121
159
196
-
1,317
313
-
-
12
10
28
10.8
84.4
40.6
11.4
3.2
13.5
10.5
12.8
102.5 129.9
36.3
45.9
9.6
9.3
16.9
15.6
17.6
21.0
Buy
88
Buy
367
Neutral
88
Buy
38
Buy
269
Neutral
80
Buy
182
Buy
1,257
Buy
39
Under Review 533
Buy
496
115
450
75
47
355
85
215
1,429
45
-
600
31
23
-15
25
32
6
18
14
13
21
6.5
16.2
Loss
Loss
24.6
7.3
10.5
25.5
Loss
21.1
10.6
2.0
21.1
Loss
Loss
26.5
8.0
10.8
20.4
Loss
25.4
12.2
3.3
23.9
1.9
-0.8
29.4
8.2
12.2
35.8
2.7
30.3
17.6
Buy
Neutral
Neutral
Buy
Buy
Buy
192
300
82
196
77
146
234
282
88
195
73
162
22
-6
8
-1
-6
11
12.0
19.8
Loss
Loss
2.7
8.4
18.5
21.5
Loss
Loss
3.7
10.9
22.1
25.4
Loss
18.7
4.8
10.8
31 January 2017
40

Click excel icon
for detailed
valuation guide
CMP
(INR)
64
261
462
Valuation snapshot
FY18E
Loss
14.8
28.3
10.6
22.7
4.6
13.2
13.5
19.7
20.8
19.8
28.4
13.1
13.1
24.7
11.4
13.3
15.3
8.8
19.7
16.7
17.8
26.7
27.5
22.5
15.9
36.2
21.0
16.3
16.5
18.9
41.3
31.1
19.3
17.0
21.1
22.7
4.5
15.9
Loss
402.2
2.2
41.0
6.3
6.0
11.9
16.6
16.8
14.0
Company
SAIL
Vedanta
Tata Steel
Aggregate
Oil & Gas
BPCL
Cairn India
GAIL
Gujarat St. Pet.
HPCL
IOC
IGL
MRPL
Oil India
ONGC
PLNG
Reliance Ind.
Aggregate
Retail
Jubilant Food
Shopper's Stop
Titan Co.
Aggregate
Technology
Cyient
HCL Tech.
Hexaware
Infosys
KPIT Tech
L&T Infotech
Mindtree
Mphasis
NIIT Tech
Persistent Sys
Tata Elxsi
TCS
Tech Mah
Wipro
Zensar Tech
Aggregate
Telecom
Bharti Airtel
Bharti Infratel
Idea Cellular
Tata Comm
Aggregate
Utiltites
Coal India
CESC
JSW Energy
NTPC
Power Grid
Aggregate
Others
Arvind
Reco
Sell
Neutral
Sell
TP
% Upside
EPS (INR)
P/E (x)
P/B (x)
ROE (%)
(INR) Downside FY16 FY17E FY18E FY17E FY18E FY17E FY18E FY16 FY17E
28
-56
Loss Loss
Loss
Loss
Loss
0.8
0.9
Loss Loss
250
-4
10.8 21.4
27.3 12.2
9.5
1.4
1.3
7.9
13.0
321
-31
7.7
11.7
37.1 39.4
12.5
4.0
3.2
4.6
8.7
19.9 14.4
1.6
1.5
5.1
8.2
756
-
429
168
543
464
898
115
376
223
411
1,057
7
-11
6
3
23
-7
16
12
11
7
1
55.2
11.4
18.1
7.9
38.0
20.3
29.7
7.4
29.1
13.6
11.2
93.0
55.5
14.0
28.7
8.8
52.7
49.3
42.0
17.0
33.3
14.8
19.8
99.2
56.4
12.5
36.4
11.0
45.1
40.1
43.7
15.8
40.3
20.0
26.9
107.9
12.7
20.3
16.9
18.1
10.0
7.7
22.9
5.8
10.1
13.6
19.5
10.5
11.4
80.3
96.2
42.4
47.0
14.0
14.5
14.7
15.1
11.6
12.5
18.5
13.6
11.1
15.4
24.6
17.3
15.3
13.9
13.3
15.8
30.7
21.1
Loss
85.4
47.8
18.7
15.3
15.2
14.8
14.4
16.1
28.0
12.5
22.7
13.3
14.4
11.7
9.4
22.0
6.3
8.4
10.1
14.3
9.7
10.8
46.6
32.0
38.0
38.5
11.0
13.0
12.9
14.0
9.8
11.8
13.8
10.7
8.6
13.0
20.2
16.1
13.1
12.5
10.7
14.4
44.0
19.7
Loss
23.1
103.0
15.7
10.4
19.1
12.2
12.2
13.5
17.4
3.1
1.1
1.8
2.1
2.5
2.1
4.7
2.0
1.1
1.3
3.9
1.2
1.6
7.1
2.9
8.0
7.1
2.2
3.7
3.9
3.1
1.7
4.7
3.1
1.8
1.5
2.4
9.4
5.5
2.7
2.3
2.5
3.7
2.0
3.4
1.5
-92.0
2.3
6.5
1.7
1.2
1.5
2.2
2.5
2.6
2.6
1.0
1.7
1.9
2.2
1.8
4.0
1.6
1.1
1.3
3.3
1.1
1.4
7.1
2.7
7.0
6.4
1.9
3.2
3.3
2.8
1.4
3.9
2.7
1.7
1.3
2.3
7.5
4.6
2.3
2.0
2.1
3.3
1.9
3.0
1.9
30.9
2.3
6.4
1.5
1.1
1.4
1.9
2.3
2.3
31.6
4.0
7.7
11.7
22.4
13.6
18.4
22.1
10.6
9.5
14.0
12.0
11.4
13.4
6.3
21.3
16.8
16.5
21.5
28.9
24.7
21.0
45.3
27.4
12.3
19.0
19.5
46.3
37.1
23.4
20.3
24.0
24.4
7.4
12.7
12.6
-91.6
9.3
42.2
3.1
15.5
11.9
14.7
17.7
12.9
26.2
5.3
12.9
11.9
26.6
29.3
21.8
39.4
11.6
10.1
21.5
11.6
13.7
8.9
3.1
20.2
15.2
15.9
27.3
27.7
23.2
14.0
41.8
17.1
13.7
14.2
17.5
42.5
33.8
19.1
17.0
20.0
23.6
6.7
15.7
Loss
-75.4
4.9
34.5
4.7
7.7
10.6
16.1
15.3
10.4
Buy
Neutral
Neutral
Neutral
Buy
Buy
Neutral
Buy
Buy
Neutral
Buy
Neutral
703
283
484
159
528
377
961
99
337
202
386
1,044
Neutral
Neutral
Neutral
864
293
370
900
300
360
4
2
-3
15.0
5.8
8.0
10.8
3.0
8.7
18.5
9.2
9.8
Buy
Buy
Neutral
Buy
Neutral
Buy
Neutral
Neutral
Neutral
Neutral
Buy
Neutral
Buy
Neutral
Buy
468
840
200
948
135
677
466
576
424
601
1,459
2,334
472
465
910
600
980
230
1,250
150
800
530
560
470
730
1,780
2,550
550
540
1,200
28
17
15
32
11
18
14
-3
11
21
22
9
17
16
32
30.7 33.4
42.7
40.1 58.1
64.7
12.9 13.6
15.5
59.0 62.8
67.8
14.1 11.7
13.8
52.4 54.2
57.5
35.9 25.1
33.7
34.5 42.2
54.0
45.7 38.2
49.3
37.2 38.9
46.2
49.7 59.3
72.1
123.2 135.2 145.3
35.1 30.9
36.0
36.1 33.4
37.2
68.2 68.6
85.0
Buy
Buy
Sell
Buy
348
329
98
727
410
435
65
811
18
32
-34
12
11.9
11.8
8.6
1.6
11.3
15.6
Loss
8.5
7.9
16.7
Loss
31.4
Neutral
Buy
Buy
Buy
Buy
315
738
62
175
205
297
940
83
199
209
-6
27
34
14
2
22.6
27.8
7.6
12.3
11.5
16.8
48.4
4.1
11.9
14.2
20.0
70.7
3.3
14.3
16.8
Buy
379
430
13
14.0
13.5
21.8
31 January 2017
41

Click excel icon
for detailed
valuation guide
CMP
Reco
(INR)
Buy
482
Buy
413
Buy
199
Under Review 321
Buy
3,046
Buy
246
Neutral
932
Buy
186
Buy
863
Sell
220
Under Review
95
Buy
382
Buy
464
Buy
423
Buy
630
Buy
1,193
Buy
2,327
Buy
881
Buy
1,691
Buy
317
Sell
1,353
Neutral
5,952
Neutral
193
Buy
370
Valuation snapshot
ROE (%)
FY17E
11.3
118.4
18.2
18.5
15.1
37.8
105.1
37.8
12.0
3.8
8.6
15.1
17.1
33.1
8.6
11.4
28.8
31.7
16.2
13.5
56.8
16.6
26.1
9.5
FY18E
13.4
108.8
29.8
20.4
20.7
33.1
110.2
31.2
12.3
11.5
11.7
15.7
20.0
31.0
9.9
15.2
35.9
30.1
18.2
16.6
65.0
19.7
27.4
14.8
Company
Bata India
Castrol India
Century Ply.
Coromandel Intl
Dynamatic Tech
Eveready Inds.
Interglobe
Indo Count
Info Edge
Inox Leisure
Jain Irrigation
Just Dial
Kaveri Seed
Kitex Garm.
Manpasand
MCX
Monsanto
PI Inds.
SRF
S H Kelkar
Symphony
TTK Prestige
V-Guard
Wonderla
TP
% Upside
EPS (INR)
P/E (x)
P/B (x)
(INR) Downside FY16 FY17E FY18E FY17E FY18E FY17E FY18E FY16
483
0
11.2 10.9
14.2 44.3
33.9
4.8
4.3
13.1
499
21
9.6
12.8
13.4 32.1
30.8
35.4
31.9 76.0
211
6
7.5
4.6
8.8
43.6
22.7
7.6
6.1
36.3
-
11.8 16.3
20.0 19.7
16.1
3.5
3.1
14.9
3,388
11
19.4 67.6 112.9 45.0
27.0
6.2
5.1
4.7
287
17
9.2
12.4
13.9 19.9
17.7
6.6
5.3
16.2
1,015
9
55.2 58.3
72.5 16.0
12.9
15.5
13.0 176.5
223
20
13.4 15.7
18.5 11.9
10.0
3.7
2.7
48.9
1,050
22
13.0 18.4
20.7 46.8
41.6
5.3
4.9
9.2
207
-6
8.4
2.5
8.2
87.9
26.9
3.4
3.1
14.9
-
2.2
5.5
7.6
17.1
12.5
1.5
1.4
4.0
426
12
20.4 15.6
18.5 24.4
20.6
3.5
3.0
21.1
489
5
24.9 23.1
28.8 20.1
16.1
3.3
3.1
20.7
631
49
23.6 29.3
35.1 14.4
12.1
4.2
3.3
35.5
761
21
10.1 14.9
23.8 42.3
26.5
3.1
2.8
11.4
1,400
17
23.4 28.3
40.8 42.1
29.2
4.6
4.3
3.5
2,706
16
60.1 68.4
87.2 34.0
26.7
9.9
9.3
26.4
959
9
22.1 31.3
38.4 28.1
22.9
7.9
6.1
29.2
1,915
13
73.7 81.0 105.0 20.9
16.1
3.2
2.8
17.0
338
7
5.5
7.5
10.1 42.4
31.2
5.5
4.9
12.6
1,053
-22
15.6 27.0
35.1 50.1
38.5
27.2
23.2 35.0
4,896
-18
100.7 107.8 139.9 55.2
42.5
55.2
42.5 17.2
179
-7
3.7
4.5
5.8
42.8
33.5
10.2
8.3
26.3
392
6
10.6
7.0
11.9 52.9
30.9
4.8
4.3
15.8
31 January 2017
42

MOSL Universe stock performance
Company
Automobiles
Amara Raja
Ashok Ley.
Bajaj Auto
Bharat Forge
Bosch
Eicher Mot.
Endurance Tech.
Escorts
Exide Ind
Hero Moto
M&M
Mahindra CIE
Maruti Suzuki
Tata Motors
TVS Motor
Banks - Private
Axis Bank
DCB Bank
Equitas Hold.
Federal Bank
HDFC Bank
ICICI Bank
IDFC Bank
IndusInd
J&K Bank
Kotak Mah. Bk
RBL Bank
South Indian
Yes Bank
Banks - PSU
BOB
BOI
Canara
IDBI Bk
Indian Bk
OBC
PNB
SBI
Union Bk
NBFCs
Bajaj Fin.
Bharat Fin.
Dewan Hsg.
GRUH Fin.
HDFC
Indiabulls Hsg
LIC Hsg Fin
Manappuram
M&M Fin.
Muthoot Fin
PFC
Repco Home
REC
STF
Shriram City Union
1 Day (%)
1.2
-0.4
-1.0
0.7
-1.0
-0.7
3.1
-0.2
2.4
-0.6
-0.4
-1.5
-0.3
-2.2
-1.1
-0.1
-0.1
0.7
-1.3
-0.6
-0.4
-1.0
-1.1
0.9
-1.5
-1.7
-0.5
-0.7
-0.2
2.1
0.8
-0.6
2.0
-0.1
-0.1
-1.3
3.5
6.0
-0.5
0.0
-0.3
-0.1
1.8
0.4
0.8
-1.3
0.1
-2.6
0.0
-1.9
2.0
0.7
1M (%)
4.9
15.0
7.3
4.9
5.8
6.8
9.6
24.5
12.3
5.0
5.2
4.3
10.9
13.0
7.4
5.0
10.1
15.9
15.8
6.7
6.1
2.9
11.9
7.2
7.6
16.8
9.2
20.2
9.4
11.6
9.2
13.2
22.9
12.0
19.1
5.3
19.7
25.6
25.5
16.5
4.3
8.4
17.9
0.0
19.8
3.2
13.7
10.6
18.6
17.5
14.4
11.7
12M (%)
9.2
3.1
20.6
14.2
27.4
40.8
173.9
68.1
24.7
1.1
-18.3
44.0
58.2
32.9
15.7
51.5
67.8
22.5
17.7
17.7
33.7
-10.6
13.3
15.4
86.0
32.9
19.6
48.0
33.4
197.9
5.9
51.1
46.2
13.0
78.4
39.7
54.6
28.7
16.2
8.6
17.6
181.6
34.6
67.9
54.1
2.9
52.3
16.0
43.3
Company
Capital Goods
ABB
Bharat Elec.
BHEL
CG Cons. Elec.
Crompton Grv.
Cummins
GE T&D
Havells
Inox Wind
K E C Intl
L&T
Pennar Eng.
Siemens
Solar Ind
Suzlon Energy
Thermax
Va Tech Wab.
Voltas
Cement
Ambuja Cem.
ACC
Birla Corp.
Dalmia Bharat
Grasim Inds.
India Cem
J K Cements
JK Lakshmi Ce
Ramco Cem
Orient Cem
Prism Cem
Shree Cem
Ultratech
Consumer
Asian Paints
Britannia
Colgate
Dabur
Emami
Godrej Cons.
GSK Cons.
HUL
ITC
Jyothy Lab
Marico
Nestle
Page Inds
Parag Milk
Pidilite Ind.
P&G Hygiene
Radico Khaitan
United Brew
United Spirits
Healthcare
Alembic Phar
Alkem Lab
Aurobindo
1 Day (%)
-0.7
3.0
-0.7
-1.2
-1.9
0.7
0.2
-0.7
-1.2
-0.2
0.3
2.6
-0.7
-0.2
-0.1
-1.2
-0.3
-0.1
-1.5
-0.3
2.2
-1.4
4.5
1.2
0.4
0.7
1.3
-2.2
-1.9
-1.3
0.2
0.2
1.3
0.4
0.8
0.6
3.5
0.3
-0.3
-0.6
0.0
0.5
-0.4
0.0
0.9
-0.2
0.1
-1.7
-1.2
-1.3
-2.5
0.4
-2.4
1M (%)
6.0
15.4
14.1
27.5
11.0
4.1
5.5
22.8
2.6
6.9
7.0
2.9
5.8
5.3
25.7
5.9
6.1
2.6
11.2
7.1
17.7
36.6
12.6
25.7
2.7
6.5
22.3
10.4
21.1
6.5
13.8
9.0
9.1
-2.4
1.1
6.1
6.1
3.9
3.3
6.2
5.2
-0.5
-2.2
5.4
2.5
14.8
-1.5
3.3
2.6
15.5
-5.9
2.1
4.1
12M (%)
13.2
28.8
-0.5
11.3
-7.5
-29.4
42.1
-41.2
21.6
31.0
0.8
15.1
14.5
-14.4
-5.6
-15.7
17.6
17.7
14.7
88.4
153.3
43.1
56.3
48.4
23.3
72.6
-5.6
23.4
49.7
30.7
11.8
17.2
3.3
12.0
0.8
31.1
-11.0
4.5
20.1
24.4
16.6
7.5
19.7
19.6
25.3
1.2
4.1
-9.9
-9.3
22.5
-16.4
31 January 2017
43

Company
Biocon
Cadila
Cipla
Divis Lab
Dr Reddy’s
Fortis Health
Glenmark
Granules
GSK Pharma
IPCA Labs
Lupin
Sanofi India
Sun Pharma
Syngene Intl
Torrent Pharma
Logistics
Allcargo Logistics
Blue Dart
Concor
Gateway Distriparks
Gati
Transport Corp.
Media
Dish TV
D B Corp
Den Net.
Hathway Cab.
Hind. Media
HT Media
Jagran Prak.
PVR
Siti Net.
Sun TV
Zee Ent.
Metals
Hindalco
Hind. Zinc
JSPL
JSW Steel
Nalco
NMDC
SAIL
Vedanta
Tata Steel
Oil & Gas
BPCL
Cairn India
GAIL
Gujarat St. Pet.
HPCL
IOC
IGL
MRPL
Oil India
ONGC
PLNG
Reliance Ind.
1 Day (%)
0.1
3.6
0.1
-0.9
0.6
-1.5
1.8
0.9
-0.2
-0.3
0.3
-0.4
0.8
-0.7
0.6
0.5
-1.7
0.0
-1.5
0.0
-1.1
-0.5
1.7
0.3
1.1
1.0
1.1
0.8
-1.3
2.6
-0.8
0.1
0.4
-0.4
2.8
0.5
-1.4
-0.4
0.6
1.2
-1.6
-0.4
1.2
0.3
4.6
-1.4
-1.7
-0.1
-1.1
-0.6
-1.4
-1.8
1.9
1M (%)
7.1
5.4
2.2
-10.4
-1.4
4.0
3.0
7.5
-0.1
0.7
0.9
-3.1
2.4
-0.4
-0.8
-2.2
1.8
8.1
-0.6
6.8
6.4
3.8
2.4
30.7
9.2
0.4
10.8
1.1
9.0
3.5
8.1
9.8
23.5
17.3
18.2
20.8
19.1
18.1
30.0
20.5
18.1
10.8
17.0
10.4
14.0
19.7
15.9
5.1
1.3
-0.4
5.3
4.9
-3.3
12M (%)
107.7
23.3
-0.8
-38.5
-2.8
5.4
18.7
-0.3
-15.4
-19.9
-12.5
-1.9
-26.1
39.4
-6.5
-6.2
-29.9
1.5
-19.0
5.8
4.4
-3.6
14.6
4.8
-1.1
-3.4
3.4
12.0
66.8
8.5
40.6
18.0
171.5
86.6
27.1
85.5
124.2
80.3
49.4
263.6
84.7
57.2
131.9
31.8
14.3
94.2
88.2
71.5
52.1
27.2
33.8
57.2
0.9
Company
Retail
Jubilant Food
Shopper's Stop
Titan Co.
Technology
Cyient
HCL Tech.
Hexaware
Infosys
KPIT Tech
L&T Infotech
Mindtree
Mphasis
NIIT Tech
Persistent Sys
Tata Elxsi
TCS
Tech Mah
Wipro
Zensar Tech
Telecom
Bharti Airtel
Bharti Infratel
Idea Cellular
Tata Comm
Utiltites
Coal India
CESC
JSW Energy
NTPC
Power Grid
Others
Arvind
Bata India
Castrol India
Century Ply.
Coromandel Intl
Dynamatic Tech
Eveready Inds.
Interglobe
Indo Count
Info Edge
Inox Leisure
Jain Irrigation
Just Dial
Kaveri Seed
Kitex Garm.
Manpasand
MCX
Monsanto
PI Inds.
SRF
S H Kelkar
Symphony
TTK Prestige
V-Guard
Wonderla
1 Day (%)
-1.6
-0.2
-0.6
-0.1
-0.5
-0.6
0.7
-1.1
-1.0
-1.4
2.7
-1.2
-0.8
-0.9
-1.0
1.1
-0.3
0.2
7.5
-7.1
25.9
0.9
-0.6
0.4
-0.4
-1.0
0.2
2.4
0.1
3.0
1.9
-3.3
-3.4
1.7
0.8
-0.1
2.1
-3.5
-0.3
2.8
-1.1
0.9
-0.8
-0.6
1.1
0.8
-0.8
0.2
2.2
-0.4
-1.6
-1.3
1M (%)
1.1
1.6
13.7
-6.3
1.5
-3.4
-6.2
1.1
-0.3
-10.7
1.8
0.1
-2.2
4.0
-1.2
-3.5
-2.0
-4.6
13.9
-4.3
32.5
15.7
4.9
15.9
2.6
6.3
11.7
7.5
7.5
8.4
18.5
9.9
5.8
13.2
13.5
13.8
-4.0
-4.9
7.8
12.7
13.0
3.8
14.5
-5.8
3.4
5.8
9.7
2.4
17.4
3.9
19.0
8.9
12M (%)
-31.9
-26.1
1.8
7.3
-3.0
-12.8
-18.6
-4.6
-36.8
26.4
-23.1
-9.1
-29.8
-2.4
-6.0
-17.2
0.8
20.0
-8.9
-5.0
82.3
-1.7
63.0
-18.5
23.2
38.9
16.3
1.2
-2.0
33.1
90.1
54.4
-1.7
6.7
-14.9
8.8
1.4
48.6
-37.3
43.3
-3.8
30.8
39.3
5.1
35.7
45.0
22.9
22.9
33.3
117.1
-7.3
31 January 2017
44

THEMATIC/STRATEGY RESEARCH GALLERY

REPORT GALLERY
RECENT INITIATING COVERAGE REPORTS

DIFFERENTIATED PRODUCT GALLERY

Disclosures
This document has been prepared by Motilal Oswal Securities Limited (hereinafter referred to as Most) to provide information about the company (ies) and/sector(s), if any, covered in the report and may be distributed by it and/or its
affiliated company(ies). This report is for personal information of the selected recipient/s and does not construe to be any investment, legal or taxation advice to you. This research report does not constitute an offer, invitation or
inducement to invest in securities or other investments and Motilal Oswal Securities Limited (hereinafter referred as MOSt) is not soliciting any action based upon it. This report is not for public distribution and has been furnished to
you solely for your general information and should not be reproduced or redistributed to any other person in any form. This report does not constitute a personal recommendation or take into account the particular investment
objectives, financial situations, or needs of individual clients. Before acting on any advice or recommendation in this material, investors should consider whether it is suitable for their particular circumstances and, if necessary, seek
professional advice. The price and value of the investments referred to in this material and the income from them may go down as well as up, and investors may realize losses on any investments. Past performance is not a guide for
future performance, future returns are not guaranteed and a loss of original capital may occur.
MOSt and its affiliates are a full-service, integrated investment banking, investment management, brokerage and financing group. We and our affiliates have investment banking and other business relationships with a some
companies covered by our Research Department. Our research professionals may provide input into our investment banking and other business selection processes. Investors should assume that MOSt and/or its affiliates are
seeking or will seek investment banking or other business from the company or companies that are the subject of this material and that the research professionals who were involved in preparing this material may educate investors
on investments in such business . The research professionals responsible for the preparation of this document may interact with trading desk personnel, sales personnel and other parties for the purpose of gathering, applying and
interpreting information. Our research professionals are paid on twin parameters of performance & profitability of MOSt.
MOSt generally prohibits its analysts, persons reporting to analysts, and members of their households from maintaining a financial interest in the securities or derivatives of any companies that the analysts cover. Additionally, MOSt
generally prohibits its analysts and persons reporting to analysts from serving as an officer, director, or advisory board member of any companies that the analysts cover. Our salespeople, traders, and other professionals or affiliates
may provide oral or written market commentary or trading strategies to our clients that reflect opinions that are contrary to the opinions expressed herein, and our proprietary trading and investing businesses may make investment
decisions that are inconsistent with the recommendations expressed herein. In reviewing these materials, you should be aware that any or all of the foregoingamong other things, may give rise to real or potential conflicts of interest.
MOSt and its affiliated company(ies), their directors and employees and their relatives may; (a) from time to time, have a long or short position in, act as principal in, and buy or sell the securities or derivatives thereof of companies
mentioned herein. (b) be engaged in any other transaction involving such securities and earn brokerage or other compensation or act as a market maker in the financial instruments of the company(ies) discussed herein or act as an
advisor or lender/borrower to such company(ies) or may have any other potential conflict of interests with respect to any recommendation and other related information and opinions.; however the same shall have no bearing
whatsoever on the specific recommendations made by the analyst(s), as the recommendations made by the analyst(s) are completely independent of the views of the affiliates of MOSt even though there might exist an inherent
conflict of interest in some of the stocks mentioned in the research report Reports based on technical and derivative analysis center on studying charts company's price movement, outstanding positions and trading volume, as
opposed to focusing on a company's fundamentals and, as such, may not match with a report on a company's fundamental analysis. In addition MOST has different business segments / Divisions with independent research
separated by Chinese walls catering to different set of customers having various objectives, risk profiles, investment horizon, etc, and therefore may at times have different contrary views on stocks sectors and markets.
Unauthorized disclosure, use, dissemination or copying (either whole or partial) of this information, is prohibited. The person accessing this information specifically agrees to exempt MOSt or any of its affiliates or employees from,
any and all responsibility/liability arising from such misuse and agrees not to hold MOSt or any of its affiliates or employees responsible for any such misuse and further agrees to hold MOSt or any of its affiliates or employees free
and harmless from all losses, costs, damages, expenses that may be suffered by the person accessing this information due to any errors and delays. The information contained herein is based on publicly available data or other
sources believed to be reliable. Any statements contained in this report attributed to a third party represent MOSt’s interpretation of the data, information and/or opinions provided by that third party either publicly or through a
subscription service, and such use and interpretation have not been reviewed by the third party. This Report is not intended to be a complete statement or summary of the securities, markets or developments referred to in the
document. While we would endeavor to update the information herein on reasonable basis, MOSt and/or its affiliates are under no obligation to update the information. Also there may be regulatory, compliance, or other reasons that
may prevent MOSt and/or its affiliates from doing so. MOSt or any of its affiliates or employees shall not be in any way responsible and liable for any loss or damage that may arise to any person from any inadvertent error in the
information contained in this report. MOSt or any of its affiliates or employees do not provide, at any time, any express or implied warranty of any kind, regarding any matter pertaining to this report, including without limitation the
implied warranties of merchantability, fitness for a particular purpose, and non-infringement. The recipients of this report should rely on their own investigations.
This report is intended for distribution to institutional investors. Recipients who are not institutional investors should seek advice of their independent financial advisor prior to taking any investment decision based on this report or for
any necessary explanation of its contents.
Most and it’s associates may have managed or co-managed public offering of securities, may have received compensation for investment banking or merchant banking or brokerage services, may have received any compensation
for products or services other than investment banking or merchant banking or brokerage services from the subject company in the past 12 months.
Most and it’s associates have not received any compensation or other benefits from the subject company or third party in connection with the research report.
Subject Company may have been a client of Most or its associates during twelve months preceding the date of distribution of the research report
MOSt and/or its affiliates and/or employees may have interests/positions, financial or otherwise of over 1 % at the end of the month immediately preceding the date of publication of the research in the securities mentioned in this
report. To enhance transparency, MOSt has incorporated a Disclosure of Interest Statement in this document. This should, however, not be treated as endorsement of the views expressed in the report.
Motilal Oswal Securities Limited is registered as a Research Analyst under SEBI (Research Analyst) Regulations, 2014. SEBI Reg. No. INH000000412
Pending Regulatory inspections against Motilal Oswal Securities Limited:
SEBI pursuant to a complaint from client Shri C.R. Mohanraj alleging unauthorized trading, issued a letter dated 29th April 2014 to MOSL notifying appointment of an Adjudicating Officer as per SEBI regulations to hold inquiry and
adjudge violation of SEBI Regulations; MOSL replied to the Show Cause Notice whereby SEBI granted us an opportunity of Inspection of Documents. Since all the documents requested by us were not covered we have requested to
SEBI vide our letter dated June 23, 2015 to provide pending list of documents for inspection.
List of associate companies of Motilal Oswal Securities Limited -Click
here to access detailed report
Analyst Certification
The views expressed in this research report accurately reflect the personal views of the analyst(s) about the subject securities or issues, and no part of the compensation of the research analyst(s) was, is, or will be directly or
indirectly related to the specific recommendations and views expressed by research analyst(s) in this report. The research analysts, strategists, or research associates principally responsible for preparation of MOSt research receive
compensation based upon various factors, including quality of research, investor client feedback, stock picking, competitive factors and firm revenues
Disclosure of Interest Statement
Analyst ownership of the stock
Served as an officer, director or employee
Companies where there is interest
No
No
A graph of daily closing prices of securities is available at www.nseindia.com and http://economictimes.indiatimes.com/markets/stocks/stock-quotes
Regional Disclosures (outside India)
This report is not directed or intended for distribution to or use by any person or entity resident in a state, country or any jurisdiction, where such distribution, publication, availability or use would be contrary to law, regulation or which
would subject MOSt& its group companies to registration or licensing requirements within such jurisdictions.
For Hong Kong:
This report is distributed in Hong Kong by Motilal Oswal capital Markets (Hong Kong) Private Limited, a licensed corporation (CE AYY-301) licensed and regulated by the Hong Kong Securities and Futures
Commission (SFC) pursuant to the Securities and Futures Ordinance (Chapter 571 of the Laws of Hong Kong) “SFO”. As per SEBI (Research Analyst Regulations) 2014 Motilal Oswal Securities (SEBI Reg No. INH000000412) has
an agreement with Motilal Oswal capital Markets (Hong Kong) Private Limited for distribution of research report in Kong Kong. This report is intended for distribution only to “Professional Investors” as defined in Part I of Schedule 1 to
SFO. Any investment or investment activity to which this document relates is only available to professional investor and will be engaged only with professional investors.” Nothing here is an offer or solicitation of these securities,
products and services in any jurisdiction where their offer or sale is not qualified or exempt from registration. The Indian Analyst(s) who compile this report is/are not located in Hong Kong & are not conducting Research Analysis in
Hong Kong.
Motilal Oswal Securities Limited (MOSL) is not a registered broker - dealer under the U.S. Securities Exchange Act of 1934, as amended (the"1934 act") and under applicable state laws in the United States. In addition MOSL is not a
registered investment adviser under the U.S. Investment Advisers Act of 1940, as amended (the "Advisers Act" and together with the 1934 Act, the "Acts), and under applicable state laws in the United States. Accordingly, in the
absence of specific exemption under the Acts, any brokerage and investment services provided by MOSL, including the products and services described herein are not available to or intended for U.S. persons.
This report is intended for distribution only to "Major Institutional Investors" as defined by Rule 15a-6(b)(4) of the Exchange Act and interpretations thereof by SEC (henceforth referred to as "major institutional investors"). This
document must not be acted on or relied on by persons who are not major institutional investors. Any investment or investment activity to which this document relates is only available to major institutional investors and will be
engaged in only with major institutional investors. In reliance on the exemption from registration provided by Rule 15a-6 of the U.S. Securities Exchange Act of 1934, as amended (the "Exchange Act") and interpretations thereof by
the U.S. Securities and Exchange Commission ("SEC") in order to conduct business with Institutional Investors based in the U.S., MOSL has entered into a chaperoning agreement with a U.S. registered broker-dealer, Motilal Oswal
Securities International Private Limited. ("MOSIPL"). Any business interaction pursuant to this report will have to be executed within the provisions of this chaperoning agreement.
The Research Analysts contributing to the report may not be registered /qualified as research analyst with FINRA. Such research analyst may not be associated persons of the U.S. registered broker-dealer, MOSIPL, and therefore,
may not be subject to NASD rule 2711 and NYSE Rule 472 restrictions on communication with a subject company, public appearances and trading securities held by a research analyst account.
For Singapore
Motilal Oswal Capital Markets Singapore Pte Limited is acting as an exempt financial advisor under section 23(1)(f) of the Financial Advisers Act(FAA) read with regulation 17(1)(d) of the Financial Advisors Regulations and is a
subsidiary of Motilal Oswal Securities Limited in India. This research is distributed in Singapore by Motilal Oswal Capital Markets Singapore Pte Limited and it is only directed in Singapore to accredited investors, as defined in the
Financial Advisers Regulations and the Securities and Futures Act (Chapter 289), as amended from time to time.
In respect of any matter arising from or in connection with the research you could contact the following representatives of Motilal Oswal Capital Markets Singapore Pte Limited:
Varun Kumar
Varun.kumar@motilaloswal.com
Contact : (+65) 68189232
Office Address:21 (Suite 31),16 CollyerQuay,Singapore 04931
For U.S
13 December 2016
Motilal Oswal Tower, Level 9, Sayani Road, Prabhadevi, Mumbai 400 025
Phone: +91 22 3982 5500 E-mail: reports@motilaloswal.com
Motilal Oswal Securities Ltd
46