P&G Hygiene and
Healthcare
BSE SENSEX
28,335
Bloomberg
Equity Shares (m)
M.Cap.(INR b)/(USD b)
52-Week Range (INR)
1, 6, 12 Rel. Per (%)
Avg Val, (INR m)
Free float (%)
S&P CNX
8,768
PG IN
32.5
219.8 / 3.3
7280 / 5620
-5/1/12
41
29.4
2 February 2017
3QFY17 Results Update | Sector: Consumer
CMP: INR6,963
TP: INR8,250 (+18%)
Buy
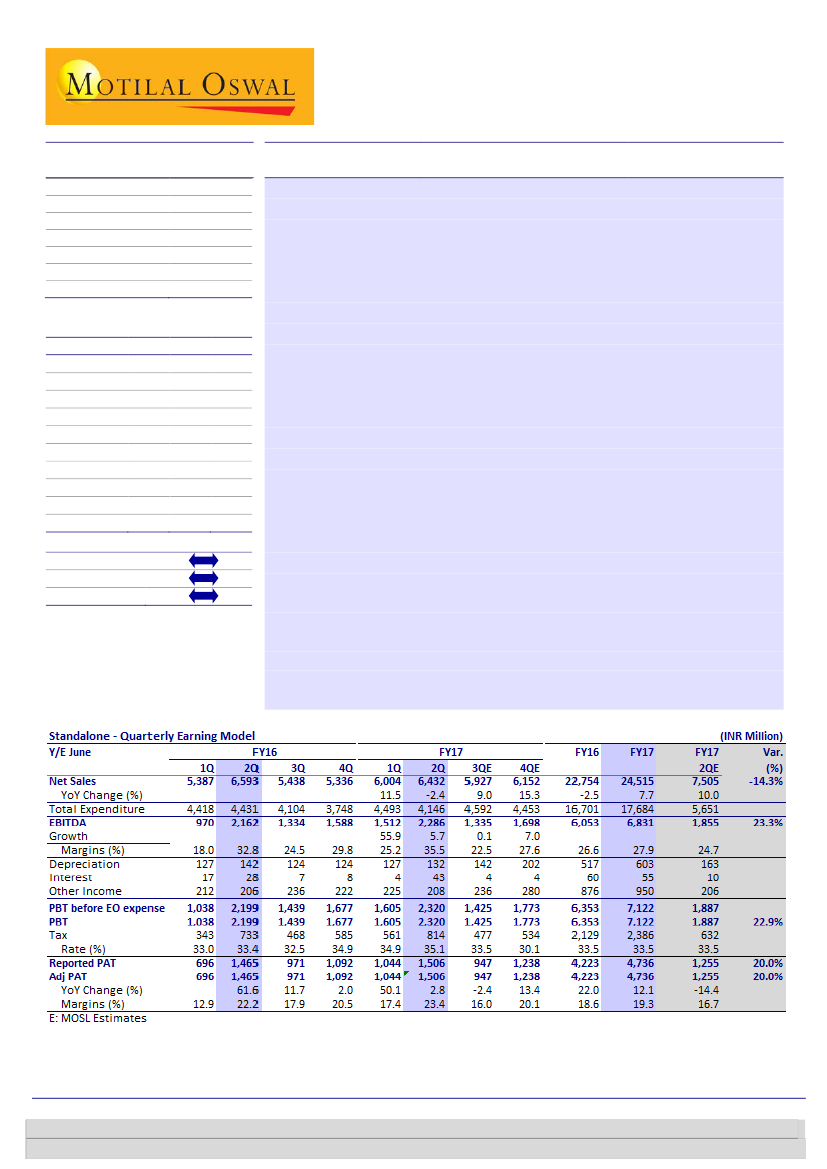
Sales disappoint, EBITDA and PAT well ahead of expectations
Sales declined 2.4% YoY (est. of +10%) to INR6.43b.
EBITDA margin at 35.5%,
however, was up 270bp YoY (est. of -700bp due to fears of a high base). EBITDA
increased by 5.7% YoY (est. of -14.3%) to INR2.29b and PAT by 2.8% YoY (est. of
-14.4%) to INR1.51b.
Demonetization affects sales:
Management stated that unforeseen liquidity
crunch impacted trade inventories and consumer offtake. While the company
did not give segmental details, we assume that Healthcare (29% of sales in
FY16) is likely to have been affected more post demonetization.
Gross margin expansion healthy:
Gross margin expanded 330bp YoY to 63.7%.
Staff costs were flat YoY at 4.3% of sales and advertisement costs declined
10bp YoY to 8.5% of sales. However, other expenses increased 70bp YoY to
15.4% of sales, partially offsetting gross margin gains.
Balance sheet highlights:
(1) Both inventory and debtors have increased over
June 2016 levels. Net working capital was marginally positive at end-December
2016 at INR228m, as against negative INR470m at end-June 2016. We expect
net working capital to normalize by end-June 2017. (2) Inter-group lending,
which has been reducing sharply over past two years, was flattish in December
2016 compared to June 2016.
Valuation and view:
PGHH’s has distinct advantages over FMCG peers, as (1) it
is in a much faster growing category and (2) it enjoys far superior barriers to
entry in its key Feminine Hygiene segment (69% of sales). Its ongoing
distribution expansion and unmatched category development efforts will only
enhance the entry barriers further. Consequently, longer-term earnings
prospects are far superior to FMCG peers. We maintain 45x target multiple on
December 2018 EPS, arriving at a target price of INR 8,250 (8,340 earlier).
Financials & Valuations (INR b)
Y/E June
2016 2017E 2018E
Net Sales
22.8
24.5
29.2
EBITDA
6.1
6.8
7.9
NP
4.2
4.7
5.4
EPS (INR)
129.9 145.7 167.7
EPS Gr. (%)
22.0
12.1
15.0
BV/Sh. (INR)
465.6 539.8 624.8
RoE (%)
30.8
29.0
28.8
RoCE (%)
31.3
29.4
29.1
P/E (x)
53.6
47.8
41.5
P/BV (x)
15.0
12.9
11.1
Estimate change
TP change
Rating change
Krishnan Sambamoorthy
(Krishnan.Sambamoorthy@MotilalOswal.com); +91 22 3982 5428
Vishal Punmiya
(Vishal.Punmiya@MotilalOswal.com); +91 22 3980 4261
Investors are advised to refer through important disclosures made at the last page of the Research Report.
Motilal Oswal research is available on www.motilaloswal.com/Institutional-Equities, Bloomberg, Thomson Reuters, Factset and S&P Capital.