13 February 2017
3QFY17 Results Update | Sector: Metals
NMDC
Buy
BSE SENSEX
28,352
Bloomberg
Equity Shares (m)
M.Cap.(INRb)/(USDb)
52-Week Range (INR)
1, 6, 12 Rel. Per (%)
Avg Val, INRm
Free float (%)
S&P CNX
8,805
NMDC IN
3,164
459.6 / 6.9
150 / 79
-3/44/61
406
25.1
CMP: INR145
TP: INR179(+23%)
Strong quarter used for cleaning balance sheet
Strong volumes and prices driving upgrades; Reiterate Buy
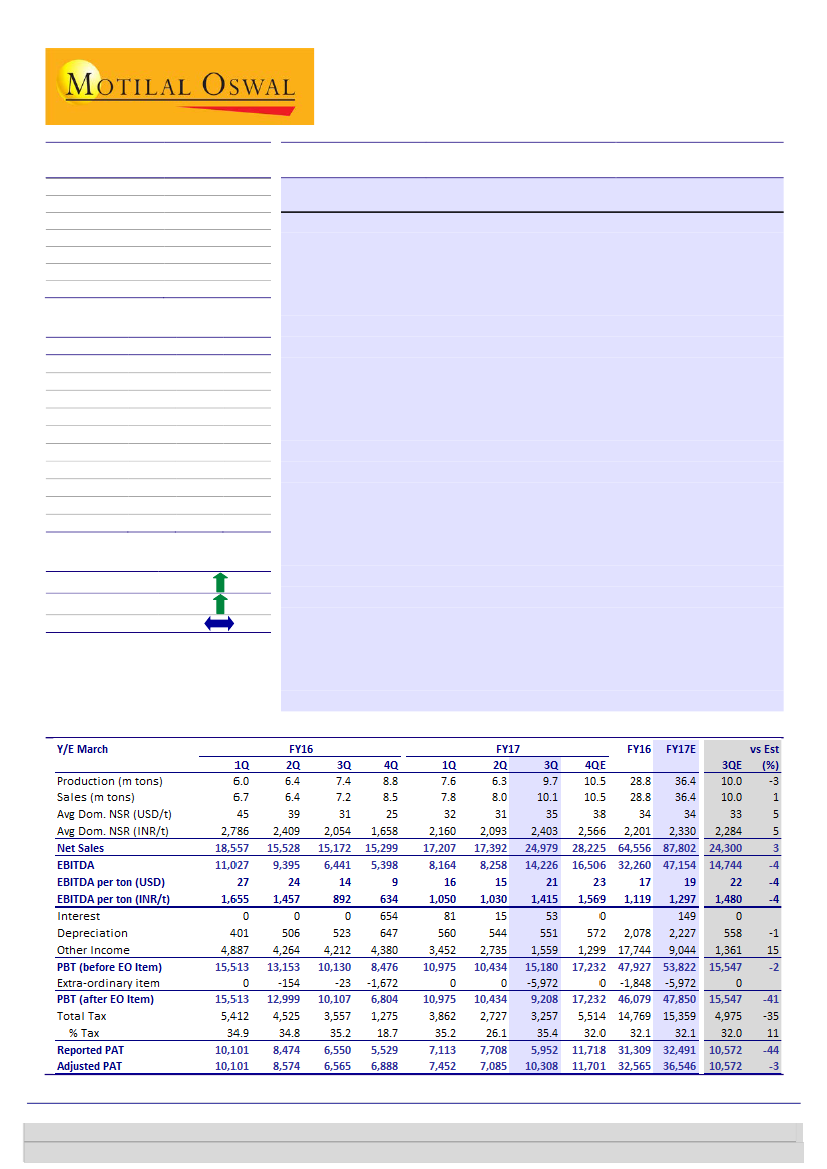
NMDC’s 3Q results marked a significant improvement in its performance as
EBITDA increased 72% QoQ/121% YoY to INR14.2b (in-line) led by higher
volumes and realization. The EBITDA is adjusted for a few non-cash one-offs
(Exhibit 1). Other income was down 43% QoQ to INR1.6b on lower cash balance
post large buy-back. PAT, adjusted for the one-offs and exceptional charge, was
up 45% QoQ/57% YoY to INR10.3b (in-line).
Sales were up 25% QoQ/39% YoY to 10.1mt, led by an increase in domestic
steel production (+8.5% YTD December). Exports share was 7.8% (vol. of
0.78mt).
Production was up 54% QoQ/32% YoY to 9.7mt.
Domestic iron ore realization was up 15% QoQ to INR2,403/t. EBITDA/t rose
INR384 to INR1,415.
Raising volumes, prices and target price; Reiterate Buy
NMDC’s dispatches continue to grow strongly, driven by an increase in
domestic steel production, particular at the key customers of NMDC.
Favorable pellet economics is also fueling domestic iron ore demand.
Volumes in January were up ~39% YoY and likely to exit the year with ~36mt.
Earnings growth will be fueled by recently announced price hikes of INR125-
300/t on supportive international iron ore prices and strong demand.
We raise volumes by ~2% and realization by ~3% for FY18E/19E. TP is revised
to INR179/share (from INR168/share) based on 6.5x FY18E EV/EBITDA.
The stock trades cheap at 4.7x FY18E EV/EBITDA adjusted for the CWIP for
EBITDA CAGR of ~33% over FY16-18E.
Reiterate Buy.
Financials & Valuations (INR b)
2016 2017E
Y/E Mar
64.6
87.8
Net Sales
32.3
47.2
EBITDA
33.2
38.6
PAT
8.4
12.2
EPS (INR)
-49.7
45.9
Gr. (%)
75.9
76.1
BV/Sh (INR)
15.9
13.5
RoE (%)
15.6
12.5
RoCE (%)
17.3
11.9
P/E (x)
1.9
1.9
P/BV (x)
2018E
99.1
57.5
38.9
12.3
0.8
81.2
15.6
14.6
11.8
1.8
Estimate change
TP change
Rating change
Quarterly Performance – INR million
Investors are advised to refer through important disclosures made at the last page of the Research Report.
Motilal Oswal research is available on www.motilaloswal.com/Institutional-Equities, Bloomberg, Thomson Reuters, Factset and S&P Capital.
Sanjay Jain
(SanjayJain@MotilalOswal.com); +91 22 6129 1523
Dhruv Muchhal
(Dhruv.Muchhal@MotilalOswal.com); +91 22 6129 1549