Container Corporation
BSE SENSEX
28,334
Bloomberg
Equity Shares (m)
M.Cap.(INRb)/(USDb)
52-Week Range (INR)
1, 6, 12 Rel. Per (%)
Avg Val, INRm
Free float (%)
S&P CNX
8,794
CCRI IN
In-line performance amid weak macro; market share gain is encouraging
195
n
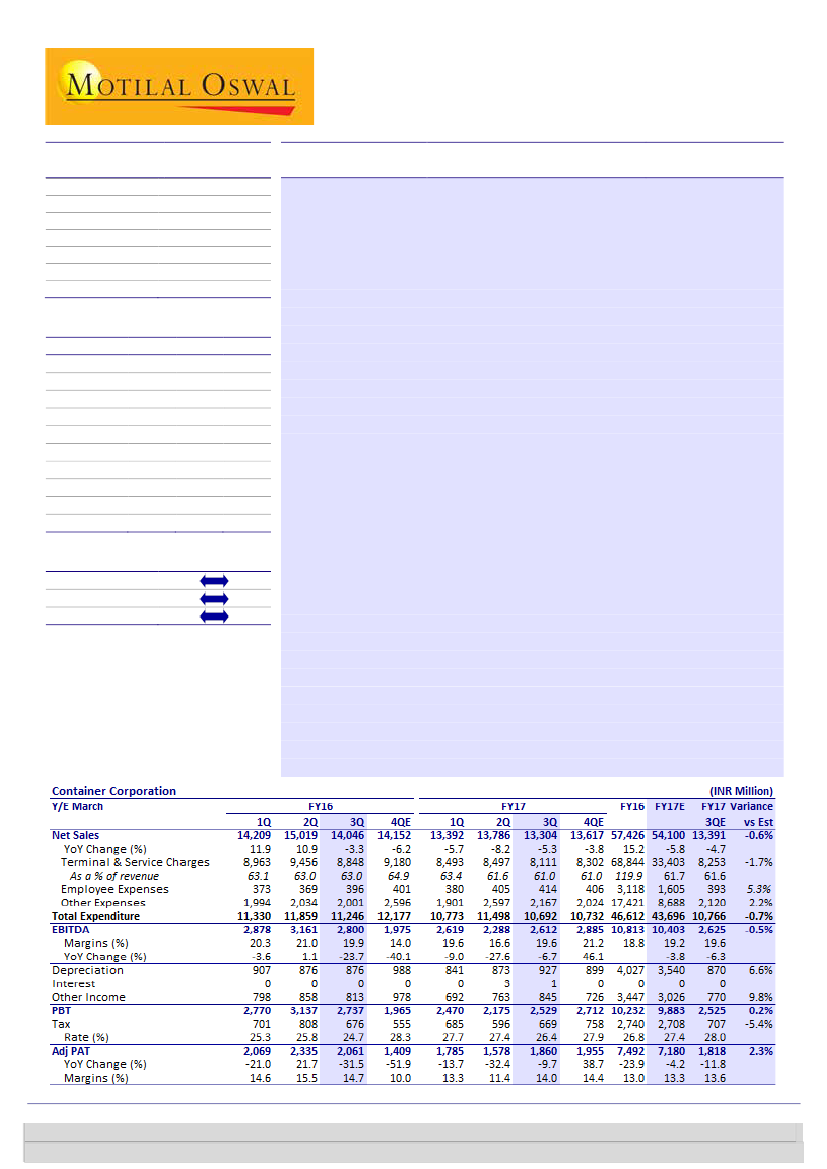
Sequential improvement in operating performance:
3QFY17 EBITDA
258.6 / 3.9
increased 14% QoQ (-7% YoY) to INR2.62b (in-line), led by absence of
1544 / 1055
revision of land license fees pertaining to the previous period. However,
2/-11/-5
margin weakness over last 3-4 quarters was due to lower leads and higher
288
discounting. PAT of INR1.86b was marginally higher than estimate of
43.3
14 February 2017
3QFY17 Results Update | Sector: Logistics
CMP: INR1,278
TP: INR1,309(+2%)
Neutral
Financials & Valuations (INR b)
Y/E Mar
2016 2017E
Net Sales
63.1
59.5
EBITDA
11.6
10.4
PAT
7.8
7.0
EPS (INR)
40.1
36.0
Gr. (%)
-25.8
-10.3
BV/Sh (INR)
409.5
430.9
RoE (%)
10.1
8.6
RoCE (%)
9.7
8.3
P/E (x)
31.8
35.5
P/BV (x)
3.1
3.0
2018E
64.6
12.9
8.9
45.8
27.1
458.1
10.3
9.9
27.9
2.8
Estimate change
TP change
Rating change
INR1.82b due to higher other income and a lower tax rate.
n
Originating volumes grow modestly:
Originating volumes rose 7% YoY, led
by a pick-up in export volumes, as also exhibited by a 13% YoY rise in export
handling volumes for 3QFY17. Total handling volume grew 10% YoY to 783k
TEUs (EXIM at 666k TEUs: +11%YoY; domestic at 116k TEUs: +6% YoY).
n
Realizations continue to slide:
3QFY17 revenue declined 5% YoY (-3% QoQ)
to INR13.3b due to lower realizations, partially offset by higher volumes.
Realizations have been structurally trending lower due to a reduction in lead
distance by ~11% YoY in EXIM movement in 3QFY17. Hence, realizations in
EXIM (per teu) stood at INR15,883 (-16% YoY, -5% QoQ) and in domestic at
INR23,277 (-5% YoY, -2% QoQ).
n
EXIM EBIT (per teu) was INR2,718 (-22% YoY, +4% QoQ), while domestic EBIT
came in at INR27m due to higher empty running expenses. EXIM EBIT
retention/TEU appears to be lower due to higher trans-shipment volumes
and increased discounting. Management expects margin to improve due to
increased proportion of double stacking at Khatuwas terminal.
Valuation and view
n
While CONCOR’s volume recovery has been delayed, its growth story remains
intact. Completion of the dedicated freight corridor (DFC) expected in 2HFY19
will be a significant efficiency/profitability driver for CONCOR. However, long-
gestation MMLP projects are likely to impact the company’s near-term ratios
(RoEs at sub ~10% in FY17/18). A hike in freight rates by railways poses a near-
to medium-term risk.
n
On DFC-based valuation (WACC: 12.3%, TGR: 4.5%), we arrive at a fair value
of INR1,309. The stock trades at 25.5x FY19E EPS of INR50. With near-term
volume concerns, rich valuations and limited upside to our fair value, we
maintain
Neutral.
Investors are advised to refer through important disclosures made at the last page of the Research Report.
Motilal Oswal research is available on www.motilaloswal.com/Institutional-Equities, Bloomberg, Thomson Reuters, Factset and S&P Capital.
Abhishek Ghosh
(Abhishek.Ghosh@motilaloswal.com); +91 22 3982 5436
Abhinil Dahiwale
(Abhinil.Dahiwale@motilaloswal.com); +91 22 3980 4309

Container Corporation
Exhibit 1: Container Corp – 3QFY17 Financial Summary (INRm)
Net Sales
Terminal & Service CIarges
Employee Expenses
OtIer Expenses
EBITDA
EBITDA margin (%)
Depreciation
EBIT
Interest
OtIer Income
PBT
Total Tax
Tax rate (%)
PAT
EPS (INR)
3QFY15 4QFY15 1QFY16 2QFY16 3QFY16 4QFY16 1QFY17 2QFY17 3QFY17 YoY (%) QoQ (%)
14,518 15,090 14,209 15,019 14,046 14,152 13,392 13,786 13,304
-5.3%
-3.5%
8,277
8,934
8,963
9,456
8,848
9,180
8,493
8,497
8,111
-8.3%
-4.5%
410
373
373
369
396
401
380
405
414
4.4%
2.3%
2,163
2,482
1,994
2,034
2,001
2,596
1,901
2,597
2,167
8.3% -16.5%
3,668
3,300
2,878
3,161
2,800
1,975
2,619
2,288
2,612
-6.7%
14.2%
25%
22%
20%
20%
20%
14%
20%
17%
20%
-1.5%
18.3%
937
2,731
0
852
3,583
573
16%
3,010
15.4
810
2,489
0
991
3,480
552
16%
2,927
15.0
907
1,971
0
798
2,770
701
25%
2,069
10.6
876
2,285
0
858
3,143
808
25%
2,329
11.9
876
1,924
0
813
2,737
676
25%
2,061
10.6
988
987
0
978
1,965
555
28%
1,409
7.2
841
1,778
0
692
2,470
685
28%
1,785
9.2
873
1,415
3
763
2,175
596
27%
1,578
8.1
927
1,685
1
845
2,529
669
26%
1,860
9.5
5.8%
-12.4%
4.0%
-7.6%
-1.1%
-9.7%
-9.7%
6.2%
19.1%
10.8%
16.3%
12.2%
17.8%
17.8%
Source: MOSL, Company
Exhibit 2: Container Corp – 3QFY17 Segmental Revenue and Profitability
3QFY15 4QFY15 1QFY16 2QFY16 3QFY16 4QFY16 1QFY17 2QFY17 3QFY17 YoY (%) QoQ (%)
Revenue (INRm)
EXIM
Domestic
Total Segment Revenue
Segmental EBIT
EXIM
Domestic
Total
EBIT Margin (%)
EXIM
Domestic
Total
11,886
2,632
14,518
2,924
139
3,064
24.6%
5.3%
21.1%
11,853
3,121
14,973
2,387
232
2,619
20.1%
7.4%
17.5%
11,570
2,639
14,209
2,139
42
2,181
18.5%
1.6%
15.3%
12,366
2,653
15,019
2,374
51
2,425
18.5%
2.0%
15.3%
11,329
2,717
14,046
2,097
53
2,151
18.5%
2.0%
15.3%
11,107
3,046
14,152
1,482
54
1,536
13.3%
1.8%
10.9%
10,911
2,481
13,392
2,037
39
2,076
18.7%
1.6%
15.5%
11,298
2,488
13,786
1,769
70
1,839
15.7%
2.8%
13.3%
10,581
2,723
13,304
1,811
3
1,814
17.1%
0.1%
13.6%
Source: MOSL, Company
-6.6%
0.2%
-5.3%
-13.7%
-94.0%
-15.7%
-6.3%
9.4%
-3.5%
2.4%
-95.4%
-1.3%
Exhibit 3: Container Corp – Realization Snapshot
3QFY15 4QFY15 1QFY16 2QFY16 3QFY16 4QFY16 1QFY17 2QFY17 3QFY17 YoY (%) QoQ (%)
Volumes (TEU)
EXIM
Domestic
Total
Realizations (INR / TEU)
EXIM
Domestic
Total
EBIT (INR/TEU)
EXIM
Domestic
Total
665,130 647,425 614,353 648,466 599,506 613,543 631,918 678,306 666,175
115,313 118,045 107,742 104,278 110,816 125,342 103,142 104,757 116,993
780,443 765,470 722,095 752,744 710,322 738,885 735,060 783,063 783,168
17,870
22,823
18,602
4,397
1,207
3,925
18,307
26,437
19,561
3,686
1,967
3,421
18,833
24,490
19,677
3,481
392
3,020
19,070
25,445
19,953
3,660
489
3,221
18,897
24,515
19,774
3,498
481
3,028
18,102
24,299
19,154
2,416
429
2,079
17,266
24,058
18,219
3,223
381
2,824
16,656
23,754
17,605
2,608
665
2,348
15,883
23,277
16,988
2,718
27
2,316
11.1%
5.6%
10.3%
-16.0%
-5.0%
-14.1%
-22.3%
-94.3%
-23.5%
-1.8%
11.7%
0.0%
-4.6%
-2.0%
-3.5%
4.2%
-95.9%
-1.4%
Source: MOSL, Company
14 February 2017
2

Container Corporation
Exhibit 4: Container Corp – Quarterly domestic and EXIM volume trend (‘000 TEU)
Total Segment Revenue
14,518 14,973 14,209
12,966 12,697 13,548
12,314 11,946 12,540 12,392
2,632 3,121 2,639
10,711 10,370 10,549 10,827
9,946 10,462
2,663
2,641 2,530 2,570 2,766 3,320 2,909
1,949 2,278 1,786 2,018 2,216
1,946
7,999
2Q
8,513
3Q
8,433
4Q
8,583
1Q
8,531
2Q
FY13
8,611
3Q
9,673
9,416
9,970
9,626
9,646
11,886 11,853 11,570
9,788 10,885
EXIM
Domestic
4Q
1Q
2Q
FY14
3Q
4Q
1Q
2Q
FY15
3Q
4Q
1Q
FY16
Source: MOSL, Company
Exhibit 5: Container Corp – Quarterly domestic and EXIM volume YoY growth (‘000 TEU)
Volume growth (YoY %)
30
15
0
-15
-30
1Q
2Q
3Q
4Q
1Q
2Q
3Q
4Q
1Q
2Q
3Q
4Q
1Q
2Q
3Q
4Q
1Q
2Q
3Q
4Q
1Q
2Q
FY17
Source: MOSL, Company
3Q
FY12
FY13
FY14
FY15
FY16
EXIM
Domestic
Total
Exhibit 6: Container Corp – Quarterly domestic and EXIM per TEU realization trend (INR/TEU)
Realization (INR/TEU)
28,000
24,000
20,000
16,000
12,000
1Q 2Q
3Q
4Q
1Q 2Q
3Q
4Q
1Q 2Q
3Q
4Q
1Q 2Q
3Q
4Q
1Q
2Q
3Q
4Q
1Q
2Q
FY17
Source: MOSL, Company
3Q
FY12
FY13
FY14
FY15
FY16
EXIM
Domestic
Total
Exhibit 7: Container Corp – Quarterly domestic and EXIM EBIT trend (INRm)
EBIT (INR/TEU)
EXIM
Total
Domestic - RHS
3,600
2,400
1,200
0
1Q 2Q
3Q 4Q 1Q 2Q
3Q 4Q 1Q 2Q
3Q 4Q 1Q 2Q
3Q 4Q 1Q 2Q 3Q 4Q 1Q 2Q 3Q
FY16
FY17
FY12
FY13
FY14
FY15
450
300
150
0
Source: MOSL, Company
14 February 2017
3

Container Corporation
Key takeaways from concall
On 3QFY17 results
n
Handling volumes up 10% YoY:
Physical handling volumes increased 10%YoY
primarily led by higher transhipment volumes particularly in Kathuwas terminal.
Originating volumes also increased 7% YoY at 783k TEU’s led by some pick up in
export volumes.
n
Realization impacted by lower leads and discounting:
EXIM Realizations
declined primarily due to reduction in lead distances to 799kms (-13%YoY) in
3QFY17 as ICD traffic from JNPT is shifting to Mundra. Additionally higher share
of volume from east coast port which are typically lower lead distances are also
impactin realisation.
n
Margins continue to remain subdued:
EXIM margins continue to be impacted
due to increased competitve intensity resulting in higher discounts as also lower
lead distance. However empty running charges in EXIM segment declined 20%
YoY due to higher proportion of doubel stacking volumes in Khatuwas.
n
Margins in domestc segment were severly impacted due to higher empty
running charges at INR460mn (+67% YoY).
n
Market share increasedin excess of 75%:
Concor has increased its market share
to 75.5% vs ~74% and intends to increase it upto 78% in the medium term.
n
Multimodal Logistics Park:
Concor has started operations for 5 terminals in
9MFY17 which include Pantnagar, Jharsuguda, Indore and intends to start 1 new
terminal in 4QFY17 .
n
Katuwas terminal:
The terminal is currently handling about 4 trains per day (2
Export and 2 Import train) and is capable of ramping upto 8 trains a day with the
current infrastructure. This has resulted in sharp increase in double stacking trains
handled by Concor. Management intens to handle volumes of ~2.5 to 3 lakh TEU’s
from Kathuwas in the medium term from present rate of ~1.6 lakh TEU’s.
Valuation and view
n
n
n
n
n
CCRI is a direct play on the upcoming large rail infrastructure (DFCs), revival in
economic growth and higher containerization. Key factors to watch out are (a)
EXIM growth trend, (b) expansion of port capacities (JNPT in the near term) and
(c) completion of DFCs.
Key risks include (a) lower-than-expected GDP growth, (b) sharp increase in
haulage rates, (c) delay in DFCs completion and (d) any increase in export-
import imbalance.
While CONCOR’s growth story (driven by DFCs commissioning) remains buoyant,
we are concerned by near-term volume growth potential.
While CONCOR’s volume recovery has been delayed, its growth story remains
intact. Completion of Dedicated Freight Corridor (DFC) expected in 2HFY2019
will be a significant efficiency/profitability driver for CONCOR. However, long-
gestation MMLP projects are likely to impact the company’s near-term ratios
(RoEs at ~11% in FY17/18). A hike in freight rates by railways poses a near-term
to medium term risk.
On DFC-based valuation (WACC: 12.3%, TGR: 4.5%), we arrive at a fair value of
INR1,309/share. The stock trades at 25.5x FY19E EPS of INR50. With near-term
volume growth concerns, rich valuations and limited upside to our fair value.
Maintain Neutral.
4
14 February 2017

Container Corporation
Exhibit 8: Concor – Key Assumptions
Y/E March
Volumes - TEU
EXIM
Domestic
Total
Revenue (INR m)
EXIM
Domestic
Un-allocable
Total
Realization (INR/TEU)
EXIM
Domestic
Total
FY08
1,977
470
2,448
26,467
7,006
171
33,645
13,385
14,895
13,745
FY12
2,136
468
2,604
5%
32,666
7,954
389
41,009
15,293
16,983
15,746
FY13
2,152
434
2,586
8%
35,398
8,662
390
44,450
16,449
19,975
17,191
FY14
2,361
507
2,869
20%
38,900
11,332
853
51,085
16,473
22,344
17,808
FY15
2,621
489
3,111
16%
44,412
11,325
55,737
16,942
23,141
17,917
FY16
2,476
448
2,924
3%
46,372
11,054
57,426
18,729
24,665
19,639
FY17E
2,639
458
3,097
-6%
43,314
10,786
54,100
16,413
23,562
17,470
FY18E
2,903
504
3,406
9%
49,075
12,339
61,413
16,905
24,504
18,029
FY19E
3,135
554
3,689
12%
55,121
13,844
68,965
17,581
24,995
18,694
Source: Company, MOSL
14 February 2017
5

Container Corporation
Financials and Valuations
Consolidated - Income Statement
Y/E March
Total Income from Operations
Change (%)
Total Expenditure
% of Sales
EBITDA
Margin (%)
Depreciation
EBIT
Int. and Finance Charges
Other Income
PBT
Tax
Tax Rate (%)
Less: Minority Interest
Reported PAT
Adjusted PAT
Change (%)
Margin (%)
FY12
41,009
5.2
30,776
75.0
10,232
25.0
1,621
8,611
54
3,135
11,692
3,036
26.0
0
8,657
8,657
-1.2
21.1
FY13
44,450
8.4
33,953
76.4
10,497
23.6
1,763
8,734
32
3,326
12,027
2,721
22.6
0
9,306
9,306
7.5
20.9
FY14
53,167
19.6
41,644
78.3
11,523
21.7
2,357
9,167
220
3,583
12,529
3,072
24.5
15
9,443
9,443
1.5
17.8
FY15
61,493
15.7
47,474
77.2
14,019
22.8
4,108
9,911
183
3,470
13,198
2,638
20.0
14
10,546
10,546
11.7
17.1
FY16
63,063
2.6
51,500
81.7
11,562
18.3
4,027
7,535
166
3,358
10,732
2,898
27.0
6
7,828
7,824
-25.8
12.4
FY17E
59,450
-5.7
49,047
82.5
10,403
17.5
3,540
6,864
150
3,026
9,740
2,708
27.8
14
7,018
7,018
-10.3
11.8
(INR Million)
FY18E
64,646
8.7
51,701
80.0
12,945
20.0
3,870
9,074
152
2,991
11,914
2,979
25.0
14
8,922
8,922
27.1
13.8
FY19E
72,594
12.3
58,318
80.3
14,276
19.7
4,214
10,062
153
3,113
13,022
3,256
25.0
14
9,753
9,753
9.3
13.4
Consolidated - Balance Sheet
Y/E March
Equity Share Capital
Total Reserves
Net Worth
Minority Interest
Deferred Liabilities
Total Loans
Capital Employed
Gross Block
Less: Accum. Deprn.
Net Fixed Assets
Capital WIP
Total Investments
Curr. Assets, Loans&Adv.
Inventory
Account Receivables
Cash and Bank Balance
Loans and Advances
Curr. Liability & Prov.
Account Payables
Other Current Liabilities
Provisions
Net Current Assets
Deferred Tax assets
Appl. of Funds
E: MOSL Estimates
FY12
1,300
54,252
55,552
0
2,616
581
58,749
35,856
11,268
24,588
1,041
2,447
37,009
367
303
27,576
8,764
6,515
1,222
3,513
1,780
30,494
178
58,749
FY13
1,300
60,905
62,205
0
2,964
385
65,553
40,780
12,946
27,834
1,884
3,690
38,930
554
285
29,460
8,632
7,006
1,683
3,325
1,997
31,925
221
65,553
FY14
1,950
66,628
68,578
275
3,262
1,480
73,595
51,254
17,560
33,694
2,402
4,836
41,751
182
621
27,742
13,206
9,284
1,919
5,632
1,733
32,467
196
73,595
FY15
1,950
73,220
75,169
911
2,310
1,650
80,040
59,595
22,835
36,760
3,946
4,882
44,363
503
647
29,492
13,722
10,147
2,169
6,117
1,861
34,217
235
80,040
FY16
1,950
77,881
79,831
911
2,310
1,211
84,263
65,547
26,862
38,685
8,494
6,853
43,437
230
821
27,979
14,408
13,452
2,601
7,441
3,410
29,985
235
84,253
FY17E
1,950
82,060
84,010
911
2,310
1,211
88,442
71,920
30,402
41,518
12,621
6,853
39,971
202
570
24,648
14,552
12,767
2,620
7,015
3,131
27,204
235
88,432
(INR Million)
FY18E
1,950
87,373
89,323
911
2,310
1,211
93,755
78,389
34,272
44,117
16,152
6,853
40,738
212
620
25,208
14,697
14,350
2,762
7,628
3,960
26,388
235
93,745
FY19E
1,950
93,181
95,131
911
2,310
1,211
99,563
85,258
38,486
46,772
19,283
6,853
42,457
240
696
26,677
14,844
16,048
3,116
8,566
4,366
26,410
235
99,553
14 February 2017
6

Container Corporation
Financials and Valuations
Ratios
Y/E March
Basic (INR)
EPS
Cash EPS
BV/Share
DPS
Payout (%)
Valuation (x)
P/E
Cash P/E
P/BV
EV/Sales
EV/EBITDA
Dividend Yield (%)
FCF per share
Return Ratios (%)
RoE
RoCE
RoIC
Working Capital Ratios
Asset Turnover (x)
Inventory (Days)
Debtor (Days)
Creditor (Days)
Working Cap. Turnover (Days)
Leverage Ratio (x)
Current Ratio
Net Debt/Equity
FY12
66.6
79.1
427.4
16.5
28.8
FY13
71.6
85.2
478.6
17.5
28.5
FY14
48.4
60.5
351.7
12.5
30.3
26.4
21.1
3.6
4.2
19.3
1.0
8.1
14.4
13.8
20.0
0.7
1
4
19
32
4.5
-0.4
FY15
54.1
75.2
385.5
13.6
30.2
23.6
17.0
3.3
3.6
15.8
1.1
11.7
14.7
13.9
19.7
0.8
3
4
19
28
4.4
-0.4
FY16
40.1
60.8
409.5
13.5
40.4
31.8
21.0
3.1
3.5
19.2
1.1
4.5
10.1
9.7
13.3
0.7
1
5
26
12
3.2
-0.3
FY17E
36.0
54.2
430.9
12.1
40.4
35.5
23.6
3.0
3.8
21.7
0.9
-17.2
8.6
8.3
11.6
0.7
1
4
29
16
3.1
-0.3
FY18E
45.8
65.6
458.1
15.4
40.4
27.9
19.5
2.8
3.5
17.4
1.2
6.9
10.3
9.9
15.1
0.7
1
4
23
7
2.8
-0.3
FY19E
50.0
71.6
487.9
16.8
40.4
25.5
17.8
2.6
3.1
15.7
1.3
12.7
10.6
10.2
16.4
0.7
1
4
23
-1
2.6
-0.3
1.3
42.0
16.5
15.7
23.6
0.7
3
3
16
26
5.7
-0.5
1.4
25.0
15.8
15.0
23.2
0.7
5
2
20
20
5.6
-0.5
Consolidated - Cash Flow Statement
Y/E March
OP/(Loss) before Tax
Depreciation
Interest & Finance Charges
Direct Taxes Paid
(Inc)/Dec in WC
CF from Operations
Others
CF from Operating incl EO
(inc)/dec in FA
Free Cash Flow
(Pur)/Sale of Investments
Others
CF from Investments
Issue of Shares
(Inc)/Dec in Debt
Interest Paid
Dividend Paid
Others
CF from Fin. Activity
Inc/Dec of Cash
Opening Balance
Closing Balance
E: MOSL Estimates
FY12
11,692
1,621
-2,539
-2,000
-1,066
7,708
14
7,722
-2,267
5,455
-500
1,939
-828
0
110
-48
-2,342
0
-2,279
4,615
22,961
27,576
FY13
12,027
1,763
-2,977
-2,142
425
9,095
8
9,104
-5,858
3,246
-1,245
2,681
-4,422
0
-196
-33
-2,568
0
-2,798
1,884
27,576
29,460
FY14
12,529
2,357
220
-2,597
-2,645
9,864
-3,137
6,727
-5,145
1,582
-3,080
3,616
-4,609
0
-584
-238
-3,086
73
-3,835
-1,717
29,460
27,742
FY15
13,199
4,108
183
-3,653
1,058
14,896
-3,232
11,664
-9,376
2,288
-44
2,996
-6,424
0
167
-189
-3,130
-339
-3,490
1,749
27,742
29,492
FY16
10,727
4,027
-3,192
-2,898
2,719
11,383
-5
11,378
-10,500
878
-1,971
3,358
-9,113
0
-439
-166
-3,166
-6
-3,777
-1,512
29,492
27,979
FY17E
9,740
3,540
-2,876
-2,708
-551
7,145
0
7,145
-10,500
-3,355
0
3,026
-7,474
0
0
-150
-2,839
-14
-3,003
-3,332
27,979
24,648
(INR Million)
FY18E
11,914
3,870
-2,840
-2,979
1,377
11,343
0
11,343
-10,000
1,343
0
2,991
-7,009
0
0
-152
-3,609
-14
-3,774
560
24,648
25,208
FY19E
13,022
4,214
-2,960
-3,256
1,447
12,468
0
12,468
-10,000
2,468
0
3,113
-6,887
0
0
-153
-3,945
-14
-4,112
1,469
25,208
26,677
14 February 2017
7

Container Corporation
Corporate profile
Company description
Container Corp of India Ltd (CCRI) is a leading rail
freight transporter that is graduating to be a
multimodal logistic player. It is set to benefit from
GDP/EXIM revival and DFCs completion that will
accelerate containerization. Despite private players
entry in 2006, it has a leading market share (76%)
that can be attributed to its scale and vantage
locations. Long term growth acceleration could
come from its pre-emptive capex on multimodal
parks.
Exhibit 2: Shareholding pattern (%)
Dec-16
Promoter
DII
FII
Others
56.8
12.7
27.3
3.3
Sep-16
56.8
11.2
28.7
3.3
Dec-15
61.8
7.2
27.9
3.1
Source: Capitaline
Exhibit 1: Sensex rebased
Source: MOSL/Bloomberg
Exhibit 3: Top holders
Holder Name
ICICI Prudential Mutual Fund
LIC of India
Aberdeen Global Indian Equity Limited
Matthews pacific Tiger Fund
Government of Singapore
% Holding
4.2
3.1
2.9
2.8
2.3
Source: Capitaline
Note: FII Includes depository receipts
Exhibit 4: Top management
Name
Anil Kumar Gupta
P Alli Rani
Harish Chandra
Designation
Chairman & Managing
Director
Director (Finance)
Company Secretary
Exhibit 5: Directors
Name
Pradip K Agrawal
Raj Krishan Malhotra
V Kalyana Rama
S K Sharma
Name
Kamlesh Shivji Vikamsey
Sanjeev S Shah
Sanjay Bajpai
Sanjay Swarup
Source: Capitaline
*Independent
Exhibit 6: Auditors
Name
A V Deven & Co
Arun K Agarwal & Associates
Arun Singh & Co
K L Banerjee & Co
Khanzode & Associates
Branch
Statutory
Branch
Branch
Branch
Source: Capitaline
Type
Exhibit 7: MOSL forecast v/s consensus
EPS
(INR)
FY17
FY18
FY19
MOSL
forecast
36.0
45.8
50.0
Consensus
forecast
38.8
48.3
58.8
Variation (%)
-7.3
-5.1
-14.9
Source: Bloomberg
14 February 2017
8

Container Corporation
NOTES
14 February 2017
9

Disclosures
This document has been prepared by Motilal Oswal Securities Limited (hereinafter referred to as Most) to provide information about the company (ies) and/sector(s), if any, covered in the report and may be distributed by it
and/or its affiliated company(ies). This report is for personal information of the selected recipient/s and does not construe to be any investment, legal or taxation advice to you. This research report does not constitute an
offer, invitation or inducement to invest in securities or other investments and Motilal Oswal Securities Limited (hereinafter referred as MOSt) is not soliciting any action based upon it. This report is not for public distribution
and has been furnished to you solely for your general information and should not be reproduced or redistributed to any other person in any form. This report does not constitute a personal recommendation or take into
account the particular investment objectives, financial situations, or needs of individual clients. Before acting on any advice or recommendation in this material, investors should consider whether it is suitable for their
particular circumstances and, if necessary, seek professional advice. The price and value of the investments referred to in this material and the income from them may go down as well as up, and investors may realize losses
on any investments. Past performance is not a guide for future performance, future returns are not guaranteed and a loss of original capital may occur.
MOSt and its affiliates are a full-service, integrated investment banking, investment management, brokerage and financing group. We and our affiliates have investment banking and other business relationships with a some
companies covered by our Research Department. Our research professionals may provide input into our investment banking and other business selection processes. Investors should assume that MOSt and/or its affiliates are
seeking or will seek investment banking or other business from the company or companies that are the subject of this material and that the research professionals who were involved in preparing this material may educate
investors on investments in such business . The research professionals responsible for the preparation of this document may interact with trading desk personnel, sales personnel and other parties for the purpose of
gathering, applying and interpreting information. Our research professionals are paid on twin parameters of performance & profitability of MOSt.
MOSt generally prohibits its analysts, persons reporting to analysts, and members of their households from maintaining a financial interest in the securities or derivatives of any companies that the analysts cover.
Additionally, MOSt generally prohibits its analysts and persons reporting to analysts from serving as an officer, director, or advisory board member of any companies that the analysts cover. Our salespeople, traders, and
other professionals or affiliates may provide oral or written market commentary or trading strategies to our clients that reflect opinions that are contrary to the opinions expressed herein, and our proprietary trading and
investing businesses may make investment decisions that are inconsistent with the recommendations expressed herein. In reviewing these materials, you should be aware that any or all of the foregoing among other things,
may give rise to real or potential conflicts of interest. MOSt and its affiliated company(ies), their directors and employees and their relatives may; (a) from time to time, have a long or short position in, act as principal in, and
buy or sell the securities or derivatives thereof of companies mentioned herein. (b) be engaged in any other transaction involving such securities and earn brokerage or other compensation or act as a market maker in the
financial instruments of the company(ies) discussed herein or act as an advisor or lender/borrower to such company(ies) or may have any other potential conflict of interests with respect to any recommendation and other
related information and opinions.; however the same shall have no bearing whatsoever on the specific recommendations made by the analyst(s), as the recommendations made by the analyst(s) are completely independent
of the views of the affiliates of MOSt even though there might exist an inherent conflict of interest in some of the stocks mentioned in the research report
Reports based on technical and derivative analysis center on studying charts company's price movement, outstanding positions and trading volume, as opposed to focusing on a company's fundamentals and, as such, may not match with a report on a
company's fundamental analysis. In addition MOST has different business segments / Divisions with independent research separated by Chinese walls catering to different set of customers having various objectives, risk profiles, investment horizon,
etc, and therefore may at times have different contrary views on stocks sectors and markets.
Unauthorized disclosure, use, dissemination or copying (either whole or partial) of this information, is prohibited. The person accessing this information specifically agrees to exempt MOSt or any of its affiliates or employees
from, any and all responsibility/liability arising from such misuse and agrees not to hold MOSt or any of its affiliates or employees responsible for any such misuse and further agrees to hold MOSt or any of its affiliates or
employees free and harmless from all losses, costs, damages, expenses that may be suffered by the person accessing this information due to any errors and delays. The information contained herein is based on publicly
available data or other sources believed to be reliable. Any statements contained in this report attributed to a third party represent MOSt’s interpretation of the data, information and/or opinions provided by that third party
either publicly or through a subscription service, and such use and interpretation have not been reviewed by the third party. This Report is not intended to be a complete statement or summary of the securities, markets or
developments referred to in the document. While we would endeavor to update the information herein on reasonable basis, MOSt and/or its affiliates are under no obligation to update the information. Also there may be
regulatory, compliance, or other reasons that may prevent MOSt and/or its affiliates from doing so. MOSt or any of its affiliates or employees shall not be in any way responsible and liable for any loss or damage that may
arise to any person from any inadvertent error in the information contained in this report. MOSt or any of its affiliates or employees do not provide, at any time, any express or implied warranty of any kind, regarding any
matter pertaining to this report, including without limitation the implied warranties of merchantability, fitness for a particular purpose, and non-infringement. The recipients of this report should rely on their own
investigations.
This report is intended for distribution to institutional investors. Recipients who are not institutional investors should seek advice of their independent financial advisor prior to taking any investment decision based on this
report or for any necessary explanation of its contents.
Most and it’s associates may have managed or co-managed public offering of securities, may have received compensation for investment banking or merchant banking or brokerage services, may have received any
compensation for products or services other than investment banking or merchant banking or brokerage services from the subject company in the past 12 months.
Most and it’s associates have not received any compensation or other benefits from the subject company or third party in connection with the research report.
Subject Company may have been a client of Most or its associates during twelve months preceding the date of distribution of the research report
MOSt and/or its affiliates and/or employees may have interests/positions, financial or otherwise of over 1 % at the end of the month immediately preceding the date of publication of the research in the securities mentioned
in this report. To enhance transparency, MOSt has incorporated a Disclosure of Interest Statement in this document. This should, however, not be treated as endorsement of the views expressed in the report.
Motilal Oswal Securities Limited is registered as a Research Analyst under SEBI (Research Analyst) Regulations, 2014. SEBI Reg. No. INH000000412
Pending Regulatory inspections against Motilal Oswal Securities Limited:
SEBI pursuant to a complaint from client Shri C.R. Mohanraj alleging unauthorized trading, issued a letter dated 29th April 2014 to MOSL notifying appointment of an Adjudicating Officer as per SEBI regulations to hold inquiry
and adjudge violation of SEBI Regulations; MOSL replied to the Show Cause Notice whereby SEBI granted us an opportunity of Inspection of Documents. Since all the documents requested by us were not covered we have
requested to SEBI vide our letter dated June 23, 2015 to provide pending list of documents for inspection.
List of associate companies of Motilal Oswal Securities Limited -Click
here to access detailed report
Analyst Certification
The views expressed in this research report accurately reflect the personal views of the analyst(s) about the subject securities or issues, and no part of the compensation of the research analyst(s) was, is, or will be directly or
indirectly related to the specific recommendations and views expressed by research analyst(s) in this report. The research analysts, strategists, or research associates principally responsible for preparation of MOSt research
receive compensation based upon various factors, including quality of research, investor client feedback, stock picking, competitive factors and firm revenues
Container Corporation
Disclosure of Interest Statement
Analyst ownership of the stock
No
Served as an officer, director or employee -
No
A graph of daily closing prices of securities is available at www.nseindia.com and http://economictimes.indiatimes.com/markets/stocks/stock-quotes
Regional Disclosures (outside India)
This report is not directed or intended for distribution to or use by any person or entity resident in a state, country or any jurisdiction, where such distribution, publication, availability or use would be contrary to law,
regulation or which would subject MOSt & its group companies to registration or licensing requirements within such jurisdictions.
For Hong Kong:
This report is distributed in Hong Kong by Motilal Oswal capital Markets (Hong Kong) Private Limited, a licensed corporation (CE AYY-301) licensed and regulated by the Hong Kong Securities and Futures
Commission (SFC) pursuant to the Securities and Futures Ordinance (Chapter 571 of the Laws of Hong Kong) “SFO”. As per SEBI (Research Analyst Regulations) 2014 Motilal Oswal Securities (SEBI Reg No. INH000000412) has
an agreement with Motilal Oswal capital Markets (Hong Kong) Private Limited for distribution of research report in Kong Kong. This report is intended for distribution only to “Professional Investors” as defined in Part I of
Schedule 1 to SFO. Any investment or investment activity to which this document relates is only available to professional investor and will be engaged only with professional investors.” Nothing here is an offer or solicitation
of these securities, products and services in any jurisdiction where their offer or sale is not qualified or exempt from registration. The Indian Analyst(s) who compile this report is/are not located in Hong Kong & are not
conducting Research Analysis in Hong Kong.
For U.S.
Motilal Oswal Securities Limited (MOSL) is not a registered broker - dealer under the U.S. Securities Exchange Act of 1934, as amended (the"1934 act") and under applicable state laws in the United States. In addition MOSL is
not a registered investment adviser under the U.S. Investment Advisers Act of 1940, as amended (the "Advisers Act" and together with the 1934 Act, the "Acts), and under applicable state laws in the United States.
Accordingly, in the absence of specific exemption under the Acts, any brokerage and investment services provided by MOSL, including the products and services described herein are not available to or intended for U.S.
persons.
This report is intended for distribution only to "Major Institutional Investors" as defined by Rule 15a-6(b)(4) of the Exchange Act and interpretations thereof by SEC (henceforth referred to as "major institutional investors").
This document must not be acted on or relied on by persons who are not major institutional investors. Any investment or investment activity to which this document relates is only available to major institutional investors
and will be engaged in only with major institutional investors. In reliance on the exemption from registration provided by Rule 15a-6 of the U.S. Securities Exchange Act of 1934, as amended (the "Exchange Act") and
interpretations thereof by the U.S. Securities and Exchange Commission ("SEC") in order to conduct business with Institutional Investors based in the U.S., MOSL has entered into a chaperoning agreement with a U.S.
registered broker-dealer, Motilal Oswal Securities International Private Limited. ("MOSIPL"). Any business interaction pursuant to this report will have to be executed within the provisions of this chaperoning agreement.
The Research Analysts contributing to the report may not be registered /qualified as research analyst with FINRA. Such research analyst may not be associated persons of the U.S. registered broker-dealer, MOSIPL, and
therefore, may not be subject to NASD rule 2711 and NYSE Rule 472 restrictions on communication with a subject company, public appearances and trading securities held by a research analyst account.
For Singapore
Motilal Oswal Capital Markets Singapore Pte Limited is acting as an exempt financial advisor under section 23(1)(f) of the Financial Advisers Act(FAA) read with regulation 17(1)(d) of the Financial Advisors Regulations and is a
subsidiary of Motilal Oswal Securities Limited in India. This research is distributed in Singapore by Motilal Oswal Capital Markets Singapore Pte Limited and it is only directed in Singapore to accredited investors, as defined in
the Financial Advisers Regulations and the Securities and Futures Act (Chapter 289), as amended from time to time.
In respect of any matter arising from or in connection with the research you could contact the following representatives of Motilal Oswal Capital Markets Singapore Pte Limited:
Varun Kumar
Varun.kumar@motilaloswal.com
Contact : (+65) 68189232
Office Address:21 (Suite 31),16 Collyer Quay,Singapore 04931
§
§
CONTAINER CORP OF INDIA
14 February 2017
Motilal Oswal Tower, Level 9, Sayani Road, Prabhadevi, Mumbai 400 025
Phone: +91 22 3982 5500 E-mail: reports@motilaloswal.com
Motilal Oswal Securities Ltd
10