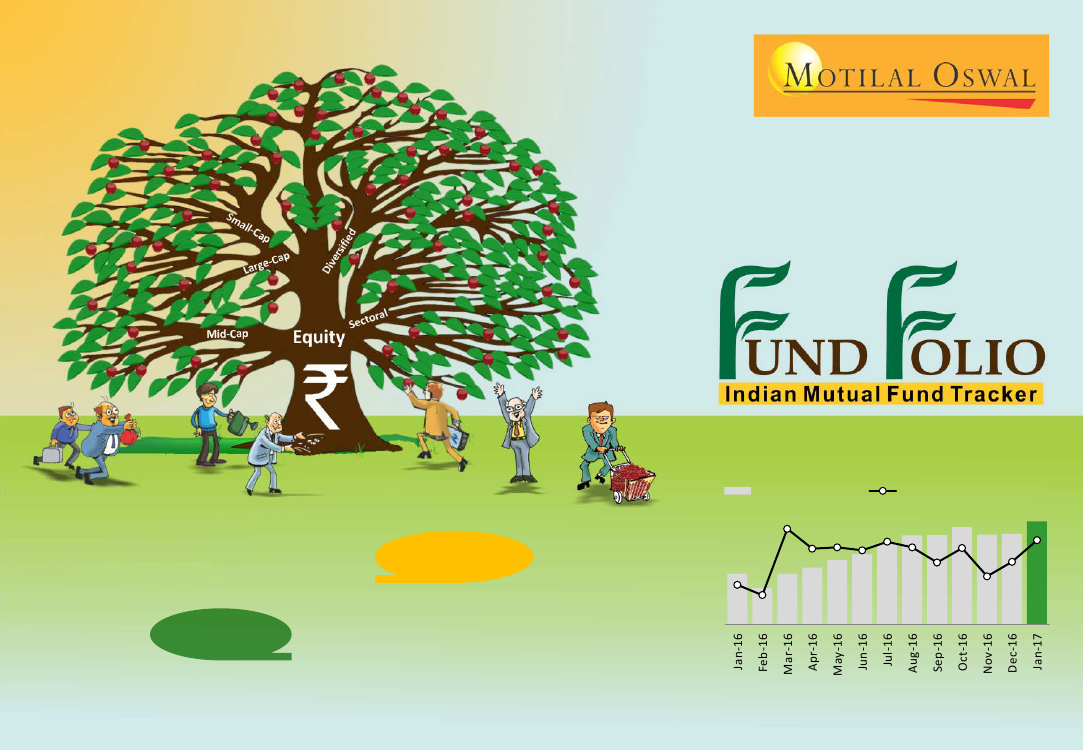
Equity AUM up 5.5% in January - the highest rise
in last 10 months
Equity AUM (INR t)
8.3
Equity AUM Chg MoM (%)
3.6
-3.2
5.5
Total AUM of MF industry at all-time high; up
5.5% MoM—the 3rd quickest 1t jump
5.2 3.8
3.5 3.8 3.1
INR17.4t
0.1
0.3
-5.3
-7.8
3.5 3.2 3.4 3.6 3.7 3.8 4.0 4.2 4.2 4.3 4.2 4.2 4.4
INR37b
Net inflows in January
down 60% MoM
Investors are advised to refer to important disclosures made at the last page of the Research Report.
February 2017

SUMMARY: An encouraging start to the new year
Key observations
Domestic MFs started CY17 on a positive note. Equity AUM grew 5.5% in January – the highest rise in the last 10 months. Notably, the rise in equity
AUM was higher than the 4.6% MoM rise in the benchmark index (Nifty).
Total AUM of the MF industry also grew 5.5% MoM to INR17.4t in January to a new high, also marking the third-quickest 1t jump.
While gross inflows remained steady (INR161b; down 6% MoM), redemptions rose sharply by 56% MoM to INR124b ahead of the Union Budget in a
volatile market environment. Consequently, net inflows declined to INR37b in January from INR92b in the previous month.
The last three months have seen meaningful changes in allocation by domestic MFs,
following concerns about the potential impact of
demonetization on earnings. While allocations to Private Banks, Oil & Gas, NBFCs, Consumer, Utilities, Metals and Telecom have risen, Capital
Goods, Technology, Healthcare and PSU Banks saw signs of moderation.
After two consecutive months of increase,
weight of the Technology sector decreased in January.
As a result, the Technology sector has fallen to
the fourth position in sector allocation of mutual funds.
Of the top-10 stocks, which saw an increase in value on MoM basis, four were from Private Banks. IOCL
saw a total increase of INR19.5b in value;
15 out of 20 funds bought the stock. In
Private Banks,
HDFC Bank (INR22b), ICICI Bank (INR19b), IndusInd (INR11b) and Yes Bank (INR10b) saw an
increase in value on MoM basis.
Value shocks were significant in Technology stocks.
TCS (-INR5b), Tech Mahindra (-INR2b), HCL Tech(-INR1b), and Mindtree (-INR1b) saw the
maximum decline in value.
Sectors with rising trend in weight allocation (%)
16.7
6.1
6.0
Nov-16
Dec-16
6.2
Jan-17
Some interesting facts
Sectors with signs of moderation in weight allocation (%)
Nov-16
8.5
8.3
8.3
8.4
Dec-16
8.8
Jan-17
8.5
4.9
16.5
16.4
6.6
6.2
6.1
6.4
6.0
6.2
3.1
3.1
8.0
8.1
3.3
2.1
2.1
2.3
1.2
7.5
4.6
4.7
1.2
1.3
Banks PVT
Oil & Gas
NBFC
Consumer
Utilities
Metals
Telecom
Capital Goods
Technology
Healthcare
Banks PSU
Fund Folio: Indian Mutual Fund Tracker | February 2017
2

Contents
AUM:
Reached new high, up 5.5% MoM to 17.4t in January
Flows:
Net inflows in January down 60% MoM to INR37b
Top-20 funds:
Equity value up 8.6% MoM and 39% YoY
Sector-wise weight:
MoM increase seen in Oil & Gas, NBFCs, Metals and
Utilities
Sectoral allocation of funds:
Consumer, Technology, Telecom under-owned
Nifty-50 snapshot:
MFs net buyers in 70% of the stocks
Top schemes and NAV change:
80% of top-25 schemes outperformed market
Value surprise:
Maximum MoM change in HDFC Bank, IOC, ICICI Bank, ONGC
Funds snapshot:
Overview
About the product
Fund Folio
is a handbook on the
holdings of the top 20 domestic mutual
funds in India. This monthly report will
cover:
Trend in AUMs and flows
Sector allocation by funds
Stock-wise holding change
Top schemes and NAV chg
Fund-wise snapshot on top holdings
Notes:
This report covers only the top 20
mutual funds by exposure to equity
All aggregates pertain only to the
funds listed in this report
Sectors are as defined by MOSL
Research
Source: AMFI, NAVIndia
Axis
Birla Sun Life
BNP Paribas
Canara Robeco
DSP BlackRock
Franklin Templeton
HDFC
ICICI Prudential
IDFC
Invesco
Kotak Mahindra
L&T
Mirae Asset
Motilal Oswal
Principal
Reliance
SBI
Sundaram
Tata
UTI
3
Deven Mistry (Deven@MotilalOswal.com); +91 223982 5440
Fund Folio: Indian Mutual Fund Tracker | February 2017

AUM:
Reached new high; up 5.5% MoM to 17.4t in January
Total AUM of the MF industry grew 5.5% MoM to INR17.4t in January to a new high, also marking the third-quickest 1t jump. The MoM rise was
primarily due to rise in AUM of income funds (INR357b), equity funds (INR232b), and liquid funds (INR132b).
Equity AUM also grew 5.5% MoM in January – the rise in equity AUM was higher than the rise in the benchmark index (Nifty), which rose 4.6%
MoM. While gross inflows remained steady (INR161b, down 6% MoM), redemptions rose sharply by 56% MoM to INR124b ahead of the Union
Budget in a volatile market environment. Consequently, net inflows declined from INR92b in December to INR37b in January.
Domestic MFs accounted for INR52b of inflows into equity markets in January 2017, the sixth consecutive month of inflows. In CY16, domestic MFs
accounted for INR482b of inflows in equity markets.
Trend in total AUM and equity AUM (as % of total)
Equity AUM % to Mktcap - RHS
4.4
4.4
3.8
3.2
2.6
2.0
19
16
12
9
5
9.0
10.1
11.8 12.0
13.2
14.2
Trend in equity AUM
5.0
4.0
3.0
2.0
1.0
Equity AUM (INR t)
Total AUM (INR t)
Equity as % to total AUM - RHS
15.2
16.3
17.4
31
27
23
19
15
What drove equity AUM in January (INR b)
161
-124
195
Domestic MFs’ investments in equity market (INR b)
Domestic MFs Investment in equity market (INR b)
103 105
93
92
70 59 70
65 73
54
51 42
43 39 42
45 59
33
29
17 9
1
71
138
91 92
2738
6
102
10
52
4,428
16
4,196
5 4 13
8 1614 3
25 3927
22 28
35
40
52
Dec-16
Sales
Redemption Capital Appreciation
Jan-17
Fund Folio: Indian Mutual Fund Tracker | February 2017
4

Flows:
Net inflows in January down 60% MoM to INR37b
Mutual funds’ gross inflows remained steady (INR161b, down 6% MoM) in January. However, there was a meaningful rise in redemptions (INR124b,
up 56% YoY). This led to net inflows falling to INR37b, down 60% in January.
Monthly trend of sales, redemptions and net amount raised by mutual funds (toward equity)
300
200
100
37
0
-100
-200
-79
-135
-124
Inflows in Equity (INR b)
Redemptions in Equity (INR b)
Net Inflow/Outflow in Equity (INR b)
216
171
161
Redemptions rise
to INR124b, up
56% in January
Trend of net inflows by mutual funds (toward equity)
Net Inflow/Outflow in Equity (INR b)
408
226
65
11
6
-134
3
-129
-76
681
676
495
Break-up of inflows to mutual funds (toward equity)
Inflow in Existing Scheme (INR b)
Inflow in New Scheme (INR b)
0.0
1.6
0.7
0.7
0.4
0.6
4.5
0.9
2.6
6.4
4.9
331
0.1
98.8
1.5
124.4 131.6 116.8
96.1 109.6 103.1
215.2
205.0 187.0
164.9 155.8
170.0
FY05 FY06 FY07 FY08 FY09 FY10 FY11 FY12 FY13 FY14 FY15 FY16 FY17
YTD
Fund Folio: Indian Mutual Fund Tracker | February 2017
5

Top-20 funds:
Equity value up 8.6% MoM and 39% YoY
Total equity corpus of top-20 AMCs rose 8.6% MoM (+39.1% YoY) in January 2017, as against the Nifty’s rise of 4.6% MoM (+13.2% YoY).
In the top-10 funds, the highest YoY increase was recorded in Reliance (+16%), Kotak Mahindra (+11%), Birla Sun Life (+10%), SBI (+9%) and HDFC
(+8%).
12M Chg
(INRb) (%)
206
34
191
37
122
24
268
87
140
48
80
24
111
40
72
48
84
69
47
41
40
43
3
3
20
23
16
17
27
62
35
128
9
27
6
27
5
27
-5
-19
1,477 39
13
Cash
Holding (%)
2.3
10.4
3.8
8.8
6.1
3.7
7.9
4.6
6.4
7.9
4.0
10.7
4.7
5.0
0.3
3.1
3.1
2.3
4.0
4.7
5.2
Trend of top-20 mutual funds by equity value
Value (INR b)
MoM Change (%)
Jan-16 Feb-16 Mar-16 Apr-16 May-16 June-16 July-16 Aug-16 Sep-16 Oct-16 Nov-16 Dec-16 Jan-17
Jan-17
HDFC Mutual Fund
809
-8.6 -9.9
11.5
3.1
4.3
3.4
5.2
4.6
-0.3
4.3
-2.7
-0.3
8.0
ICICI Prudential Mutual Fund
716
-2.9 -7.3
8.8
2.2
4.1
4.4
4.2
4.0
2.0
5.6
-1.0
-0.8
6.0
Reliance Mutual Fund
620
-6.6 -9.8
7.8
2.6
2.7
2.5
4.1
2.8
-1.5
3.3
-3.0
-3.0
15.7
SBI Mutual Fund
576
2.1
-1.2
16.1
4.6
8.0
4.2
7.5
5.0
4.4
4.8
-2.3
5.2
9.1
Birla Sun Life Mutual Fund
435
-3.5 -6.2
9.2
4.8
6.9
3.8
6.7
2.7
2.0
5.0
-4.5
0.4
10.0
UTI Mutual Fund
411
-4.9 -7.7
11.9
2.2
3.8
2.6
4.9
2.0
-1.1
1.5
-3.9
0.6
6.3
Franklin Templeton Mutual Fund
391
-3.1 -5.4
11.2
4.6
5.1
4.7
3.8
3.5
-0.1
3.8
-2.4
-0.5
6.6
DSP BlackRock Mutual Fund
223
-7.1 -9.1
13.8
2.9
4.3
5.3
7.1
3.8
1.9
6.1
-4.4
2.3
7.5
Kotak Mahindra Mutual Fund
207
-3.5 -5.3
8.1
2.9
9.5
0.8
7.4
8.6
1.4
4.7
2.7
2.6
11.2
AXIS Mutual Fund
162
-2.7 -4.5
12.9
5.9
7.2
2.6
7.4
2.4
0.4
3.6
-5.6
-3.7
7.6
L&T Mutual Fund
134
-3.4 -7.6
13.9
0.7
7.3
3.8
6.1
2.7
1.5
4.1
-1.1
-3.8
10.7
IDFC Mutual Fund
108
-7.1 -9.3
3.7
2.3
2.0
-1.1
7.8
2.0
-0.9
4.6
-8.2
-1.7
3.5
Tata Mutual Fund
108
-1.8 -7.3
10.0
3.2
3.7
3.7
5.6
1.1
0.6
0.1
-5.2
-0.5
7.1
Sundaram Mutual Fund
107
-6.7 -12.9
4.9
2.0
3.1
4.9
7.0
4.6
0.0
7.4
-8.3
-1.5
7.2
Motilal Oswal Mutual Fund
72
-3.7 -2.7
9.9
7.6
4.9
5.9
7.9
1.0
5.7
4.4
-2.4
-0.9
8.8
Mirae Asset Mutual Fund
63
0.9
-0.5
13.1
7.7
11.9
8.3
9.2
7.1
7.9
12.1
0.0
-0.2
10.0
Canara Robeco Mutual Fund
41
-4.4 -11.0 15.4
0.7
1.7
7.5
5.9
3.0
2.3
0.2
-3.2
-2.8
6.9
BNP Paribas Mutual Fund
27
-4.3 -4.5
15.5
6.2
4.9
5.7
5.5
0.0
-3.9
-0.8
-5.9
-3.2
6.8
PRINCIPAL Mutual Fund
23
-8.5 -8.7
9.4
4.6
5.1
3.9
4.6
4.4
-0.2
2.8
-3.7
-2.8
6.6
Invesco Mutual Fund
22
-3.8 -8.4 -25.3
4.2
5.5
2.1
3.5
1.2
0.5
2.5
-5.8
-0.8
4.0
Total of above
5,255
-4.6 -7.4
10.4
3.3
4.9
3.6
5.6
3.6
0.9
4.3
-2.9
-0.1
8.6
Nifty
8,561
-4.8 -7.6
10.8
1.4
4.0
1.6
4.2
1.7
-2.0
0.2
-4.7
-0.5
4.6
Note:
Cash is derived by deducting equity AUM from total AUM. Only equity growth schemes have been considered for cash.
Fund Folio: Indian Mutual Fund Tracker | February 2017
6

Sector-wise weight:
MoM increase seen in Oil & Gas, NBFCs, Metals and Utilities
In January, mutual funds showed interest in Oil & Gas, NBFCs, Metals, Utilities, Cement, Private Banks and Telecom—these sectors saw an MoM
increase in weight. Technology, Healthcare and Textiles saw an MoM decrease in weight.
Private Banks (16.7%) remained the top sector holding in January, followed by Autos (10.7%), Capital Goods (8.3%) and Technology (8%).
Metals, Oil & Gas, Utilities, Telecom and Cement saw the maximum positive MoM change in value.
Sector allocation (%):
Oil & Gas and NBFCs see highest increase
Jan Weight (%)
Banks Private
Auto
Capital Goods
Technology
Healthcare
Oil & Gas
NBFC
Consumer
Banks Public
Chemicals
Cement
Utilities
Metals
Telecom
Textiles
Infrastructure
Media
Retail
Real Estate
4.0
3.5
3.3
2.3
1.3
1.3
1.2
1.2
0.6
0.3
-
-
-
-
8.3
8.0
7.5
6.6
6.4
6.2
4.7
0.6
0.2
Sector value change MoM (%):
Metals
Oil & Gas
Utilities
Telecom
Cement
NBFC
Retail
Banks Private
Consumer
Banks Public
Auto
Capital Goods
Chemicals
Real Estate
Infrastructure
Media
Textiles
Healthcare
Technology
-1.3
Technology only sector to see fall in value
19.7
19.0
15.4
14.8
13.5
12.9
11.0
9.4
9.4
8.9
8.5
8.2
8.2
6.0
5.5
5.5
4.5
0.5
MFs v/s BSE-200 weight (%):
BSE 200 Weight (%)
Banks Private
Consumer
Auto
Technology
NBFC
Oil & Gas
Healthcare
Capital Goods
Utilities
Metals
Banks Public
Cement
Telecom
Chemicals
Infrastructure
Media
Textiles
Retail
Real Estate
6.4
6.2
Capital Goods and PSU Banks o/w
MF Weight (%)
16.5
16.7
11.5
11.0
10.7
10.2
MoM Chg (pp)
16.7
0.1
10.7
-
-
8.0
9.6
-
-
-
0.2
0.2
0.2
0.1
8.8
6.6
6.9
7.5
4.5
8.3
4.0
3.3
3.2
2.3
2.9
4.7
2.8
3.5
1.9
1.3
1.3
4.0
0.9
1.2
0.9
1.2
0.6
1.3
0.6
0.6
0.2
0.3
Fund Folio: Indian Mutual Fund Tracker | February 2017
7

Sectoral allocation of funds:
Consumer, Technology, Telecom under-owned
Top sectors where ownership of mutual funds vis-à-vis BSE-200 is at least 1% lower:
Consumer (20 funds under-owned), Technology (17 funds
under-owned), Telecom (15 funds under-owned), Utilities (15 funds under-owned) and Oil & Gas (14 funds under-owned).
Top sectors where ownership of mutual funds vis-à-vis BSE-200 is at least 1% higher:
Capital Goods (17 funds over-owned), Cement (9 funds over-
owned), Private Banks (7 funds over-owned), PSU Banks (7 funds over-owned) and Auto (6 funds over-owned).
Sector-wise allocation of funds v/s BSE-200 (%)
Sector
Auto
Banks PVT
Banks PSU
Cap. Goods
Cement
Chemicals
Consumer
Healthcare
Infra
Media
Metals
NBFC
Oil & Gas
Real Estate
Retail
Technology
Telecom
Textiles
Utilities
BSE200 Axis
11.0
16.5
2.9
4.5
2.8
1.3
11.5
6.9
0.9
0.9
3.2
9.6
8.8
0.2
0.6
10.2
1.9
0.6
4.0
19.1
16.7
0.7
7.5
1.0
6.0
8.4
5.8
0.6
1.3
0.0
17.2
1.5
0.0
6.2
0.6
1.1
2.0
Birla
BNP Canara
DSP
Franklin
ICICI
Kotak
HDFC
L&T
IDFC Invesco
Mahindra
Sun Life Paribas Robeco BlackRock Temp.
Pru
11.3
3.3
13.6
9.1
14.0
9.3 9.3 11.3
13.8
11.1
6.0
16.9
24.2
13.6
13.7
24.8
13.9 17.5 10.7
18.1
25.6
12.7
2.2
2.6
2.7
5.4
4.4
11.9
1.6 1.4
1.0
4.0
4.8
6.5
7.0
10.4
8.7
5.4
12.5 6.4 9.5
5.9
5.7
9.4
3.8
5.8
4.4
3.7
4.4
2.0 2.6 3.8
2.3
6.5
8.7
4.2
4.7
8.7
8.8
2.0
3.8 3.4 4.9
2.4
2.4
4.5
8.6
7.3
9.1
5.2
5.3
2.4 6.9 7.6
4.6
7.0
5.2
9.1
4.3
4.2
6.4
6.3
4.7
10.9
5.6
6.5
5.1
4.3
0.7
1.1
2.2
1.8
1.1
2.1
1.2 0.5
0.4
0.3
1.5
1.9
4.1
2.1
1.3
0.8
1.5 0.6
1.9
2.4
1.2
1.2
3.0
6.3
0.5
4.8
0.4
3.8 1.9 3.4
1.7
1.2
7.0
10.5
9.2
3.4
4.2
3.0
3.7 5.4 9.9
8.3
7.2
5.3
7.5
4.6
6.9
8.0
5.4
7.0 3.0 6.7
7.5
10.5
6.8
0.1
0.0
0.8
0.5
0.5
0.2 0.3 0.9
0.3
0.3
0.3
0.5
1.6
0.7
1.8
0.3 0.1 0.8
0.9
0.0
1.7
6.4
2.1
5.5
4.7
8.1
8.6
13.7
3.2
6.4
4.6
5.2
0.6
1.5
0.1
0.0
4.8
0.9
3.0
0.6
0.9
0.7
0.4
0.7
1.4
2.2
4.8
1.4
0.6 0.2
3.9
0.1
1.8
2.6
2.7
3.0
0.6
0.8
2.2
4.1
7.0
1.3
8.4
1.2
2.2
Mirae
11.8
19.2
2.2
5.8
2.1
3.6
7.3
9.7
2.6
2.8
4.5
8.6
0.0
6.0
0.7
2.9
1.4
Re-
Motilal
Sun-
Principal
SBI
TATA UTI
liance
Oswal
daram
15.0
10.4
8.1 10.4 11.1
11.0
14.6
20.7
14.6
14.9 15.7 8.4
15.6
17.7
2.9
4.6
5.8
3.8
3.3
2.9 2.4
1.3
5.5
13.2 6.1 11.2
6.7 6.2
1.2
7.2
3.1 3.0
6.3
6.8 4.8
3.0
4.1
4.2 3.7
8.6
2.7 2.8
7.6
10.4
4.3 8.9
5.7
6.5 8.2
15.4
6.8
6.4
10.5
4.2
7.9 7.8
0.0
1.5
0.7 0.6
2.0
4.8
1.8
0.0
1.7
1.6 0.8
2.2
2.1
0.6
0.0
2.5
3.0 0.8
0.3
0.9 1.5
10.6
4.1
5.0 8.9
9.0
4.1 6.5
10.4
8.1
10.0
6.6
4.8
6.3 6.6
0.0
0.9
0.6 0.1
0.6
0.7 0.2
0.0
0.0
1.3 0.7
0.7
1.5 0.6
1.6
6.3
5.9 9.5
3.4
7.3 10.0
0.0
1.4
0.7 1.2
0.7
0.0 0.3
0.0
1.6
0.7 1.1
5.3
0.8
2.0
0.0
1.5
3.5 2.9
1.3
5.7
1.2
Note:
Green box indicates over ownership by +1% and orange box indicates under ownership by -1% of a sector vis-a-vis BSE200 weight.
Fund Folio: Indian Mutual Fund Tracker | February 2017
8

Nifty-50 snapshot:
MFs net buyers in 70% of the stocks
Highest net buying in January 2017 on MoM basis was witnessed in ONGC (+66%), Coal India (+32%) and GAIL (+26%).
Company
ONGC
Coal India
GAIL
ACC
Bharti Infratel
Infosys
Eicher Motors
Dr Reddys Labs.
Reliance Inds.
Hero MotoCorp
ITC
Ambuja Cements
M&M
Hindalco
ICICI Bank
Bosch
Wipro
Asian Paints
Lupin
Grasim Inds.
NTPC
Bank of Baroda
Tech Mahindra
Zee Entertainmen
Bharti Airtel
HDFC
SBI
Sun Pharma
HDFC Bank
IndusInd Bank
Tata Steel
BHEL
HCL Tech.
Number of Funds
Value Jan- Value Chg Shares Jan- Shares Chg
Having Exposure
MoM (%)
17 (INR B) MoM (%)
17 (M)
>2%
<2%
30.4
76.0
150.0
66.2
1
15
44.3
36.4
143.2
32.3
1
16
35.7
34.5
76.2
26.1
1
16
7.4
30.4
5.2
22.6
15
3.3
4.2
11.2
21.8
15
168.0
1.5
180.8
10.5
13
7
22.4
13.3
1.0
7.3
1
18
15.8
5.4
5.2
6.8
14
87.8
3.1
84.0
6.8
6
14
27.4
10.9
8.6
6.2
2
15
97.1
13.5
375.8
6.2
9
11
8.8
17.7
38.5
6.0
16
46.9
10.5
37.8
5.5
1
17
13.1
29.5
68.7
5.5
16
199.2
10.3
740.5
4.7
15
5
19.6
10.1
0.9
4.7
1
15
29.4
1.1
64.2
4.7
1
13
18.3
13.9
18.9
4.5
20
33.0
3.4
22.4
4.5
2
17
35.2
10.1
38.6
4.3
18
35.8
8.3
207.7
3.4
1
14
33.5
10.6
202.7
2.7
16
37.5
-5.1
82.8
2.5
1
18
18.0
10.2
36.8
1.9
1
18
46.5
16.0
133.6
1.8
2
16
67.6
9.8
49.5
1.4
3
17
160.4
5.5
615.9
1.4
12
8
78.0
1.5
123.4
1.2
4
16
307.6
7.8
239.0
1.0
19
1
87.5
14.1
69.9
1.0
10
10
49.4
19.1
106.6
0.6
2
18
4.4
13.5
32.2
0.4
15
63.8
-1.7
78.6
0.3
2
17
Company
L&T
Cipla
Aurobindo Pharma
Kotak Mah. Bank
Bajaj Auto
Tata Motors
Yes Bank
Axis Bank
Maruti Suzuki
Adani Ports & SEZ
HUL
Power Grid
BPCL
TCS
Tata Power
UltraTech Cement
Idea Cellular
Value Jan- Value Chg Shares Jan- Shares Chg
17 (INR B) MoM (%)
17 (M)
MoM (%)
140.7
42.0
40.0
73.2
14.8
61.0
60.5
76.8
110.7
23.1
31.0
49.6
38.1
42.9
5.9
28.4
6.5
7.3
1.2
1.5
6.9
6.9
10.2
19.5
2.5
9.5
8.0
2.0
11.0
5.1
-10.3
-1.7
5.2
20.5
97.3
73.0
58.6
94.5
5.2
116.5
43.3
164.8
18.8
78.7
36.3
239.3
55.8
19.2
74.3
7.7
59.2
0.1
0.1
-0.3
-0.6
-0.7
-0.7
-1.0
-1.0
-1.2
-1.2
-1.5
-1.7
-2.0
-4.9
-6.5
-7.6
-18.9
Number of Funds
Having Exposure
>2%
<2%
8
12
1
16
1
19
6
14
17
4
16
3
15
3
15
11
9
1
16
19
4
15
2
15
1
19
16
1
19
15
MFs weight in Nifty (%)
OW/UW to Nifty(pp)
6.4
0.1
1.4
3.8
1.0
0.3
0.5
0.0
28.5
MFs Weight in Nifty (%)
12.3 12.1
7.4
6.9
6.8
5.2
5.1
4.8
2.8
2.4
2.2
2.0
0.8
0.6
Fund Folio: Indian Mutual Fund Tracker | February 2017
9

Top schemes and NAV change:
80% of top-25 schemes outperformed market
Among the top-25 schemes by AUM, the five schemes registering the highest rise are:
Motilal Oswal Most Focused Multicap 35 Fund (+7.6% MoM
change in NAV), HDFC Tax Saver Fund (+7.2% MoM change in NAV), Franklin India High Growth Companies Fund (+7% MoM change in NAV), Franklin
India Prima Fund (+6.7% MoM change in NAV), and Franklin India Smaller Companies Fund (+6.6% MoM change in NAV).
Top schemes by AUM
Scheme Name
HDFC Equity Fund - (G)
ICICI Pru Value Discovery Fund (G)
Birla Sun Life Frontline Equity Fund (G)
HDFC Mid-Cap Opportunities Fund (G)
HDFC Top 200 Fund (G)
ICICI Pru Focused Bluechip Equity Fund (G)
AXIS Long Term Equity Fund (G)
SBI BlueChip Fund (G)
Franklin India Prima Plus - (G)
Reliance Equity Opportunities Fund (G)
Franklin India Bluechip Fund - (G)
Kotak Select Focus Fund (G)
Reliance Tax Saver (ELSS) Fund - (G)
ICICI Pru Dynamic Plan (G)
IDFC Premier Equity Fund (G)
Reliance Growth Fund - (G)
HDFC Tax Saver Fund (G)
Franklin India High Growth Companies Fund (G)
UTI-Equity Fund (G)
SBI Magnum Tax Gain Scheme (G)
Motilal Oswal Most Focused Multicap 35 Fund (G)
Franklin India Prima Fund - (G)
DSP BR Micro-Cap Fund (G)
Franklin India Smaller Companies Fund (G)
Sundaram Select Midcap - (G)
Total AUM (INR B)
167
156
149
138
131
123
111
109
99
96
79
79
64
61
57
57
56
54
50
50
49
48
48
45
45
Equity AUM (INR B)
165
141
137
130
131
113
104
92
93
94
71
72
63
46
50
53
56
51
49
49
49
44
43
41
43
MoM NAV Chg (%)
6.0
3.1
5.1
6.1
6.0
4.5
4.7
4.7
5.2
4.0
4.8
6.3
6.4
5.4
5.5
6.0
7.2
7.0
4.3
4.0
7.6
6.7
5.6
6.6
6.5
12M NAV Chg (%)
24.5
15.6
18.0
26.4
24.6
18.5
7.9
13.9
15.6
6.0
16.3
23.1
20.5
24.5
10.0
18.3
25.9
22.6
11.4
13.8
25.5
22.5
29.2
24.7
26.9
Note:
Equity growth schemes considered for this comparison
Fund Folio: Indian Mutual Fund Tracker | February 2017
10

Value surprise:
Maximum MoM change in HDFC Bank, IOC, ICICI Bank, ONGC and Coal India
In January, 4 out of Top-10 stocks that saw maximum change in value were from Private Banks. HDFC Bank, IOCL, ICICI Bank, ONGC and Coal India
saw maximum value change on MoM basis.
Value shocks were significant in Technology stocks. TCS, Tech Mahindra, Divis Lab, MCX and Info Edge saw maximum decline in value.
Top-10 stocks by change in value
Company
HDFC Bank
IOCL
ICICI Bank
ONGC
Coal India
ITC
IndusInd Bank
Yes Bank
Maruti Suzuki
L&T
Value Jan-17
(INR B)
307.6
53.4
199.2
30.4
44.3
97.1
87.5
60.5
110.7
140.7
Value Chg MoM
(INR B)
22.3
19.5
18.6
13.1
11.8
11.6
10.8
9.9
9.6
9.6
Value Chg
MoM (%)
7.8
57.7
10.3
76.0
36.4
13.5
14.1
19.5
9.5
7.3
Shares
Jan-17 (M)
239.0
145.7
740.5
150.0
143.2
375.8
69.9
43.3
18.8
97.3
Shares Chg
MoM (M)
2.4
41.6
33.3
59.8
35.0
21.9
0.7
-0.4
-0.2
0.1
Shares Chg
MoM (%)
1.0
39.9
4.7
66.2
32.3
6.2
1.0
-1.0
-1.2
0.1
Price Chg
MoM (%)
6.9
12.4
5.4
5.6
3.3
7.1
13.1
20.7
10.8
7.1
%
AUM
5.9
1.0
3.8
0.6
0.8
1.8
1.7
1.2
2.1
2.7
Bottom-10 stocks by change in value
Company
TCS
Tech Mah
Divis Lab
MCX
Info Edge
HCL Tech
Mindtree
Sanofi India
Advanced Enzyme
Dr Lal Pathlabs
Value Jan-17
(INR B)
42.9
37.5
27.7
10.5
12.4
63.8
4.7
10.5
3.4
3.3
Value Chg
MoM (INR B)
-4.9
-2.0
-2.0
-1.3
-1.2
-1.1
-0.7
-0.7
-0.6
-0.6
Value Chg
MoM (%)
-10.3
-5.1
-6.8
-11.4
-9.0
-1.7
-13.6
-6.0
-15.4
-15.5
Shares
Jan-17 (M)
19.2
82.8
39.6
8.9
15.1
78.6
10.4
2.6
1.9
2.9
Shares Chg
MoM (M)
-1.0
2.0
1.7
-0.4
-0.2
0.2
0.0
0.0
-0.1
-0.7
Shares Chg
MoM (%)
-4.9
2.5
4.4
-4.3
-1.0
0.3
-0.1
-1.7
-7.4
-18.9
Price Chg
MoM (%)
-5.6
-7.6
-10.6
-7.3
-8.4
-2.2
-13.6
-4.5
-8.8
3.7
%
AUM
0.8
0.7
0.5
0.2
0.2
1.2
0.1
0.2
0.1
0.1
Fund Folio: Indian Mutual Fund Tracker | February 2017
11

HDFC
ICICI Prudential
Reliance
SBI
Birla Sun Life
UTI
Franklin Templeton
DSP BlackRock
Kotak Mahindra
Axis
L&T
IDFC
Tata
Sundaram
Motilal Oswal
Mirae Asset
Canara Robeco
BNP Paribas
Principal
Invesco
IN ORDER OF EQUITY AUM, CLICK ON THE FUND NAME FOR DETAILS
FUNDS
SNAPSHOT
Fund Folio: Indian Mutual Fund Tracker | February 2017
12

HDFC:
Equity AUM INR809b
Top company holdings (%)
Jan-17
SBI
ICICI Bk
L&T
Infosys
HDFC Bk
Tata Steel
Maruti
Reliance Inds
Aurobindo
BOB
Chg MoM (pp)
6.0
-0.1
ICICI Prudential:
Equity AUM INR716b
Top company holdings (%)
Jan-17
HDFC Bk
ICICI Bk
Infosys
L&T
Sun Phara
Cipla
Bharti Airtel
Wipro
HCL Tech
NTPC
3.2
3.2
2.9
2.9
2.5
2.3
3.7
5.1
4.6
Chg MoM (pp)
7.0
-0.4
0.2
0.6
0.1
0.0
-0.1
0.3
0.0
-0.3
-0.1
Banks Pvt
Technology
Healthcare
Auto
Utilities
Consumer
Cap Goods
NBFC
Chemicals
Telecom
Weight (%)
Chg MoM (pp)
0.2
13.9
0.1
12.5
11.9
9.3
8.6
7.0
4.7
4.1
3.8
3.8
0.0
0.1
-0.8
-0.1
-0.3
0.2
0.1
0.4
Weight (%)
Back to
Snapshot
Top sector allocation (%)
Banks Pvt
Cap Goods
Banks PSU
Auto
Technology
Oil & Gas
Healthcare
Utilities
Chemicals
Metals
Top sector allocation (%)
Chg MoM (pp)
17.5
0.0
0.1
13.7
-0.3
10.9
0.0
9.3
7.0
6.9
6.4
5.4
3.4
3.0
-0.4
-0.1
0.0
0.5
0.0
0.3
5.9
-0.1
0.1
5.3
-0.4
4.2
0.1
3.9
0.3
2.8
0.1
2.8
2.6
2.0
2.0
-0.2
-0.1
0.0
Top change by market value
Company
Tata Steel
L&T
ICICI Bk
HDFC Bk
SBI
Maruti
ITC
TTMT-DVR
Power Grid
GAIL
Mkt Value Shares Chg
Chg (INR b)
('000)
3.83
673
3.69
579
3.11
2,771
2.88
746
2.68
3,085
2.10
-14
1.92
5,090
1.76
644
1.66
548
1.57
2,932
Top change in weight (%)
Chg MoM Current
Weight
(pp)
Tata Steel
0.28
2.84
GAIL
0.16
0.57
ITC
0.15
1.35
Crompton Gre. Cons
0.09
0.53
UPL
0.09
1.12
Power Grid
0.09
1.68
PNB
0.09
1.00
Federal Bk
0.09
0.72
TTMT-DVR
0.08
1.90
Cairn India
0.08
0.76
Company
Top change by market value
Company
Infosys
ICICI Bk
HDFC
Bharti Airtel
Axis Bk
L&T
SBI
Wipro
TCS
Sun Pharma
Mkt Value Shares Chg
Chg (INR b)
('000)
5.81
8,652
3.74
7,356
3.27
1,974
3.23
2,180
3.05
5,702
2.18
314
1.82
5,698
1.15
3,978
1.13
581
1.10
1,658
Top change in weight (%)
Company
Infosys
HDFC
Axis Bk
Bharti Airtel
ICICI Bk
SBI
Hero Moto
TCS
ACC
Nestle India
Chg MoM Current
(pp)
Weight
0.58
4.65
0.40
1.45
0.33
1.97
0.30
2.93
0.24
5.14
0.18
1.40
0.14
0.22
0.13
0.55
0.13
0.29
0.11
0.14
Top scheme by NAV change
Scheme Name
HDFC Tax Saver Fund (G)
HDFC Infrastructure Fund (G)
HDFC Premier Multi-Cap Fund (G)
HDFC Mid-Cap Opportunities Fund (G)
HDFC Top 200 Fund (G)
Total AUM Equity AUM MoM NAV
(INR B)
(INR B)
Chg (%)
55.9
55.7
7.2
12.2
6.9
12.2
2.9
2.9
6.6
138.3
129.9
6.1
131.2
131.1
6.0
Top scheme by NAV change
Scheme Name
ICICI Pru Banking & Financial Services (G)
ICICI Pru Infrastructure Fund - (G)
ICICI Pru Top 100 Fund - (G)
ICICI Pru FMCG Fund - (G)
ICICI Pru Dynamic Plan (G)
Total AUM Equity AUM MoM NAV
(INR B)
(INR B)
Chg (%)
13.6
12.1
9.4
13.5
12.1
8.7
5.9
16.8
16.3
2.8
2.6
5.5
60.8
45.9
5.4
Fund Folio: Indian Mutual Fund Tracker | February 2017
13

Reliance:
Equity AUM INR620b
Top company holdings (%)
Jan-17
HDFC Bk
SBI
ICICI Bk
IOCL
ONGC
Infosys
L&T
Coal India
HCL Tech
GAIL
1.9
1.9
3.4
3.1
2.9
2.7
2.7
4.7
4.1
Chg MoM (pp)
5.6
-0.4
-0.6
-0.3
1.6
2.0
-0.4
-0.6
1.6
-0.3
0.8
Banks Pvt
Cap Goods
Oil & Gas
Auto
Healthcare
Technology
Banks PSU
NBFC
Consumer
Chemicals
6.4
5.9
5.8
5.0
4.3
4.2
8.1
SBI:
Equity AUM INR576b
Top company holdings (%)
Jan-17
HDFC Bk
Infosys
SBI
ITC
RIL
HDFC
Kotak Bk
ICICI Bk
L&T
Sun Pharma
4.1
3.5
3.3
3.2
3.1
2.6
2.4
2.3
1.9
Chg MoM (pp)
7.2
0.1
-0.1
0.2
0.2
0.1
0.2
0.0
0.3
0.2
-0.1
Banks Pvt
Healthcare
Auto
Technology
Consumer
NBFC
Oil & Gas
Cap Goods
Banks PSU
Chemicals
Chg MoM (pp)
14.9
-1.4
-0.8
13.2
10.0
4.5
-1.0
-1.4
-1.2
-0.7
1.1
-0.2
-0.4
Weight (%)
Back to
Snapshot
Top sector allocation (%)
Weight (%)
Top sector allocation (%)
Chg MoM (pp)
15.7
0.7
-1.0
10.5
0.2
10.4
-0.8
9.5
0.3
8.9
0.0
8.9
0.3
6.6
0.2
6.1
0.2
3.8
3.7
0.1
Top change by market value
Company
ONGC
IOCL
Coal India
GAIL
PFC
REC
Concor
HDFC Bank
Bharat Electronics
Tata Steel
Mkt Value Shares Chg
Chg (INR b)
('000)
13.42
64,511
11.45
27,983
10.78
34,318
5.95
11,862
3.61
27,100
3.25
21,152
2.81
2,302
2.67
422
2.33
1,018
1.99
1,117
Top change in weight (%)
Company
ONGC
IOCL
Coal India
GAIL
PFC
REC
Concor
Oil India
ICICI Pru. Life
Bharat Electronics
Chg MoM Current
(pp)
Weight
2.01
3.14
1.61
3.36
1.60
2.65
0.81
1.93
0.55
0.79
0.48
0.81
0.42
0.65
0.25
0.39
0.22
0.43
0.22
1.40
Top change by market value
Company
HDFC Bk
ICICI Bk
ITC
SBI
HDFC
RIL
Nestle India
L&T
Infosys
Tata Motors
Mkt Value Shares Chg
Chg (INR b)
('000)
4.19
1,309
2.94
8,777
2.76
6,365
2.64
7,364
2.43
870
2.28
2,715
2.25
400
1.99
805
1.37
3,425
1.36
1,289
Top change in weight (%)
Company
Nestle India
ICICI Bk
ITC
HDFC
SBI
L&T
Ramco Cements
Hero Moto
HDFC Bk
RIL
Chg MoM Current
(pp)
Weight
0.34
0.93
0.34
2.39
0.22
3.31
0.18
3.05
0.18
3.54
0.16
2.35
0.15
0.95
0.15
0.91
0.14
7.23
0.14
3.23
Top scheme by NAV change
Scheme Name
Reliance Diversified Power Sector (G)
Reliance Capital Builder Fund II - Sr.A (G)
Reliance Banking Fund - (G)
Reliance Small Cap Fund (G)
Reliance Tax Saver (ELSS) Fund - (G)
Total AUM Equity AUM MoM NAV
(INR B)
(INR B)
Chg (%)
16.1
15.6
9.6
4.6
4.0
9.1
23.3
22.2
7.4
28.8
27.6
6.7
63.8
62.7
6.4
Top scheme by NAV change
Scheme Name
SBI Magnum Comma Fund (G)
SBI Small & Midcap Fund (G)
SBI Banking & Financial Services Fund (G)
SBI Infrastructure Fund (G)
SBI Magnum Midcap Fund (G)
Total AUM Equity AUM MoM NAV
(INR B)
(INR B)
Chg (%)
2.7
2.6
9.7
6.4
6.2
6.8
3.3
3.1
6.6
5.3
5.0
6.4
32.0
28.4
5.6
Fund Folio: Indian Mutual Fund Tracker | February 2017
14

Birla Sun Life:
Equity AUM INR435b
Top company holdings (%)
Jan-17
HDFC Bk
Maruti
Infosys
ICICI Bk
Tata Motors
ITC
Kotak Bk
Yes Bk
IndusInd Bk
IOCL
3.0
2.7
2.7
2.3
2.3
2.3
2.3
2.3
2.0
Chg MoM (pp)
5.2
0.1
0.0
-0.3
0.0
0.1
-0.1
-0.1
0.2
0.1
0.5
Banks Pvt
Auto
NBFC
Healthcare
Consumer
Oil & Gas
Cap Goods
Technology
Chemicals
Cement
11.3
10.5
9.1
8.6
7.5
6.5
6.4
4.2
3.8
UTI:
Equity AUM INR411b
Top company holdings (%)
Jan-17
HDFC Bk
Infosys
ICICI Bk
ITC
IndusInd Bk
Maruti
Sun Pharma
RIL
TCS
Axis Bk
2.9
2.8
2.8
2.3
2.2
2.0
2.0
4.1
3.2
Chg MoM (pp)
6.0
0.1
-0.4
0.0
0.2
0.2
0.1
-0.1
-0.1
-0.2
-0.2
Banks Pvt
Auto
Technology
Consumer
Healthcare
Oil & Gas
NBFC
Cap Goods
Cement
Chemicals
16.9
0.2
0.2
0.1
-0.5
-0.4
0.8
-0.1
-0.9
0.1
0.4
Chg MoM (pp)
Weight (%)
Back to
Snapshot
Top sector allocation (%)
Weight (%)
Top sector allocation (%)
Chg MoM (pp)
17.7
0.4
0.2
14.6
-1.0
10.0
0.1
8.2
-0.5
7.8
6.6
6.5
6.2
4.8
2.8
0.0
0.0
0.2
0.1
0.1
Top change by market value
Mkt Value Shares Chg
Chg (INR b)
('000)
IOCL
2.88
5,860
HDFC Bk
2.58
968
Yes Bk
1.66
-19
Chola Invest.
1.47
1,278
IndusInd Bk
1.46
303
Vedanta
1.44
2,789
Maruti
1.34
14
HPCL
1.31
1,114
Tata Motors
1.12
298
Crompton Gre. Cons
1.05
-240
Company
Top change in weight (%)
Chg MoM Current
(pp)
Weight
IOCL
0.53
1.98
Chola Invest.
0.30
0.74
Vedanta
0.23
1.32
HPCL
0.21
1.23
Yes Bk
0.20
2.26
Hindalco
0.19
0.54
Tata Chemicals
0.16
0.74
Crompton Gre. Cons
0.16
1.05
Asian Paints
0.15
0.37
IndusInd Bk
0.15
2.25
Company
Top change by market value
Company
HDFC Bk
IndusInd Bk
ITC
Maruti
Kotak Bk
Yes Bk
UltraTech
HDFC
ICICI Bk
L&T
Mkt Value Shares Chg
Chg (INR b)
('000)
1.88
265
1.33
-8
1.30
2,192
1.23
21
1.22
1,142
0.97
-77
0.68
14
0.68
132
0.66
-57
0.59
69
Top change in weight (%)
Company
Kotak Bk
IndusInd Bk
Yes Bk
ITC
Maruti
HDFC Bk
UltraTech
Power Grid
Tata Motors
Eicher Motors
Chg MoM Current
(pp)
Weight
0.23
1.37
0.17
2.83
0.16
1.50
0.15
2.93
0.14
2.78
0.11
6.04
0.10
1.28
0.09
0.42
0.08
0.93
0.08
1.02
Top scheme by NAV change
Scheme Name
Birla Sun Life Banking & Financial Services (G)
Birla Sun Life Emerging Leaders Fund - Sr.6 (G)
Birla Sun Life Infrastructure Fund - (G)
Birla Sun Life Advantage Fund (G)
Birla Sun Life Small & Midcap Fund (G)
Total AUM Equity AUM MoM NAV
(INR B)
(INR B)
Chg (%)
8.7
8.4
11.2
2.3
2.3
10.1
5.1
5.1
8.9
23.9
23.2
8.4
4.5
4.0
7.6
Top scheme by NAV change
Total AUM Equity AUM MoM NAV
(INR B)
(INR B)
Chg (%)
UTI-Banking Sector Fund (G)
4.7
4.5
7.5
UTI-Infrastructure Fund (G)
14.5
14.3
7.3
UTI-Transportation & Logistics Fund (G)
9.4
8.6
6.2
UTI-Master Equity Plan Unit Scheme
16.8
16.7
6.2
UTI-Focussed Equity Fund-Sr.I (1100 Days)-Reg (G)
8.6
8.2
5.7
Scheme Name
Fund Folio: Indian Mutual Fund Tracker | February 2017
15

Franklin:
Equity AUM INR391b
Top company holdings (%)
Jan-17
HDFC Bk
ICICI Bk
Bharti Airtel
Axis Bk
SBI
Yes Bk
IndusInd Bk
Infosys
TTMT-DVR
M&M
Chg MoM (pp)
7.6
0.1
0.1
4.1
0.1
3.6
0.2
3.5
0.0
0.3
0.1
-0.3
0.1
0.1
DSP
BlackRock:
Equity AUM INR223b
Top company holdings (%)
Jan-17
HDFC Bk
SBI
IndusInd Bk
Maruti
ITC
ICICI Bk
BPCL
L&T
HPCL
Yes Bk
24.8
0.8
-0.1
-1.2
-0.2
-0.5
-0.1
0.1
0.2
0.4
0.1
Chg MoM (pp)
4.3
-0.2
-0.9
3.7
0.4
3.0
0.1
2.6
1.0
2.6
0.2
2.5
0.2
2.3
-0.3
0.5
0.4
Chg MoM (pp)
14.0
8.1
6.3
5.4
5.4
5.3
4.8
4.4
4.4
Weight (%)
Banks Pvt
Auto
Chemicals
Cap Goods
Oil & Gas
Healthcare
Banks PSU
Consumer
Metals
Textiles
5.4
5.2
4.8
4.8
6.4
Back to
Snapshot
Top sector allocation (%)
Weight (%)
Banks Pvt
Auto
Technology
Healthcare
Oil & Gas
Cap Goods
Consumer
Telecom
Banks PSU
Cement
Top sector allocation (%)
Chg MoM (pp)
13.7
0.5
9.1
8.8
8.7
8.0
0.5
0.0
0.0
-0.1
-0.6
-1.0
1.2
0.1
0.1
3.3
3.2
2.8
2.7
2.1
2.1
2.2
1.9
1.9
Top change by market value
Mkt Value Shares Chg
Chg (INR b)
('000)
HDFC Bk
2.15
248
Yes Bk
1.98
-172
Axis Bk
1.64
2,593
PNB
1.49
9,310
ICICI Bk
1.29
1,894
Bharti Airtel
1.23
-1,601
NTPC
1.03
5,597
Aditya Birla Fas.
0.94
3,576
IndusInd Bk
0.89
-356
Jubilant Foodworks
0.88
980
Company
Top change in weight (%)
Chg MoM Current
Weight
(pp)
PNB
0.36
0.72
Yes Bk
0.33
3.24
NTPC
0.24
0.60
Axis Bk
0.22
3.54
Jubilant Foodworks
0.21
0.40
Aditya Birla Fas.
0.16
1.41
Bajaj Auto
0.15
0.99
WABCO India
0.15
0.15
Techno Electric
0.14
0.14
JK Lakshmi Cement
0.10
0.43
Company
Top change by market value
Company
ITC
HPCL
IndusInd Bk
Ashok Leyland
Yes Bk
IOCL
J K Cements
ICICI Bk
GAIL
BPCL
Mkt Value Shares Chg
Chg (INR b)
('000)
2.40
8,413
1.33
1,507
1.31
481
1.30
13,097
1.08
313
0.81
1,629
0.78
1,085
0.74
1,803
0.70
1,351
0.69
532
Top change in weight (%)
Company
ITC
Ashok Leyland
HPCL
IndusInd Bk
Yes Bk
J K Cements
IOCL
GAIL
Coromandel Intl.
REC
Chg MoM Current
Weight
(pp)
0.96
2.57
0.55
0.94
0.50
1.94
0.41
3.04
0.38
1.88
0.35
0.35
0.31
1.12
0.28
0.80
0.21
0.57
0.19
0.19
Top scheme by NAV change
Scheme Name
Franklin Build India Fund (G)
Franklin India High Growth Companies Fund (G)
Franklin India Prima Fund - (G)
Franklin India Smaller Companies Fund (G)
Franklin India Opportunities Fund - (G)
Total AUM Equity AUM MoM NAV
(INR B)
(INR B)
Chg (%)
7.5
7.1
8.5
53.8
51.0
7.0
48.1
44.3
6.7
45.4
41.2
6.6
6.3
5.8
5.8
Top scheme by NAV change
Scheme Name
DSP BR India T.I.G.E.R. Fund (G)
DSP BR Equity Fund (G)
DSP BR Small And Mid Cap Fund (G)
DSP BR Opportunities Fund (G)
DSP BR Tax Saver Fund (G)
Total AUM Equity AUM MoM NAV
(INR B)
(INR B)
Chg (%)
13.9
13.6
8.8
22.1
22.0
8.4
27.6
25.7
7.5
14.8
14.0
7.3
17.2
16.6
6.9
Fund Folio: Indian Mutual Fund Tracker | February 2017
16

Kotak Mahindra
:
Equity AUM INR207b
Top company holdings (%)
Jan-17
HDFC Bk
ICICI Bk
IndusInd Bk
RIL
Axis Bk
ITC
SBI
Maruti
Hero Moto
Infosys
4.8
3.5
3.3
2.8
2.8
2.7
2.3
2.2
2.1
Chg MoM (pp)
9.8
1.1
-0.1
0.2
0.3
-0.5
0.1
0.0
-0.1
-0.1
-0.2
Axis:
Equity AUM INR162b
Top company holdings (%)
Jan-17
HDFC Bk
Kotak Mah Bk
Maruti
HDFC
Motherson
Tech Mah
Chola Invest.
Pidilite Inds
Bajaj Finance
L&T
3.2
3.1
2.9
2.9
2.7
4.2
5.8
4.9
Chg MoM (pp)
7.7
-0.5
7.0
0.2
0.3
-0.4
-0.4
0.0
0.7
0.1
0.4
-0.6
Weight (%)
Auto
NBFC
Banks Pvt
Consumer
Cap Goods
Technology
Chemicals
Healthcare
Utilities
Oil & Gas
Back to
Snapshot
Top sector allocation (%)
Weight (%)
Banks Pvt
Auto
Oil & Gas
NBFC
Consumer
Cement
Cap Goods
Healthcare
Technology
Banks PSU
Chg MoM (pp)
25.6
0.7
0.2
11.1
0.1
10.5
0.3
0.2
-0.4
0.4
-0.4
-0.3
0.1
Top sector allocation (%)
Chg MoM (pp)
19.1
17.2
16.7
8.4
7.5
6.2
6.0
5.8
2.0
1.5
1.0
1.0
0.0
0.7
-0.4
-1.5
0.3
-1.3
0.0
0.2
7.2
7.0
6.5
5.7
5.1
4.6
4.0
Top change by market value
Company
HDFC Bk
RIL
IndusInd Bk
ICICI Bk
L&T
Ramco Cements
ITC
Divis Lab
GAIL
Ashok Leyland
Mkt Value Shares Chg
Chg (INR b)
('000)
4.09
2,259
1.16
1,279
1.07
213
0.78
1,026
0.76
386
0.74
-205
0.71
1,074
0.61
965
0.61
897
0.58
4,720
Top change in weight (%)
Company
HDFC Bk
Divis Lab
RIL
Ashok Leyland
L&T
Ramco Cements
IndusInd Bk
Motherson Sumi
GAIL
Eicher Motors
Chg MoM Current
(pp)
Weight
1.10
9.84
0.27
0.57
0.25
3.31
0.22
0.79
0.22
1.68
0.19
1.83
0.19
3.49
0.18
0.47
0.16
1.49
0.16
0.34
Top change by market value
Company
Chola Invest.
Kotak Mah Bk
Maruti
Bosch
Britannia
Bajaj Finance
V-Guard
Sundaram Fin.
Endurance Tech
Pidilite Inds
Mkt Value Shares Chg
Chg (INR b)
('000)
1.44
1,106
1.09
404
1.09
34
0.97
36
0.94
292
0.91
47
0.67
2,912
0.65
61
0.65
875
0.54
-67
Top change in weight (%)
Company
Chola Invest.
Britannia
Bosch
V-Guard
Bajaj Finance
Endurance Tech
Maruti
Sundaram Fin.
Bajaj Finserv
UPL
Chg MoM Current
(pp)
Weight
0.73
3.08
0.57
0.75
0.45
2.62
0.40
0.57
0.39
2.86
0.32
1.40
0.29
5.76
0.27
2.18
0.23
1.19
0.21
0.21
Top scheme by NAV change
Scheme Name
Kotak Emerging Equity Fund (G)
Kotak Midcap (G)
Kotak Tax Saver (G)
Kotak Select Focus Fund (G)
Kotak Opportunities (G)
Total AUM Equity AUM MoM NAV
(INR B)
(INR B)
Chg (%)
7.6
13.1
12.4
5.2
4.9
7.0
5.2
5.1
6.5
78.5
72.3
6.3
11.6
11.0
6.0
Top scheme by NAV change
Scheme Name
AXIS Focused 25 Fund (G)
AXIS Equity Fund (G)
AXIS Long Term Equity Fund (G)
AXIS Midcap Fund (G)
AXIS Small Cap Fund (G)
Total AUM Equity AUM MoM NAV
(INR B)
(INR B)
Chg (%)
10.0
9.5
5.2
19.4
18.7
5.0
111.4
104.1
4.7
11.6
11.1
4.7
3.5
3.3
4.0
Fund Folio: Indian Mutual Fund Tracker | February 2017
17

L&T:
Equity AUM INR134b
Top company holdings (%)
Jan-17
ICICI Bk
HDFC Bk
ITC
L&T
SBI
Infosys
Ramco Cem.
ICICI Pru. Life
IndusInd Bk
Federal Bk
1.7
1.7
1.6
Chg MoM (pp)
3.7
0.0
3.2
-1.2
2.9
2.6
2.4
2.3
2.1
0.1
-0.1
-0.1
-0.5
0.5
0.3
0.0
0.1
Banks Pvt
Cap Goods
Cement
Metals
Oil & Gas
Auto
NBFC
Technology
Consumer
Banks PSU
IDFC:
Equity AUM INR108b
Top company holdings (%)
Jan-17
HDFC Bk
Maruti
RIL
Castrol
Asian Paints
Ashok Ley.
Bharat Fin.
GSPL
Voltas
KMB
2.6
2.3
2.0
1.9
1.9
1.9
1.9
1.8
1.8
Chg MoM (pp)
4.4
1.0
0.1
1.1
0.0
-0.2
0.3
-0.3
0.0
-0.4
0.0
Weight (%)
Chg MoM (pp)
Weight (%)
Auto
Banks Pvt
NBFC
Cap Goods
Consumer
Oil & Gas
Healthcare
Chemicals
Textiles
Cement
4.9
3.9
3.8
5.6
12.7
-1.4
-0.1
9.4
0.1
8.7
1.2
7.0
0.3
6.8
-0.3
6.0
-0.2
5.3
-1.3
5.2
-0.1
5.2
4.8
0.4
Back to
Snapshot
Top sector allocation (%)
Chg MoM (pp)
11.3
0.9
10.7
0.2
9.9
9.5
7.6
6.7
0.6
-0.5
-0.5
1.0
-0.9
-0.3
-0.7
0.2
Top change by market value
Company
Ramco Cem.
Skipper
NTPC
GAIL
Sterlite Tech
ICICI Pru. Life
IOCL
Tata Steel
Techno Electric
ICICI Bk
Mkt Value Shares Chg
Chg (INR b)
('000)
0.83
350
0.72
4,636
0.66
3,627
0.61
1,138
0.55
4,440
0.54
857
0.54
1,081
0.54
645
0.50
1,009
0.47
831
Top change in weight (%)
Chg MoM Current
(pp)
Weight
Skipper
0.54
0.54
Ramco Cem.
0.45
2.14
NTPC
0.43
1.01
Sterlite Tech
0.41
0.41
GAIL
0.36
1.33
Union Bank of India
0.32
0.51
IOCL
0.31
1.25
Techno Electric
0.31
0.98
TTMT-DVR
0.30
0.56
Coromandel Intl.
0.30
0.37
Company
Top change by market value
Company
RIL
HDFC Bk
ICICI Pru. Life
Tata Motors
Max Financial
Hero Moto
Ent. Network
Ashok Leyland
Zee Ent.
L&T
Mkt Value Shares Chg
Chg (INR b)
('000)
1.19
1,176
1.17
720
0.60
1,361
0.43
698
0.43
729
0.42
131
0.36
470
0.36
1,464
0.22
308
0.21
116
Top change in weight (%)
Company
RIL
HDFC Bk
ICICI Pru. Life
Hero Moto
Max Financial
Tata Motors
Ent. Network
Ashok Leyland
RBL Bk
L&T
Chg MoM Current
(pp)
Weight
1.06
2.26
0.96
4.41
0.52
1.39
0.38
0.60
0.38
0.82
0.38
0.92
0.33
0.47
0.28
1.90
0.18
0.56
0.18
0.77
Top scheme by NAV change
Scheme Name
L&T Infrastructure Fund (G)
L&T Emerging Businesses Fund (G)
L&T Business Cycles Fund (G)
L&T India Value Fund (G)
L&T India Large Cap Fund (G)
Total AUM Equity AUM MoM NAV
(INR B)
(INR B)
Chg (%)
9.2
2.7
2.6
5.1
4.7
8.5
10.3
10.0
8.1
25.7
24.0
7.2
6.8
3.9
3.8
Top scheme by NAV change
Scheme Name
IDFC Sterling Equity Fund (G)
IDFC Infrastructure Fund (G)
IDFC Tax Advantage (ELSS) Fund (G)
IDFC Classic Equity Fund (G)
IDFC Premier Equity Fund (G)
Total AUM Equity AUM MoM NAV
(INR B)
(INR B)
Chg (%)
12.3
11.5
8.5
1.5
1.5
8.1
5.0
4.7
7.1
6.4
5.5
5.9
56.9
49.8
5.5
Fund Folio: Indian Mutual Fund Tracker | February 2017
18

Tata:
Equity AUM INR108b
Top company holdings (%)
Jan-17
HDFC Bk
ICICI Bk
Power Grid
Yes Bk
ITC
HCL Tech
Infosys
Tata Motors
Glenmark Ph.
SBI
Chg MoM (pp)
5.0
0.0
1.3
4.2
3.7
3.2
3.1
2.6
2.5
2.2
2.2
2.0
0.3
0.7
0.0
-0.3
-0.5
0.1
-0.1
0.0
Sundaram:
Equity AUM INR107b
Top company holdings (%)
Jan-17
Ramco Cem.
SRF
UPL
IGL
Bajaj Finserv
HDFC Bk
Arvind
Timken India
Fag Bearings
Sundaram Clay
2.1
2.0
1.9
1.9
1.9
1.7
1.6
1.6
1.3
Chg MoM (pp)
2.7
0.4
0.1
0.2
-0.1
0.1
-0.1
0.0
0.0
-0.1
0.0
Cap Goods
Auto
NBFC
Chemicals
Banks Pvt
Cement
Consumer
Textiles
Oil & Gas
Healthcare
Weight (%)
Chg MoM (pp)
15.6
1.7
-0.2
11.0
-0.5
-1.6
0.5
0.2
-0.6
-0.2
0.3
-0.1
Weight (%)
Back to
Snapshot
Top sector allocation (%)
Banks Pvt
Auto
Healthcare
Technology
Cement
Cap Goods
Consumer
Oil & Gas
Utilities
Infra
Top sector allocation (%)
Chg MoM (pp)
11.2
11.1
9.0
8.6
8.4
6.3
5.7
5.3
4.8
4.2
-0.4
-0.2
0.0
-0.1
-0.1
0.2
0.0
-0.3
-0.2
-0.3
7.9
7.3
6.8
6.7
6.5
6.3
5.7
4.8
Top change by market value
Mkt Value Shares Chg
Chg (INR b)
('000)
ICICI Bk
1.61
5,385
Yes Bk
0.94
302
Motherson Sumi
0.55
1,646
Power Grid
0.52
426
The Ramco Cements
0.36
41
Grasim Inds
0.36
395
GAIL
0.34
484
HDFC Bk
0.33
-15
PFC
0.30
2,185
Tata Motors
0.27
70
Company
Top change in weight (%)
Chg MoM Current
(pp)
Weight
ICICI Bk
1.30
4.20
Yes Bk
0.71
3.18
Motherson Sumi
0.50
0.58
Grasim Inds
0.33
0.37
PFS
0.26
0.49
The Ramco Cements
0.26
1.41
Power Grid
0.26
3.68
GAIL
0.20
1.90
BOB
0.20
0.55
Vedanta
0.18
0.57
Company
Top change by market value
Company
BSE
Ramco Cem.
PNB
BOB
UPL
L&T
Indian Bk
IOCL
Bajaj Finserv
SRF
Mkt Value Shares Chg
Chg (INR b)
('000)
1.39
1,728
0.60
-82
0.57
4,202
0.44
2,585
0.36
205
0.31
176
0.31
175
0.28
507
0.22
-1
0.20
-10
Top change in weight (%)
Company
BSE
PNB
Ramco Cem.
BOB
L&T
UPL
Indian Bk
IOCL
Bharti Airtel
GAIL
Chg MoM Current
(pp)
Weight
1.30
1.30
0.53
0.54
0.40
2.72
0.40
0.56
0.24
1.07
0.22
1.99
0.21
1.33
0.21
0.94
0.19
0.19
0.13
0.25
Top scheme by NAV change
Scheme Name
Tata Banking & Financial Services Fund (G)
Tata Mid Cap Growth Fund - (G)
Tata Infrastructure Fund (G)
Tata India Tax Savings Fund (G)
Tata India Consumer Fund (G)
Total AUM Equity AUM MoM NAV
(INR B)
(INR B)
Chg (%)
1.0
1.0
8.5
5.5
5.3
8.3
7.5
6.5
7.7
4.9
4.8
7.5
0.9
0.8
7.4
Top scheme by NAV change
Scheme Name
Sundaram Select Micro Cap - Sr.VII (G)
Sundaram Select Micro Cap - Sr.VI (G)
Sundaram Infrastructure Advantage Fund (G)
Sundaram Tax Saver (G)
Sundaram S.M.I.L.E Fund (G)
Total AUM Equity AUM MoM NAV
(INR B)
(INR B)
Chg (%)
1.5
1.4
8.9
8.9
2.8
2.7
5.8
5.6
7.5
13.8
13.5
7.1
10.9
10.7
7.0
Fund Folio: Indian Mutual Fund Tracker | February 2017
19

Motilal Oswal:
Equity AUM INR72b
Top company holdings (%)
Jan-17
HDFC Bk
IndusInd Bk
Max Fin.
RBL Bk
Eicher Motors
BPCL
Maruti
HPCL
Jubilant Life
Bajaj Finance
Chg MoM (pp)
7.5
6.9
5.9
5.7
5.5
5.1
5.0
4.7
4.6
4.0
-0.2
0.1
-0.5
0.4
0.4
0.2
0.0
0.3
0.1
0.2
Banks Pvt
Healthcare
Auto
NBFC
Oil & Gas
Consumer
Chemicals
Banks PSU
Technology
Cap Goods
3.0
2.9
1.6
1.3
Mirae Asset:
Equity AUM INR63b
Top company holdings (%)
Jan-17
ICICI Bk
IndusInd Bk
HDFC Bk
KMB
Tata Steel
Zee Ent.
HPCL
Exide Inds
GAIL
L&T
Chg MoM (pp)
5.1
0.6
0.5
4.2
0.3
4.0
3.0
2.8
2.6
2.4
2.4
2.4
2.3
0.0
0.3
0.3
0.0
0.0
-0.2
0.2
Chg MoM (pp)
20.7
0.3
-0.7
15.4
0.3
15.0
Weight (%)
Banks Pvt
Auto
Healthcare
Oil & Gas
Consumer
Technology
Cap Goods
NBFC
Chemicals
Textiles
Back to
Snapshot
Top sector allocation (%)
Weight (%)
Top sector allocation (%)
Chg MoM (pp)
19.2
2.0
11.8
9.7
8.6
7.3
6.0
5.8
4.5
3.6
2.9
-0.1
0.3
-0.3
-0.1
-1.3
-0.1
0.3
0.1
-0.3
10.6
10.4
7.6
0.2
0.7
0.7
-0.7
-0.3
-0.2
0.0
Top change by market value
Company
United Spirits
RBL Bk
Eicher Motors
HPCL
IndusInd Bk
PNB Hsg Fin
BPCL
Bajaj Finance
Jubilant Life
HDFC Bk
Scheme Name
Top change in weight (%)
Company
United Spirits
PNB Hsg Fin
RBL Bk
Eicher Motors
HPCL
IOCL
Ramco Cements
Bajaj Finance
BPCL
Bayer CropScience
Chg MoM Current
(pp)
Weight
0.69
2.76
0.46
2.67
0.38
5.73
0.35
5.50
0.32
4.73
0.25
0.54
0.22
1.17
0.21
4.00
0.17
5.07
0.14
0.91
Top change by market value
Company
ICICI Bk
IndusInd Bk
HDFC Bk
Tata Steel
Zee Ent.
Asian Paints
Vinati Organics
Axis Bk
L&T
Federal Bk
Mkt Value Shares Chg
Chg (INR b)
('000)
0.65
1,897
0.50
176
0.39
198
0.34
183
0.32
450
0.29
247
0.28
127
0.26
545
0.24
103
0.24
1,028
Top change in weight (%)
Company
ICICI Bk
IndusInd Bk
Axis Bk
Asian Paints
Vinati Organics
Tata Steel
Zee Ent.
HDFC Bk
IOCL
CESC
Chg MoM Current
(pp)
Weight
0.62
5.11
0.46
4.21
0.39
0.69
0.37
1.31
0.33
1.65
0.32
2.80
0.31
2.58
0.30
3.97
0.21
1.15
0.20
0.99
Mkt Value Shares Chg
Chg (INR b)
('000)
0.62
208
0.59
239
0.55
16
0.49
-73
0.49
-77
0.46
382
0.41
252
0.37
-202
0.35
247
0.32
-16
Top scheme by NAV change
Total AUM Equity AUM MoM NAV
(INR B)
(INR B)
Chg (%)
Motilal Oswal Most Focused Multicap 35 Fund (G)
49.4
49.3
7.6
Motilal Oswal Most Focused Long Term Fund (G)
2.5
2.5
7.0
Motilal Oswal MoSt Focused 25 Fund (G)
4.6
4.5
6.1
Motilal Oswal Most Focused Midcap 30 Fund (G)
12.2
12.2
5.3
Motilal Oswal Securities Limited is the Sponsor of Motilal Oswal Mutual Fund. The Sponsor is not responsible or liable for any loss or
shortfall resulting from the operation of the Mutual Fund beyond the initial contribution made by it of an amount of Rs. 1 Lac towards setting
up of the Mutual Fund. Mutual fund investments are subject to market risks, read all scheme related documents carefully.
Top scheme by NAV change
Scheme Name
Mirae Asset Emerging Bluechip Fund (G)
Mirae Asset Tax Saver Fund (G)
Mirae Asset Great Consumer Fund (G)
Mirae Asset India Opportunities Fund (G)
Total AUM Equity AUM MoM NAV
(INR B)
(INR B)
Chg (%)
30.4
29.9
6.7
2.0
1.9
6.1
0.6
0.5
5.4
28.8
27.8
5.3
Fund Folio: Indian Mutual Fund Tracker | February 2017
20

Canara Robeco:
Equity AUM INR41b
Top company holdings (%)
Jan-17
HDFC Bk
Infosys
ICICI Bk
SBI
IndusInd Bk
IOCL
Britannia
UltraTech
HPCL
Bharat Forge
2.0
1.9
1.8
1.8
Chg MoM (pp)
3.9
0.0
2.8
2.5
2.5
2.5
2.2
0.0
0.0
-0.1
0.1
0.1
0.1
0.1
0.0
-0.1
BNP Paribas:
Equity AUM INR27b
Top company holdings (%)
Jan-17
HDFC Bk
ICICI Bk
IndusInd Bk
Federal Bk
Bharat Elect
Power Grid
PVR
ITC
Repco Home
Shriram City
2.7
2.7
2.5
2.4
2.3
3.0
3.8
4.7
4.4
Chg MoM (pp)
6.9
0.0
-0.1
0.7
0.2
0.2
0.2
0.0
0.0
0.3
-0.3
Banks Pvt
NBFC
Consumer
Cap Goods
Metals
Cement
Chemicals
Oil & Gas
Healthcare
Media
Chg MoM (pp)
0.5
13.6
-0.5
13.6
0.1
10.4
Weight (%)
9.2
7.3
7.0
6.3
5.8
4.7
4.6
4.3
4.1
Back to
Snapshot
Top sector allocation (%)
Weight (%)
Banks Pvt
Auto
Cap Goods
Consumer
Chemicals
Oil & Gas
Technology
Cement
Healthcare
NBFC
5.5
4.4
4.2
3.4
Top sector allocation (%)
Chg MoM (pp)
24.2
0.6
-0.9
-0.6
0.7
2.2
0.0
0.3
0.9
-1.9
-0.1
9.1
8.7
6.9
-0.3
0.3
0.0
-0.4
-0.2
-0.1
0.1
Top change by market value
Company
UPL
CESC
HCL Tech
Yes Bk
IndusInd Bk
UltraTech
Britannia
Kotak Mah Bk
IOCL
Ashoka Buildcon
Mkt Value Shares Chg
Chg (INR b)
('000)
0.21
225
0.14
193
0.14
173
0.12
0
0.12
3
0.11
4
0.11
16
0.10
83
0.10
-5
0.10
0
Top change in weight (%)
Company
UPL
CESC
HCL Tech
Future Retail
Yes Bk
Kotak Mah Bk
Vinati Organics
UltraTech
Britannia
TCI
Chg MoM Current
Weight
(pp)
0.44
1.39
0.34
0.34
0.30
0.76
0.20
0.66
0.20
1.72
0.16
1.44
0.16
0.16
0.15
1.94
0.15
1.95
0.14
0.70
Top change by market value
Mkt Value Shares Chg
Chg (INR b)
('000)
Tata Steel
0.37
797
IndusInd Bk
0.25
106
Vedanta
0.16
342
Yes Bk
0.14
70
Federal Bk
0.13
43
Bharti Airtel
0.13
244
Petronet LNG
0.12
320
HDFC Bk
0.11
-6
Ramkrishna Forgings
0.11
141
IOCL
0.11
222
Company
Top change in weight (%)
Chg MoM Current
(pp)
Weight
Tata Steel
1.36
1.36
IndusInd Bk
0.70
4.40
Vedanta
0.47
2.07
Yes Bk
0.46
1.22
Petronet LNG
0.40
1.26
Bharti Airtel
0.39
1.52
0.97
Ramkrishna Forgings
0.36
IOCL
0.34
1.14
Repco Home
0.26
2.36
Federal Bk
0.25
3.81
Company
Top scheme by NAV change
Scheme Name
Canara Robeco Emerging Equities (G)
Canara Robeco F.O.R.C.E. Fund (G)
Canara Robeco Infrastructure (G)
Canara Robeco Equity Diversified (G)
Canara Robeco Equity - Tax Saver (G)
Total AUM Equity AUM MoM NAV
(INR B)
(INR B)
Chg (%)
14.2
14.0
8.5
1.3
1.2
7.3
1.3
1.2
7.1
7.2
6.9
6.6
8.1
7.7
4.9
Top scheme by NAV change
Scheme Name
BNP Paribas Equity Fund (G)
BNP Paribas Mid Cap Fund (G)
BNP Paribas Dividend Yield Fund (G)
BNP Paribas Long Term Equity Fund (G)
Total AUM Equity AUM MoM NAV
(INR B)
(INR B)
Chg (%)
12.0
11.8
7.2
7.0
6.7
7.0
2.8
2.7
6.6
4.9
4.8
6.6
Fund Folio: Indian Mutual Fund Tracker | February 2017
21

Principal:
Equity AUM INR23b
Top company holdings (%)
Jan-17
HDFC Bk
Infosys
ICICI Bk
SBI
ITC
HPCL
Britannia
Tata Motors
Reliance Inds
Kotak Mah Bk
2.5
2.3
2.1
2.1
2.0
3.3
3.2
3.1
2.7
Chg MoM (pp)
4.3
-0.8
-0.5
0.2
0.0
0.0
0.2
0.1
0.1
-0.2
0.0
Banks Pvt
Auto
Consumer
Oil & Gas
Cement
Healthcare
Technology
Cap Goods
Banks PSU
NBFC
Invesco:
Equity AUM INR22b
Top company holdings (%)
Jan-17
HDFC Bk
Maruti
Sun Pharma
IndusInd Bk
HPCL
Tata Motors
Power Grid
Infosys
Hero Moto
Shriram Trans.
3.7
3.2
2.9
2.9
2.6
2.5
2.2
2.1
2.0
Chg MoM (pp)
7.3
0.0
0.4
-0.1
0.5
0.3
0.3
0.2
-0.2
0.0
0.0
Banks Pvt
Auto
Utilities
NBFC
Oil & Gas
Healthcare
Technology
Cap Goods
Consumer
Chemicals
Weight (%)
Chg MoM (pp)
14.6
-0.9
0.2
10.4
0.2
10.4
8.1
7.2
6.8
6.3
5.5
4.6
4.1
0.1
0.4
-0.5
-0.8
-0.1
0.0
-0.1
Weight (%)
Back to
Snapshot
Top sector allocation (%)
Chg MoM (pp)
18.1
-0.2
1.2
13.8
1.2
-1.9
0.7
-0.3
-0.5
0.2
-0.8
0.4
8.4
8.3
7.5
6.5
6.4
5.9
4.6
2.4
Top change by market value
Mkt Value Shares Chg
Chg (INR b)
('000)
Glenmark Pharma
0.09
104
HPCL
0.09
1
ICICI Bk
0.08
176
Hindalco
0.08
222
Bajaj Electricals
0.08
279
India Cements
0.08
-137
Chambal Fertilisers
0.07
920
Gujarat State Fert.
0.07
675
Natco Pharma
0.06
6
Yes Bank
0.05
3
Company
Top change in weight (%)
Chg MoM Current
(pp)
Weight
Glenmark Pharma
0.39
0.74
Chambal Fertilisers
0.33
0.33
Gujarat State Fert.
0.32
0.32
Bajaj Electricals
0.32
0.90
Hindalco
0.31
1.12
HPCL
0.25
2.49
BSE
0.22
0.22
India Cements
0.22
2.02
Asian Granito India
0.22
0.22
Idea Cellular
0.20
0.20
Company
Top change by market value
Company
Reliance Inds
IndusInd Bk
Maruti
RBL Bk
JSW Energy
Max Financia
HPCL
Tata Motors
GAIL
Exide Inds
Mkt Value Shares Chg
Chg (INR b)
('000)
0.12
119
0.12
46
0.12
8
0.12
235
0.11
1,767
0.10
181
0.09
-21
0.08
49
0.08
140
0.07
346
Top change in weight (%)
Company
Reliance Inds
RBL Bk
IndusInd Bk
Max Financial
JSW Energy
Maruti
Exide Inds
GAIL
HPCL
Tata Motors
Chg MoM Current
(pp)
Weight
0.57
0.57
0.50
1.39
0.47
2.90
0.47
0.60
0.46
1.40
0.42
3.72
0.32
0.47
0.32
1.04
0.30
2.87
0.28
2.64
Top scheme by NAV change
Scheme Name
Principal Emerging Bluechip Fund (G)
Principal Tax Saving Fund
Principal Growth Fund - (G)
Principal Dividend Yield Fund (G)
Principal Large Cap Fund (G)
Total AUM Equity AUM MoM NAV
(INR B)
(INR B)
Chg (%)
7.4
7.1
7.9
2.8
2.7
6.9
4.1
3.8
6.8
1.1
1.1
6.4
3.0
2.9
5.8
Top scheme by NAV change
Scheme Name
Invesco India Mid Cap Fund (G)
Invesco India Mid N Small Cap Fund (G)
Invesco India Banking Fund (G)
Invesco India PSU Equity Fund (G)
Invesco India Dynamic Equity Fund (G)
Total AUM Equity AUM MoM NAV
(INR B)
(INR B)
Chg (%)
1.5
1.4
7.1
4.4
4.2
7.1
6.9
0.9
0.9
0.9
0.9
6.8
1.6
1.4
6.4
Fund Folio: Indian Mutual Fund Tracker | February 2017
22

Motilal Oswal Securities Limited
MEMBER OF BSE AND NSE
Disclosures
Motilal Oswal Tower, Sayani Road, Prabhadevi, Mumbai 400 025, INDIA
BOARD: +91 22 3982 5500 | WEBSITE:
www.motilaloswal.com
This document has been prepared by Motilal Oswal Securities Limited (hereinafter referred to as Most) to provide information about the company (ies) and/sector(s), if any, covered in the report and may
be distributed by it and/or its affiliated company(ies). This report is for personal information of the selected recipient/s and does not construe to be any investment, legal or taxation advice to you. This
research report does not constitute an offer, invitation or inducement to invest in securities or other investments and Motilal Oswal Securities Limited (hereinafter referred as MOSt) is not soliciting any
action based upon it. This report is not for public distribution and has been furnished to you solely for your general information and should not be reproduced or redistributed to any other person in any
form. This report does not constitute a personal recommendation or take into account the particular investment objectives, financial situations, or needs of individual clients. Before acting on any advice or
recommendation in this material, investors should consider whether it is suitable for their particular circumstances and, if necessary, seek professional advice. The price and value of the investments
referred to in this material and the income from them may go down as well as up, and investors may realize losses on any investments. Past performance is not a guide for future performance, future
returns are not guaranteed and a loss of original capital may occur.
MOSt and its affiliates are a full-service, integrated investment banking, investment management, brokerage and financing group. We and our affiliates have investment banking and other business
relationships with a some companies covered by our Research Department. Our research professionals may provide input into our investment banking and other business selection processes. Investors
should assume that MOSt and/or its affiliates are seeking or will seek investment banking or other business from the company or companies that are the subject of this material and that the research
professionals who were involved in preparing this material may educate investors on investments in such business . The research professionals responsible for the preparation of this document may
interact with trading desk personnel, sales personnel and other parties for the purpose of gathering, applying and interpreting information. Our research professionals are paid on twin parameters of
performance & profitability of MOSt.
MOSt generally prohibits its analysts, persons reporting to analysts, and members of their households from maintaining a financial interest in the securities or derivatives of any companies that the
analysts cover. Additionally, MOSt generally prohibits its analysts and persons reporting to analysts from serving as an officer, director, or advisory board member of any companies that the analysts
cover. Our salespeople, traders, and other professionals or affiliates may provide oral or written market commentary or trading strategies to our clients that reflect opinions that are contrary to the opinions
expressed herein, and our proprietary trading and investing businesses may make investment decisions that are inconsistent with the recommendations expressed herein. In reviewing these materials,
you should be aware that any or all of the foregoing among other things, may give rise to real or potential conflicts of interest. MOSt and its affiliated company(ies), their directors and employees and
their relatives may; (a) from time to time, have a long or short position in, act as principal in, and buy or sell the securities or derivatives thereof of companies mentioned herein. (b) be engaged in any
other transaction involving such securities and earn brokerage or other compensation or act as a market maker in the financial instruments of the company(ies) discussed herein or act as an advisor or
lender/borrower to such company(ies) or may have any other potential conflict of interests with respect to any recommendation and other related information and opinions.; however the same shall have
no bearing whatsoever on the specific recommendations made by the analyst(s), as the recommendations made by the analyst(s) are completely independent of the views of the affiliates of MOSt even
though there might exist an inherent conflict of interest in some of the stocks mentioned in the research report Reports based on technical and derivative analysis center on studying charts company's
price movement, outstanding positions and trading volume, as opposed to focusing on a company's fundamentals and, as such, may not match with a report on a company's fundamental analysis. In
addition MOST has different business segments / Divisions with independent research separated by Chinese walls catering to different set of customers having various objectives, risk profiles, investment
horizon, etc, and therefore may at times have different contrary views on stocks sectors and markets.
Fund Folio: Indian Mutual Fund Tracker | February 2017

Unauthorized disclosure, use, dissemination or copying (either whole or partial) of this information, is prohibited. The person accessing this information specifically agrees to exempt MOSt or any of its affiliates or
employees from, any and all responsibility/liability arising from such misuse and agrees not to hold MOSt or any of its affiliates or employees responsible for any such misuse and further agrees to hold MOSt or any of its
affiliates or employees free and harmless from all losses, costs, damages, expenses that may be suffered by the person accessing this information due to any errors and delays. The information contained herein is based
on publicly available data or other sources believed to be reliable. Any statements contained in this report attributed to a third party represent MOSt’s interpretation of the data, information and/or opinions provided by that
third party either publicly or through a subscription service, and such use and interpretation have not been reviewed by the third party. This Report is not intended to be a complete statement or summary of the securities,
markets or developments referred to in the document. While we would endeavor to update the information herein on reasonable basis, MOSt and/or its affiliates are under no obligation to update the information. Also there
may be regulatory, compliance, or other reasons that may prevent MOSt and/or its affiliates from doing so. MOSt or any of its affiliates or employees shall not be in any way responsible and liable for any loss or damage
that may arise to any person from any inadvertent error in the information contained in this report. MOSt or any of its affiliates or employees do not provide, at any time, any express or implied warranty of any kind,
regarding any matter pertaining to this report, including without limitation the implied warranties of merchantability, fitness for a particular purpose, and non-infringement. The recipients of this report should rely on their own
investigations.
This report is intended for distribution to institutional investors. Recipients who are not institutional investors should seek advice of their independent financial advisor prior to taking any investment decision based on this
report or for any necessary explanation of its contents.
Most and it’s associates may have managed or co-managed public offering of securities, may have received compensation for investment banking or merchant banking or brokerage services, may have received any
compensation for products or services other than investment banking or merchant banking or brokerage services from the subject company in the past 12 months.
Most and it’s associates have not received any compensation or other benefits from the subject company or third party in connection with the research report.
Subject Company may have been a client of Most or its associates during twelve months preceding the date of distribution of the research report
MOSt and/or its affiliates and/or employees may have interests/positions, financial or otherwise of over 1 % at the end of the month immediately preceding the date of publication of the research in the securities mentioned
in this report. To enhance transparency, MOSt has incorporated a Disclosure of Interest Statement in this document. This should, however, not be treated as endorsement of the views expressed in the report.
Motilal Oswal Securities Limited is registered as a Research Analyst under SEBI (Research Analyst) Regulations, 2014. SEBI Reg. No. INH000000412
Pending Regulatory inspections against Motilal Oswal Securities Limited:
SEBI pursuant to a complaint from client Shri C.R. Mohanraj alleging unauthorized trading, issued a letter dated 29th April 2014 to MOSL notifying appointment of an Adjudicating Officer as per SEBI regulations to hold
inquiry and adjudge violation of SEBI Regulations; MOSL replied to the Show Cause Notice whereby SEBI granted us an opportunity of Inspection of Documents. Since all the documents requested by us were not covered
we have requested to SEBI vide our letter dated June 23, 2015 to provide pending list of documents for inspection.
List of associate companies of Motilal Oswal Securities Limited -Click
here to access detailed report
Analyst Certification
The views expressed in this research report accurately reflect the personal views of the analyst(s) about the subject securities or issues, and no part of the compensation of the research analyst(s) was, is, or will be directly
or indirectly related to the specific recommendations and views expressed by research analyst(s) in this report. The research analysts, strategists, or research associates principally responsible for preparation of MOSt
research receive compensation based upon various factors, including quality of research, investor client feedback, stock picking, competitive factors and firm revenues
Disclosure of Interest Statement
Companies where there is interest
Analyst ownership of the stock
No
Served as an officer, director or employee
No
Fund Folio: Indian Mutual Fund Tracker | February 2017

A graph of daily closing prices of securities is available at www.nseindia.com and
http://economictimes.indiatimes.com/markets/stocks/stock-quotes
Regional Disclosures (outside India)
This report is not directed or intended for distribution to or use by any person or entity resident in a state, country or any jurisdiction, where such distribution, publication, availability or use would be contrary to law, regulation or
which would subject MOSt & its group companies to registration or licensing requirements within such jurisdictions.
For Hong Kong: This report is distributed in Hong Kong by Motilal Oswal capital Markets (Hong Kong) Private Limited, a licensed corporation (CE AYY-301) licensed and regulated by the Hong Kong Securities and Futures
Commission (SFC) pursuant to the Securities and Futures Ordinance (Chapter 571 of the Laws of Hong Kong) “SFO”. As per SEBI (Research Analyst Regulations) 2014 Motilal Oswal Securities (SEBI Reg No.
INH000000412) has an agreement with Motilal Oswal capital Markets (Hong Kong) Private Limited for distribution of research report in Kong Kong. This report is intended for distribution only to “Professional Investors” as
defined in Part I of Schedule 1 to SFO. Any investment or investment activity to which this document relates is only available to professional investor and will be engaged only with professional investors.” Nothing here is an
offer or solicitation of these securities, products and services in any jurisdiction where their offer or sale is not qualified or exempt from registration. The Indian Analyst(s) who compile this report is/are not located in Hong Kong
& are not conducting Research Analysis in Hong Kong.
For U.S
Motilal Oswal Securities Limited (MOSL) is not a registered broker - dealer under the U.S. Securities Exchange Act of 1934, as amended (the"1934 act") and under applicable state laws in the United States. In addition MOSL
is not a registered investment adviser under the U.S. Investment Advisers Act of 1940, as amended (the "Advisers Act" and together with the 1934 Act, the "Acts), and under applicable state laws in the United States.
Accordingly, in the absence of specific exemption under the Acts, any brokerage and investment services provided by MOSL, including the products and services described herein are not available to or intended for U.S.
persons.
This report is intended for distribution only to "Major Institutional Investors" as defined by Rule 15a-6(b)(4) of the Exchange Act and interpretations thereof by SEC (henceforth referred to as "major institutional investors"). This
document must not be acted on or relied on by persons who are not major institutional investors. Any investment or investment activity to which this document relates is only available to major institutional investors and will be
engaged in only with major institutional investors. In reliance on the exemption from registration provided by Rule 15a-6 of the U.S. Securities Exchange Act of 1934, as amended (the "Exchange Act") and interpretations
thereof by the U.S. Securities and Exchange Commission ("SEC") in order to conduct business with Institutional Investors based in the U.S., MOSL has entered into a chaperoning agreement with a U.S. registered broker-
dealer, Motilal Oswal Securities International Private Limited. ("MOSIPL"). Any business interaction pursuant to this report will have to be executed within the provisions of this chaperoning agreement.
The Research Analysts contributing to the report may not be registered /qualified as research analyst with FINRA. Such research analyst may not be associated persons of the U.S. registered broker-dealer, MOSIPL, and
therefore, may not be subject to NASD rule 2711 and NYSE Rule 472 restrictions on communication with a subject company, public appearances and trading securities held by a research analyst account.
For Singapore
Motilal Oswal Capital Markets Singapore Pte Limited is acting as an exempt financial advisor under section 23(1)(f) of the Financial Advisers Act(FAA) read with regulation 17(1)(d) of the Financial Advisors Regulations and is
a subsidiary of Motilal Oswal Securities Limited in India. This research is distributed in Singapore by Motilal Oswal Capital Markets Singapore Pte Limited and it is only directed in Singapore to accredited investors, as defined
in the Financial Advisers Regulations and the Securities and Futures Act (Chapter 289), as amended from time to time.
In respect of any matter arising from or in connection with the research you could contact the following representatives of Motilal Oswal Capital Markets Singapore Pte Limited:
Varun Kumar
Varun.kumar@motilaloswal.com
Contact : (+65) 68189232
Office Address:21 (Suite 31),16 Collyer Quay,Singapore 04931
Fund Folio: Indian Mutual Fund Tracker | February 2017

Quant Research & India Strategy Gallery