BSE SENSEX
28,893
S&P CNX
8,940
Jindal Steel & Power
CMP: INR117
TP: INR180(+54%)
Buy
New furnace to drive sharp turnaround
Global Ventures’ debt servicing improving; upgrade to Buy
Steel business to drive turnaround
27 February 2017
Update
| Sector:
Metals
Stock Info
Bloomberg
Equity Shares (m)
52-Week Range (INR)
1, 6, 12 Rel. Per (%)
M.Cap. (INR b)
M.Cap. (USD b)
Avg Val, INRm
Free float (%)
JSP IN
915
118/52
41/33/84
106.8
1.6
902.9
38.1
Jindal Steel & Power (JSP) is in advanced stages of commissioning a new 3mtpa
furnace, which would increase its total steelmaking capacity in India to 8mpta.
The new blast furnace would correct hot metal mix, reduce operating costs,
and leverage existing infrastructure to drive turnaround of its Angul plant.
Global Ventures (GV) comprises coking coal mines in Australia and
Mozambique, thermal coal mine in South Africa, and a profitable 2mtpa DRI-
EAF route steel plant in Oman.
Rising coking coal prices have led to a turnaround of the mines. With EBITDA
run-rate of ~USD130m, USD2b debt in GV is now serviceable.
3,400MW power capacity is now fully commissioned and capex is behind. We
expect EUP1 (1,000MW) to generate INR40b cash flow on asset sale in FY19.
EUP2 is highly valuable, as it secured 750MW long-term PPAs from Tamil Nadu
and Kerala at attractive gross margin when the market was tight.
The future of EUP3 (1,200MW) and merchant market remains uncertain due to
oversupply. Hence, we are not factoring material cash flows from these.
We expect standalone sales volume to grow at a CAGR of 31% to 5.8mt and
EBITDA to grow at a CAGR of 35% to INR52b over FY17-19. Our estimate of
4.5mt for FY18 is conservative relative to JSP’s guidance of 6mt; we have
factored in teething problems during startup of the new furnace. Consolidated
EBITDA would grow at a CAGR of 35% to INR52b over FY17-19.
There is a sharp turnaround in cash profits. Yet, adjusted PAT would be
negative due to bloated depreciation on massive asset revaluation in 1HFY17.
Global Ventures – USD2b debt now serviceable
Financials Snapshot (INR b)
Y/E Mar
2017E 2018E
209.1 254.2
Net Sales
44.8
60.9
EBITDA
-21.8
-16.0
PAT
-23.9
-17.5
EPS (INR)
31.1
-26.7
Gr. (%)
395.8 377.9
BV/Sh (INR)
-8.0
-4.5
RoE (%)
0.6
1.8
RoCE (%)
-4.9
-6.7
P/E (x)
0.3
0.3
P/BV (x)
2019E
313.4
78.3
-2.0
-2.2
-87.4
375.2
-0.6
3.7
-52.9
0.3
Attractive 750MW PPAs and EUP1 sale to boost cash flows
Shareholding pattern (%)
As On
Dec-16 Sep-16 Dec-15
Promoter
61.9
61.9
61.9
DII
1.8
1.8
3.6
FII
17.6
18.2
18.7
Others
18.7
18.1
15.8
FII Includes depository receipts
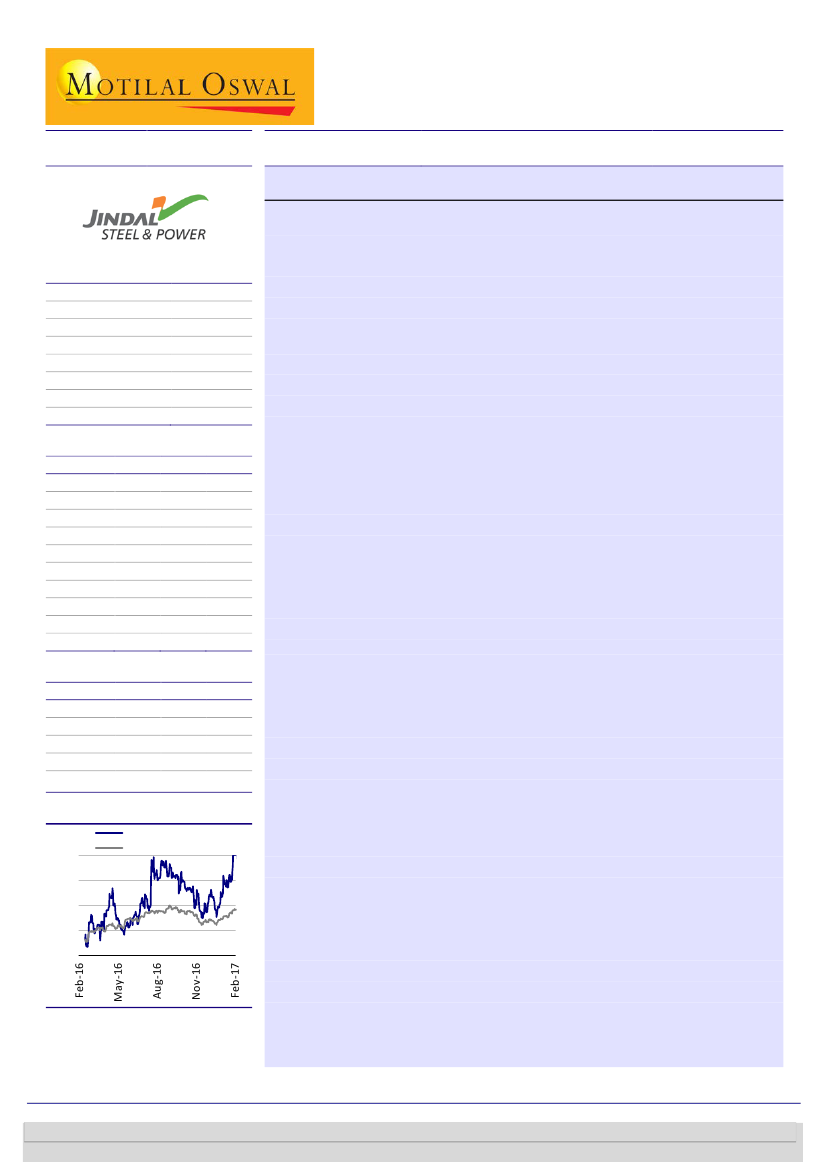
Stock Performance (1-year)
Jindal Steel
Sensex - Rebased
90
80
70
60
50
Sharp turnaround in cash profit, though asset revaluation impacting PAT
Upgrading to Buy, with a target price of INR180
The Angul site can accommodate much larger 12mtpa capacity, which implies
that new capacity addition would require low specific capex, shorter execution
cycle, and deliver superior IRR. The site is strategically located in an over-
supplied iron ore region and is close to ports.
While there are some risks (steel and coking coal prices, slower production
ramp-up) to our estimates, there could be upside if any of several anticipated
events (access to iron ore inventories at Sarda mines, captive iron ore mines in
auction, PPA for idle 1,500MW capacity, etc) play out.
We are raising our target price to INR180 (based on SOTP; earlier INR88 based on
replacement cost) and are upgrading our recommendation to
Buy.
Motilal Oswal research is available on www.motilaloswal.com/Institutional-Equities, Bloomberg, Thomson Reuters, Factset and S&P Capital.
Investors are advised to refer through important disclosures made at the last page of the Research Report.
Sanjay Jain
(SanjayJain@MotilalOswal.com); +91 22 6129 1523
Dhruv Muchhal
(Dhruv.Muchhal@MotilalOswal.com); +91 22 6129 1549

Jindal Steel & Power
Steel business to drive turnaround
New 3mtpa furnace to drive cost reduction and strong volume growth
JSP is in advanced stages of commissioning its new 3mtpa furnace, which would
increase its total steelmaking capacity in India to 8mpta.
Sales volume would grow at a CAGR of 31% over FY17-19.
Cost of production would decline on more favorable share of hot metal in mix.
We expect standalone EBITDA to grow at a CAGR of 35% over FY17-19.
New 3mtpa capacity in advanced stages of commissioning
Jindal Steel and Power (JSP) is in advanced stages of commissioning its new 3mtpa
BoF route steel plant expansion (1-A) at Angul at low additional capex of INR50b-
70b. It plans to commission various facilities in FY18 as per the following schedule:
1.9mtpa coke oven:
Light-up has already started. Full commissioning is planned
by the end of March 2017.
5mtpa sinter plant:
April 2017.
3
3.85mtpa (4,554m ) blast furnace:
April 2017.
Steel melt shop:
BoF is likely to be commissioned in August 2017. The existing
EAF would also be converted into BoF.
Caster:
2.3mtpa billet caster has already been commissioned on December 10,
2014. Another billet caster is planned to match capacities.
Rebar mill:
1.4mtpa capacity was commissioned during 1QFY17.
Exhibit 1: Expansion of capacity at Angul 1-A (revised configuration v/s original plan 1B)
Source: MOSL
1-A capex is lower because some of the downstream facilities (for example, 2.3mtpa
billet caster, 1.4mtpa rebar mill, etc) have already been commissioned and
capitalized in the books. Investment in BoF too has been reduced because only one
of the two BoF is being implemented initially. Modification of existing EAF into NEOF
(New Electric Oxygen Furnace - BoF equivalent) would partly compensate for the
postponed BoF. Though nameplate capacity would expand to 5mtpa, practical
saleable steel production might be capped at 3-3.5mtpa until further investment in
balancing facilities is done.
27 February 2017
2

Jindal Steel & Power
By-product gases to partially improve DRI’s viability
Steel making through DRI-Syn gas (coal gasification) route is unviable in the absence
of captive coal mines. Therefore, we expect that DRI production at Angul to remain
subdued, though coke oven gases would substitute synthetic gas to the extent of
25% and help reduce cost of production. The actual DRI production would hinge on
market conditions and cost of production.
Product mix challenges in achieving capacity utilization
Product mix is another challenge in ramping up volumes. Though the cost of
production of plates would be lower than Indian competition, JSP’s production
facilities are away from the demand center in western India. Strong export market
conditions are necessary for it to achieve targeted production. In the long product
segment, the competition is high from secondary steel producers. Yet, JSP would
have an edge because of economies of scale. We expect domestic demand to start
accelerating with time. In terms of pricing, long products have underperformed due
to economic slowdown in investment cycle. The presence of primary producers
(such as Tata, JSW, Essar, Bhushan) in long products is low. We believe JSP would
have a clear competitive advantage, as its new BoF gets commissioned.
High exposure to long
products and plates
Exhibit 2: Product Mix
Plates (%)
Rails/H beams (%)
Longs (%)
63
67
66
67
67
67
73
14
23
FY13
9
24
FY14
11
23
FY15
8
25
FY16
9
24
FY17E
8
24
FY18E
7
20
FY19E
Source: MOSL, Company
33% CAGR in steel production over two years
Tight liquidity and break-
downs impacted FY17
volumes
At 2.5mt, JSP’s production during 9MFY17 was below our estimate. Yet, it could
finish the year with total production of 3.5mt against capacity of 5mtpa in India
(Angul and Raigarh). There are primarily two reasons for the underperformance.
First, the DRI-syn gas plant is still not getting stabilized – suffered a major
breakdown during 1QFY17 – which would be rectified only after the new BoF is
commissioned in 2HFY18. Second, tight liquidity forced the management to move
away from low margin products to reduce working capital.
FY18 is likely to be similar to FY17, as liquidity remains tight and there would be
many operational challenges during the commissioning phase. We estimate 4.5mt
steel production against management guidance of 6mt for FY18. There might be
additional sale of pig iron, if the new blast furnace is commissioned on time.
We expect steel production to ramp up to 6mt in FY19, though nameplate capacity
would have increased to 8mtpa. Margins in the DRI process would remain volatile.
We are basing our estimates on hot metal and BoF availability. Steel sales volumes
are likely to grow at a CAGR of 31% to 5.8mt over FY17-FY19.
Factor in volume of 4.5mt
against guidance of 6mt for
FY18
Expect ~6mt production in
FY19
27 February 2017
3

Jindal Steel & Power
Exhibit 3: Standalone steel volumes
Sales (mt)
4.1
5.8
2.8
2.9
2.9
2.9
3.4
FY13
FY14
FY15
FY16
FY17E
FY18E
FY19E
Source: MOSL
Standalone EBITDA likely to
grow at a CAGR of 35% to
INR52b over FY17-19
Steel segment margins are likely to expand, driven by operating leverage and new
3mtpa BoF capacity at Angul. We expect EBITDA/t of INR8,000 and additional
benefits from continued sales of 2.8mt pellets. JSP reported EBITDA/t of ~INR7,800
(excluding EBITDA on pellet sales) in 3QFY17. We believe EBITDA/t of INR8,000 is
achievable and expect standalone EBITDA to grow at a CAGR of 35% to INR52b over
FY17-19. The key drivers of margins are: (1) higher steel prices, (2) dilution of
product mix, (3) higher coking coal prices, (4) lower benefit of iron ore integration,
and (5) major benefits on operating costs from new BoF.
Exhibit 4: Standalone EBITDA
45
37
37
24
29
EBITDA (INRb)
38
52
FY13
FY14
FY15
FY16
FY17E
FY18E
FY19E
Source: MOSL
27 February 2017
4

Jindal Steel & Power
Analyzing cost of production
New furnace to correct hot metal mix and reduce operating costs
High share of DRI in metallic is the key reason for high operating costs.
New blast furnace would partially correct hot metal mix and reduce CoP.
Benchmarking highlights flaws in technology selection
A comparison of JSP’s conversion cost and net sales realization (NSR) with JSW Steel
reveals that both companies have similar NSR despite complementary product mix.
JSP is mainly in longs and plates, while JSW Steel is in largely in flat products. JSP’s
conversion cost is much higher than JSW Steel’s. JSP has historically benefited from
lower raw material (RM) cost due to captive iron ore, coal mines, and attractive iron
ore supply arrangement with Sarda Mines. Once the supplies from Sarda iron ore
mines and captive coal mines got snapped, JSP’s RM cost advantage versus JSW
Steel disappeared and its margins came under pressure due to high conversion cost.
Therefore, it is important to understand the conversion process for JSP.
Exhibit 5: JSP’s conversion cost (UD/t)
395
Labor
344
355
255
240
266
185
108
27
79
25
65
24
48
23
223
60
26
210
69
29
218
63
27
309
P&F
308
Others
163
308
300
296
195
67
34
135
255
133
98
24
67
13
83
77
44
14
103
57
32
15
42
22
44
19
Exhibit 6: JSW Steel’s conversion cost (UD/t)
Labor
155 150
108
90
86
57
37
13
74
42
19
P&F
136
Others
156
140 133
85
41
14
75
47
11
152
134
260
92
92
210
58
32
84
38
12
47
17
47
13
Source: MOSL
Source: MOSL
Exhibit 7: JSP (USD/t)
EBITDA
536 570
648
490
232 369
733
582
RM
695
754
Net realization
684
601 631
481
Exhibit 8: JSW Steel (USD/t)
EBITDA
826
835
928
672
442 558
RM
840 858
Net realization
734
659 708
631 627
463
281 196
76
223
260 343
306
238
247 227
352
226
82
283
317
332
385
512 552
464
133 180
267 238 218 273 217 197
137 164
368 349
180 225 237 181 159 172 150 130 122 121
254
72
Source: MOSL
Source: MOSL
27 February 2017
5

Jindal Steel & Power
Analyzing reason behind high conversion cost
JSP had adopted the sponge iron process to capitalize on captive coal mines. Its
sponge iron (or DRI) capacity is 3.4mt, while its hot metal capacity is only 2.1mt. This
implies ~62% share of capacity of solid metallic. The operating cost through sponge
iron route is always much higher. The process in not competitive unless subsidized
by cheaper iron ore and thermal coal. The DRI-syngas route is even more expensive
because of addition of one more process (coal gasification). Coal gasification
requires heavy consumption of oxygen. Oxygen production is energy-intensive. After
commissioning of coal gasification plant at Angul, the power and fuel cost per ton of
steel production shot up in FY15 and FY16. Post loosing captive coal and iron ore
supply from Sarda mines, JSP has tried to maximize production of hot metal and
reduce sponge iron production in the mix. This has led to loss of capacity utilization
and increase in conversion cost.
New blast furnace to partially correct hot metal mix and reduce CoP
With the commissioning of new blast furnace, JSP would partly correct its hot metal
mix and possibly reduce conversion cost. At steel production of 6mt, the hot metal
mix can increase to 75-80% (from 48% in FY16). Therefore, we expect significant
reduction in operating costs, which would drive margins.
Share of hot metal in
metallic would increase
sharply from 48% in FY16 to
75-80% in FY19 on
commissioning of new blast
furnace
Exhibit 9:
Actual
share of DRI/Hot metal in production of metallic
DRI
Hot Metal
56
56
48
48
44
FY13
44
FY14
52
52
FY15
FY16
Source: MOSL, Company
27 February 2017
6

Jindal Steel & Power
Global Ventures – USD2b debt is now serviceable
Coking coal prices are key driver of turn around
Global Ventures (GV) comprises coking coal mines in Australia and Mozambique,
thermal coal mine in South Africa, and a profitable steel plant in Oman.
Rising coking coal prices have led to a turnaround of mines. With EBITDA run-
rate of ~USD130m, USD2b debt in GV is now serviceable.
Coking coal mines in Australia are producing 100ktpm. Cost of production has
reduced to USD60/t on FOB-Australia basis after cost-cutting measures. Permanent
staff count has been reduced from 460 to 60, and a lot of work has been
outsourced. It plans to restart Russel Vale mines using bord-and-pillar method of
mining (abandoning long wall) due to geographical challenges. Coal production is
expected to increase to 200-250kt. The coking coal has high ash content and is
priced at 40% discount to the benchmark index. Therefore, it is important that the
index remains above USD110/t for economic sustainability of the mines. Coal from
these mines is exported to the Angul steel plant for washing and use in blast
furnace. Coal washing machines would be relocated from Raigarh to Angul, as the
latter is closer to ports. We do not factor material profit from these mines.
Production is expected to ramp up at mines in Mozambique, as well. The quality of
coal is better than Australian mines; yet, it is priced at 20% discount to the
benchmark. The cost of production (including transportation and loading on ships) is
high at USD90/t. Therefore, the benchmark coking coal index needs to trade above
USD120/t for economic sustainability.
Oman steel plant is highly profitable because it has very attractive long-term gas
supply contracts. This steel plant too benefits from high coking coal prices, because
coking prices drive steel prices higher, while cost of gas remains unchanged for this
steel plant. It has recently forward integrated into rebar mill.
Oman steel plant is key
driver of GV’s EBITDA
Exhibit 10: Global Ventures
10
8
6
4
2
0
FY13
FY14
FY15
FY16
FY17E
FY18E
FY19E
Source: MOSL
2.6
4.9
3.5 3.4
0.6
3.4
Global Ventures
7.2
Oman
7.2
6.7
8.8 8.5
9.1
8.4
4.1
27 February 2017
7

Jindal Steel & Power
Jindal Power: Source of steady cash flows
Attractive 750MW PPA and EUP1 sale key drivers of cash flows
3,400MW capacity is now fully commissioned and capex is behind. We expect
EUP1 (1,000MW) to generate INR40b cash flow on asset sale in FY19.
EUP2 is highly valuable, as it secured 750MW long-term PPAs from Tamil Nadu
and Kerala at attractive gross margin when the market was tight.
The future of EUP3 (1,200MW) and merchant market remains uncertain due to
oversupply. Hence, we are not factoring material cash flows from these.
PV of cash flows is INR203b (EUP1=INR40b, EUP2=INR113b, EUP3=INR50b).
EUP1 (1,000MW) sale to drive home INR40b
JSP has signed an MoU with JSW Energy for the sale of its 1,000MW (4x250MW)
power plant, EUP1 at a valuation of INR40b-65b. The long stop date for this
transaction is June 2018. We believe JSP would be able to fetch only INR40b (by
FY19E) in view of oversupply in the sector.
EUP2 (1,200MW): Highly valuable 750MW PPAs
EUP2 is likely to generate
EBITDA of INR17b annually
EUP2 has been able to fetch three PPAs totaling 750MW from the states of Kerala
and Tamil Nadu, as it has coal linkages from Coal India. Profitability is high due to
low cost of generation and attractive rates secured during 2012-14, when the
southern region had supply shortage. The total supply commitment is 870MW,
which includes 120MW of concessional power to the home state of Chhattisgarh.
The average tariff is INR3.97/kwh and gross margin is INR2.68/kwh. The gross
margin in these PPAs is nearly double the gross margin for NTPC.
Exhibit 11: Long term PPAs
Project
Buyer
Period
From
Feb-14
Jun-16
Oct-17
To
Sep-28
May-41
Sep-42
PPA
(MW)
400
200
150
60
60
870
Total
4.91
3.60
4.29
1.06
1.06
3.97
Tariff (INR/kwh)
fuel
fixed
Transmission
coal logistic
charges
loss
0.69
0.17
4.05
0.35
0.17
0.69
0.17
2.74
0.35
0.13
0.69
0.17
3.43
0.35
0.15
0.69
0.17
0.20
0.69
0.17
0.20
Gross
Margin
3.53*
2.26
2.93
0.20
0.20
2.68
EUP2
EUP2
EUP2
EUP2
EUP3
Tamil Nadu*
KSEB
KSEB
Chhattisgarh
Chhattisgarh
Asset life
Note: fuel and transmission costs are scalable with CERC determined inflation index *structured
Source: MOSL/KSEB/TNGEDCO
According to our calculations, EUP2 should generate EBITDA of INR17b, annually.
The DCF value of these cash flows is about INR113b. If it is able to secure 325MW
PPA from UP where it is L2, the cash flows and DCF value would increase further.
However, we are not very optimistic about additional PPAs, because UP Electricity
Board is under fire from the regulator for buying expensive power in the past.
EUP3 (1,200MW): No PPA; so, no cash flows factored
We are valuing it at INR50b
based on replacement cost
EUP3 was not able to secure coal linkages until the last committee meeting.
Therefore, it has not been able to participate in long-term PPA bids. The future of
this capacity remains uncertain. We do not factor any cash flows from this unit in
our valuations. EUP3’s 600MW units, being more efficient, may be used for captive
supply to JSP’s steel plants. Smaller, less efficient captive power units might be shut.
8
27 February 2017

Jindal Steel & Power
Sharp turnaround in cash profit
Raising TP to INR180/share and upgrading to BUY
EBITDA to increase at cagr of 32% to INR78b over FY17-19E.
There is sharp turnaround in cash profits. Adj. PAT will still be negative due to
bloating of depreciation on massive revaluation of assets.
Target price raised to INR180/share (earlier INR88) based on SOTP. Although
there are some risks to our estimates, yet there may be upside if some the
highlighted events play out. Upgrading to BUY.
EBITDA to increase at cagr of 35%
We have reworked our model to incorporate commissioning of new blast furnace
and to introduce FY19E estimates. We expect consolidated EBITDA to increase at
cagr of 32% to INR78b over FY17-19E.
We expect steel sales volumes to increase at cagr of 31% to 5.8mt over FY17-
19E and standalone EBITDA to increase at cagr of 35% to INR52b.
GV is expected to contribute INR9b EBITDA in FY19E largely driven by Oman
steel plant.
Jindal Power will lose some revenue on sale of EUP1, but the EBITDA will
increase at cagr of 39% to INR17.3b over FY17-19E driven by full ramp up of
attractive 750MW PPAs.
Sharp turnaround in cash profit though asset revaluation impacting PAT
JSP has recently revalued its asset by INR209b to avoid fast depletion of net worth
on mounting losses. Although it has boosted net worth and reduced debt to equity
ratio, yet it has badly impacted the return ratios permanently. Despite sharp jump in
cash profit, the PAT and RoE will still be negative.
Exhibit 12: Sharp turnaround in cash profit
60
40
20
0
-20
-40
FY13
FY14
FY15
FY16
-2
-17
-22
FY17E
-16
FY18E
FY19E
Source: MOSL
50
35
37
19
6
5
Cash profit
33
13
Adj. PAT
30
45
The addition of new blast furnace is value accretive. It boosts volumes and reduces
cost of production. The capex on this piece of addition is low because investment on
infrastructure (land, captive power plants, RM handling plants, railway sidings,
oxygen plant, residential complex, R&R and other auxiliary services) and
downstream facilities (caster and rolling mills) is already incurred. The Angul site has
been prepared for 12mtpa capacity. This would drive growth at much lower
incremental capex. As a result, there is a turnaround in cash profit. We value the
steel business at 6.5x FY19E EBITDA and power business on DCF (PV of JPL’s FCFF).
The SOTP value is now revised to INR180/share. Earlier, we were valuing the
company at INR88/share based on replacement cost due to losses. We are
upgrading the stock to
Buy.
27 February 2017
9
Raising target price to INR180/share; upgrading to Buy

Jindal Steel & Power
Exhibit 13: Sum-of-the-parts valuation
YEAR
Steel Business
A. EBITDA
B. Target EV/EBITDA(x)
C. EV (AxB)
Jindal Power (JPL)
D. PV of JPL's FCFF
Consolidated
EBITDA
E. Enterprise Value (C+D)
F. Net Debt
G. CWIP
Equity Value (E-F+G)
Target price (INR/share)
FY13
47,773
FY14
40,941
FY15
37,618
FY16
27,810
FY17E
INR million
FY18E
FY19E
35,826 46,793 60,985
6.5
6.5
6.5
232,871 304,153 396,405
168,848 167,418 163,330
INR50b for EUP3 included
44,810 60,948 78,281
401,719 471,571 559,735
244,180 353,529 443,617 463,928 479,962 479,169 414,378
192,303 178,112 90,728 118,266 89,266 59,266 19,266
51,668 164,623
56
180
Source: MOSL
65,685
57,764
54,598
34,410
Exhibit 14: Net debt will decline in FY19E
Net Debt (INR b)
444
354
244
464
480
Exhibit 15: The leverage has peaked
EUP1 sale
and FCF
479
414
6.1
3.7
Net debt/EBITDA (x)
13.5
10.7
8.1
7.9
5.3
FY13
FY14
FY15
FY16
FY17E
FY18E
FY19E
FY13
FY14
FY15
FY16
FY17E
FY18E
FY19E
Source: MOSL
Source: MOSL
Estimates could see upside, if one or more of following events play out
If the Supreme Court permits, JSP may be able to access its iron ore inventories
from Sarda mines in Odisha. These are worth INR20b at market prices or
INR22/share.
Odisha and Jharkhand are likely to auction a number of iron ore mines over the
next three years because the leases of a large number of mines working on
deemed extension would expire at the end of FY20. JSP is likely to get some of
the mines at discount, which would help reduce its RM cost.
Of the 2,400MW power capacity, nearly 1,500MW capacity is sitting idle. Its
plants are located close to coal mines, have low transportation cost and are very
competitive. With the commissioning of high capacity HVDC transmission lines
to NR (Northern Regioni) and SR (Southern Region), the transmission
bottlenecks would disappear and allow it to sell power anywhere in the country.
With its competitive position, it has high chances of securing PPAs. Though the
market is oversupplied and it could take a long time for new PPAs to materialize,
there could be a positive surprise.
Coking coal mines may deliver better operating profit than our expectation.
27 February 2017
10

Jindal Steel & Power
Risks to our estimates
Possible collapse of steel and coking coal prices:
We believe continued liquidity
infusion by the Chinese government and various trade actions against Chinese
exports would keep margins in the steel business healthy. Coking coal prices too
are unlikely to collapse below USD120/t, as China is trying to curb pollution and
control coal prices by calibrating production.
Interest cost may rise on refinancing of USD2b debt in GV
New capacity may take longer than our expectation in view of adoption of new
technology to convert EAF into NEOF (equivalent of BoF).
INR million
FY18E
FY19E Remarks
254,227 313,370
215,106 284,926
176,984 246,323
4,063
5,794 new 3mtpa capacity at Angul
2,840
2,840 Assuming continues sales
39,375 39,375
1,500
1,500
1,250
1,250
1,672
2,153
400
400 Russelvale to use Bord and Pillar mining
-2,925 -2,925
39,120 28,444
EUP1 sold to JSW in FY19
11,609
7,595
60,948 78,281
46,793 60,985
38,014 51,859
9,356
8,951 includes pellets' margin
8,779
9,126
8,480
8,410
attractive gas supply contacts
5,654
5,607
835
1,145
-536
14,156
1.2
45,673
15,275
31,724
0
-16,449
-16,006
29,667
915
-17.5
-4.5
1.8
2.7
-429
17,295
2.3
47,044
31,237
33,702
0
-2,465
-2,022
45,022
915
-2.2
-0.6
3.7
5.5
Exhibit 16: Summary of financials
Y/E March
FY13
FY14
FY15
FY16
FY17E
Net sales
198,068 200,040 201,592 194,673 209,085
Steel business (incl. CPP)
172,971 175,473 169,312 164,523 178,861
Standalone
149,547 145,440 140,994 137,865 142,897
Steel sales (kt)
2,843
2,935
2,930
3,380
3,370
Pellet sales (kt)
2,112
2,035
411
962
2,840
Oman
29,012 32,621 31,243 26,439 30,369
HBI (kt) production
1,520
1,468
1,420
1,509
1,500
Steel (kt) sales
534
1,050
1,290
Wollongong (GNM)
466
1,065
2,039
Coking coal (kt)
171
304
240
Others
-5,588 -2,588 -3,391
-846
3,556
Jindal power
25,097 24,568 32,280 30,150 30,223
Sales (Mkwh)
7,411
7,568
8,969
8,730
8,753
EBITDA
65,685 57,764 54,598 34,410 44,810
Steel business (incl. CPP)
47,773 40,941 37,618 27,810 35,826
(a) Standalone
45,126 37,420 37,057 24,392 28,620
EBITDA/t of steel
15,872 12,747 12,646
7,216
8,493
(b) Global Venture
2,647
3,522
561
3,419
7,206
1. Oman
4,903
3,404
7,235
4,057
6,735
EBITDA/t of HBI
3,226
2,318
5,096
2,688
4,490
2. Wollongong (GNM)
-2,794
-196
1,141
EBITDA/t of coal
-644
3. Others
-2,256
117 -3,879
-442
-670
Jindal power
17,912 16,823 16,980
6,600
8,983
EBITDA (INR/kwh)
2.4
2.2
1.9
0.8
1.0
Depn. & Amortization
15,392 18,292 27,328 28,194 40,477
EBIT
50,293 39,472 27,270
6,216
4,333
Net Interest
7,582 15,008 25,837 32,808 34,090
Other income
1,364
656
2,256
2,200
324
PBT before EO
44,076 25,120
3,689 -24,391 -29,433
Adjusted PAT
34,842 19,104
6,335 -16,662 -21,849
Cash Profit
50,235 37,396 32,782
4,769 13,186
No. of shares (m)
935
915
915
915
915
EPS (INR)
37.3
20.9
6.9
-18.2
-23.9
RoE
17.7
8.8
2.9
-8.5
-8.0
RoCE (pre-tax)
12.3
7.3
4.5
1.2
0.6
RoIC (pre-tax)
20.2
11.4
5.5
1.1
0.8
750MW PPAs are attractive
Asset revaluation inflating numbers
but, cash profit will rise sharply
Asset revaluation impacting RoE and…
…capital return ratios
Source: MOSL, Company
27 February 2017
11

Jindal Steel & Power
Financials and Valuations
Income Statement
Y/E Mar
Net Sales
Change (%)
EBITDA
EBITDA Margin (%)
Depreciation
EBIT
Interest
Other Income
Extraordinary items
PBT
Tax
Tax Rate (%)
Min. Int. & Assoc. Share
Reported PAT
Adjusted PAT
Change (%)
2012
182,086
38.9
68,868
37.8
13,865
55,003
3,600
1,419
-936
51,886
11,863
22.9
574
39,649
40,585
8.1
2013
198,068
8.8
65,685
33.2
15,392
50,293
7,582
1,364
-5,741
38,335
9,218
24.0
417
29,101
34,842
-14.2
2014
200,040
1.0
57,764
28.9
18,292
39,472
15,008
656
0
25,120
6,182
24.6
-140
19,104
19,104
-45.2
2015
201,592
0.8
54,598
27.1
27,328
27,270
25,837
2,256
-19,116
-15,428
-882
5.7
-1,738
-12,781
6,335
-66.8
2016
194,673
-3.4
34,410
17.7
28,194
6,216
32,808
2,200
-2,358
-26,750
-6,763
25.3
-980
-19,020
-16,662
-363.0
2017E
209,085
7.4
44,810
21.4
40,477
4,333
34,090
324
-6,257
-35,690
-5,441
15.2
-2,079
-28,106
-21,849
31.1
2018E
254,227
21.6
60,948
24.0
45,673
15,275
(INR Million)
2019E
313,370
23.3
78,281
25.0
47,044
31,237
31,724
0
0
-16,449
110
-0.7
-151
-16,006
-16,006
-26.7
33,702
0
0
-2,465
110
-4.5
-151
-2,022
-2,022
-87.4
Y/E Mar
Share Capital
Reserves
Net Worth
Minority Interest
Debt
Deferred Tax
Total Capital Employed
Gross Fixed Assets
Less: Acc Depreciation
Net Fixed Assets
Capital WIP
Goodwill on consolidation
Investments
Current Assets
Inventory
Debtors
Cash & Bank
Loans & Adv, Others
Curr Liabs & Provns
Net Current Assets
Total Assets
Balance Sheet
2012
935
180,176
181,111
3,071
170,908
11,920
367,010
223,301
58,360
164,940
136,520
918
3,776
143,922
35,795
13,068
1,492
93,567
83,066
60,856
367,010
2013
935
211,588
212,523
5,573
246,182
13,365
477,642
267,032
74,285
192,747
192,303
1,543
8,089
176,046
45,242
19,541
2,001
109,262
93,084
82,962
477,642
2014
915
225,191
226,105
10,802
363,682
14,727
615,316
466,646
122,687
343,959
178,112
5,930
3,418
209,301
48,812
17,724
10,153
132,612
125,405
83,896
615,316
2015
915
209,506
210,421
8,573
455,007
20,185
694,185
612,235
151,286
460,949
90,728
5,485
17,852
180,353
48,487
16,907
11,391
103,568
61,181
119,172
694,185
2016
915
180,556
181,471
8,003
470,132
13,477
673,082
627,116
178,233
448,883
118,266
5,485
3,577
159,182
32,360
14,292
6,204
106,326
62,310
96,872
673,082
2017E
915
361,214
362,129
5,923
495,132
13,477
876,660
681,116
218,710
462,406
89,266
214,312
3,577
171,905
34,943
15,467
15,169
106,326
64,805
107,099
876,660
2018E
915
344,806
345,720
5,772
495,132
13,482
860,106
736,116
252,383
483,732
59,266
202,312
3,577
183,581
42,487
18,806
15,962
106,326
72,362
111,219
860,106
(INR Million)
2019E
915
342,382
343,296
5,621
495,132
13,487
857,536
751,116
287,427
463,689
19,266
190,312
3,577
262,632
52,371
23,181
80,754
106,326
81,940
180,693
857,536
27 February 2017
12

Jindal Steel & Power
Financials and Valuations
Ratios
Y/E Mar
Basic (INR)
EPS
Cash EPS
Book Value
DPS
Payout (incl. Div. Tax.)
Valuation(x)
P/E
Price / Book Value
EV/Sales
EV/EBITDA
Dividend Yield (%)
Profitability Ratios (%)
RoE
RoCE
RoIC (pre-tax)
Turnover Ratios (%)
Asset Turnover (x)
Debtors (No. of Days)
Inventory (No. of Days)
Creditors (No. of Days)
Leverage Ratios (%)
Net Debt/Equity (x)
2012
43.4
57.6
193.7
1.6
3.8
2.7
0.6
1.5
4.0
1.4
25.2
17.2
26.5
0.5
26
72
58
0.9
2013
37.2
47.6
227.3
1.6
4.4
3.1
0.5
1.8
5.4
1.4
17.7
12.3
20.2
0.4
36
83
58
1.1
2014
20.9
40.7
247.1
1.6
7.9
5.6
0.5
2.3
8.0
1.4
8.8
7.3
11.4
0.3
32
89
90
1.6
2015
6.9
14.0
230.0
1.6
27.0
16.9
0.5
2.7
10.1
1.4
2.9
4.5
5.5
0.3
31
88
70
2.1
2016
-18.2
9.0
198.4
0.0
0.0
-6.4
0.6
2.9
16.6
0.0
-8.5
1.2
1.1
0.3
27
61
79
2.6
2017E
-23.9
11.2
395.8
0.0
0.0
-4.9
0.3
2.8
13.1
0.0
-8.0
0.6
0.8
0.2
27
61
78
1.3
2018E
-17.5
31.8
377.9
0.0
0.0
-6.7
0.3
2.3
9.6
0.0
-4.5
1.8
2.7
0.3
27
61
75
1.4
2019E
-2.2
48.6
375.2
0.0
0.0
-52.9
0.3
1.7
6.7
0.0
-0.6
3.7
5.5
0.4
27
61
72
1.2
Y/E Mar
Adjusted EBITDA
Non cash opr. exp (inc)
(Inc)/Dec in Wkg. Cap.
Tax Paid
Other operating activities
CF from Op. Activity
(Inc)/Dec in FA & CWIP
Free cash flows
(Pur)/Sale of Invt
Others
CF from Inv. Activity
Inc/(Dec) in Net Worth
Inc / (Dec) in Debt
Interest Paid
Divd Paid (incl Tax) & Others
CF from Fin. Activity
Inc/(Dec) in Cash
Add: Opening Balance
Closing Balance
Cash Flow Statement
2012
68,868
1,160
-20,385
-10,421
0
39,221
-60,604
-21,383
19
-4,138
-64,723
38
33,044
-1,925
-8,804
22,354
-3,148
4,640
1,492
2013
65,685
628
-23,207
-7,884
0
35,223
-84,012
-48,789
-3,405
-8,408
-95,825
0
75,274
-1,569
-12,593
61,111
509
1,492
2,001
2014
57,764
-2,456
12,816
-8,337
0
59,786
-141,525
-81,739
4,898
-3,809
-140,437
-3,986
115,838
-1,488
-21,563
88,802
8,152
2,001
10,153
2015
54,598
-21,600
-18,154
-3,393
0
11,451
-50,964
-39,513
-13,430
-970
-65,365
5
90,704
-1,448
-34,110
55,151
1,238
10,153
11,391
2016
34,410
-4,581
11,762
-170
0
41,422
-39,500
1,922
15,904
3,706
-19,889
0
9,230
-8
-35,941
-26,719
-5,187
11,391
6,204
2017E
44,810
-6,257
-1,263
5,441
0
42,731
-25,000
17,731
0
324
-24,676
0
25,000
0
-34,090
-9,090
8,965
6,204
15,169
2018E
60,948
0
-3,326
-105
0
57,517
-25,000
32,517
0
0
-25,000
0
0
0
-31,724
-31,724
793
15,169
15,962
(INR Million)
2019E
78,281
0
-4,682
-105
0
73,494
-15,000
58,494
0
40,000
25,000
0
0
0
-33,702
-33,702
64,792
15,962
80,754
27 February 2017
13

Disclosures
This document has been prepared by Motilal Oswal Securities Limited (hereinafter referred to as Most) to provide information about the company (ies) and/sector(s), if any, covered in the report and may be distributed by it
and/or its affiliated company(ies). This report is for personal information of the selected recipient/s and does not construe to be any investment, legal or taxation advice to you. This research report does not constitute an
offer, invitation or inducement to invest in securities or other investments and Motilal Oswal Securities Limited (hereinafter referred as MOSt) is not soliciting any action based upon it. This report is not for public distribution
and has been furnished to you solely for your general information and should not be reproduced or redistributed to any other person in any form. This report does not constitute a personal recommendation or take into
account the particular investment objectives, financial situations, or needs of individual clients. Before acting on any advice or recommendation in this material, investors should consider whether it is suitable for their
particular circumstances and, if necessary, seek professional advice. The price and value of the investments referred to in this material and the income from them may go down as well as up, and investors may realize losses
on any investments. Past performance is not a guide for future performance, future returns are not guaranteed and a loss of original capital may occur.
MOSt and its affiliates are a full-service, integrated investment banking, investment management, brokerage and financing group. We and our affiliates have investment banking and other business relationships with a some
companies covered by our Research Department. Our research professionals may provide input into our investment banking and other business selection processes. Investors should assume that MOSt and/or its affiliates are
seeking or will seek investment banking or other business from the company or companies that are the subject of this material and that the research professionals who were involved in preparing this material may educate
investors on investments in such business . The research professionals responsible for the preparation of this document may interact with trading desk personnel, sales personnel and other parties for the purpose of
gathering, applying and interpreting information. Our research professionals are paid on twin parameters of performance & profitability of MOSt.
MOSt generally prohibits its analysts, persons reporting to analysts, and members of their households from maintaining a financial interest in the securities or derivatives of any companies that the analysts cover.
Additionally, MOSt generally prohibits its analysts and persons reporting to analysts from serving as an officer, director, or advisory board member of any companies that the analysts cover. Our salespeople, traders, and
other professionals or affiliates may provide oral or written market commentary or trading strategies to our clients that reflect opinions that are contrary to the opinions expressed herein, and our proprietary trading and
investing businesses may make investment decisions that are inconsistent with the recommendations expressed herein. In reviewing these materials, you should be aware that any or all of the foregoing among other things,
may give rise to real or potential conflicts of interest. MOSt and its affiliated company(ies), their directors and employees and their relatives may; (a) from time to time, have a long or short position in, act as principal in, and
buy or sell the securities or derivatives thereof of companies mentioned herein. (b) be engaged in any other transaction involving such securities and earn brokerage or other compensation or act as a market maker in the
financial instruments of the company(ies) discussed herein or act as an advisor or lender/borrower to such company(ies) or may have any other potential conflict of interests with respect to any recommendation and other
related information and opinions.; however the same shall have no bearing whatsoever on the specific recommendations made by the analyst(s), as the recommendations made by the analyst(s) are completely independent
of the views of the affiliates of MOSt even though there might exist an inherent conflict of interest in some of the stocks mentioned in the research report
Reports based on technical and derivative analysis center on studying charts company's price movement, outstanding positions and trading volume, as opposed to focusing on a company's fundamentals and, as such, may not match with a report on a
company's fundamental analysis. In addition MOST has different business segments / Divisions with independent research separated by Chinese walls catering to different set of customers having various objectives, risk profiles, investment horizon,
etc, and therefore may at times have different contrary views on stocks sectors and markets.
Unauthorized disclosure, use, dissemination or copying (either whole or partial) of this information, is prohibited. The person accessing this information specifically agrees to exempt MOSt or any of its affiliates or employees
from, any and all responsibility/liability arising from such misuse and agrees not to hold MOSt or any of its affiliates or employees responsible for any such misuse and further agrees to hold MOSt or any of its affiliates or
employees free and harmless from all losses, costs, damages, expenses that may be suffered by the person accessing this information due to any errors and delays. The information contained herein is based on publicly
available data or other sources believed to be reliable. Any statements contained in this report attributed to a third party represent MOSt’s interpretation of the data, information and/or opinions provided by that third party
either publicly or through a subscription service, and such use and interpretation have not been reviewed by the third party. This Report is not intended to be a complete statement or summary of the securities, markets or
developments referred to in the document. While we would endeavor to update the information herein on reasonable basis, MOSt and/or its affiliates are under no obligation to update the information. Also there may be
regulatory, compliance, or other reasons that may prevent MOSt and/or its affiliates from doing so. MOSt or any of its affiliates or employees shall not be in any way responsible and liable for any loss or damage that may
arise to any person from any inadvertent error in the information contained in this report. MOSt or any of its affiliates or employees do not provide, at any time, any express or implied warranty of any kind, regarding any
matter pertaining to this report, including without limitation the implied warranties of merchantability, fitness for a particular purpose, and non-infringement. The recipients of this report should rely on their own
investigations.
This report is intended for distribution to institutional investors. Recipients who are not institutional investors should seek advice of their independent financial advisor prior to taking any investment decision based on this
report or for any necessary explanation of its contents.
Most and it’s associates may have managed or co-managed public offering of securities, may have received compensation for investment banking or merchant banking or brokerage services, may have received any
compensation for products or services other than investment banking or merchant banking or brokerage services from the subject company in the past 12 months.
Most and it’s associates have not received any compensation or other benefits from the subject company or third party in connection with the research report.
Subject Company may have been a client of Most or its associates during twelve months preceding the date of distribution of the research report
MOSt and/or its affiliates and/or employees may have interests/positions, financial or otherwise of over 1 % at the end of the month immediately preceding the date of publication of the research in the securities mentioned
in this report. To enhance transparency, MOSt has incorporated a Disclosure of Interest Statement in this document. This should, however, not be treated as endorsement of the views expressed in the report.
Motilal Oswal Securities Limited is registered as a Research Analyst under SEBI (Research Analyst) Regulations, 2014. SEBI Reg. No. INH000000412
Pending Regulatory inspections against Motilal Oswal Securities Limited:
SEBI pursuant to a complaint from client Shri C.R. Mohanraj alleging unauthorized trading, issued a letter dated 29th April 2014 to MOSL notifying appointment of an Adjudicating Officer as per SEBI regulations to hold inquiry
and adjudge violation of SEBI Regulations; MOSL replied to the Show Cause Notice whereby SEBI granted us an opportunity of Inspection of Documents. Since all the documents requested by us were not covered we have
requested to SEBI vide our letter dated June 23, 2015 to provide pending list of documents for inspection.
List of associate companies of Motilal Oswal Securities Limited -Click
here to access detailed report
Analyst Certification
The views expressed in this research report accurately reflect the personal views of the analyst(s) about the subject securities or issues, and no part of the compensation of the research analyst(s) was, is, or will be directly or
indirectly related to the specific recommendations and views expressed by research analyst(s) in this report. The research analysts, strategists, or research associates principally responsible for preparation of MOSt research
receive compensation based upon various factors, including quality of research, investor client feedback, stock picking, competitive factors and firm revenues
Jindal Steel & Power
Disclosure of Interest Statement
Analyst ownership of the stock
No
Served as an officer, director or employee -
No
A graph of daily closing prices of securities is available at www.nseindia.com and http://economictimes.indiatimes.com/markets/stocks/stock-quotes
Regional Disclosures (outside India)
This report is not directed or intended for distribution to or use by any person or entity resident in a state, country or any jurisdiction, where such distribution, publication, availability or use would be contrary to law,
regulation or which would subject MOSt & its group companies to registration or licensing requirements within such jurisdictions.
For Hong Kong:
This report is distributed in Hong Kong by Motilal Oswal capital Markets (Hong Kong) Private Limited, a licensed corporation (CE AYY-301) licensed and regulated by the Hong Kong Securities and Futures
Commission (SFC) pursuant to the Securities and Futures Ordinance (Chapter 571 of the Laws of Hong Kong) “SFO”. As per SEBI (Research Analyst Regulations) 2014 Motilal Oswal Securities (SEBI Reg No. INH000000412) has
an agreement with Motilal Oswal capital Markets (Hong Kong) Private Limited for distribution of research report in Kong Kong. This report is intended for distribution only to “Professional Investors” as defined in Part I of
Schedule 1 to SFO. Any investment or investment activity to which this document relates is only available to professional investor and will be engaged only with professional investors.” Nothing here is an offer or solicitation
of these securities, products and services in any jurisdiction where their offer or sale is not qualified or exempt from registration. The Indian Analyst(s) who compile this report is/are not located in Hong Kong & are not
conducting Research Analysis in Hong Kong.
For U.S.
Motilal Oswal Securities Limited (MOSL) is not a registered broker - dealer under the U.S. Securities Exchange Act of 1934, as amended (the"1934 act") and under applicable state laws in the United States. In addition MOSL is
not a registered investment adviser under the U.S. Investment Advisers Act of 1940, as amended (the "Advisers Act" and together with the 1934 Act, the "Acts), and under applicable state laws in the United States.
Accordingly, in the absence of specific exemption under the Acts, any brokerage and investment services provided by MOSL, including the products and services described herein are not available to or intended for U.S.
persons.
This report is intended for distribution only to "Major Institutional Investors" as defined by Rule 15a-6(b)(4) of the Exchange Act and interpretations thereof by SEC (henceforth referred to as "major institutional investors").
This document must not be acted on or relied on by persons who are not major institutional investors. Any investment or investment activity to which this document relates is only available to major institutional investors
and will be engaged in only with major institutional investors. In reliance on the exemption from registration provided by Rule 15a-6 of the U.S. Securities Exchange Act of 1934, as amended (the "Exchange Act") and
interpretations thereof by the U.S. Securities and Exchange Commission ("SEC") in order to conduct business with Institutional Investors based in the U.S., MOSL has entered into a chaperoning agreement with a U.S.
registered broker-dealer, Motilal Oswal Securities International Private Limited. ("MOSIPL"). Any business interaction pursuant to this report will have to be executed within the provisions of this chaperoning agreement.
The Research Analysts contributing to the report may not be registered /qualified as research analyst with FINRA. Such research analyst may not be associated persons of the U.S. registered broker-dealer, MOSIPL, and
therefore, may not be subject to NASD rule 2711 and NYSE Rule 472 restrictions on communication with a subject company, public appearances and trading securities held by a research analyst account.
For Singapore
Motilal Oswal Capital Markets Singapore Pte Limited is acting as an exempt financial advisor under section 23(1)(f) of the Financial Advisers Act(FAA) read with regulation 17(1)(d) of the Financial Advisors Regulations and is a
subsidiary of Motilal Oswal Securities Limited in India. This research is distributed in Singapore by Motilal Oswal Capital Markets Singapore Pte Limited and it is only directed in Singapore to accredited investors, as defined in
the Financial Advisers Regulations and the Securities and Futures Act (Chapter 289), as amended from time to time.
In respect of any matter arising from or in connection with the research you could contact the following representatives of Motilal Oswal Capital Markets Singapore Pte Limited:
Varun Kumar
Varun.kumar@motilaloswal.com
Contact : (+65) 68189232
Office Address:21 (Suite 31),16 Collyer Quay,Singapore 04931
JINDAL STEEL & POWER
27 February 2017
Motilal Oswal Tower, Level 9, Sayani Road, Prabhadevi, Mumbai 400 025
Phone: +91 22 3982 5500 E-mail: reports@motilaloswal.com
Motilal Oswal Securities Ltd
14