Power monthly
Generation up 3.5% YoY in
February
Sector Update | Utilities
Sector: Utilities - Power
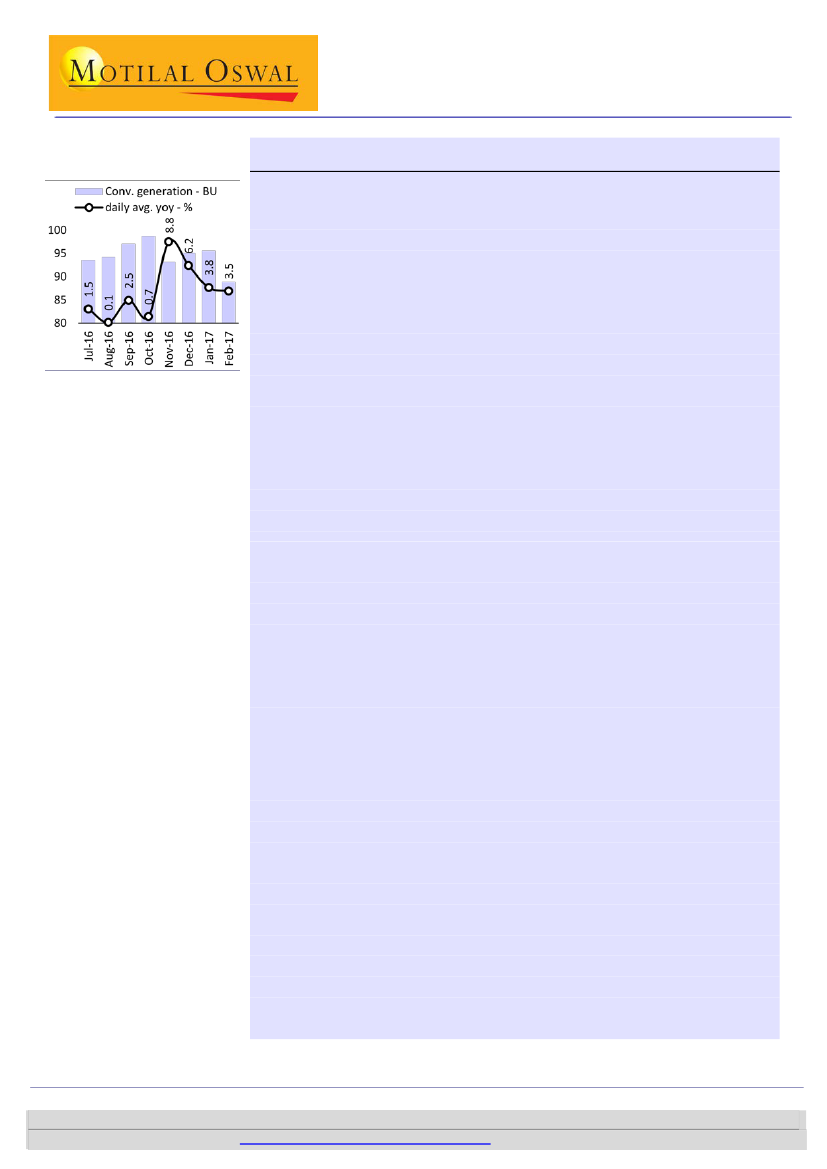
February 2017: daily avg. generation up 3.5% YoY
Quarter of incremental power demand met by RE in 10mFY17
Conventional daily avg. generation up 3.5% YoY in February (+4.6% YTD)
Conventional daily avg. power generation increased by 3.5% YoY in February
2016.
Generation growth was largely similar at ~3-4% YoY across central, state and
private sector plants. Overall coal based generation growth of 3.4% YoY was also
similar to the broader trend.
NTPC standalone’s coal-based generation was flat YoY (leap year adjusted) in
February. PLF for its coal-based plants was down 180bps YoY to 80%.
Generation increased 4.6% YoY to 1,052bkwh in 11mFY17.
RE generation grew 32% YoY in January (latest reported). Wind and Solar
generation was double YoY. RE generation is up ~27% YoY in 10mFY17.
Share of RE has increased to 6.8% for 10mFY17 against 5.7% last year. As share
of incremental generation RE represented a significant ~24% in 10mFY17.
Including RE all-India generation grew 6.3% YoY in 10mFY17.
There was 1.1GW capacity added in January. Six units of Teesta-III (1,000MW)
were commissioned. Capacity addition stood at 7.3GW (v/s 12.9GW same
period last year) in 10mFY17.
All-India PLF of conventional capacities declined by 125bp YoY to 50% in
February and by 55bp YoY to 50% in 11mFY17.
PLF of coal-based power plants was down 226bp YoY to 60% in February and
261bp YoY to 60% in 11mFY17.
In January, southern region consumption growth was the highest at ~8% led by
growth in Karnataka, AP and Telangana. UP also reported strong growth of
~16%.
In 10mFY17, UP (+13%), Karnataka (+11%) and TN (+11%) have reported the
highest growth.
Wind and Solar generation doubles YoY in January; RE share increasing
1.1GW capacity added in January, PLFs down 125bps YoY
Strong growth in consumption in southern regions in January
IEX: rates uptick marginally MoM; volume growth moderates
IEX all-India rates were up ~2% MoM to INR2.5/kWh, following ~8% MoM
increase in January. IEX volumes were up ~8% YoY (leap year adjusted).
JSW Energy: Vijaynagar PLF was up MoM to 78% in February, on back of 650MW
PPA with Karnataka. Ratnagiri’s PLF remains low at ~33% on shutdown.
CESC: Dhariwal’s PLF was at ~30%, largely unchanged MoM.
Rattan India: Plant is effectively shut for last eight months.
Merchant plants: JSW Vijaynagar’s PLF improves
Sanjay Jain
(SanjayJain@MotilalOswal.com); +91 22 3982 5412
Dhruv Muchhal
(Dhruv.Muchhal@MotilalOswal.com); +91 22 3027 8033
Investors are advised to refer through important disclosures made at the last page of the Research Report.
1
8 March 2017
Motilal Oswal research is available on
www.motilaloswal.com/Institutional-Equities,
Bloomberg, Thomson Reuters, Factset and S&P Capital.

Sector: Utilities - Power
Generation in February 2017
Daily avg. generation grew 3.5%; Coal based generation also grew at a similar rate
Conventional daily avg.
electricity generation
increased by 3.5% YoY in
February
Exhibit 1: All-India conventional electricity generation
Conventional generation - BU
change yoy - %
13
4
6
0
5
7
16
14
12 12 1213 10
686 5 7
536
4
2
1
12
6
-1
1
4
6
9
1
3
15
12
10
8
7
5
9
2021
6
4
0
Source: MOSL, CEA
Coal based generation,
adjusted for leap year, grew
by 3.4% YoY in February.
System PLF was down
125bps YoY to 50%. Coal-
based plants PLF was down
226bps YoY to 60%.
Exhibit 2: Conventional electricity generation by fuel source
Monthly
Feb-17
YoY %
Thermal
Generation
PLF
Capacity
Coal
Generation
PLF
Capacity
Lignite
Generation
PLF
Capacity
Gas
Generation
PLF
Capacity
Others
Generation
Capacity
Hydro
Generation
PLF
Capacity
Nuclear
Generation
PLF
Capacity
All India (conventional)
Generation
PLF
Capacity
MU
%
MW
MU
%
MW
MU
%
MW
MU
%
MW
MU
MW
MU
%
MW
MU
%
MW
MU
%
MW
79,455
55
-0.5
-196bps
Feb-16
857,902
62
201,119
784,042
62
169,752
30,979
67
5,860
42,523
22
24,454
358
994
114,392
33
42,721
33,826
73
5,780
1,006,120
50
249,621
Year to date
Feb-17
YTD YoY %
903,694
60
214,545
826,904
60
182,182
31,866
67
6,110
44,883
23
25,275
232
979
114,330
32
44,413
34,136
74
5,780
1,052,160
50
264,739
5.3
6.7
5.5
7.3
2.9
4.3
5.6
3.4
-35.2
-1.5
-0.1
4.0
0.9
0.0
4.6
6.1
Source: CEA
72,928
60
-0.2
-226bps
2,885
70
0.4
-607bps
3,634
21
-7.8
-177bps
8
979
6,601
22
-71.6
-1.5
8.4
164bps
2,839
73
-5.3
-145bps
88,895
50
-0.1
-125bps
8 March 2017
2

Sector: Utilities - Power
Exhibit 3: Conventional electricity generation by ownership - MU
Monthly
Feb-17
YoY %
32,289
-0.5
26,722
-0.9
23,304
-2.1
1,605
5.5
1,813
10.7
2,728
10.3
2,839
-5.3
27,115
0.1
23,585
-0.8
22,217
-0.5
1,159
0.2
209
-28.7
3,530
7.2
29,492
0.1
29,149
0.0
27,407
1.9
871
-31.2
870
-10.2
343
6.7
88,895
-0.1
18,694
-3.9
33.2
6bps
Year to date
Feb-17
YTD YoY %
395,010
5.7
306,078
6.9
269,081
5.8
18,043
22.6
18,954
9.5
54,819
2.1
34,113
0.8
319,218
1.1
272,449
2.3
256,014
2.6
13,525
0.7
2,910
-12.2
46,769
-5.6
337,811
6.8
325,116
6.5
301,746
7.6
13,338
-7.2
10,032
-3.1
12,695
13.8
1,052,039
4.6
215,704
3.0
32.1
66bps
Source: CEA
.
Private sector daily avg.
coal-based generation grew
by ~5% YoY in February.
NTPC S/A coal daily avg.
generation was broadly flat
YoY.
Central
Thermal
Coal
Gas
Other
Hydro
Nuclear
State
Thermal
Coal
Gas
Other
Hydro
Private
Thermal
Coal
Gas
Other
Hydro
Total
NTPC coal (s/a)
Private share %
A quarter of incremental
generation demand in
10mFY17 was met by RE.
Exhibit 4: All-India generation (Conventional + RE)
Jan-16
96,427
4,377
1,056
545
2,775
92,051
4.5
Monthly
Jan-17
YoY %
101,374
5.1
5,789
32.3
2,308
118.5
1,188
117.7
2,293
-17.4
95,586
3.8
5.7
117bps
28.5
Jan-16
972,659
55,519
29,487
5,727
20,305
917,140
5.7
Year to date
Jan-17
1,033,673
70,408
41,160
10,566
18,683
963,265
6.8
24.4
YTD YoY %
6.3
26.8
39.6
84.5
-8.0
5.0
110bps
All-India
RE
Wind
Solar
Others
Conventional
RE share %
RE incr. share %
Source: MOSL, Company
Capacity addition: Just 7.3GW in 10mFY17
Exhibit 5: Capacity addition as monitored by CEA
Month
Nov-16
Nov-16
Nov-16
Nov-16
Dec-16
Dec-16
Dec-16
Jan-17
Jan-17
Jan-17
Promoter
Sembcorp Gayatri
Others
Others
Singareni Collieries
NTPC
MAHAGENCO
WBPDCL
Namrup
Sikkim
NagarJuna Sagar
Plant
NCC
Ratija
Kashipur
Singareni TPP
Kudgi
Koradi
Sagardighi
Namrup
Teesta-III
NagarJuna Sagar
Unit
U-1
U-2
U-1
U-2
U-1
U-10
U-4
U-1
U1-6
U1-2
Type
Thermal
Thermal
Thermal
Thermal
Thermal
Thermal
Thermal
Thermal
Hydro
Hydro
Capacity MW
660
50
225
600
800
660
500
62
1,000
50
Location (State)
Andhra Pradesh
Chhattisgarh
Uttarakhand
Telangana
Karnataka
Maharashtra
West Bengal
Others
Sikkim
Telangana
Source: MOSL, Company
8 March 2017
3

Sector: Utilities - Power
Demand by states – January 2017
Strong demand growth continues in Southern regions
Exhibit 6: Electricity demand by states
Chandigarh
Delhi
Haryana
Himachal Pradesh
Jammu and Kashmir
Punjab
Rajasthan
Uttar Pradesh
Uttarakhand
Northern Region
Chhattisgarh
Gujarat
Madhya Pradesh
Maharashtra
Daman and Diu
Dadra and Nagar Haveli
Goa
Western Region
Andhra Pradesh
Telangana
Karnataka
Kerala
Tamil nadu
Puducherry
Lakshadweep
Southern Region
Bihar
DVC
Jharkhand
Odisha
West Bengal
Sikkim
Andaman And Nicobar
Eastern region
Arunachal Pradesh
Assam
Manipur
Meghalaya
Mizoram
Nagaland
Tripura
North Eastern Region
All India
Jan-17
113
1,935
3,449
770
1,284
3,001
6,073
8,610
1,077
26,312
1,809
8,495
6,306
10,983
195
500
317
28,605
4,557
4,831
6,078
1,967
7,883
183
4
25,503
1,961
1,604
674
2,092
3,458
54
15
9,858
64
709
71
151
48
65
104
1,212
91,490
YoY %
-2.6
-1.5
-5.4
0.3
-4.9
-2.3
-6.2
16.6
-2.5
1.7
-10.6
0.7
-0.8
-2.4
-1.5
-0.2
-27.0
-2.1
10.6
19.9
10.6
1.9
0.0
-3.2
0.0
7.8
-8.1
8.7
2.0
0.9
-0.5
38.5
0.0
-0.1
6.7
6.0
-9.0
-9.6
6.7
0.0
100.0
6.7
1.9
Jan-17
1,448
27,121
42,072
7,344
11,699
46,732
56,210
89,030
10,959
292,615
19,357
86,310
55,000
115,628
2,003
5,060
3,785
287,143
44,902
42,887
54,368
20,068
87,269
2,131
40
251,665
21,400
15,351
6,608
22,305
40,808
389
150
107,011
586
7,502
607
1,406
412
625
1,229
12,367
950,801
YTD YoY %
3.1
4.8
3.2
0.4
1.2
6.8
0.9
13.1
2.6
6.1
-7.9
0.0
8.5
-1.2
3.1
3.0
-11.6
0.3
8.9
4.0
10.4
6.0
10.7
6.0
0.0
8.7
8.2
0.0
4.9
0.9
3.9
20.4
0.0
3.6
24.2
7.4
-9.8
-1.4
10.5
1.1
30.9
7.7
4.7
Source: MOSL, CEA
8 March 2017
4

Sector: Utilities - Power
PLFs and incentives
JSW’s Vijaynagar PLF improves; Rattan India continues to struggle
Exhibit 7: PLFs (%) for private power plants with exposure to merchant market
MW Feb-16 Mar-16 Apr-16 May-16 Jun-16 Jul-16 Aug-16 Sep-16 Oct-16 Nov-16 Dec-16
Adani Power
11,040
Avantha
600
84
84
67
76
67
3
0
76
5
66
62
Mundra
4,620
80
83
71
73
79
79
69
85
65
41
26
Tirora
3,300
78
79
75
34
16
61
51
75
81
74
59
CESC
2,485
Dhariwal
600
24
26
34
31
26
25
28
32
29
34
24
JSW Energy
4,440
Karcham
1,000
15
16
22
75
108
106
98
73
34
21
16
Ratnagiri
1,200
87
93
87
94
69
70
72
69
71
67
39
Vijaynagar
860
100
101
100
90
32
20
27
46
50
61
49
Jindal Power
3,400
Tamnar 1
2,400
63
63
65
45
42
47
49
30
56
50
51
Tamnar 2
1,000
26
26
29
22
31
30
29
57
30
31
30
JP Power
4,200
Bina
500
68
1
0
2
0
0
0
15
5
48
58
Nigri
1,320
49
41
74
73
79
50
64
77
72
62
42
KSK
2,940
Akaltara
2,400
71
87
85
60
69
57
71
62
37
45
44
Wardha
540
35
30
35
22
30
25
34
31
32
31
30
Torrent Power
3,252
Sugen
1,148
52
43
49
63
70
59
55
62
57
42
70
Unosugen
383
44
0
0
0
0
0
0
0
0
0
35
DGEN
1,200
0
36
0
0
0
0
0
0
0
0
0
Essar
1,200
Mahan
600
0
0
1
55
48
63
29
38
47
62
70
Salaya
600
56
7
60
69
64
50
42
51
52
38
40
Rattan India
1,350
Amravati
1,350
59
59
50
42
51
0
0
7
5
19
0
Vedanta
4,980
Sterlite
2,400
41
39
42
30
42
34
40
32
47
46
55
Balco
600
90
79
76
51
60
59
53
50
30
69
67
South plants
3,260
Powertech
1,320
78
92
55
66
87
82
89
69
81
91
72
Meenakshi
300
64
72
94
49
85
51
58
42
38
40
36
Simhapuri
600
63
66
84
82
29
27
33
28
34
20
17
Hinduja
1,040
67
0
0
25
47
62
68
27
36
34
36
Green represents positive change YoY while Red represents a negative change YoY
Jan-17 Feb-17
70
63
80
31
14
32
63
46
31
20
65
68
29
90
22
0
71
54
0
35
69
88
75
86
28
14
33
78
46
31
41
60
81
31
79
26
0
49
59
0
22
75
62
91
34
31
3
0
36
55
Source: CEA
Low PLFs are likely to hurt
NTPC’s PLF incentive
income.
Exhibit 8: NTPC PLF incentive if they were to be calculated station wise – INR m
NTPC standalone implied PLF incentive - INR m
2,082
1,480
644
-107
Note: Actual incentives will be higher because they are calculated Unit wise.
Source: CEA
8 March 2017
5

Sector: Utilities - Power
Short-term power market
Marginal uptick in prices; Volumes support led by South
Adjusted for leap year,
volumes were up ~8% YoY
in February.
Exhibit 9: IEX cleared volumes and growth yoy
Cleared vols. - BU
change yoy - %
1510
24
1
-6
-17
2 7
0
-10 -7
-11 -14
6
0
1823
-6
9 11
26
16
28
37
25
393541
1
29
42
24
1411
25
4 10 4
Source: MOSL, IEX
Southern region continues
to drive growth, through
the momentum is slowing.
Exhibit 10: IEX southern region cleared volumes and growth yoy
South vols. - MU
800
600
45 33
400
-13
-22 6
-47 -56 -42 -40
-62 -34
-66
200
204
90
119
69 45 83
39
9
39
2 -7
-39
-48
change yoy - %
230
196
162
112
91
62
33 24 31 15 37
17
14
0
Source: MOSL, IEX
System average prices were
up ~2% MoM in February,
followed by ~8% increase
MoM in January.
Exhibit 11: IEX prices – INR/kWh
7.50
5.50
3.50
1.50
W1
S1
Source: MOSL, IEX
Inter-region transmission
volumes were up 9% YoY in
January 2017.
Exhibit 12: Inter-region transmission volumes – MU
WR-NR
WR-SR
Others
13 12 12 12
7 7 8 8 7 7 8 7 7
2 2 2 2 2 2 2 2 2 2 2 2 2 2
1 1 1 1 1 1 1 1
1
1 1 1 1 1 1 1 1
1 1
3 3 3 3 3 2 2 2 3 1 3 3 3 3 3 3 4 4 4 4 4 4 4 5 4 4 4 4 4 4 4 4 4 5
1
5
9 8 8 9
7 8
6
12 11
11
10 10 11 11
10 10 10 11 11 11
Source: MOSL, IEX
8 March 2017
6

Sector: Utilities - Power
Annexures
Exhibit 13: Transmission lines commissioned by Power Grid
Month
Apr-16
Apr-16
Apr-16
Apr-16
Apr-16
May-16
May-16
Jun-16
Jun-16
Jun-16
Jun-16
Jun-16
Jun-16
Jun-16
Jun-16
Jul-16
Jul-16
Aug-16
Aug-16
Aug-16
Aug-16
Sep-16
Sep-16
Sep-16
Sep-16
Sep-16
Sep-16
Oct-16
Oct-16
Nov-16
Dec-16
Dec-16
Dec-16
Jan-17
Jan-17
Jan-17
Line
LILO of Gaya - Varanasi line
LILO of Kadapa (Cuddapah) - Kolar at N.P. Kunta
LILO of Pune - Aurangabad at pune (GIS)
Lara STPS- Raigarh (Kotra) line
Panchkula- Patiala
LILO of Meerut - Kaithal at Baghpat (Ckt-II)
Roorkee - Saharanpur line (Quad) (Ckt-I)
Kanpur - Jhatikara
Varanasi- Kanpur
Jharkhand Pool (Chandwa)-Gaya (Quad) line
Kanpur - (new)- Kanpur (exit)
Baripada- Mendhasal at Pindiabil
Ranchi - Jharkhand Pool Line (Chandwa)
Roorkee- Saharanpur line (Ckt-II)
LILO OF GLADNI- Hiranagar at Sambha
LILO - IN Teesta- III- kishanganj at Rangoo
Line for swapping of Purnea bay with Sasaram bay at Biharshariff
Betul - khandwa (Quad) line
Khanwada - Indore line
Meja- Allahabad line
Sasaram-Allahbad line
Champa Pooling Station- Kurukshetra (HVDC) BIOPOLE Line
Jaipur (RVPNL) - Bhiwani (Iind Ckt) line
Srikakulam PP- Vemagiri- II Pooling Station (Vizag TL)
Essar Gujarat TPS - Bachau (Tripal)
LILO of one RAPP - Kankorli at Chittorgarh
Unchahar - Fatehpur line (Powergird Unchahar TL)
Nagapattinam Pooling Station - Salem (NMTCL)
Varanasi- Sarnath (Q)
Tuticorin Pooling Station- Salem Pooling Station
Srikakulam Pooling Station - Angul line
LILO of Gazuwaka- Vijaywada 400kv S/C line at vemagiri PS
Navsari -Boisor line (Balance portion)
LILO of existing Seoni -Bina at Gadawara STPP
Dehradun-Bagpat line(Q)
Sikar-Jaipur line
Voltage
765
400
400
400
400
400
400
765
765
765
400
400
400
400
220
400
400
400
400
400
400
800
765
765
400
400
400
765
400
765
765
400
400
765
400
400
Type
S/C
D/C
2XD/C
D/C
D/C
D/C
D/C
S/C
D/C
D/C
D/C
2xD/C
D/C
D/C
D/C
MC+D/C
D/C
D/C
D/C
D/C
D/C
BIOPOLE
S/C
D/C
D/C
D/C
D/C
D/C
D/C
D/C
D/C
D/C
D/C
D/C
D/C
D/C
Length
273
21
58
36
131
61
37
466
652
234
41
112
138
37
28
21
10
338
344
56
6
2574
277
668
446
28
107
406
213
731
552
38
161
16
330
339
Source: MOSL, Company
8 March 2017
7

Sector: Utilities - Power
Exhibit 14: Substations commissioned by Power Grid
Month
Apr-16
Apr-16
May-16
May-16
May-16
Jun-16
Jun-16
Jun-16
Jun-16
Jul-16
Jul-16
Jul-16
Aug-16
Aug-16
Sep-16
Sep-16
Sep-16
Sep-16
Sep-16
Sep-16
Sep-16
Sep-16
Oct-16
Oct-16
Nov-16
Dec-16
Dec-16
Jan-17
Jan-17
Jan-17
Substation
Mandola S/s (Aug.) ICT-II(Replacing 315 MVA with 500 MVA ICT
N.P. Kunta Pooling Station S/S (ICT-I)
Balipara (2nd Ckt)
Mandola S/s (Aug.) ICT-III (Replacement of 315 MVA by 500 MVA)
Saharanpur S/S
Pune (GIS) S/S
Bagpat (ICT-II) S/S
Julandhar (Extn.)
Pandiabil S/S (ICT-I & II)
Karupur (GIS) S/S
Jharkhand Pool (Chandwa) Switching GIS
N.P. Kunta Pooling Station S/S (ICT-II)
Biswanath Chariyali & Agra HVDC terminal (Pole-II)
Somanahalli S/S
Champa Pooling Station (ICT-III &IV)
Ballabhgarh s/s (Replacement of ICT-I & ICT-II)
Baraipada (Addl.)
Extn. At Mysore S/S
Kishanganj S/S (ICT-II)
Maithon S/S (Replacement of ICT-I) (500-315)
Patna (Replacement of ICT-I) (500-315)
Purnea S/S (Replacement of ICT-II) (300-315)
Mondala s/s (Aug) ICT -IV (replacing 315 MVA with 500 ICT)
Samba ( Extn.) S/S
Extn at 400/220 KV Damoh S/S
Champa Pooling Station (ICT-V &VI)
Extn. At Madurai s/s
Vemagiri Pooling Station (ICT-1)
Dehar s/s (Replacement)
Dehradun
Type
Capacity
400/220
185
400/220
500
400/220
315
400/220
185
400/220
630
765/400
3,000
400/220
500
400/220
1,000
400/220
1,000
765/400
3,000
400
0
400/220
1,000
800
1,500
400/200
500
765/400
3,000
400/220
370
400/220
500
400/220
500
400/220/33
500
400/220
185
400/220
185
400/220
185
400/220
185
400/220
315
400/220
500
765/400
3,000
400/220
500
765/400
630
400/220
1,500
400/220
65
Source: MOSL, Company
8 March 2017
8

Sector: Utilities - Power
NOTES
8 March 2017
9

Disclosures
This document has been prepared by Motilal Oswal Securities Limited (hereinafter referred to as Most) to provide information about the company (ies) and/sector(s), if any, covered in the report and
Utilities - Power
its
Sector:
may be distributed by it and/or
affiliated company(ies). This report is for personal information of the selected recipient/s and does not construe to be any investment, legal or taxation advice to you. This research report does not constitute an offer, invitation or
inducement to invest in securities or other investments and Motilal Oswal Securities Limited (hereinafter referred as MOSt) is not soliciting any action based upon it. This report is not for public distribution and has been furnished to
you solely for your general information and should not be reproduced or redistributed to any other person in any form. This report does not constitute a personal recommendation or take into account the particular investment
objectives, financial situations, or needs of individual clients. Before acting on any advice or recommendation in this material, investors should consider whether it is suitable for their particular circumstances and, if necessary, seek
professional advice. The price and value of the investments referred to in this material and the income from them may go down as well as up, and investors may realize losses on any investments. Past performance is not a guide for
future performance, future returns are not guaranteed and a loss of original capital may occur.
MOSt and its affiliates are a full-service, integrated investment banking, investment management, brokerage and financing group. We and our affiliates have investment banking and other business relationships with a some
companies covered by our Research Department. Our research professionals may provide input into our investment banking and other business selection processes. Investors should assume that MOSt and/or its affiliates are
seeking or will seek investment banking or other business from the company or companies that are the subject of this material and that the research professionals who were involved in preparing this material may educate investors
on investments in such business . The research professionals responsible for the preparation of this document may interact with trading desk personnel, sales personnel and other parties for the purpose of gathering, applying and
interpreting information. Our research professionals are paid on twin parameters of performance & profitability of MOSt.
MOSt generally prohibits its analysts, persons reporting to analysts, and members of their households from maintaining a financial interest in the securities or derivatives of any companies that the analysts cover. Additionally, MOSt
generally prohibits its analysts and persons reporting to analysts from serving as an officer, director, or advisory board member of any companies that the analysts cover. Our salespeople, traders, and other professionals or affiliates
may provide oral or written market commentary or trading strategies to our clients that reflect opinions that are contrary to the opinions expressed herein, and our proprietary trading and investing businesses may make investment
decisions that are inconsistent with the recommendations expressed herein. In reviewing these materials, you should be aware that any or all of the foregoingamong other things, may give rise to real or potential conflicts of interest.
MOSt and its affiliated company(ies), their directors and employees and their relatives may; (a) from time to time, have a long or short position in, act as principal in, and buy or sell the securities or derivatives thereof of companies
mentioned herein. (b) be engaged in any other transaction involving such securities and earn brokerage or other compensation or act as a market maker in the financial instruments of the company(ies) discussed herein or act as an
advisor or lender/borrower to such company(ies) or may have any other potential conflict of interests with respect to any recommendation and other related information and opinions.; however the same shall have no bearing
whatsoever on the specific recommendations made by the analyst(s), as the recommendations made by the analyst(s) are completely independent of the views of the affiliates of MOSt even though there might exist an inherent
conflict of interest in some of the stocks mentioned in the research report Reports based on technical and derivative analysis center on studying charts company's price movement, outstanding positions and trading volume, as
opposed to focusing on a company's fundamentals and, as such, may not match with a report on a company's fundamental analysis. In addition MOST has different business segments / Divisions with independent research
separated by Chinese walls catering to different set of customers having various objectives, risk profiles, investment horizon, etc, and therefore may at times have different contrary views on stocks sectors and markets.
Unauthorized disclosure, use, dissemination or copying (either whole or partial) of this information, is prohibited. The person accessing this information specifically agrees to exempt MOSt or any of its affiliates or employees from,
any and all responsibility/liability arising from such misuse and agrees not to hold MOSt or any of its affiliates or employees responsible for any such misuse and further agrees to hold MOSt or any of its affiliates or employees free
and harmless from all losses, costs, damages, expenses that may be suffered by the person accessing this information due to any errors and delays. The information contained herein is based on publicly available data or other
sources believed to be reliable. Any statements contained in this report attributed to a third party represent MOSt’s interpretation of the data, information and/or opinions provided by that third party either publicly or through a
subscription service, and such use and interpretation have not been reviewed by the third party. This Report is not intended to be a complete statement or summary of the securities, markets or developments referred to in the
document. While we would endeavor to update the information herein on reasonable basis, MOSt and/or its affiliates are under no obligation to update the information. Also there may be regulatory, compliance, or other reasons that
may prevent MOSt and/or its affiliates from doing so. MOSt or any of its affiliates or employees shall not be in any way responsible and liable for any loss or damage that may arise to any person from any inadvertent error in the
information contained in this report. MOSt or any of its affiliates or employees do not provide, at any time, any express or implied warranty of any kind, regarding any matter pertaining to this report, including without limitation the
implied warranties of merchantability, fitness for a particular purpose, and non-infringement. The recipients of this report should rely on their own investigations.
This report is intended for distribution to institutional investors. Recipients who are not institutional investors should seek advice of their independent financial advisor prior to taking any investment decision based on this report or for
any necessary explanation of its contents.
Most and it’s associates may have managed or co-managed public offering of securities, may have received compensation for investment banking or merchant banking or brokerage services, may have received any compensation
for products or services other than investment banking or merchant banking or brokerage services from the subject company in the past 12 months.
Most and it’s associates have not received any compensation or other benefits from the subject company or third party in connection with the research report.
Subject Company may have been a client of Most or its associates during twelve months preceding the date of distribution of the research report
MOSt and/or its affiliates and/or employees may have interests/positions, financial or otherwise of over 1 % at the end of the month immediately preceding the date of publication of the research in the securities mentioned in this
report. To enhance transparency, MOSt has incorporated a Disclosure of Interest Statement in this document. This should, however, not be treated as endorsement of the views expressed in the report.
Motilal Oswal Securities Limited is registered as a Research Analyst under SEBI (Research Analyst) Regulations, 2014. SEBI Reg. No. INH000000412
Pending Regulatory inspections against Motilal Oswal Securities Limited:
SEBI pursuant to a complaint from client Shri C.R. Mohanraj alleging unauthorized trading, issued a letter dated 29th April 2014 to MOSL notifying appointment of an Adjudicating Officer as per SEBI regulations to hold inquiry and
adjudge violation of SEBI Regulations; MOSL replied to the Show Cause Notice whereby SEBI granted us an opportunity of Inspection of Documents. Since all the documents requested by us were not covered we have requested to
SEBI vide our letter dated June 23, 2015 to provide pending list of documents for inspection.
List of associate companies of Motilal Oswal Securities Limited -Click
here to access detailed report
Analyst Certification
The views expressed in this research report accurately reflect the personal views of the analyst(s) about the subject securities or issues, and no part of the compensation of the research analyst(s) was, is, or will be directly or
indirectly related to the specific recommendations and views expressed by research analyst(s) in this report. The research analysts, strategists, or research associates principally responsible for preparation of MOSt research receive
compensation based upon various factors, including quality of research, investor client feedback, stock picking, competitive factors and firm revenues
Disclosure of Interest Statement
Analyst ownership of the stock
Served as an officer, director or employee
Companies where there is interest
No
No
A graph of daily closing prices of securities is available at www.nseindia.com and http://economictimes.indiatimes.com/markets/stocks/stock-quotes
Regional Disclosures (outside India)
This report is not directed or intended for distribution to or use by any person or entity resident in a state, country or any jurisdiction, where such distribution, publication, availability or use would be contrary to law, regulation or which
would subject MOSt& its group companies to registration or licensing requirements within such jurisdictions.
For Hong Kong:
This report is distributed in Hong Kong by Motilal Oswal capital Markets (Hong Kong) Private Limited, a licensed corporation (CE AYY-301) licensed and regulated by the Hong Kong Securities and Futures
Commission (SFC) pursuant to the Securities and Futures Ordinance (Chapter 571 of the Laws of Hong Kong) “SFO”. As per SEBI (Research Analyst Regulations) 2014 Motilal Oswal Securities (SEBI Reg No. INH000000412) has
an agreement with Motilal Oswal capital Markets (Hong Kong) Private Limited for distribution of research report in Kong Kong. This report is intended for distribution only to “Professional Investors” as defined in Part I of Schedule 1 to
SFO. Any investment or investment activity to which this document relates is only available to professional investor and will be engaged only with professional investors.” Nothing here is an offer or solicitation of these securities,
products and services in any jurisdiction where their offer or sale is not qualified or exempt from registration. The Indian Analyst(s) who compile this report is/are not located in Hong Kong & are not conducting Research Analysis in
Hong Kong.
Motilal Oswal Securities Limited (MOSL) is not a registered broker - dealer under the U.S. Securities Exchange Act of 1934, as amended (the"1934 act") and under applicable state laws in the United States. In addition MOSL is not a
registered investment adviser under the U.S. Investment Advisers Act of 1940, as amended (the "Advisers Act" and together with the 1934 Act, the "Acts), and under applicable state laws in the United States. Accordingly, in the
absence of specific exemption under the Acts, any brokerage and investment services provided by MOSL, including the products and services described herein are not available to or intended for U.S. persons.
This report is intended for distribution only to "Major Institutional Investors" as defined by Rule 15a-6(b)(4) of the Exchange Act and interpretations thereof by SEC (henceforth referred to as "major institutional investors"). This
document must not be acted on or relied on by persons who are not major institutional investors. Any investment or investment activity to which this document relates is only available to major institutional investors and will be
engaged in only with major institutional investors. In reliance on the exemption from registration provided by Rule 15a-6 of the U.S. Securities Exchange Act of 1934, as amended (the "Exchange Act") and interpretations thereof by
the U.S. Securities and Exchange Commission ("SEC") in order to conduct business with Institutional Investors based in the U.S., MOSL has entered into a chaperoning agreement with a U.S. registered broker-dealer, Motilal Oswal
Securities International Private Limited. ("MOSIPL"). Any business interaction pursuant to this report will have to be executed within the provisions of this chaperoning agreement.
The Research Analysts contributing to the report may not be registered /qualified as research analyst with FINRA. Such research analyst may not be associated persons of the U.S. registered broker-dealer, MOSIPL, and therefore,
may not be subject to NASD rule 2711 and NYSE Rule 472 restrictions on communication with a subject company, public appearances and trading securities held by a research analyst account.
For Singapore
Motilal Oswal Capital Markets Singapore Pte Limited is acting as an exempt financial advisor under section 23(1)(f) of the Financial Advisers Act(FAA) read with regulation 17(1)(d) of the Financial Advisors Regulations and is a
subsidiary of Motilal Oswal Securities Limited in India. This research is distributed in Singapore by Motilal Oswal Capital Markets Singapore Pte Limited and it is only directed in Singapore to accredited investors, as defined in the
Financial Advisers Regulations and the Securities and Futures Act (Chapter 289), as amended from time to time.
In respect of any matter arising from or in connection with the research you could contact the following representatives of Motilal Oswal Capital Markets Singapore Pte Limited:
Varun Kumar
Varun.kumar@motilaloswal.com
Contact : (+65) 68189232
Office Address:21 (Suite 31),16 CollyerQuay,Singapore 04931
For U.S
8 March 2017
Motilal Oswal Tower, Level 9, Sayani Road, Prabhadevi, Mumbai 400 025
Phone: +91 22 3982 5500 E-mail: reports@motilaloswal.com
Motilal Oswal Securities Ltd
10