22 March 2017
Market snapshot
Equities - India
Close
Chg .%
Sensex
29,485
-0.1
Nifty-50
9,122
-0.1
Nifty-M 100
16,926
-0.2
Equities-Global
Close
Chg .%
S&P 500
2,344
-1.2
Nasdaq
5,794
-1.8
FTSE 100
7,378
-0.7
DAX
11,962
-0.8
Hang Seng
10,644
0.6
Nikkei 225
19,456
-0.3
Commodities
Close
Chg .%
Brent (US$/Bbl)
50
-1.6
Gold ($/OZ)
1,232
-0.1
Cu (US$/MT)
5,748
-1.8
Almn (US$/MT)
1,914
0.2
Currency
Close
Chg .%
USD/INR
65.2
-0.2
USD/EUR
1.1
0.4
USD/JPY
112.8
-0.5
YIELD (%)
Close
1MChg
10 Yrs G-Sec
6.9
0.0
10 Yrs AAA Corp
8.1
0.0
Flows (USD b)
21-Mar
MTD
FIIs
0.3
3.0
DIIs
-0.1
-1.2
Volumes (INRb) 21-Mar
MTD*
Cash
345
283
F&O
3,902
4,060
Note: YTD is calendar year, *Avg
YTD.%
10.7
11.4
17.9
YTD.%
4.7
7.6
3.3
4.2
13.3
1.8
YTD.%
-9.2
6.3
4.1
12.3
YTD.%
-3.9
2.4
-3.7
YTDchg
0.4
0.5
YTD
4.6
-0.4
YTD*
261
4,322
Today’s top research Idea
Delta Corp: Favorable odds
Dominating in ‘brick world’, entering ‘click world’
v
Delta Corp is the leading player in India's underpenetrated gaming market.
Gaming is an emerging industry in India; given its paltry size of ~USD150m
(Global size of USD183b), the growth potential is huge.
v
Approval of its casino in Daman is a key growth trigger for DELTA, as it would
nearly double its gaming capacity to ~3,000 and further cement its first-mover
advantage.
v
M&A opportunities in the fast-growing online gaming business in India would
allow DELTA to leverage its current strength and open up new avenues for
growth. It recently announced the acquisition of Adda52.com, an online poker
gaming website.
v
We expect 35% revenue CAGR, 45%/62% EBITDA and PAT CAGR over FY17-
19E. EBITDA would be driven by strong operating leverage. We initiate
coverage with a Buy rating. Our PT is INR229 (30x FY19E EPS), upside of ~36%.
Research covered
Cos/Sector
Delta Corp
Dr. Reddy’s
Divi’s Lab
Marico
Oil & Gas
Aviation Monthly
Key Highlights
Favorable odds; Dominating in ‘brick world’, entering ‘click world’
Duvvada 483 observations out; data integrity issues persist
Unit-2 receives import alert; key products exempted
Demand outlook improving; focus on technology paying off
Not much synergy in ONGC-HPCL merger
Feb-16 domestic air passenger growth at ~20% YoY
Piping hot news
Oil advances on talk of extension to Opec output cuts
v
Oil prices on Tuesday fell close to its lowest in a week as the market discounted
Quote of the day
Inflation is taxation without legislation.
the latest talk by OPEC that it would extend output cuts beyond June. That
decline also came ahead of the release of weekly U.S. crude inventory data later
Tuesday and on Wednesday that is expected to show a crude stock build of 2.6
million barrels, according to a Reuters poll.
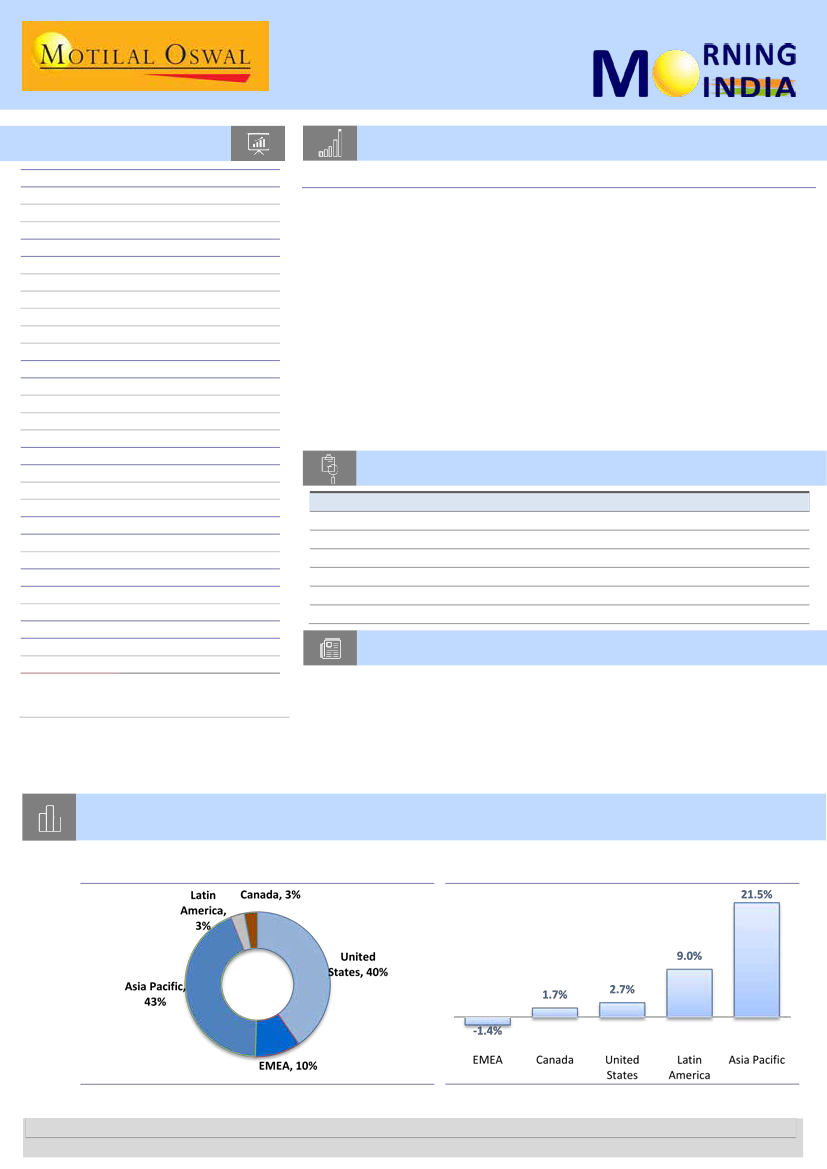
Chart of the Day:
India’s gaming market has huge potential (current size of USD150m)
Exhibit 1:
Asia Pacific region now dominates global
gaming market size of USD183b
Exhibit 2:
Asia Pacific has been the growth driver for the
industry (10year CAGR)
Research Team (Gautam.Duggad@MotilalOswal.com)
Source: Company, MOSL
Motilal Oswal research is available on www.motilaloswal.com/Institutional-Equities, Bloomberg, Thomson Reuters, Factset and S&P Capital.
Investors are advised to refer through important disclosures made at the last page of the Research Report.

In the news today
Kindly click on numbers for the detailed news link
1
The Rs 3-lakh limit proposed for
cash payments in the Budget for
2017-18 would be brought down
to Rs 2 lakh as part of an
unprecedented 40 amendments
to the Finance Bill. Finance
Minister Arun Jaitley moved the
amendments in the lower House
on Tuesday…
2
Divi's Labs barred from exports to US after FDA import alert on
Vizag unit
In a big setback to Hyderabad-based active pharmaceutical ingredients
(APIs) maker Divi's Laboratories Limited, the US Food and Drug
Administration (USFDA) has issued an import alert on the company's Unit
2 facility at Visakhapatnam, Andhra Pradesh, though with certain
exemptions. The latest action comes after Divi's management had
submitted a 700-page response in the light of Form 483 observations
issued by the US drug regulator in December 2016. On December 7, 2016,
the USFDA inspection team issued a Form 483 with five observations citing
lack of proper control over computer systems…
Cash transaction limit lowered
to Rs 2 lakh
3
Finance Ministry rejects
Apple's demands for tax sops
to 'Make in India'
The government has rejected
demands for tax exemptions by
Apple for setting up a
manufacturing facility in India,
arguing that such concessions to a
company are not possible. The
finance ministry has refused to
concede the demand for slashing
Customs duties on completely-
knocked-down and…
4
Steel firms mull Rs 1,000 a
tonne hike from April
With iron ore prices on a rise and
domestic demand likely to pick up
by mid-April, steel producers have
already raised product prices by
Rs 1,000 per tonne from 15,
March and are gearing up for
another hike by the same
quantum from April. This time
most of the companies, according
to the source, are raising prices…
5
General insurers achieve 32%
gross premium growth in FY17
General insurance companies
continued their positive
performance and posted about
32% growth in gross direct
premium in the current financial
year till February. In January,
premiums had crossed R1 lakh
crore for the first time, largely
due to the growth in health and
motor insurance along with new
crop insurance scheme.…
6
DGCA tells airlines to
surrender unutilized
international routes
Aviation regulator Directorate
General of Civil Aviation (DGCA)
has asked airlines to surrender
routes that they won’t fly within
six months of being allocated the
rights. The aviation ministry signs
air services agreements with
various countries, allowing their
airlines a fixed number of seats on
various routes to India…
22 March 2017
7
Won’t be much room for
reduction in MCLR rate if CASA
ratio in system comes down:
HDFC Bank honcho Paresh
Sukhtankar
Now the largest private lender,
HDFC Bank, is guided by its goal of
growing faster than the system
even as it keeps an eye on
margins and asset quality. Deputy
Managing Director Paresh
Sukthankar tells Shritama Bose…
2

Initiating Coverage | Sector: Entertainment
Delta Corp
BSE Sensex
29,485
S&P CNX
9,122
CMP: INR169
TP: INR229 (+36%)
Buy
Stock Info
Bloomberg
Equity Shares (m)
52-Week Range (INR)
M.Cap. (INR b)
M.Cap. (USD b)
1, 6, 12 Rel. Per (%)
Avg Val, (INRm)
Free float (%)
DELTA IN
230.7
195/62
39.0
0.6
39/-3/151
556
59.2
Delta Corp (DELTA) is India’s only listed gaming company, with a dominant presence in
Goa’s offshore casino market. It owns three of the six offshore (five operational) gaming
licenses in the state of Goa. It has ~1,700 gaming positions in the state across its three
offshore casinos, one onshore casino and recently commenced casino in Sikkim. DELTA
has an integrated casino resort in Daman, with 1,200 gaming positions which is awaiting
regulatory approval. It has also forayed into online gaming, with the acquisition of
Adda52.com.
Favorable odds
Dominating in ‘brick world’, entering ‘click world’
n
Financial Snapshot (INR b)
Y/E Mar
2017E 2018E 2019E
Sales
4.6
6.7
8.4
EBITDA
1.7
2.7
3.5
NP
0.8
1.6
2.0
EPS (INR)
3.3
6.9
7.6
EPS Gr. (%)
110.7 110.3
11.4
BV/Sh. (INR)
37.5
50.0
46.4
RoE (%)
9.0
15.7
17.0
RoCE (%)
9.4
14.9
16.5
P/E (x)
51.9
24.7
22.1
P/BV (x)
4.5
3.4
3.6
Shareholding pattern (%)
Dec-16 Sep-16 Dec-15
As On
Promoter
DII
FII
40.8
0.3
9.7
40.8
0.7
11.3
40.9
0.4
11.6
n
n
n
Delta Corp (DELTA) is the leading player in India's underpenetrated gaming market.
Gaming is an emerging industry in India; given its paltry size of ~USD150m (Global
size of USD183b), the growth potential is huge.
Approval of its casino in Daman is a key growth trigger for DELTA, as it would nearly
double its gaming capacity (from ~1,700 currently to ~3,000) and further cement its
first-mover advantage.
M&A opportunities in the fast-growing online gaming business in India would allow
DELTA to leverage its current strength and open up new avenues for growth. It
recently announced the acquisition of Adda52.com, an online poker gaming
website.
We expect 35% revenue CAGR, 45% EBITDA CAGR and 62% PAT CAGR over FY17-
19E. EBITDA would be driven by strong operating leverage. We initiate coverage
with a Buy rating. Our target price is INR229 (30x FY19E EPS), indicating an upside
of ~39%.
Emergence of favorable odds
Our Wealth Creation Study 2008-2013 had elaborated the emergence and
endurance of uncommon profit in equity investments. We can relate this study to
DELTA, which is expected to cross the 15% RoE threshold for the first time in FY18
(post business model change to pure-play gaming and hospitality). For details,
please see page 18.
Delta Corp
Favorable odds
Dominating India’s underpenetrated gaming industry
DELTA is India’s first listed pure-play gaming company. It enjoys a dominant share
of India’s offshore casino market, with three of the six offshore casino licenses
(five operational) in Goa. Given that the Goa government is unlikely to issue new
licenses and that land-based casinos are allowed only in five-star hotels, DELTA’s
competitive advantage should sustain. Price Waterhouse Coopers (PWC)
estimates the total global gaming casino market in 2015 at USD183b and that it
has grown at a CAGR of 7% over the last 10 years. The Asia Pacific region has led
growth, with a CAGR of 21.5%. In India, gaming is just emerging as an industry;
given its paltry size of ~USD150m, the growth potential is huge.
chintan.modi@motilaloswal.com
Please click here for Video Link
Chintan Modi
+
91 22 3982 5422
22 March 2017
3

Delta Corp: Relative to Index
Approval of Daman casino could be an icing on the cake
DELTA is awaiting regulatory approval for a casino housed in Daman’s only five-star
hotel. Given its locational advantage, Daman (caters to a catchment area of 35m
people over Mumbai and Gujarat) is likely to attract higher footfalls than Goa. We
expect DELTA to replicate its success in Goa’s offshore casino market in the land-
based casino market in Daman. Approval of the Daman casino has the potential to
nearly double its gaming capacity to 3,000. DELTA would be in a better position to
exploit the potential that the nascent industry offers.
Online gaming – next big opportunity
Globally, online gaming is still a nascent industry and is legal in very few countries. It
is increasingly becoming popular, with legal online gaming accounting for 3% of
global gaming revenue. In India too, it is at a nascent stage; some of the popular
names in India are Adda52.com, ace2three.com, pokerbaazi.com, and Spartan
Poker. The size of the global online gaming industry is estimated at USD110m-120m.
To capitalize on the opportunity, DELTA recently acquired Gauss Network, which
holds Adda52.com (online poker), for INR2.1b (part cash and part equity deal
expected to be completed by April 2017). Ace2three.com, the largest rummy site,
generated about INR1,665m in revenue, with PAT of INR617m in FY16. DELTA is
open to further acquisitions in the online gaming space. We believe there would be
significant cross-selling opportunities between DELTA’s casino and online gaming
businesses.
Expect 62% PAT CAGR over FY17-19
We expect DELTA’s revenue to grow at a CAGR of 35% over FY17-19, led by 38%
CAGR in its gaming business and 18% CAGR in its hospitality business. Adda52.com
would further boost revenue in FY18 and a positive trigger from Daman could be an
icing on the cake (we have not factored revenue from Daman casino). DELTA’s focus
on increasing the share of mass crowds would drive revenue growth and margins; as
such crowds give the house a higher chance to win as compared to VIP (large and
experienced) customers. EBITDA would post 45% CAGR, with margin expanding
from 36.3% to 41.5%, largely driven by operating leverage and high-margin online
business. PAT would grow at a CAGR of 62% over FY17-19.
At an inflexion point; Buy
We believe DELTA is at an inflection point. The investment phase is behind and
approval of the Daman casino and M&A opportunities in online gaming could trigger
significant growth and cash generation as well as RoCE / RoE improvement. We
expect RoE to improve from 9% to 17% over FY17-19. The stock trades at
24.7x/22.1x FY18E/19E EPS, 8.4x/6.2x FY18E/19E EV/EBITDA and 3.4/3.6x FY18E/19E
P/BV. DELTA’s premium valuations vis-à-vis its peers in global space is manifestation
of its strong earnings outlook, a near monopoly in casino space in India and
potential approval of Daman Casino. Thus we assign a PE multiple of 30x (~40%
premium) to global peers. We initiate with Buy, with a target price of ~INR229 (30x
FY19E EPS). Under bull case scenario which assumes approval of Daman casino and
FY19 being first full year of operations, leads to an EPS of INR10.9 (vs INR7.6 in base
case) in FY19 and a target price of INR334 (incl. potential cash per share of INR7.5
through sale of non-core assets) .
22 March 2017
4

Dr Reddy’s Labs
BSE SENSEX
29,485
S&P CNX
9,122
21 March 2017
Update | Sector: Healthcare
CMP: INR2,623
n
TP: INR2,875 (+10%)
Neutral
Duvvada 483 observations out; data integrity issues persist
Bloomberg
Equity Shares (m)
M.Cap.(INR b)/(USD b)
52-Week Range (INR)
1, 6, 12 Rel. Per (%)
Avg Val, (INR m)
Free float (%)
DRRD IN
170.4
447.0 / 6.6
3689 / 2602
-14/-20/-34
1187
73.2
n
Financials & Valuations (INR b)
Y/E Mar
2017E 2018E
Sales
143.6
168.6
EBITDA
26.6
37.1
Net Profit
13.3
20.8
EPS (INR)
77.7
121.7
EPS Gr. (%)
-41.3
56.5
BV/Sh. (INR)
809
917
RoE (%)
10.0
14.1
RoCE (%)
7.4
11.1
P/E (x)
33.7
21.6
P/BV (x)
3.2
2.9
2019E
196.3
46.7
25.8
151.4
24.5
1,048
15.4
13.0
17.3
2.5
n
Shareholding pattern (%)
Dec-16 Sep-16 Dec-15
Promoter
26.8
26.7
25.6
DII
8.2
6.5
5.7
FII
36.3
37.2
37.8
Others
28.8
29.7
30.9
Note: FII includes depository receipts
Relative to Index
Dr Reddy's Labs
Sensex - Rebased
3,800
3,450
3,100
2,750
2,400
n
n
n
Dr Reddy’s Labs (DDRD) has been issued 483 observations (4–5 are repeated)
by the US FDA for its Duvvada plant. The FDA investigation has also revealed
data integrity issues (e.g., Observation 3, 4). Given that the FDA has
maintained a zero tolerance policy toward oncology injectable plants, we
believe that the facility may remain under the warning letter status for at least
2-3 quarters.
Key oncology facility; risk of delay in Gleevec launch:
DRRD generates more
than 15% of its US sales from the oncology segment, with the Duvvada facility
contributing ~7-8%. This is because large part of the supply comes from third-
party sources like Cipla and Gland Pharma. Currently, ~15-18 ANDAs (out of
total of ~90) are pending from this facility, of which ~4-5 are expected to be
approved in FY18-19. Gleevec is the key launch due from this facility. With the
partner site (Hetero) also coming under the regulatory scanner, we believe the
Gleevec approval may get pushed by at least 6-9 months if the Duvvada facility
does not come back on track.
Miryalaguda observations not so concerning; Srikakulam inspection is key.
In
November 2015, the US FDA had issued warning letters to Miryalaguda- and
Srikakulam-based API plants and Duvvada-based oncology formulations plant
(US
FDA Link).
These facilities contribute ~10-12% of US sales (~USD250m),
including ~2% from Miryalaguda and ~9-10% from Srikakulam and Duvvada.
The US FDA completed its inspection at Miryalaguda in February 2017 with
three 483 observations (largely procedural in nature). Srikakulam inspection is
due over next few weeks – given that this is the largest facility among the
three, we believe it is imperative that this plant comes back on track soon. The
FDA observed a key issue at the Srikakulam facility: existence of an
uncontrolled ‘Custom QC laboratory’, which was unknown to the FDA.
Need to avoid high third-party consultant costs:
DRRD has so far incurred
~USD40m as third-party consultant costs to take remediation actions at the
three plants. Third-party consultant cost has come down significantly as the
remediation is over now. In our view, DRRD needs to ensure that it does not
incur such high third-party costs again to fix observations.
Will fate of one plant impact others?:
Notably, the three plants have been
issued warning letters simultaneously, and the FDA has suggested a global
corrective action. It is unclear whether all three plants would be back on track
together or each plant would be looked at separately. DDRD needs to take
appropriate remedies to fix observations so that future inspections go well and
the three facilities are back on track.
FDA remediation is key; maintain Neutral:
Although long-term fundamentals
remain intact, the stock is expected to remain in a range over the near term
due to regulatory concerns. We cut our FY18/19E EPS by ~5%, factoring in the
impact of slower resolution of regulatory issues. We maintain
Neutral
with a
target price of INR 2,875 @ 21x 1HFY19E PER.
22 March 2017
5

Operating metrics
Exhibit 1: Key operating metrics
FY14
3Q
Revenue Mix (%)
US
India
Europe
Russia
Others
PSAI
Innovative products
Revenue Gr. (%)
US
India
Europe
Russia
Others
PSAI
Innovative products
Cost on sales (%)
Raw material
SG&A
R&D cost
Tax Rate
Margins (%)
Gross Margins
EBITDA Margins
EBIT Margins
PAT margins
45.9
11.1
5.3
15.0
5.9
14.3
2.5
23.3
75.5
5.2
-3.6
20.9
35.1
-29.0
26.4
71.0
39.5
23.1
8.4
29.0
4Q
43.0
11.8
5.1
13.0
5.6
19.1
2.4
4.2
31.1
17.8
-3.1
0.0
48.3
-34.7
28.5
78.2
42.8
24.0
11.4
20.6
1Q
46.8
11.4
4.1
13.8
6.3
15.7
1.8
23.6
51.5
14.5
-7.2
8.3
50.0
-5.6
-6.6
76.8
40.7
25.0
11.0
21.5
FY15
2Q
39.8
13.4
4.0
13.4
9.9
17.8
1.7
6.9
7.9
14.1
-18.6
-13.0
94.8
-0.2
-1.0
77.3
41.5
24.3
11.5
17.2
3Q
42.8
11.3
4.4
12.4
10.6
15.9
2.6
8.8
1.5
10.6
-8.6
-10.0
94.0
20.7
11.8
76.8
41.8
23.7
11.2
30.7
4Q
44.3
12.3
6.0
8.5
9.0
19.2
0.8
11.2
14.6
15.7
32.0
-27.2
76.8
11.7
-65.2
78.7
45.2
20.3
13.3
12.5
1Q
49.3
12.7
5.1
8.2
7.2
14.9
2.7
6.8
12.4
18.9
31.0
-36.7
21.9
1.4
58.2
73.8
38.9
23.2
11.7
21.6
FY16
2Q
46.5
13.7
5.3
9.8
6.8
14.8
3.0
11.2
29.9
13.9
48.1
-18.4
-23.8
-7.4
94.8
71.4
38.7
21.5
11.2
20.7
3Q
48.9
14.6
4.9
9.2
7.0
12.8
2.6
3.2
18.0
34.1
13.8
-23.8
-32.1
-16.9
5.6
74.7
40.5
23.8
10.3
23.6
4Q
50.4
14.0
4.7
6.1
6.7
15.3
2.7
-3.0
10.5
11.0
-24.9
-30.7
-27.3
-22.3
245.3
78.0
43.4
21.7
13.0
70.0
FY17
1Q
2Q
48.0
16.1
5.0
9.2
4.0
14.5
3.1
-13.9
-16.2
9.8
-15.5
-3.3
-51.9
-16.4
1.2
88.3
43.8
29.7
14.8
26.0
45.0
17.4
5.0
9.9
3.6
16.1
3.0
-10.1
-13.1
14.4
-16.4
-9.8
-51.9
-2.3
-10.5
83.2
44.0
24.7
14.5
23.1
3Q
44.8
16.0
5.8
11.1
5.0
14.6
2.8
-6.6
-14.5
2.4
10.9
-2.0
-23.0
6.3
-1.2
77.0
40.9
22.7
13.4
20.6
60.5
29.0
24.0
16.1
57.2
21.8
16.2
13.9
59.3
23.2
17.9
15.6
58.5
22.7
17.3
16.0
58.2
23.2
17.9
16.3
54.8
21.3
15.5
13.7
61.1
26.2
20.2
16.6
61.3
28.6
22.4
18.1
59.5
25.3
18.8
14.6
56.6
22.0
13.9
10.0
56.2
11.7
3.4
3.9
56.0
16.8
8.7
9.0
59.1
23.0
15.1
12.7
Source: Company; MOSL
22 March 2017
6

Divi's Laboratories
BSE SENSEX
29,485
S&P CNX
9,122
21 March 2017
Update
| Sector:
Healthcare
CMP: INR634
TP: INR600 (-5%)
Neutral
Unit-2 receives import alert; key products exempted
Regulatory uncertainty to keep stock price range-bound in near term
n
Stock Info
Bloomberg
Equity Shares (m)
52-Week Range (INR)
1, 6, 12 Rel. Per (%)
M.Cap. (INR b)
M.Cap. (USD b)
Avg Val, INRm
Free float (%)
DIVI IN
265.5
1,380/628
-19/-56/-52
168.3
2.5
843.0
47.9
n
n
Financials Snapshot (INR b)
Y/E Mar
2017E 2018E
Sales
EBITDA
Net Profit
EPS (INR)
EPS Gr. (%)
BV/Sh. (INR)
RoE (%)
RoCE (%)
P/E (x)
P/BV (x)
42.9
16.1
12.0
45.4
8.3
178.4
26.7
26.5
14.0
3.6
39.0
12.7
9.2
34.6
-23.8
197.4
18.4
18.3
18.3
3.2
US FDA has issued an import alert on DIVI’s Visakhapatnam-based plant, Unit-2.
However, it has exempted nine products including Naproxen and Gabapentin from
the import alert list.
US FDA had inspected Unit-2 for eight days from November 29 to December 06, 2016,
following which it issued Form-483 with five observations to DIVI. The observation
letter highlighted instances of disregard of unknown impurities without specific
justification and sighting of unexplained colored products at various stages of API
manufacturing.
We expect the stock to remain range-bound till further clarity emerges on these 483
observations. We have cut our EPS estimates for FY18/19 by 22-23%. Maintain
Neutral.
2019E
45.6
15.3
10.8
40.6
17.5
219.7
19.5
19.4
15.6
2.9
n
n
Shareholding pattern (%)
Dec-16 Sep-16 Dec-15
As On
Promoter
52.1
52.1
52.1
DII
14.6
13.5
13.8
FII
19.8
20.9
19.9
Others
13.6
13.5
14.3
FII Includes depository receipts
Stock Performance (1-year)
Divi's Lab.
Sensex - Rebased
1,500
1,250
1,000
750
500
n
n
n
Unit-2 a critical plant for DIVI:
Unit-2 accounts for 60-65% of DIVI’s total sales.
US sales stood at ~32% of DIVI’s total sales in FY16. We estimate that US sales
from Unit-2 would account for 15-20% of DIVI’s total sales. Unit-2 was last
inspected in February 2016, with no Form-483 being issued. Unit-1 (located at
Hyderabad) has no pending Form-483 currently (but was last inspected in
2014).
Negative news flow could continue:
There are other regulators that rely on
inspection results from US FDA (like Health Canada). This raises the risk of DIVI
receiving a supply ban from these regulators as well (resulting in incremental
loss of sales). Apart from this, there is risk of loss of market share for existing
products and risk of clients (in EU and other geographies) shifting their
business.
Cutting estimates:
Though ~20% of DIVI’s sales are directly impacted due to
this import alert, exemption to 9 products including Naproxen and Gabapentin
(estimated 7-8% of total sales) would lower the net impact. We also assume 3-
4% loss of sales to other geographies due to risk of (1) supply restrictions from
other regulators, (2) market share loss, and (3) loss of business. Overall, we cut
our FY18/19E revenue by ~15% and our FY18/19E EBITDA margin by ~500bp.
Buyback / special dividend could be a near-term trigger:
DIVI has cash of
~INR12b on its books. There is a possibility of a buyback / special dividend (like
DRRD) in the near term, which could provide near-term support to stock price.
Regulatory concerns a big overhang in the near term; maintain Neutral:
We
expect the stock to remain range-bound till further clarity emerges on these
483 observations. We have cut our EPS estimates for FY18/19 by 22-23%. We
maintain
Neutral
with a target price of INR600 (INR815 earlier). On a going
concern basis also, large capex addition and delay in commencement of facility
would keep growth under check till FY19. However, strong balance sheet (net
cash surplus) and high return ratios (RoE at ~29%) provide valuation cushion.
22 March 2017
7

21 March 2017
Update
| Sector:
Consumer
Marico
Buy
BSE SENSEX
29,485
S&P CNX
9,122
CMP: INR292
TP: INR335 (+15%)
Demand outlook improving; focus on technology paying off
Rural growth and food inflation are the key monitorables
Stock Info
Bloomberg
Equity Shares (m)
52-Week Range (INR)
1, 6, 12 Rel. Per (%)
M.Cap. (INR b)/(USD b)
Avg Val ( INR m)
Free float (%)
MRCO IN
1,289.6
307 / 235
5/-2/2
376.6/5.8
355
40.3
Financials Snapshot (INR b)
Y/E March
2017E 2018E 2019E
Sales
59.5 67.9 78.1
EBITDA
11.0 12.6 14.9
Adj. PAT
7.8
9.1
10.8
Adj. EPS (INR)
6.1
7.1
8.4
EPS Gr. (%)
8.3
16.5 18.8
BV/Sh.(INR)
20.2 23.5 25.3
RoE (%)
33.3 32.4 34.5
RoCE (%)
29.3 28.8 30.6
P/E (x)
48.1 41.3 34.7
P/BV (x)
14.4 12.4 11.5
Shareholding pattern (%)
As On
Promoter
DII
FII
Others
Dec-16 Sep-16 Dec-15
59.7
4.1
28.7
7.5
59.7
3.4
29.3
7.6
59.7
3.6
28.1
8.7
We met management of Marico (MRCO) to understand the company’s distribution and
rural strategy. Key takeaways:
n
We were impressed with the pioneering use of technology, which gives the company a
competitive edge in terms of rural expansion.
n
The focus on technology helps to not only make working capital and cost structure
leaner, but also generate significant data for analysis (e.g. demand forecasting). The
company is looking to tie up with startups offering data mining analytics.
n
The demand outlook has improved sharply for the company, as mentioned by
management during its 3QFY17 results announcement. EPS growth could perk up in
FY18 if monsoon is normal this year, given that government schemes to boost rural
consumption and a weak base of rural growth over past few years have already raised
the earnings prospects.
n
With MRCO’s demonstrated strength in unbranded to branded conversion, ability to
create brands with differentiated positioning (resulting in pricing power) and the
advantages due to the pioneering use of technology, we believe rural sales as a
proportion of total domestic sales (currently at 33%) could increase significantly over
the longer term. This would in turn enable MRCO to sustain its strong earnings
momentum.
n
There is no change to our forecasts. Targeting 40x March 2019 EPS (10% premium to
three-year average), we derive a revised target price of INR335.
Current scenario
n
FII Includes depository receipts
Stock Performance (1-year)
Marico
Sensex - Rebased
310
290
270
250
230
n
The company distributes its products via ~4.6m outlets, of which ~900,000 are
reached directly and the rest via distributors. Thus, MRCO is far better placed
than many consumer peers in the FMCG universe that itself has a reach to over
9m outlets. However, we believe that there is still significant room for MRCO to
expand both its direct and indirect reach, given its wide mix of product
categories and brands that range from premium to lower end.
The pace of direct reach expansion may be relatively slower than peers, but this
is a conservative strategy adopted based on extensive analysis. Consequently,
the company has had over 95% success rate in its direct reach rollout (close to
100% in recent years). Frequency and range are the important factors
determining classification of an outlet for direct reach.
MRCO has been one of the pioneers in the Indian FMCG space in terms of
generating value for retailers, rather than just having a business relationship.
Deliberate but comprehensive expansion in direct reach
n
Technology – critical part of expansion
n
MRCO was the first among peers to undertake sales automation. It was also first
off the block to develop distributor and salesmen software (the company
actually has a patent for the latter). Auto order management right up to the
lowest levels allows sales personnel to focus more on marketing.
22 March 2017
8

n
Even the distributor employees covering the van routes in remote areas are
provided with handheld devices, which help them in data analysis. The data
analytics prowess is superior to peers, enabling the company to effectively
manage inventory, forecast demand and ensure a leaner working capital and
cost structure.
Data mining for demand forecasting and achieving efficiencies – a high
potential area
n
The company is in the process of establishing a cell for analyzing data. Currently,
Indian retail throws up a tremendous amount of data, which is cumbersome and
not used to its full potential. The company thus is partnering with start-ups,
which could potentially help it analyze data even more effectively. The company
has recognized that consumer behavior analysis is far more useful than
conducting surveys. According to management, loyalty programs will be offered
on a much larger scale going forward.
Indirect reach will also expand rapidly
n
n
n
n
MRCO considers 20 variables (e.g. population, size of the region, infrastructure
in the region, potential size of store sales) to determine its store expansion
strategy (whether directly or through wholesalers). The company has 4,800
stockist towns currently, up from 3,000 a few years ago.
Through 3.6m outlets (indirect reach), wholesalers account for 35% of MRCO’s
general trade sales.
When the aim is to convert users in adjacencies from unorganized to organized,
the scope for expansion in indirect retail is also high (particularly conversion in
case of hair oil from loose to packaged). Indirect reach is expanding rapidly in
Rajasthan, Bihar and UP. Viability remains a key factor for outlet expansion.
Around 33% of MRCO’s sales are derived from rural areas. Of the 643,000
villages in India, the company reaches nearly all 100,000 villages with population
of over 5,000. In villages with population greater than 5,000, the company
already has close to 100% reach. Management reckons that its rural reach is
best-in-class in south and west India, and extremely good in the east. North is
the area where it is expanding substantially and where rural population is
higher.
Rural margins, working capital and return ratios
n
The rural market share is higher in all categories compared to the urban share.
Margins and RoCE in rural are higher than those in urban, despite 2% higher
costs incurred on reaching urban outlets. Urban margins get diluted by foods
items that do not feature in rural sales. Debtor days in rural are higher in the
initial years before eventually coming down as scale picks up. In metros and key
urban centers, the company operates on a just-in-time basis, resulting in near
zero inventory. In rural centers, some inventory is desirable, but inventory days
are now coming down due to the use of technology.
Demand environment and outlook
n
In November and December – the first two months of demonetization –
demand had collapsed in the wholesale and rural channels as well as in the
northern and eastern states. Modern trade revenues, however, jumped. It is
interesting that, despite cash coming back into the system in the ongoing
22 March 2017
9

n
n
n
n
quarter, sales from the modern retail channel (9% of Marico India’s revenues)
remain strong. The wholesale channel sales recovered to earlier levels toward
end-December, and rural as well as northern and eastern geographies also
showed some revival from January 2017.
Post 3QFY17 results, MRCO was the only one among peers to guide for a sharp
recovery from 4QFY17 with 6-8% volume growth, a big jump from the 4%
volume decline in 3QFY17. This is especially notable given 8.4% volumes growth
in the base quarter (4QFY16). It is pick-up in demand, as mentioned above,
which gives management confidence on a sharp volume recovery for the
quarter.
Management is particularly enthused by the government’s initiatives to boost
rural demand, low base of rural growth in recent years, and edge over peers in
terms of technology and analytics. If monsoon is close to normal this year (first
IMD forecast will be out only in April), the company will be well placed for
strong growth in FY18 as well.
With MRCO’s demonstrated strength in conversion from unbranded to branded,
ability to create brands with differentiated positioning (resulting in pricing
power) and edge over peers in terms of working capital and efficiency, we
believe rural sales as a proportion of domestic sales could increase significantly
over the longer term, enabling the company to sustain strong earnings
momentum.
Management was confident of strong earnings growth in FY18 if monsoon is
normal this year. However, it did point out that if food inflation goes up sharply,
purchasing power of the rural consumer for non-food items may not recover as
sharply as desired and thus restrict earnings growth.
22 March 2017
10

Sector Update | 16 March 2017
Oil & Gas
Refer to our report
on Oil & Gas, February 2017
Not much synergy in ONGC-HPCL merger
Elephant and the blind men
n
n
Since the Indian government, in its Union Budget, proposed to create an integrated oil
& gas company to take on global majors and large domestic private players, investors
have been losing sleep over what shape and form the new firm would take. In light of
the same, we had come out with two reports discussing the various possibilities.
It appears from the reported articles that the journey through the maze is finally
coming to an end with the possible ONGC-HPCL merger/acquisition.
Business synergies? Dhoondte rah jaoge!^
(once a famous tag line of a leading
washing powder)
n
n
n
While some may argue that oil volatility would be minimized as ONGC is a
producer of oil and HPCL is a consumer, we note that the margin driver for HPCL
is refining (~25% of EBITDA) and marketing and pipeline (~75% of EBITDA).
Refining margins are not strictly linked to oil prices, while marketing margins are
deregulated. Marketing volume is a function of consumption and economic
growth. Pipeline volumes depend again on marketing, while the margin is linked
to railway freight.
ONGC’s margin, on the other hand, is completely linked to oil prices. We do not
see much synergy here.
^ The tagline suggested that if you use the specified product, you would not be able to find any
dirt on the washed clothes
Cultural synergies? Miles apart!
n
n
n
HPCL traces its origin to Esso/Caltex, and has seen rather lower government
holding of 51% since its public offer in 1995.
ONGC traces its origin to the government’s quest to develop domestic oil & gas
resources. Post listing in 2004, ONGC saw government holding of 74%. The
government brought down its direct holding to 69% only in 2012.
ONGC has been often associated with poor investment decisions, especially
overseas, while HPCL has been quite cautious.
Since there are no synergies, we do not see much benefit from the integration
of ONGC with HPCL – more so as HPCL is embarking upon huge capex, including
INR210b of Vizag expansion.
We believe any such integration with BPCL would have made more sense as 1)
BPCL also has expertise in E&P and b) strong free cash flow from BPCL would
have helped the consolidated balance sheet.
Our estimates show that the combined entity would have an RoE of 15.5%,
while HPCL alone would make an RoE of 23% if not merged with ONGC. This
would be a concern for existing investors of HPCL.
Additionally, investment in HPCL is more to do with call on refining and
marketing (larger contributor), which are much lesser volatile than oil prices.
Existing investors would not want to expose themselves to oil volatility if HPCL
were to merge with ONGC.
We do not see much benefit in the two coming together
n
n
n
n
22 March 2017
11

the lines of MRPL, then we do not see any concern for holders of HPCL.
However, HPCL’s merger with ONGC would result in downgrade of the former.
Exhibit 1: Evolution of HPCL
1952 -
Standard
Vacuum
Refining
Company
1962 - Name
changed to
Esso
Standard
Refining
Company
1974 - HPCL
formed after
takeover &
merger of
Esso
Standard &
Lube India
1978 - Caltex
Oil Refining
(India)
merged with
HPCL
1979 - Kosan
Gas Company
also merged
with HPCL
1992-94 -
through
divestments,
govt brings
down its
stake from
100% to 60%
1995 - govt
further
dilutes its
holding to
51% through
public
offering
2017 - HPCL,
with market
share of 25%
in domestic
petroleum
products, has
a market cap
of USD7.7b
Source: Company, MOSL
22 March 2017
12

Exhibit 2: Evolution of ONGC
1955 -
Government
sets up Oil and
Natural Gas
Directorate
under then
Ministry of
Natural
Resources and
Sciences;
objective being
development of
oil and gas
resources in the
country
1956 -
Government
adopted
Industrial
Policy
Resolution;
which put the
sole and
exclusive
responsibility
of mineral oil
development
on the state;
Directorate
raised to the
status of a
Commission
with enhanced
powers
1959 -
Commission
converted into
a statutory
body by act of
Parliament;
objective being
"to plan,
promote,
organize &
implement
programmes
for
development
of Petroleum
Resources &
production and
sale of
petroleum
and petroleum
products
produced by
it,..."
1993 - under
the
liberalization
drive, ONGC
reorganized as
a limited
company
under
Companies
Act, 1956; govt
disinvested 2%
through
competitive
bidding & 2%
fresh equity
was issued to
employees
1999 - govt
sells 10% of
its holding in
ONGC to
IOCL and
2.5% to
GAIL;
bringing
down its
holding to
84.1%
2004 -
Govt sold
10%
stake in
IPO,
bringing
down its
holding
to 74.1%
2012 -
Govt
divested
4.9%
stake
through
OFS,
bringing
down its
stake to
69%
2017
- ONGC
with
production
of
~51mmtoe
from
domestic
sources
and
~12mmtoe
from
overseas,
has a
market cap
of USD37b
Source: Company, MOSL
Exhibit 3: Evaluation of possible merger
FY18
Remarks
FY18
FY18
HPCL conso
ONGC conso ONGC+HPCL
117
Using USD60/bbl of realization for ONGC
757
874
36
328
364
81
429
510
16
43
59
11
45
56
76
431
507
50
Assuming 33% tax rate
284
334
86
612
698
Capex for HPCL is high due to upcoming Vizag expansion (INR210b) by
100
4-5 years, fuel upgradation (INR40-50b) by Sep 2019 and marketing
430
530
and pipeline regular capex (INR40-50b) each year
(14)
182
168
(0.2)
2.5
2.3
251
1,900
2,151
556
2,900
3,456
22.9
Significant margin dilution for HPCL holders
15.0
15.5
9.9
9.8
9.7
Source: MOSL
EBITDA (INRb)
Depr (INRb)
EBIT (INRb)
Int cost (INRb)
Int income (INRb)
PBT (INRb)
PAT (INRb)
Operating cash flow (INRb)
Capex (INRb)
Free cash flow (INRb)
Free cash flow (USDb)
Equity (INRb)
Capital employed (INRb)
ROE (%)
ROCE (%)
22 March 2017
13

Sector Update | 21 March 2017
Aviation
Domestic passenger growth
(YoY %)
Feb-16 domestic air passenger growth at ~20% YoY
Domestic load factor at 87.2%; IndiGo’s domestic ASK/RPK share highest
n
25.3
23.3 22.6 23.4
19.9
n
n
Domestic air passengers in India grew ~20% YoY (adj.) in Feb-17 (v/s +25.3% in Jan-17;
+23.1% in 3QFY17). However, we believe this strong growth would be at the cost of
yields, as seen in headline fares.
While Feb-17 ASK growth stood at 17.8% YoY (adj.) (v/s +21.1% in 3QFY17 and +19% in
2QFY17), RPKs increased 21% YoY (adj.) (v/s +22.8% in 3QFY17 and +24.5% in 2QFY17).
Load factor stood at 87.2% in Feb-17 (v/s 84.8% in 3QFY17 and 83% in 2QFY17).
*adj.:
With 2016 being a leap year, we adjust pax/ASK/RPK numbers to calculate YoY change for Feb-17.
Domestic air passenger growth at ~20% YoY in Feb-17
n
n
n
88.7
87.2
82.5
82.2
81.1
84.5
Industry load factor (%)
88.3
n
n
India’s domestic air passengers grew ~20% YoY (adj.) in Feb-17. Domestic
passenger growth remained ~20% and above for the 16
th
straight month.
IndiGo’s passenger growth stood at +28.6% YoY (adj.) in Feb-17 (v/s +43% in
3QFY17 and +39% in 2QFY17).
SpiceJet’s domestic passenger volumes grew +20% YoY (adj.) in Feb-17 (v/s
+22% in 3QFY17).
Go Air’s domestic passenger volumes grew +30.4% YoY (adj.) in Feb-17 (v/s
+19% in 3QFY17).
Passenger volume growth (adj.) YoY for other airlines was as follows: Jet Airway:
+3.6% YoY (v/s +1.3% in 3QFY17); Air India: +4.9% (v/s +2% in 3QFY17).
IndiGo’s passenger market share stood at ~40% in Feb-17 (v/s +41.8% in 3QFY17
and +40% in 2QFY17).
Jet Airways’ market share remained below 20% for the eleventh consecutive
month at 18.3%. It had market share of above 20% since Jul-14.
Air India’s market share stood at 13.3% (v/s 13.1% in 3QFY17).
SpiceJet’s market share stood at 13.3% (v/s 12.8% in 3QFY17).
GoAir’s market share stood at 8.7% in Feb-17; it seems to have stabilized in the
8-9% range.
IndiGo’s domestic ASKs increased +23.5% YoY (adj.) (v/s +34% in 3QFY17); its
domestic ASK share stood at the highest at 41.5%.
SpiceJet’s domestic ASKs grew +23.4% YoY (adj.) (v/s +19.8% in 3QFY17).
Domestic ASKs of GoAir grew +20.3% YoY (adj.) (v/s +13.5% in 3QFY17) and
those of Jet grew +3% YoY (adj.) (v/s +3% in 3QFY17).
IndiGo’s RPKs grew +25.9% YoY (adj.) (v/s +38.9% in 3QFY17), with the highest
market share of 41.7% in Feb-17.
SpiceJet’s domestic RPKs grew +25.2% (adj.) YoY (v/s +21.2% in 3QFY17), with a
market share of 12.6% in Feb-17.
GoAir’s domestic RPKs grew +26.7% YoY (adj.) (v/s +18.7% in 3QFY17), with a
market share of 8.3% in Feb-17.
Jet’s RPK growth stood at +8% YoY (adj.), followed by Air India at +5.9% YoY
(adj.).
14
IndiGo’s passenger market share remains highest at ~40% in Feb-17
n
n
Industry load factor (%)
n
n
Passenger market share (%)
Jan-17
IndiGo
Jet
AI
SpiceJet
GoAir
Others
18.0
18.3
13.9
13.3
12.9
13.1
8.3
8.7
7.1
7.0
Feb-17
39.9
39.7
n
Domestic ASKs increase +17.8% YoY (adj.) in Feb-17 (v/s +21.1% in 3QFY17)
n
n
n
Domestic RPKs rise +21% YoY (adj.) in Feb-17 (v/s +22.8% in 3QFY17)
n
n
n
n
22 March 2017

Industry load factors
stood at 87.2% (v/s 84.8% in 3QFY17)
n
n
n
n
n
SpiceJet’s load factor stood at 93.6% in Feb-17 (v/s 92.7% in 3QFY17); had 90%+
load factor for last 22 months.
IndiGo’s load factor stood at 87.7% (v/s 88.1% in 3QFY17).
GoAir’s load factor stood at 90.9% (v/s 87.5% in 3QFY17).
Jet reported load factor at 86.6% (v/s 80.2% in 3QFY17).
Air India reported load factor at 79.6% (v/s 75.9% in 3QFY17).
Exhibit 4: Domestic passengers grew ~20% YoY adj. in Feb-17
Total Domestic Passengers (millions)
Feb-17 was 16 consecutive
month of above ~20%
growth
th
Source: DGCA, MOSL
Exhibit 5: Double-digit passenger growth since Aug-14
Domestic passenger growth (YoY %)
Domestic passenger volumes
grew ~20% YoY in Feb-17
Source: DGCA, MOSL
Exhibit 6: Airline-wise passenger growth (YoY %)
Passenger growth YoY (%)
80
Total
Air India
IndiGo
SpiceJet
Jet Airways
GoAir
Passenger volumes up
+28.6% YoY for IndiGo in
Feb-17.
40
0
-40
Source: DGCA, MOSL
22 March 2017
15

In conversation
1. Gruh Finance: Expect proper functioning of rera in 6-9
months; Sudhin Choksey, MD
n
n
n
n
n
n
The time taken for implementation of RERA Act by various states will be
different. So it could well be 6-9 months before it starts functioning properly.
The inventory build-up in both Gujarat and Maharashtra are quite high over the
last 3-4 years and so demand has been weak compared to other states.
In Madhya Pradesh the inventory being less, the demand situation may be
better.
As per the newly launched CLSS, MIG-I(annual income of Rs.6,00,001 to
Rs.12,00,000), an interest subsidy of 4% has been provided for loan amounts up
to Rs.9 lakh while in MIG-II(annual income of Rs.12,00,001 to Rs.18,00,000), an
interest subsidy of 3% has been provided for loan amount of Rs.12 lakh.
The interest subsidy will be calculated at 9% NPV over a maximum loan tenure
of 20 years or the actual tenure, whichever is lesser. Housing loans above Rs. 9
lakh and Rs. 12 lakh will be at non-subsidized rates.
Hopeful that the scheme will get an extension beyond one year.
2. Godfrey Philips: Expect an atmosphere of stability once gst is
implemented; KK Modi, President & MD
n
n
n
n
GST is being implemented at a great speed, there is an atmosphere of
consensus.. This is good for industry, it will bring prosperity throughout India.
Cigarettes are sold at different prices for different class of consumer. The
cheapest cigarette is at Rs 3 per cigarette or Rs 3,000 per thousand sticks and
the cap is Rs 4,000 per thousand sticks.
Cannot comment on the exact impact of GST because of various taxes like VAT,
excise duty, additional excise duty, entrance taxes are present, but roughly 60%
of cigarette price accounts for taxes and the next is for products and
manufacturing cost.
The industry is expecting that the government will take a very rational decision
and cap is just for the upper limit, and not the average of the industry.
3. GSK Consumer: Demand muted because of economic factors;
Manoj Kumar, MD
n
n
n
n
On GSK consumer volumes falling. the category is facing a volume growth
problem it isn’t as if Horlicks' shares are falling. Besides, rural economy has not
been good the last two years which has added to the woes.
There is a premium segment willing to pay for functional products. And there is
a mass segment looking for value. We are playing both the mass and high
science segment with clinical claims.
We've got our tiering strategy clear – on one end we will go after penetration
because we are the leaders. For affluent consumers, we are giving life stage
products depending on what their needs are.
We expect revival of the rural economy and reversed pricing of sachets (to Rs 5
from Rs 6) of our low unit packs (LUPs) to drive penetration. We have taken a
20% drop in prices, since consumers enter the category and then upgrade.
22 March 2017
16

From the think tank
1. Gender diversity builds businesses. by Monica Vincent
n
Businesses are missing a trick if they fail to respect and accommodate the family
responsibilities of their employed women. Employer hostility towards working
women during their pregnancy and motherhood phase is a disgrace to say the
least. An increasing number of research studies show that tapping into the full
potential of women and benefiting from the innovation and creativity of gender
diversity is an investment with returns that build strong and viable economies
and enhance business outcomes.
2. Infrastructure in India: land not a problem, government owns
enough of it for most projects. by The Financial Express
n
While large industrial and infrastructure projects continue to fight an uphill task
when it comes to buying land—a Business Standard news story points out as
many as 280 cases challenging pending land acquisitions are already in the
Supreme Court—there may not be any problem when it comes to projects
within the boundaries of most cities. Business Standard cites a study by India
Development Foundation (IDF) which tries to quantify just how much land is
held by central ministries, state governments and local bodies—it does not talk
of PSUs.
3. Vodafone, Idea cellular join hands to beat Reliance Jio, but deal
of limited use unless Narendra Modi government fixes policy. by
The Financial Express
n
That an industrialist of the calibre of Kumar Mangalam Birla has been compelled
to collaborate with a rival—Vodafone Plc—in the telecom business is a
reflection not merely of the increasing competitive intensity in the space, but
also the government’s total disregard for the health of the sector. With a 42%
market share, the combined Vodafone-Idea will be better placed to fight the
RJio onslaught because of synergies—estimated at $2.1bn in the fourth year—
and a better balance sheet will help raise much-needed funds. But if
government policy continues to bleed the sector—telcos need to keep buying
spectrum to meet subscriber needs—even the merged Vodafone-Idea will find
the going difficult.
4. Does good economics make for good politics in india? by
Pramit Bhattacharya & Tadit Kundu
n
The choice of the controversial rabble-rouser and Hindutva mascot, Yogi
Adityanath, as the chief minister of Uttar Pradesh has once again rekindled an
old debate on the relative importance of economic performance and extra-
economic considerations in Indian politics. While conventional wisdom suggests
that identity always triumphs economics in Indian elections, there is some
evidence to suggest that economic growth may have become more important
than before in recent years. A Mint analysis of 18 major Indian states shows that
governments which deliver better growth may have a greater chance of being
re-elected.
22 March 2017
17

5. What is the fix for India? by v. Anantha nageswaran
n
One of the good things about the recently concluded elections to five state
assemblies is not the decisive victory of the Bharatiya Janata Party (BJP) in Uttar
Pradesh. In general, leaders do not take risks to do the right things from a
position of strength and the BJP is strong now. They do so from a position of
weakness, when their backs are to the wall. But what is decisively good, as
several have noted already, is that the people of Punjab looked into the abyss
and turned back. They did not choose to empower a political party that sought
to play the game of radicalism and schisms in a sensitive border state.
6. Red carpet, not red tape. by Aurodeep Nandi
n
Before RsMake in India' comes RsPermission to Make in India'. And that is why ease
of doing business is so important.But bureaucrats are generally better at making
laws and procedures than changing them. Regulation, however, is costly -not
just for businesses to comply to, but also for governments to check that
compliance. The absence of anyone calculating the cost of regulation in India
meant that very few in the system ever bothered to check if that additional
piece of paper, or that umpteenth no-objection certificate, was indeed leading
to anything productive or not. But the same department once in charge of
implementing the licence raj -the department of industrial policy and promotion
(Dipp) -is now trying to spark a red-tape revolution.
International
7. China and the US: An odd couple doomed to co-operation. by
Martin Wolf
n
The future of our world heavily depends on relations between the US, a young
country and the incumbent superpower, and China, an ancient empire and a
rising superpower. Making these relations particularly challenging have been the
election in the US of Donald Trump, a populist xenophobe, and the ascendancy
of Xi Jinping, a centralising autocrat, in China. No less contrasting, however, are
the perspectives of these two on the world economy. Forty years ago, Mao
Zedong ruled China: his aim was autarky. Ever since 1978, however, the
watchword of China’s economic policy has been the “reform and opening up”
proposed by his successor, Deng Xiaoping.
22 March 2017
18

Click excel icon
for detailed
valuation guide
CMP
(INR)
TP
% Upside
EPS (INR)
(INR) Downside FY17E FY18E FY19E
26
28
18
9
-4
9
10
4
13
6
-5
15
12
38
5
29.2
4.8
136.2
25.7
489.0
89.9
623.7
24.2
21.8
8.2
175.2
60.7
6.2
252.7
12.8
11.9
37.7
45.4
6.4
8.2
160.6 182.3
37.5
46.7
639.6 735.0
107.6 140.6
868.2 1,072.1
30.2
36.6
32.8
42.6
9.7
11.8
190.7 199.4
75.0
89.4
9.7
11.9
313.1 379.5
35.5
70.1
15.4
21.9
Valuation snapshot
P/E (x)
P/B (x)
ROE (%)
FY17E FY18E FY17E FY18E FY17E FY18E FY19E
29.6
18.5
21.3
39.6
46.9
14.3
39.9
29.0
24.2
26.6
19.1
21.3
33.7
24.1
37.1
37.0
27.5
34.7
23.3
26.6
19.3
25.3
15.8
20.1
28.8
NM
32.7
40.3
7.3
18.7
25.0
21.7
NM
12.1
50.5
8.7
20.4
21.2
31.6
18.0
26.8
34.5
18.5
11.8
48.3
31.1
13.4
15.6
23.9
37.6
11.8
22.9
13.9
18.1
27.1
35.8
12.0
28.7
23.3
16.0
22.6
17.5
17.3
21.5
19.4
13.3
28.6
18.9
19.5
19.2
23.2
16.2
21.1
15.2
15.5
23.7
5.8
26.6
28.6
6.6
15.3
19.7
8.9
7.5
7.9
12.0
8.2
6.9
11.2
12.6
5.0
10.6
26.3
20.9
10.1
38.6
28.2
10.8
13.1
21.3
28.6
10.1
5.9
4.0
6.0
6.0
9.2
2.2
14.2
5.6
2.7
3.8
7.0
3.2
2.3
5.6
1.9
8.9
4.1
2.1
2.4
2.4
1.8
4.4
1.9
1.4
4.2
0.7
4.2
4.4
0.7
3.8
3.0
1.1
0.5
0.6
0.7
0.9
0.3
0.8
1.2
0.5
0.9
7.1
4.1
1.8
13.7
5.8
3.3
2.8
2.7
2.8
2.2
4.8
3.4
5.3
5.2
7.7
1.9
10.2
4.7
2.4
3.4
6.0
2.9
2.1
4.6
1.7
7.2
3.6
1.9
2.1
2.2
1.6
3.8
1.7
1.3
3.6
0.6
3.6
3.9
0.6
3.2
2.7
1.0
0.5
0.6
0.7
0.8
0.3
0.7
1.1
0.5
0.8
5.8
3.4
1.6
11.3
5.3
3.0
2.4
2.5
2.7
1.9
21.6
23.1
30.0
15.9
18.8
16.4
41.1
21.2
11.4
14.2
40.1
14.3
7.7
22.8
5.2
26.4
15.0
6.3
10.9
11.3
9.4
18.6
10.4
7.4
15.5
-21.1
13.5
12.6
9.7
22.1
12.0
5.0
-2.4
4.9
1.4
10.4
1.7
3.9
3.9
2.8
3.3
22.5
29.6
16.6
31.0
19.6
26.0
19.1
11.4
7.7
19.8
23.1
26.3
31.0
20.6
23.4
16.9
41.2
21.8
15.6
14.9
36.8
13.6
10.3
23.2
13.3
27.9
18.9
10.3
11.8
9.9
10.4
19.3
9.9
8.9
16.4
11.6
14.5
14.4
10.0
22.6
13.6
11.5
7.0
7.2
5.8
10.2
4.8
6.8
9.2
9.7
7.9
24.1
18.0
16.6
32.1
19.6
28.9
19.5
12.2
9.7
20.3
22.9
28.2
30.9
22.0
22.6
18.9
37.1
22.1
17.7
15.9
33.0
14.5
11.3
23.2
22.2
31.4
22.0
17.3
13.1
11.1
12.1
19.8
11.3
10.2
17.2
12.5
16.0
17.7
11.3
23.0
15.5
14.4
8.9
10.3
7.3
11.1
5.6
8.6
11.5
13.0
10.1
25.9
19.4
17.2
31.6
19.0
32.3
19.6
14.0
11.4
20.8
Company
Automobiles
Amara Raja
Ashok Ley.
Bajaj Auto
Bharat Forge
Bosch
CEAT
Eicher Mot.
Endurance Tech.
Escorts
Exide Ind
Hero Moto
M&M
Mahindra CIE
Maruti Suzuki
Tata Motors
TVS Motor
Aggregate
Banks - Private
Axis Bank
DCB Bank
Equitas Hold.
Federal Bank
HDFC Bank
ICICI Bank
IDFC Bank
IndusInd
J&K Bank
Kotak Mah. Bk
RBL Bank
South Indian
Yes Bank
Aggregate
Banks - PSU
BOB
BOI
Canara
IDBI Bk
Indian Bk
OBC
PNB
SBI
Union Bk
Aggregate
NBFCs
Bajaj Fin.
Bharat Fin.
Dewan Hsg.
GRUH Fin.
HDFC
Indiabulls Hsg
LIC Hsg Fin
Manappuram
M&M Fin.
Muthoot Fin
Reco
Buy
Buy
Buy
Buy
Neutral
Buy
Buy
Buy
Buy
Buy
Neutral
Buy
Not Rated
Buy
Buy
Buy
864
1,087
89
114
2,909 3,432
1,018 1,110
22,911 22,049
1,288 1,406
24,902 27,458
703
732
526
596
219
233
3,343 3,190
1,294 1,486
209
-
6,077 6,808
473
653
440
462
Neutral
Neutral
Buy
Buy
Buy
Buy
Neutral
Buy
Neutral
Buy
Buy
Neutral
Buy
488
165
161
89
1,442
272
61
1,391
75
860
501
20
1,487
535
134
240
105
1,510
345
68
1,535
75
940
450
21
1,575
10
-19
49
18
5
27
11
10
0
9
-10
3
6
14.1
7.1
6.1
4.6
56.9
17.2
3.1
48.4
-25.2
26.3
12.4
2.8
79.3
25.0
8.6
6.9
5.5
68.3
17.9
3.9
58.7
13.0
32.3
17.5
3.1
97.0
46.8
10.9
8.7
6.9
81.5
21.8
4.9
71.2
15.4
41.3
24.6
3.8
118.4
Buy
Neutral
Neutral
Neutral
Buy
Neutral
Buy
Buy
Neutral
163
129
289
77
265
135
143
272
153
221
123
300
49
330
114
185
350
172
36
-4
4
-36
25
-15
30
29
13
7.5
-5.6
23.9
1.5
30.4
6.6
6.7
8.6
8.5
18.3
17.1
36.7
6.4
32.2
19.6
12.7
21.6
30.5
25.3
23.2
56.0
8.6
38.1
24.1
17.2
29.5
45.3
Buy
Neutral
Buy
Neutral
Buy
Buy
Buy
Not Rated
Buy
Buy
1,175
826
361
380
1,458
934
588
91
317
350
1,276
848
405
348
1,580
1,015
693
-
323
409
9
3
12
-8
8
9
18
2
17
34.1
44.6
30.7
7.9
46.8
69.5
37.6
3.8
8.4
29.7
44.6
39.5
35.6
9.8
51.7
86.2
44.7
4.3
11.1
34.7
59.3
51.5
42.0
11.7
57.3
109.6
52.6
5.2
13.9
40.5
22 March 2017
19

Click excel icon
for detailed
valuation guide
CMP
(INR)
144
674
168
2,030
1,047
TP
% Upside
EPS (INR)
(INR) Downside FY17E FY18E FY19E
117
-18
24.0
25.5
40.5
752
12
29.0
34.2
40.5
134
-20
29.4
35.3
39.9
2,500
1,225
23
17
91.2
58.1
130.5
77.9
164.2
96.7
Valuation snapshot
P/E (x)
P/B (x)
ROE (%)
FY17E FY18E FY17E FY18E FY17E FY18E
6.0
5.6
1.0
0.9
16.8
16.2
23.2
19.7
3.8
3.2
17.5
17.5
5.7
4.7
1.0
0.9
18.8
19.5
22.3
18.0
17.2
64.8
25.7
30.5
43.3
20.0
33.8
52.5
50.4
9.1
16.8
28.9
11.7
73.3
38.6
85.3
37.3
22.4
29.5
33.2
48.5
41.8
32.5
58.8
15.5
22.3
27.1
76.0
22.5
NM
NM
42.1
42.9
33.7
52.7
45.7
45.2
38.6
42.7
46.1
34.3
46.9
34.3
47.0
48.1
53.4
15.6
13.5
14.8
45.8
21.7
29.6
36.2
18.8
29.5
28.6
37.4
10.7
14.4
23.8
9.9
48.5
32.9
33.1
32.7
17.2
24.4
27.5
32.3
30.3
17.0
37.4
12.6
15.3
23.8
36.8
20.5
42.2
38.5
28.0
30.9
24.3
46.5
39.6
38.0
33.9
35.0
39.7
30.2
42.0
30.3
39.6
41.2
44.0
2.7
2.1
3.0
7.7
4.7
1.2
32.8
1.1
7.2
6.3
10.2
1.8
2.6
3.0
1.7
6.7
6.6
-2.1
4.3
3.1
4.7
3.6
2.4
3.1
1.9
4.1
1.8
1.3
3.4
3.9
4.2
2.9
5.3
7.7
4.8
3.3
16.1
17.5
23.6
10.1
12.6
9.6
8.0
32.3
9.1
7.1
14.4
20.1
2.3
1.9
2.6
6.6
4.1
1.2
22.3
1.0
6.6
5.6
9.2
1.5
2.3
2.8
1.4
5.8
5.7
-2.2
4.0
2.7
4.2
3.3
2.3
3.2
1.8
3.7
1.6
1.2
3.1
3.8
3.6
2.7
4.8
6.1
4.2
3.0
14.1
13.9
22.1
8.6
10.7
8.2
7.0
33.6
8.0
6.5
12.4
17.3
12.7
12.3
17.2
11.9
19.7
4.0
94.3
5.4
22.6
11.7
20.3
21.2
16.6
10.9
14.5
9.2
18.4
NM
12.1
8.9
17.1
10.8
5.0
7.5
6.0
7.2
12.0
5.8
13.3
5.2
20.3
-3.7
-3.1
19.9
11.7
9.9
32.5
42.9
54.9
28.3
33.8
22.4
25.1
67.6
28.4
15.7
33.3
35.9
16.1
14.7
17.7
14.4
19.0
4.0
73.3
5.5
23.2
20.7
24.6
15.3
16.8
12.2
14.6
11.9
18.6
-6.7
12.6
16.7
18.2
11.9
7.4
10.4
10.9
10.4
13.1
7.6
13.6
10.5
18.9
6.6
13.1
24.4
14.5
12.5
32.3
39.1
60.1
27.3
33.0
22.2
24.7
78.4
28.1
17.2
32.4
39.2
FY19E
22.3
17.7
18.9
17.6
16.1
18.9
15.9
19.3
4.0
66.1
6.0
25.3
19.2
25.1
14.3
16.2
13.6
16.6
14.2
19.0
-8.4
13.1
17.3
18.8
12.9
7.7
13.2
13.3
13.4
14.7
7.8
16.0
14.7
20.0
11.3
20.8
24.3
15.8
14.0
32.5
37.9
68.5
27.2
33.2
21.9
23.1
92.5
28.2
18.3
34.5
42.3
Company
Reco
PFC
Neutral
Repco Home
Buy
REC
Neutral
Shriram City
Buy
Union
STF
Buy
Aggregate
Capital Goods
ABB
Neutral
Bharat Elec.
Buy
BHEL
Sell
CG Cons. Elec.
Buy
CG Power & Indu. Sell
Cummins
Neutral
GE T&D
Neutral
Havells
Neutral
Inox Wind
Neutral
K E C Intl
Buy
L&T
Buy
Pennar Eng.
Not Rated
Siemens
Neutral
Solar Ind
Neutral
Suzlon Energy
Not Rated
Thermax
Sell
Va Tech Wab.
Buy
Voltas
Neutral
Aggregate
Cement
Ambuja Cem.
Buy
ACC
Neutral
Birla Corp.
Buy
Dalmia Bharat
Buy
Grasim Inds.
Neutral
India Cem
Neutral
J K Cements
Buy
JK Lakshmi Ce
Buy
Ramco Cem
Buy
Orient Cem
Buy
Prism Cem
Buy
Shree Cem
Buy
Ultratech
Buy
Aggregate
Consumer
Asian Paints
Neutral
Britannia
Buy
Colgate
Buy
Dabur
Neutral
Emami
Buy
Godrej Cons.
Neutral
GSK Cons.
Neutral
HUL
Neutral
ITC
Buy
Jyothy Lab
Neutral
Marico
Buy
Nestle
Neutral
1,194
159
169
197
73
900
316
451
177
177
1,550
123
1,247
735
19
912
594
388
1,190
180
115
205
45
990
340
425
175
175
1,660
-
1,340
800
-
781
760
365
0
13
-32
4
-38
10
8
-6
-1
-1
7
7
9
-14
28
-6
18.4
6.2
5.5
4.6
3.6
26.6
6.0
8.9
19.4
10.5
53.6
10.5
17.0
19.0
0.2
24.4
26.5
13.1
26.1
7.3
5.7
5.5
3.9
30.5
11.0
12.1
16.5
12.3
65.0
12.4
25.7
22.3
0.6
27.9
34.5
15.9
32.6
8.5
5.8
6.7
4.5
36.5
11.4
14.1
17.6
13.5
79.7
16.8
33.5
26.5
0.7
31.3
40.3
18.8
237
277
1,412 1,339
700
869
1,898 2,246
1,091 1,067
163
138
885
1,024
450
455
654
815
134
167
101
112
16,296 19,006
4,005 4,058
17
-5
24
18
-2
-16
16
1
25
25
11
17
1
4.9
33.7
21.5
32.3
70.2
7.3
32.6
5.9
29.0
-1.8
-0.6
387.1
93.5
7.3
46.7
41.2
50.7
86.5
10.7
37.2
12.2
31.9
3.2
2.6
582.8
129.6
7.9
58.6
54.1
73.8
110.7
12.4
49.3
17.8
40.1
5.8
4.8
729.9
161.2
1,067
3,289
980
281
1,044
1,698
5,407
904
288
356
292
6,333
1,035
3,775
1,170
300
1,260
1,655
5,300
865
295
365
330
6,840
-3
15
19
7
21
-3
-2
-4
3
3
13
8
20.2
71.9
21.7
7.3
24.5
36.8
157.7
19.3
8.4
7.6
6.1
118.7
22.9
83.0
25.8
8.3
29.8
42.8
178.8
21.5
9.5
9.0
7.1
144.0
26.8
101.3
31.6
9.7
36.0
49.6
190.8
24.8
10.8
10.5
8.4
171.0
22 March 2017
20

Click excel icon
for detailed
valuation guide
CMP
TP
% Upside
(INR) (INR) Downside
14,605 16,910
16
220
215
-2
699
720
3
6,829 8,250
21
774
1,044
35
2,160 2,885
34
EPS (INR)
FY18E FY19E
305.1 388.4
9.7
12.1
18.3
20.5
167.7 198.8
15.4
19.8
47.0
64.0
Valuation snapshot
P/E (x)
P/B (x)
ROE (%)
FY17E FY18E FY17E FY18E FY17E FY18E
62.0
47.9
25.6
20.2
41.3
42.2
31.3
22.7
2.5
2.3
10.8
10.5
42.0
38.2
10.8
8.8
28.0
25.4
46.9
40.7
12.7
10.9
29.0
28.8
72.6
50.4
8.7
7.5
12.6
16.0
75.4
46.0
14.2
11.0
20.8
24.0
42.3
36.6
12.5
10.9
29.5
29.8
25.6
26.8
32.9
17.1
34.5
36.8
32.6
14.0
33.7
60.8
21.4
19.2
79.7
34.9
23.5
35.5
25.5
41.0
25.4
27.1
18.0
49.6
34.4
29.5
17.0
13.1
31.2
63.6
18.3
NM
NM
11.0
10.3
16.0
67.9
NM
30.1
42.8
35.4
11.5
15.5
NM
14.1
21.3
24.8
28.9
14.7
32.2
25.0
24.6
12.4
20.3
56.4
18.1
16.7
49.6
19.7
18.4
28.3
19.9
33.1
18.9
21.2
15.4
39.2
27.1
16.5
8.9
10.6
23.6
34.0
16.2
43.7
NM
9.9
10.1
14.1
39.5
14.1
25.5
29.7
25.5
8.7
10.9
NM
10.1
5.8
6.0
10.3
4.4
5.1
7.4
3.7
3.6
3.2
2.0
4.4
3.3
17.8
2.8
4.9
5.8
4.9
8.3
6.1
4.8
2.4
22.0
2.9
2.2
2.3
2.0
3.4
20.4
4.7
0.9
2.9
1.9
0.8
3.1
6.9
4.0
7.6
10.1
6.1
1.8
3.0
0.3
2.2
4.8
5.0
7.9
3.4
4.6
6.0
3.2
3.1
2.8
1.7
3.4
2.3
21.3
2.5
4.0
5.3
4.1
6.8
5.1
4.1
2.2
16.8
2.7
2.1
2.1
1.7
3.1
12.7
4.1
0.9
3.1
1.6
0.7
2.7
6.0
2.7
6.9
8.2
5.3
1.5
2.5
0.3
1.8
24.8
24.4
35.9
29.0
14.7
21.4
11.2
26.7
10.0
3.4
20.5
19.9
22.4
8.4
22.9
16.4
20.0
22.2
26.0
17.9
12.0
50.5
8.6
7.6
12.4
16.7
11.0
38.2
27.0
-4.1
-16.6
19.3
7.7
20.7
10.6
-10.2
25.1
31.3
17.3
16.1
20.9
-8.0
16.4
24.7
22.0
30.9
26.0
14.1
26.5
13.2
26.5
14.9
3.3
18.9
16.6
43.0
13.5
23.9
18.7
22.3
22.5
29.2
19.2
14.9
48.6
10.3
12.9
19.4
17.8
13.3
46.1
27.1
2.1
-6.1
17.8
7.1
20.6
16.3
23.5
27.3
30.3
20.6
18.8
25.2
-4.5
19.6
FY19E
43.2
12.9
23.4
29.5
17.8
24.9
30.3
25.3
21.7
29.9
23.8
15.7
27.9
14.7
25.7
16.1
6.0
19.1
18.4
56.9
15.9
22.1
19.8
22.4
20.7
29.6
19.5
15.0
46.8
10.6
15.3
25.4
18.6
14.3
44.7
27.5
8.1
3.3
16.9
7.0
20.4
22.0
11.2
29.0
29.3
21.7
17.7
22.0
-0.6
17.1
Company
Page Inds
Parag Milk
Pidilite Ind.
P&G Hygiene
United Brew
United Spirits
Aggregate
Healthcare
Alembic Phar
Alkem Lab
Ajanta Pharma
Aurobindo
Biocon
Cadila
Cipla
Divis Lab
Dr Reddy’s
Fortis Health
Glenmark
Granules
GSK Pharma
IPCA Labs
Lupin
Sanofi India
Sun Pharma
Syngene Intl
Torrent Pharma
Aggregate
Logistics
Allcargo Logistics
Blue Dart
Concor
Gateway
Distriparks
Gati
Transport Corp.
Aggregate
Media
Dish TV
D B Corp
Den Net.
Hathway Cab.
Hind. Media
HT Media
Jagran Prak.
PVR
Siti Net.
Sun TV
Zee Ent.
Aggregate
Metals
Hindalco
Hind. Zinc
JSPL
JSW Steel
Reco
Buy
Neutral
Neutral
Buy
Buy
Buy
FY17E
235.6
7.0
16.6
145.7
10.7
28.6
Neutral
Neutral
Buy
Buy
Sell
Buy
Neutral
Neutral
Neutral
Buy
Neutral
Buy
Neutral
Neutral
Buy
Buy
Buy
Not Rated
Buy
596
2,128
1,845
691
1,145
442
591
634
2,623
180
890
134
2,753
552
1,455
4,574
699
533
1,441
630
1,850
2,028
915
750
510
550
815
3,050
240
990
160
2,700
540
1,850
5,000
850
-
1,700
6
-13
10
32
-35
15
-7
28
16
34
11
19
-2
-2
27
9
22
18
23.2
79.3
56.0
40.5
33.2
12.0
18.1
45.4
77.7
3.0
41.6
7.0
34.5
15.8
61.8
129.0
27.4
13.0
56.8
27.9
85.7
63.8
47.0
35.6
17.7
24.1
51.0
129.4
3.2
49.2
8.0
55.5
27.9
79.0
161.6
35.1
16.1
76.3
35.1
100.0
79.6
54.6
44.5
23.0
31.1
57.0
160.2
6.5
60.5
11.7
64.4
37.3
89.3
193.8
42.2
18.0
93.4
Buy
Not Rated
Neutral
Buy
Not Rated
Not Rated
170
5,088
1,239
258
142
222
191
-
1,309
314
-
-
12
6
21
9.5
102.5
36.0
8.8
8.4
16.9
11.1
129.9
45.8
15.7
15.9
21.0
12.5
163.2
50.0
20.1
23.9
25.9
Buy
Buy
Neutral
Buy
Buy
Neutral
Buy
Buy
Neutral
Neutral
Buy
107
387
81
38
290
83
172
1,411
38
757
523
115
450
75
47
355
85
215
1,533
40
735
600
8
16
-7
24
22
3
25
9
5
-3
15
1.7
21.1
-3.6
-2.4
26.5
8.0
10.8
20.8
-0.9
25.1
12.2
3.2
23.9
1.9
-0.8
29.4
8.2
12.2
35.7
2.7
29.7
17.6
4.8
27.4
7.7
0.4
33.2
8.7
13.9
56.8
1.2
34.5
20.9
Buy
Neutral
Buy
Buy
198
307
128
192
240
307
180
226
21
0
41
18
17.2
19.8
-23.9
13.6
22.9
28.2
-17.5
19.0
25.6
29.5
-2.2
19.4
22 March 2017
21

Click excel icon
for detailed
valuation guide
CMP
(INR)
74
137
63
262
497
TP
% Upside
EPS (INR)
(INR) Downside FY17E FY18E FY19E
83
13
3.6
5.3
5.5
179
31
12.2
12.3
12.9
28
-56
-8.7 -14.2
-1.3
279
7
18.9
31.1
33.1
401
-19
17.4
43.8
51.4
Valuation snapshot
P/E (x)
P/B (x)
ROE (%)
FY17E FY18E FY17E FY18E FY17E FY18E
20.6
13.8
1.4
1.3
6.9
9.7
11.2
11.1
1.8
1.7
13.5
15.6
NM
NM
0.7
0.9
-9.6 -17.9
13.8
8.4
1.5
1.4
11.7
17.1
28.6
11.3
4.1
3.2
12.6
31.3
20.3
13.4
1.5
1.4
7.4
10.5
11.3
20.8
15.5
18.1
9.4
8.5
24.0
7.8
12.1
15.4
17.3
12.6
12.6
85.3
80.6
50.2
54.8
14.5
14.8
16.0
16.4
11.4
13.0
18.9
13.8
10.9
16.1
25.3
18.3
14.7
14.9
13.2
16.7
30.9
20.1
NM
87.8
39.1
17.1
16.7
16.9
13.5
12.6
14.6
11.6
23.3
13.0
14.5
11.2
9.3
24.2
8.0
8.5
9.2
14.7
11.0
11.0
48.9
41.2
48.0
47.9
12.2
13.2
14.3
15.2
9.7
12.2
14.1
14.2
8.4
13.5
20.8
17.0
13.0
13.4
10.6
15.5
45.7
18.7
NM
23.8
112.2
14.6
11.2
20.7
11.3
10.9
12.5
2.9
1.1
1.9
2.1
2.5
2.1
5.0
2.2
1.1
1.3
3.9
1.4
1.7
8.9
3.2
9.9
8.9
2.3
3.7
3.9
3.4
1.7
4.9
3.1
2.1
1.5
2.5
9.7
5.8
2.7
2.4
2.4
4.0
2.0
3.2
1.4
-94.5
2.3
6.0
1.9
1.2
1.4
2.0
2.3
2.5
1.1
1.7
1.9
2.2
1.8
4.3
1.8
1.0
1.3
3.3
1.3
1.5
9.7
3.0
8.7
8.1
2.0
3.7
3.3
3.1
1.4
4.1
2.8
2.0
1.3
2.4
7.7
5.9
2.4
2.2
2.1
3.7
2.0
2.9
1.7
31.7
2.3
6.0
1.7
1.1
1.3
1.8
2.1
27.5
5.3
14.1
12.0
27.9
25.9
22.1
31.0
9.5
8.7
24.4
11.7
13.2
10.4
4.2
21.2
16.2
15.7
27.3
26.5
23.2
14.0
41.8
17.1
14.1
14.2
17.5
42.5
33.9
20.1
17.0
20.0
23.7
6.7
15.7
-4.4
-75.4
5.8
35.2
11.0
7.0
10.8
17.4
15.8
23.4
4.6
13.7
13.5
20.7
20.7
19.3
24.7
12.7
14.4
24.2
12.1
13.9
19.9
7.7
19.3
16.8
16.5
27.7
25.0
22.5
15.9
36.2
21.0
14.4
16.5
18.9
41.3
33.4
20.0
17.0
21.1
24.0
4.3
15.9
-21.4
402.2
2.0
41.0
15.8
5.6
11.9
17.5
17.1
FY19E
9.3
15.0
-1.8
16.4
28.9
12.2
21.8
4.6
13.7
14.5
18.7
19.1
19.4
22.5
12.1
14.2
27.4
11.7
13.5
25.1
11.0
19.7
18.1
16.2
27.8
22.2
22.3
15.1
32.8
21.1
14.8
15.5
20.6
40.8
33.3
19.7
17.3
19.8
23.1
6.4
16.7
-28.5
97.6
4.0
46.0
15.2
2.2
13.3
17.7
18.0
Company
Nalco
NMDC
SAIL
Vedanta
Tata Steel
Aggregate
Oil & Gas
BPCL
Cairn India
GAIL
Gujarat St. Pet.
HPCL
IOC
IGL
MRPL
Oil India
ONGC
PLNG
Reliance Ind.
Aggregate
Retail
Jubilant Food
Shopper's Stop
Titan Co.
Aggregate
Technology
Cyient
HCL Tech.
Hexaware
Infosys
KPIT Tech
L&T Infotech
Mindtree
Mphasis
NIIT Tech
Persistent Sys
Tata Elxsi
TCS
Tech Mah
Wipro
Zensar Tech
Aggregate
Telecom
Bharti Airtel
Bharti Infratel
Idea Cellular
Tata Comm
Aggregate
Utiltites
Coal India
CESC
JSW Energy
NTPC
Power Grid
Aggregate
Reco
Buy
Buy
Sell
Neutral
Sell
Buy
Neutral
Neutral
Neutral
Buy
Buy
Neutral
Neutral
Buy
Neutral
Buy
Neutral
642
291
370
160
506
372
1,030
101
333
194
395
1,264
778
-
335
163
620
458
1,032
114
382
204
460
1,240
21
-10
2
23
23
0
13
15
5
17
-2
56.6
14.0
23.9
8.8
53.8
43.5
43.0
12.9
27.5
12.6
22.8
100.2
55.5
12.5
28.5
11.0
45.0
39.9
42.6
12.7
39.0
21.1
26.9
115.1
60.0
12.8
31.0
13.2
46.2
41.7
49.9
13.9
39.8
21.0
36.6
122.7
Neutral
Neutral
Neutral
1,094
330
464
1,008
300
420
-8
-9
-9
12.8
4.1
9.2
22.4
8.0
9.7
29.9
12.6
11.2
Buy
Buy
Neutral
Buy
Neutral
Buy
Neutral
Neutral
Neutral
Neutral
Buy
Neutral
Buy
Neutral
Buy
475
857
220
1,032
134
704
475
590
417
625
1,502
2,486
477
498
902
600
1,000
220
1,250
150
800
530
550
470
730
1,780
2,550
580
540
1,250
26
17
0
21
12
14
12
-7
13
17
19
3
22
9
39
32.8
58.1
13.7
62.8
11.7
54.2
25.1
42.6
38.2
38.9
59.3
135.6
32.5
33.4
68.6
39.1
65.1
15.3
67.8
13.8
57.5
33.7
41.4
49.3
46.2
72.1
146.5
36.7
37.2
85.0
43.3
70.6
15.9
74.4
15.3
62.3
38.1
45.0
51.9
52.6
89.0
159.2
41.5
41.7
93.3
Buy
Buy
Buy
Buy
350
313
93
746
410
435
120
811
17
39
29
9
11.3
15.6
-3.1
8.5
7.7
16.7
-13.2
31.4
11.8
19.9
-14.0
44.8
Neutral
Buy
Buy
Buy
Buy
293
838
62
162
193
315
970
81
199
243
8
16
30
23
26
17.2
50.2
3.7
12.0
15.3
20.0
74.5
3.0
14.3
17.7
22.5
82.1
1.2
17.3
20.7
22 March 2017
22

Click excel icon
for detailed
valuation guide
CMP
(INR)
400
539
420
244
332
2,820
244
935
190
837
250
96
596
545
421
722
1,126
2,509
881
1,856
1,604
301
1,445
5,981
173
385
TP
% Upside
EPS (INR)
(INR) Downside FY17E FY18E FY19E
430
483
510
211
-
3,388
287
1,010
205
1,075
207
-
443
577
551
843
1,400
-
1,046
2,200
1,825
371
1,053
5,326
125
393
19
19
14
23
-27
-11
-27
2
-26
6
31
17
24
20
18
8
8
28
-17
7
-10
22
-14
13.5
10.9
13.6
4.6
16.3
67.6
12.4
39.3
13.7
16.9
2.5
5.5
17.2
23.4
26.0
14.9
28.3
72.9
30.4
74.5
82.4
7.5
27.0
107.8
3.7
7.0
21.8
14.2
13.8
8.8
20.0
112.9
13.9
54.1
17.1
19.0
8.2
7.6
18.5
28.6
31.0
23.1
40.8
89.3
34.8
127.1
99.9
10.1
35.1
139.9
4.6
11.9
28.6
17.7
14.6
11.3
25.5
166.7
16.9
72.2
20.6
21.9
11.5
10.0
22.1
36.1
36.7
38.3
54.3
109.3
43.6
164.7
125.1
13.3
42.9
178.6
5.4
16.0
Valuation snapshot
P/E (x)
P/B (x)
ROE (%)
FY17E FY18E FY17E FY18E FY17E FY18E FY19E
29.6
49.6
30.7
53.4
20.4
41.7
19.7
23.8
13.9
49.4
100.0
17.3
34.7
23.2
16.2
48.4
39.8
34.4
29.0
24.9
19.5
40.2
53.5
55.5
46.7
55.1
18.4
38.0
30.3
27.8
16.6
25.0
17.6
17.3
11.1
44.1
30.6
12.6
32.3
19.1
13.6
31.2
27.6
28.1
25.3
14.6
16.1
29.6
41.2
42.8
37.8
32.2
2.7
5.4
32.4
9.3
3.6
5.8
6.6
16.4
4.0
5.3
3.9
1.5
5.3
3.9
4.4
3.5
4.3
10.4
8.0
2.4
3.1
5.2
29.1
8.9
12.3
5.0
2.4
4.9
29.3
7.5
3.2
4.7
5.3
14.3
2.9
4.9
3.5
1.4
4.7
3.6
3.5
3.3
4.0
9.8
6.3
2.2
2.7
4.6
24.8
8.0
9.9
4.5
10.4
11.3
110.9
18.2
18.5
15.1
37.8
72.8
33.8
11.1
3.8
8.6
16.5
17.3
29.9
8.6
11.4
30.4
30.9
10.0
16.5
13.5
56.8
16.6
29.4
9.5
14.0
13.4
101.4
29.8
20.4
20.7
33.1
88.1
30.2
11.5
11.5
11.7
15.5
19.8
28.7
9.6
15.2
35.9
27.9
15.7
17.4
16.6
65.0
19.7
29.1
14.8
16.3
15.0
97.0
30.7
22.8
24.3
32.5
101.2
26.8
12.3
14.3
14.8
16.2
22.9
27.7
16.3
18.5
39.6
27.8
18.2
19.1
19.1
66.3
22.4
27.6
17.5
Company
Others
Arvind
Bata India
Castrol India
Century Ply.
Reco
Buy
Buy
Buy
Buy
Under
Coromandel Intl
Review
Dynamatic Tech Buy
Eveready Inds. Buy
Interglobe
Neutral
Indo Count
Buy
Info Edge
Buy
Inox Leisure
Sell
Under
Jain Irrigation
Review
Just Dial
Buy
Kaveri Seed
Neutral
Kitex Garm.
Buy
Manpasand
Buy
MCX
Buy
Under
Monsanto
Review
PI Inds.
Buy
Piramal Enterp. Buy
SRF
Buy
S H Kelkar
Buy
Symphony
Sell
TTK Prestige
Neutral
V-Guard
Neutral
Wonderla
Buy
22 March 2017
23

MOSL Universe stock performance
Company
Automobiles
Amara Raja
Ashok Ley.
Bajaj Auto
Bharat Forge
Bosch
CEAT
Eicher Mot.
Endurance Tech.
Escorts
Exide Ind
Hero Moto
M&M
Mahindra CIE
Maruti Suzuki
Tata Motors
TVS Motor
Banks - Private
Axis Bank
DCB Bank
Equitas Hold.
Federal Bank
HDFC Bank
ICICI Bank
IDFC Bank
IndusInd
J&K Bank
Kotak Mah. Bk
RBL Bank
South Indian
Yes Bank
Banks - PSU
BOB
BOI
Canara
IDBI Bk
Indian Bk
OBC
PNB
SBI
Union Bk
NBFCs
Bajaj Fin.
Bharat Fin.
Dewan Hsg.
GRUH Fin.
HDFC
Indiabulls Hsg
LIC Hsg Fin
Manappuram
M&M Fin.
Muthoot Fin
PFC
Repco Home
REC
STF
Shriram City Union
1 Day (%)
-1.2
-0.4
-0.5
-1.9
1.0
0.7
-0.5
0.4
1.4
-0.1
0.0
-0.5
-1.7
-1.4
-0.6
-0.1
-3.3
0.5
-1.1
2.2
0.5
-1.1
-0.6
1.3
-0.6
0.5
0.7
-0.2
-1.8
-1.6
-0.2
-1.8
-0.3
-1.8
0.7
-1.8
-0.6
-3.2
-0.3
-0.1
-0.2
0.5
0.2
-3.2
-0.5
-1.7
0.5
1.6
-1.5
-0.1
-0.6
-0.5
0.4
1M (%)
0.5
-6.6
3.4
-5.8
5.4
15.6
-1.3
4.7
25.3
2.0
6.8
-1.6
-0.3
0.2
3.1
2.1
-3.3
8.4
-11.3
3.1
2.1
-4.5
-2.9
5.0
3.9
7.7
17.5
-1.9
2.5
-3.6
0.3
-1.8
-6.7
-8.9
7.2
-0.8
0.6
5.2
7.2
-5.0
12.0
3.0
3.5
7.4
5.4
-9.5
5.9
0.3
5.5
0.7
7.9
10.4
7.5
12M (%)
-4.6
-13.6
25.6
16.3
18.7
14.0
35.5
289.7
61.3
19.2
5.4
6.9
65.6
26.4
43.6
10.0
111.4
76.0
38.0
15.9
30.2
49.9
23.4
29.2
26.6
78.8
10.7
29.9
53.7
10.3
147.2
45.3
64.8
38.5
16.8
76.4
54.7
94.8
58.7
26.8
44.7
25.0
153.2
31.8
96.9
65.3
14.4
97.1
12.5
33.8
Company
Capital Goods
ABB
Bharat Elec.
BHEL
CG Cons. Elec.
CG Power & Inds Sol.
Cummins
GE T&D
Havells
Inox Wind
K E C Intl
L&T
Pennar Eng.
Siemens
Solar Ind
Suzlon Energy
Thermax
Va Tech Wab.
Voltas
Cement
Ambuja Cem.
ACC
Birla Corp.
Dalmia Bharat
Grasim Inds.
India Cem
J K Cements
JK Lakshmi Ce
Ramco Cem
Orient Cem
Prism Cem
Shree Cem
Ultratech
Consumer
Asian Paints
Britannia
Colgate
Dabur
Emami
Godrej Cons.
GSK Cons.
HUL
ITC
Jyothy Lab
Marico
Nestle
Page Inds
Parag Milk
Pidilite Ind.
P&G Hygiene
United Brew
United Spirits
Healthcare
Alembic Phar
Alkem Lab
Ajanta Pharma
Aurobindo
1 Day (%)
-2.0
-1.9
-0.7
1.2
-0.7
-0.3
0.9
1.0
-1.7
0.0
0.7
-3.4
0.7
-1.1
-1.1
0.2
0.0
-0.5
1.1
0.2
-0.5
-0.5
2.7
1.1
-1.5
4.6
-0.4
0.3
1.5
1.5
-0.6
-1.2
1.4
-0.5
0.6
-2.1
0.3
-0.8
0.3
2.0
1.5
-0.2
0.8
-0.2
0.2
-0.1
1.6
0.1
-1.2
-0.6
1.1
1.4
-1.7
1M (%)
-2.3
2.2
9.4
4.2
7.8
0.0
5.5
7.2
-0.9
4.3
4.5
2.3
2.6
0.0
7.2
6.8
13.2
7.1
-0.9
-3.7
-1.4
0.3
2.0
-5.1
-0.6
14.1
-3.4
0.5
5.4
3.2
6.1
7.7
1.9
7.2
3.2
-6.6
-0.2
3.5
4.5
9.2
-1.0
6.3
-0.2
1.6
-1.9
-0.3
-1.5
-3.6
-10.6
0.5
6.8
7.0
0.8
12M (%)
1.6
35.3
51.0
53.6
6.5
-16.5
50.5
-35.0
46.1
26.2
-17.3
17.3
5.9
42.9
18.3
11.4
41.4
2.0
2.7
81.0
139.5
46.2
92.9
41.1
33.2
55.0
-11.6
23.7
29.3
24.2
24.2
20.8
15.3
11.4
9.1
26.9
-9.5
2.4
30.6
25.5
18.2
20.7
25.0
17.6
10.6
-4.6
-17.5
-2.5
57.9
36.9
-7.0
22 March 2017
24

MOSL Universe stock performance
Company
Biocon
Cadila
Cipla
Divis Lab
Dr Reddy’s
Fortis Health
Glenmark
Granules
GSK Pharma
IPCA Labs
Lupin
Sanofi India
Sun Pharma
Syngene Intl
Torrent Pharma
Logistics
Allcargo Logistics
Blue Dart
Concor
Gateway Distriparks
Gati
Transport Corp.
Media
Dish TV
D B Corp
Den Net.
Hathway Cab.
Hind. Media
HT Media
Jagran Prak.
PVR
Siti Net.
Sun TV
Zee Ent.
Metals
Hindalco
Hind. Zinc
JSPL
JSW Steel
Nalco
NMDC
SAIL
Vedanta
Tata Steel
Oil & Gas
BPCL
Cairn India
GAIL
Gujarat St. Pet.
HPCL
IOC
IGL
MRPL
Oil India
ONGC
PLNG
Reliance Ind.
1 Day (%)
1.6
-0.9
-0.9
-19.8
-4.3
0.1
1.1
-0.1
-0.1
1.8
-0.8
3.0
-1.1
-1.0
0.0
0.7
0.6
-0.7
0.1
-1.4
-3.1
1.9
0.3
-0.3
-1.7
-1.1
-1.7
-1.9
-0.1
-0.9
-1.0
0.1
1.8
-1.4
-0.6
-0.8
-0.8
-0.4
-0.9
-0.7
0.0
-0.2
-1.0
-1.7
-0.2
-1.1
0.2
-0.6
-0.5
-0.7
1.6
0.2
-1.3
1M (%)
1.1
0.5
-0.2
-16.8
-9.5
-6.9
-6.2
2.4
2.6
0.0
-1.2
9.7
3.9
3.5
9.8
1.9
17.7
1.1
2.9
14.8
8.7
14.8
1.7
-1.2
4.5
8.4
-3.2
-9.3
11.7
-0.1
7.3
-0.3
9.3
1.3
16.7
2.6
11.0
-4.3
1.4
-2.7
1.2
-8.9
-0.7
-5.9
-0.2
-10.0
-4.8
-1.8
-7.4
0.8
-1.3
-1.4
16.1
12M (%)
144.7
29.5
10.4
-35.9
-17.6
-1.6
9.4
10.5
-19.9
-1.0
-5.5
10.1
-16.3
34.5
7.0
8.5
-15.8
3.5
-2.5
27.7
27.3
26.3
24.2
-9.8
6.3
16.9
4.2
15.4
99.6
7.2
107.2
33.8
131.9
79.2
111.8
58.0
85.1
39.4
47.5
178.2
63.9
47.6
85.1
36.3
16.3
98.9
88.3
92.0
76.3
39.4
33.9
55.1
22.0
Company
Retail
Jubilant Food
Shopper's Stop
Titan Co.
Technology
Cyient
HCL Tech.
Hexaware
Infosys
KPIT Tech
L&T Infotech
Mindtree
Mphasis
NIIT Tech
Persistent Sys
Tata Elxsi
TCS
Tech Mah
Wipro
Zensar Tech
Telecom
Bharti Airtel
Bharti Infratel
Idea Cellular
Tata Comm
Utiltites
Coal India
CESC
JSW Energy
NTPC
Power Grid
Others
Arvind
Bata India
Castrol India
Century Ply.
Coromandel Intl
Dynamatic Tech
Eveready Inds.
Interglobe
Indo Count
Info Edge
Inox Leisure
Jain Irrigation
Just Dial
Kaveri Seed
Kitex Garm.
Manpasand
MCX
Monsanto
PI Inds.
Piramal Enterp.
SRF
S H Kelkar
Symphony
TTK Prestige
V-Guard
Wonderla
1 Day (%)
-1.7
-0.6
-0.6
-1.3
-0.7
-2.1
1.1
-0.9
0.5
-0.2
-0.3
-0.8
-1.3
-1.4
0.2
-0.2
0.4
-0.6
0.0
1.4
-4.8
-1.8
0.3
-0.2
-1.7
0.2
0.2
-1.5
0.7
-0.7
-0.9
3.0
-1.0
-0.1
1.8
0.3
0.9
-0.2
0.2
-2.3
-1.0
0.3
-2.2
-0.9
-0.3
-0.4
0.8
-0.6
-1.8
-0.7
0.9
0.3
-0.5
1M (%)
9.4
1.3
1.4
0.1
0.6
2.9
1.9
-1.1
-0.9
-0.1
2.2
-0.2
-1.4
0.4
0.9
-5.7
4.6
-2.7
-3.7
5.9
-14.2
-0.5
-8.4
-4.3
-3.0
-6.1
-5.8
4.6
7.8
-3.3
6.3
-0.1
-3.8
-3.0
10.6
14.6
0.0
1.8
-0.4
17.1
17.1
-1.3
3.1
0.5
0.5
0.8
-2.0
0.1
-1.2
12.1
12.1
13.2
3.2
12M (%)
-11.3
-7.3
35.6
8.9
4.2
-18.5
-13.6
-6.6
-29.0
29.1
-15.1
-15.7
-23.0
1.7
-2.3
-10.7
4.5
-1.1
-18.7
-8.8
104.0
-1.3
76.7
-13.4
26.9
40.5
44.7
8.1
10.8
46.6
86.0
67.4
0.8
10.2
2.2
8.7
27.4
69.2
-7.5
34.3
3.9
52.7
33.2
54.8
52.9
92.6
31.1
24.3
16.0
30.7
185.1
8.4
22 March 2017
25

NOTES
22 March 2017
26

THEMATIC/STRATEGY RESEARCH GALLERY

REPORT GALLERY
RECENT INITIATING COVERAGE REPORTS

DIFFERENTIATED PRODUCT GALLERY

Disclosures
This document has been prepared by Motilal Oswal Securities Limited (hereinafter referred to as Most) to provide information about the company (ies) and/sector(s), if any, covered in the report and may be distributed by it and/or its
affiliated company(ies). This report is for personal information of the selected recipient/s and does not construe to be any investment, legal or taxation advice to you. This research report does not constitute an offer, invitation or
inducement to invest in securities or other investments and Motilal Oswal Securities Limited (hereinafter referred as MOSt) is not soliciting any action based upon it. This report is not for public distribution and has been furnished to
you solely for your general information and should not be reproduced or redistributed to any other person in any form. This report does not constitute a personal recommendation or take into account the particular investment
objectives, financial situations, or needs of individual clients. Before acting on any advice or recommendation in this material, investors should consider whether it is suitable for their particular circumstances and, if necessary, seek
professional advice. The price and value of the investments referred to in this material and the income from them may go down as well as up, and investors may realize losses on any investments. Past performance is not a guide for
future performance, future returns are not guaranteed and a loss of original capital may occur.
MOSt and its affiliates are a full-service, integrated investment banking, investment management, brokerage and financing group. We and our affiliates have investment banking and other business relationships with a some
companies covered by our Research Department. Our research professionals may provide input into our investment banking and other business selection processes. Investors should assume that MOSt and/or its affiliates are
seeking or will seek investment banking or other business from the company or companies that are the subject of this material and that the research professionals who were involved in preparing this material may educate investors
on investments in such business . The research professionals responsible for the preparation of this document may interact with trading desk personnel, sales personnel and other parties for the purpose of gathering, applying and
interpreting information. Our research professionals are paid on twin parameters of performance & profitability of MOSt.
MOSt generally prohibits its analysts, persons reporting to analysts, and members of their households from maintaining a financial interest in the securities or derivatives of any companies that the analysts cover. Additionally, MOSt
generally prohibits its analysts and persons reporting to analysts from serving as an officer, director, or advisory board member of any companies that the analysts cover. Our salespeople, traders, and other professionals or affiliates
may provide oral or written market commentary or trading strategies to our clients that reflect opinions that are contrary to the opinions expressed herein, and our proprietary trading and investing businesses may make investment
decisions that are inconsistent with the recommendations expressed herein. In reviewing these materials, you should be aware that any or all of the foregoingamong other things, may give rise to real or potential conflicts of interest.
MOSt and its affiliated company(ies), their directors and employees and their relatives may; (a) from time to time, have a long or short position in, act as principal in, and buy or sell the securities or derivatives thereof of companies
mentioned herein. (b) be engaged in any other transaction involving such securities and earn brokerage or other compensation or act as a market maker in the financial instruments of the company(ies) discussed herein or act as an
advisor or lender/borrower to such company(ies) or may have any other potential conflict of interests with respect to any recommendation and other related information and opinions.; however the same shall have no bearing
whatsoever on the specific recommendations made by the analyst(s), as the recommendations made by the analyst(s) are completely independent of the views of the affiliates of MOSt even though there might exist an inherent
conflict of interest in some of the stocks mentioned in the research report Reports based on technical and derivative analysis center on studying charts company's price movement, outstanding positions and trading volume, as
opposed to focusing on a company's fundamentals and, as such, may not match with a report on a company's fundamental analysis. In addition MOST has different business segments / Divisions with independent research
separated by Chinese walls catering to different set of customers having various objectives, risk profiles, investment horizon, etc, and therefore may at times have different contrary views on stocks sectors and markets.
Unauthorized disclosure, use, dissemination or copying (either whole or partial) of this information, is prohibited. The person accessing this information specifically agrees to exempt MOSt or any of its affiliates or employees from,
any and all responsibility/liability arising from such misuse and agrees not to hold MOSt or any of its affiliates or employees responsible for any such misuse and further agrees to hold MOSt or any of its affiliates or employees free
and harmless from all losses, costs, damages, expenses that may be suffered by the person accessing this information due to any errors and delays. The information contained herein is based on publicly available data or other
sources believed to be reliable. Any statements contained in this report attributed to a third party represent MOSt’s interpretation of the data, information and/or opinions provided by that third party either publicly or through a
subscription service, and such use and interpretation have not been reviewed by the third party. This Report is not intended to be a complete statement or summary of the securities, markets or developments referred to in the
document. While we would endeavor to update the information herein on reasonable basis, MOSt and/or its affiliates are under no obligation to update the information. Also there may be regulatory, compliance, or other reasons that
may prevent MOSt and/or its affiliates from doing so. MOSt or any of its affiliates or employees shall not be in any way responsible and liable for any loss or damage that may arise to any person from any inadvertent error in the
information contained in this report. MOSt or any of its affiliates or employees do not provide, at any time, any express or implied warranty of any kind, regarding any matter pertaining to this report, including without limitation the
implied warranties of merchantability, fitness for a particular purpose, and non-infringement. The recipients of this report should rely on their own investigations.
This report is intended for distribution to institutional investors. Recipients who are not institutional investors should seek advice of their independent financial advisor prior to taking any investment decision based on this report or for
any necessary explanation of its contents.
Most and it’s associates may have managed or co-managed public offering of securities, may have received compensation for investment banking or merchant banking or brokerage services, may have received any compensation
for products or services other than investment banking or merchant banking or brokerage services from the subject company in the past 12 months.
Most and it’s associates have not received any compensation or other benefits from the subject company or third party in connection with the research report.
Subject Company may have been a client of Most or its associates during twelve months preceding the date of distribution of the research report
MOSt and/or its affiliates and/or employees may have interests/positions, financial or otherwise of over 1 % at the end of the month immediately preceding the date of publication of the research in the securities mentioned in this
report. To enhance transparency, MOSt has incorporated a Disclosure of Interest Statement in this document. This should, however, not be treated as endorsement of the views expressed in the report.
Motilal Oswal Securities Limited is registered as a Research Analyst under SEBI (Research Analyst) Regulations, 2014. SEBI Reg. No. INH000000412
Pending Regulatory inspections against Motilal Oswal Securities Limited:
SEBI pursuant to a complaint from client Shri C.R. Mohanraj alleging unauthorized trading, issued a letter dated 29th April 2014 to MOSL notifying appointment of an Adjudicating Officer as per SEBI regulations to hold inquiry and
adjudge violation of SEBI Regulations; MOSL replied to the Show Cause Notice whereby SEBI granted us an opportunity of Inspection of Documents. Since all the documents requested by us were not covered we have requested to
SEBI vide our letter dated June 23, 2015 to provide pending list of documents for inspection.
List of associate companies of Motilal Oswal Securities Limited -Click
here to access detailed report
Analyst Certification
The views expressed in this research report accurately reflect the personal views of the analyst(s) about the subject securities or issues, and no part of the compensation of the research analyst(s) was, is, or will be directly or
indirectly related to the specific recommendations and views expressed by research analyst(s) in this report. The research analysts, strategists, or research associates principally responsible for preparation of MOSt research receive
compensation based upon various factors, including quality of research, investor client feedback, stock picking, competitive factors and firm revenues
Disclosure of Interest Statement
Analyst ownership of the stock
Served as an officer, director or employee
Companies where there is interest
No
No
A graph of daily closing prices of securities is available at www.nseindia.com and http://economictimes.indiatimes.com/markets/stocks/stock-quotes
Regional Disclosures (outside India)
This report is not directed or intended for distribution to or use by any person or entity resident in a state, country or any jurisdiction, where such distribution, publication, availability or use would be contrary to law, regulation or which
would subject MOSt& its group companies to registration or licensing requirements within such jurisdictions.
For Hong Kong:
This report is distributed in Hong Kong by Motilal Oswal capital Markets (Hong Kong) Private Limited, a licensed corporation (CE AYY-301) licensed and regulated by the Hong Kong Securities and Futures
Commission (SFC) pursuant to the Securities and Futures Ordinance (Chapter 571 of the Laws of Hong Kong) “SFO”. As per SEBI (Research Analyst Regulations) 2014 Motilal Oswal Securities (SEBI Reg No. INH000000412) has
an agreement with Motilal Oswal capital Markets (Hong Kong) Private Limited for distribution of research report in Kong Kong. This report is intended for distribution only to “Professional Investors” as defined in Part I of Schedule 1 to
SFO. Any investment or investment activity to which this document relates is only available to professional investor and will be engaged only with professional investors.” Nothing here is an offer or solicitation of these securities,
products and services in any jurisdiction where their offer or sale is not qualified or exempt from registration. The Indian Analyst(s) who compile this report is/are not located in Hong Kong & are not conducting Research Analysis in
Hong Kong.
Motilal Oswal Securities Limited (MOSL) is not a registered broker - dealer under the U.S. Securities Exchange Act of 1934, as amended (the"1934 act") and under applicable state laws in the United States. In addition MOSL is not a
registered investment adviser under the U.S. Investment Advisers Act of 1940, as amended (the "Advisers Act" and together with the 1934 Act, the "Acts), and under applicable state laws in the United States. Accordingly, in the
absence of specific exemption under the Acts, any brokerage and investment services provided by MOSL, including the products and services described herein are not available to or intended for U.S. persons.
This report is intended for distribution only to "Major Institutional Investors" as defined by Rule 15a-6(b)(4) of the Exchange Act and interpretations thereof by SEC (henceforth referred to as "major institutional investors"). This
document must not be acted on or relied on by persons who are not major institutional investors. Any investment or investment activity to which this document relates is only available to major institutional investors and will be
engaged in only with major institutional investors. In reliance on the exemption from registration provided by Rule 15a-6 of the U.S. Securities Exchange Act of 1934, as amended (the "Exchange Act") and interpretations thereof by
the U.S. Securities and Exchange Commission ("SEC") in order to conduct business with Institutional Investors based in the U.S., MOSL has entered into a chaperoning agreement with a U.S. registered broker-dealer, Motilal Oswal
Securities International Private Limited. ("MOSIPL"). Any business interaction pursuant to this report will have to be executed within the provisions of this chaperoning agreement.
The Research Analysts contributing to the report may not be registered /qualified as research analyst with FINRA. Such research analyst may not be associated persons of the U.S. registered broker-dealer, MOSIPL, and therefore,
may not be subject to NASD rule 2711 and NYSE Rule 472 restrictions on communication with a subject company, public appearances and trading securities held by a research analyst account.
For Singapore
Motilal Oswal Capital Markets Singapore Pte Limited is acting as an exempt financial advisor under section 23(1)(f) of the Financial Advisers Act(FAA) read with regulation 17(1)(d) of the Financial Advisors Regulations and is a
subsidiary of Motilal Oswal Securities Limited in India. This research is distributed in Singapore by Motilal Oswal Capital Markets Singapore Pte Limited and it is only directed in Singapore to accredited investors, as defined in the
Financial Advisers Regulations and the Securities and Futures Act (Chapter 289), as amended from time to time.
In respect of any matter arising from or in connection with the research you could contact the following representatives of Motilal Oswal Capital Markets Singapore Pte Limited:
Varun Kumar
Varun.kumar@motilaloswal.com
Contact : (+65) 68189232
Office Address:21 (Suite 31),16 CollyerQuay,Singapore 04931
For U.S
13 December 2016
Motilal Oswal Tower, Level 9, Sayani Road, Prabhadevi, Mumbai 400 025
Phone: +91 22 3982 5500 E-mail: reports@motilaloswal.com
Motilal Oswal Securities Ltd
20