MOSt Quantitative Outlook
Monthly
April 2017
INDEX
S&P CNX Nifty
Sensex
:
:
9,173.75
29,620.50
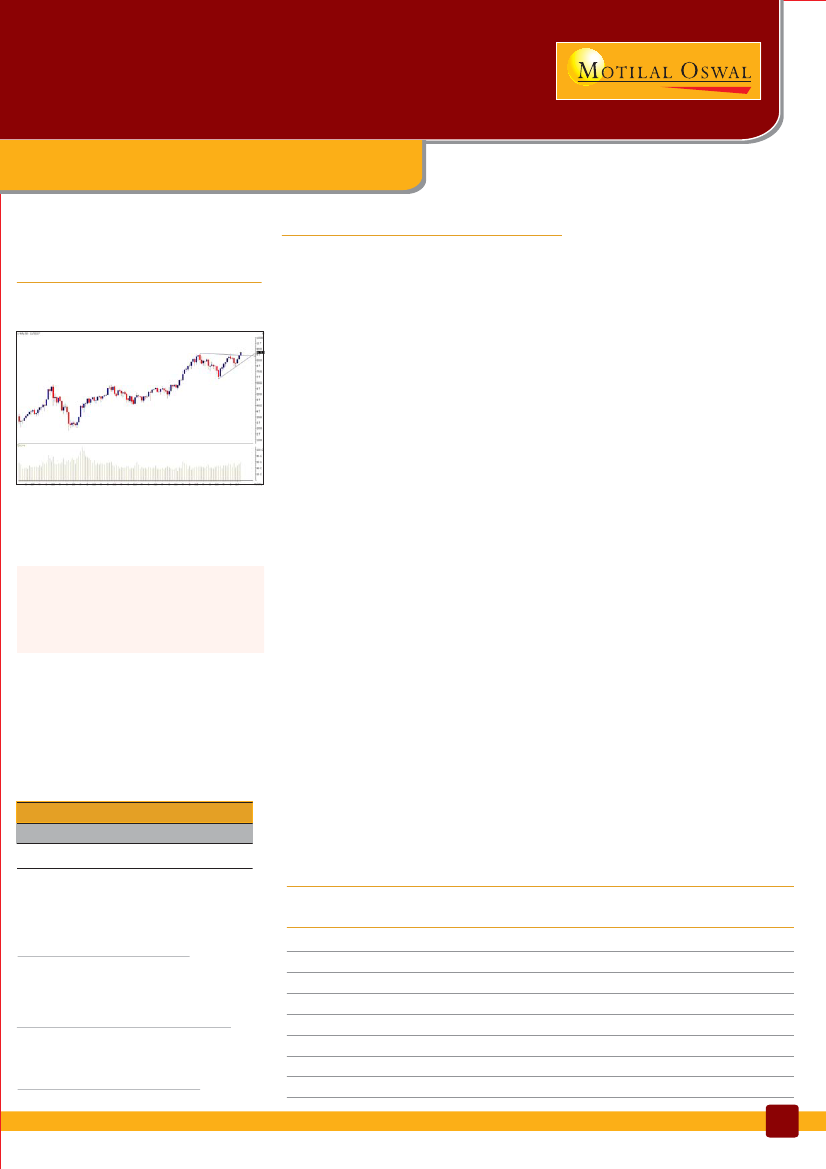
Nifty on the prowl.!!
Nifty continued its positive move for third consecutive month and registered a
fresh life time high of 9218 with monthly surge of 3.31%. It made multiple bot-
toms near to 8860 & 9020 and overall trend is positive as supports are shifting
higher and it has been making higher top - higher bottom formation. Significant
flow from Institutional participants has supported the market to cheer the bull-
ish sentiment.
On the weekly scale it has been consolidating in between 9020 to 9200 zone from
last three weeks. Overall trend of the index is positive so every decline is being
bought in the market. Occurrence of bullish candle with highest weekly close
suggests the continuation of the current trend. It partially filled and holding its
positive gap of 8978-9060 zone which is likely to act as a medium term support.
On the Daily scale index has been making higher high - higher lows from last four
consecutive sessions and respecting to its rising support trend line by connect-
ing the lows of 8712, 8903 and 9024. Till the time it holds above this trend line we
are expecting market to stay in bulls grip. Thus, trading longs can be added on a
decline near to 9119-9075 zones for next leg of rally towards 9280 and 9350 zone.
Bank Nifty has been making higher lows from last seven trading sessions and if
immediate lows of 21330 is broken then it may see a profit booking towards
21000 zone where one can again accumulate long position for the next up move
towards 21700 then 22000 zones.
Nifty witnessed below average rollover of 60% V/s 3 MA of 71%. Index gained
2.6% sequentially E-o-E. Banknifty witnessed above average roll-over of 65% viz-
a-viz 3 MA of 61%. Market-wide roll-over were in line at 79%. Overall major
sectors witnessed strong roll-over along with long built-up mainly Engineering,
Pvt Bank, PSU bank, Auto Ancillary and Power. Option activity for April series
depicts highest Put congestion at 9000 indicating strong support in place. How-
ever highest Call congestion is placed at 9200 followed by 9500 providing short
term resistance to the market. PCR OI too is quoting at 1.20 near its higher bound
indicating likely pause. Index could gyrate in the band of 9000-9300 before fresh
momentum picks up. Foreign institution net long/short ratio stands at 0.93 viz-a-
viz 1.14 last expiry depicting their neutral view. As we are expecting consolida-
tion in Nifty, Short Strangle Strategy of 8950PE and 9350CE is recommended.
NIFTY MONTHLY
Support
Resistance
:
:
9020 / 8860
9280 / 9380
Strategy
Data indicates a shift in trading range to
9000-9400 going ahead. Additional longs
recommended on declines so far as 9020
holds.
Option Writer
Scrip Name
Nifty 27-APR 2017 CE 9400
Nifty 27-APR 2017 PE 8900
Confidence 90%
% Higher/ Lower
2.19%
-3.24%
Sector Outlook
SECTOR
NAME
Metals
Energy
Auto
Bank
Media
FMCG
Infra
Pharma
CMP
3096.55
11648.7
9880.2
21444.15
3174.25
23542.3
3096.65
10411.15
MOM
(%)
0.98%
2.54%
2.34%
4.06%
5.94%
5.39%
3.30%
-1.64%
OUTLOOK
FOR THE MONTH
Positive
Positive
Positive
Positive
Positive
Positive
Positive
Neutral
POTENTIAL
MOVERS & SHAKERS
Hindalco, Vedl
Petronet, RIL
Amara Raja, Maruti
SBIN, Kotak Bank
ZEEL, Suntv
Hindunilvr , Pidilitind
LT, BHEL
Biocon, Lupin
1
Dharmesh Kant
Head - Retail Research
Chandan Taparia
Derivatives & Technical Analyst
Tina Gadodia
Equity Derivatives Analyst

MOSt Quantitative Outlook - Monthly
April 2017
NIFTY
USDINR
NIFTY DAILY
The pair has been falling down from last four months
as it broken the multiple support of 66 and triggered
the fresh declines. It has been making lower highs from
last eleven consecutive weeks and trading near to sev-
enteen months lower levels. However it has gone in
to oversold territory but overall appreciating rupee is
supporting the Equity market. At times our index has a
high inverse correlation with the pair and apprecia-
tion in INR would keep the positive momentum for the
market. Traders are suggesting to keep an alert on pair
as a short term reversal in currency might give a pause
in momentum of the equity market.
NIFTY WEEKLY
On the daily scale index has been making higher high
- higher lows from last four consecutive sessions and
respecting to its rising support trend line by connect-
ing the lows of 8712, 8903 and 9024. Till the time it
holds above this trend line we are expecting market
to stay in bulls grip. It made multiple bottoms near to
8860 & 9020 and has been respecting to its 13 DEMA
from last three months. Thus, trading longs can be
added on a decline near to 9119-9075 zones for next
leg of rally towards 9280 and 9350 zone.
On the weekly scale it has been consolidating in between 9020 to 9200 zone from last three weeks. Overall trend of the
index is positive so every decline is being bought in the market. Occurrence of bullish candle with highest weekly close
suggests the continuation of the current trend. It partially filled and holding its positive gap of 8978-9060 zone which is
likely to act as a medium term support as per Gap theory.
2
2

MOSt Quantitative Outlook - Monthly
April 2017
...NIFTY
NIFTY OI V/S PRICE
PCR OI V/S NIFTY
Nifty continued its positive bias in March series and
scaled higher above 9000 towards 9200. Index gained
2.62% sequentially E-o-E. Volatility too was in favour
of bulls as India VIX traded below 13%. Option activity
for April series depicts highest Put congestion at 9000
indicating strong support in place. However highest
Call congestion is placed at 9200 followed by 9500
providing short term resistance to the market. PCR OI
too is quoting at higher bound indicating likely pause.
Index could gyrate in the band of 9000-9300 before
fresh momentum picks up. Foreign institution net long/
short ratio stands at 0.93 viz-a-viz 1.14 last expiry de-
picting their neutral view.
INDEX FUTURE OI
PCROI of Nifty trades near 1.20 near its upper band of
0.8-1.20 indicating likely resistance. The ratio has di-
rect relationship with Index movement. In scenario if
PCR OI falls below 1.05 Index could see sideways ac-
tivity emerging.
STOCK FUTURE OI
Index future open interest continued to witness accu-
mulation m-o-m. It stood at highest level on last day
of expiry. Below average roll in Nifty at 60% indicates
likely consolidation in coming session.
Stock future OI remained robust m-o-m. Market-wide
roll-over from Mar to Apr series was in line 79%. mainly
Engineering, Pvt Bank, PSU bank, Auto Ancillary and
Power. Stock specific activity along with sector rota-
tion could continue to be observed in coming expiry.
2
3

MOSt Quantitative Outlook - Monthly
April 2017
SECTOR ROTATION OI
Nifty witnessed below average rollover of 60% V/s 3 MA of 71%. However it witnessed incremental built-up of open
interest to 38 mn shares in April series. Index gained 2.6% sequentially E-o-E. Banknifty witnessed above average roll-
over of 65% viz-a-viz 3 MA of 61%. Market-wide roll-over were in line at 79%. Overall major sectors witnessed strong
roll-over along with long built-up mainly Engineering, Pvt Bank, PSU bank, Auto Ancillary and Power.
Auto:
Auto sector witnessed relatively lower rollover of ~75%. Incremental accumulation was witnessed in four wheeler
stocks like Maruti, M&M, Tatamtrdvr Short built up was mainly witnessed in Ashokley. Auto-Ancilliary stocks like Exide,
Amarajabat too witnessed long built with price gain indicating positive bias
Oil & Gas:
In line Rollover at 79%. Long in Reliance and Cairn. Short built-up was noticed in OMC stocks
Metal:
Inline rollover at 80%. Long built-up in VEDL & Sail and Short built up in NMDC. Accumulation in Tatasteeel
Pvt Banks:
In line roll at 79%. Significant Long built-up in Indusindbk, Ktkbank and Dcbbank. Short built-up in Axisbank and
IDFC bank
PSU Banks:
In line roll at 78%. Significant long built-up in PNB, Canbk, Banbaroda and BankIndia. Short covering in SBIN and
Unionbank
Pharma:
In line roll at 81. Longs in Biocon, Ajantpharm, and Sunpharma. Shorts in Drreddy, Lupin and Divislab
NBFC:
Strong roll of 82%. Significant Longs in HDFC, Ibulhsfin, IDFC, Relcapital and M&Mfin. Shorts in Bharatfin. Short
covering in Srtransfin and Bajfinance
Power:
Strong roll of 83%. Significant longs in PFC, RPOWER, Tatapower, and Jswenergy
Engineering:
In line rollover of 80%. Longs in Voltas, Bhel, LT and Siemens. Short covering in Havells
IT:
In line rollover of 79%. Significant accumulation in INFY. Short in Mindtree and Techm. Longs in Hcltech and Wipro
FMCG:
In line rollover of 81%. Significant longs in Jublfood, ITC, Hindunilvr & Tataglobal. Accumulation in Pidilitind.
4

MOSt Quantitative Outlook - Monthly
April 2017
STOCKS
AMARA RAJA
3
BUY
CMP : 890
Target : 950
Stop Loss : 860
Bottomed out with the multiple supports of 820-
830 zone
Reversing its negative trend of last five months
Mechanical indicators have turned from over sold
territory with positive divergence
Positional longs could be added for the potential
target of 950.
3
3
3
LT
3
3
3
BUY
BUY
Bullish Flag pattern on daily chart
Consolidation breakout after 13 trading sessions
Higher top - higher bottom formation on weekly
chart
Positional longs could be added for the potential
target of 1650
CMP : 1575
Target : 1650
Stop Loss : 1545
3
BHARAT FORG
3
3
3
3
BUY
BUY
CMP : 1042
Target : 1111
Stop Loss : 1015
Taken multiple support near to 1000
Surpassed its falling supply trend line
Respecting to its 50 DEMA
Positional longs could be added on a decline for
the potential target of 1111
5

MOSt Quantitative Outlook - Monthly
April 2017
OPTION STRATEGIES
Nifty
3
Bear Put Spread
BUY
Short Strangle Strategy
BUY
3
3
Nifty is in long-long unwinding cycle. Nifty wit-
nessed below average roll of 60% indicating likely
consolidation
Put built-up at 9000 could act as a strong support
while call writing at 9200 & 9300 could provide
immediate resistance.
Index is expected to gyrate in the indicative op-
tion band. Thus Short Strangle Strategy is recom-
mended.
: INR 6650 between 8950-9350
: INR 6650
: Sell future below 8900 or Buy
future above 9400
Sell 9350 CE 1 lot; Sell 8950 PE 1 lot
Target
Initial Inflow
Hedge
ZEEL
3
3
3
Bull Call Spread
Call Ladder Spread
BUY
Buy 540 CE 1 lot; Sell 560 CE 1 lot ; Sell 580 CE 1 lot
3
Zeel is in long- long unwinding cycle
Stock has witnessed strong rollover of 83% along
with OI accumulation in future
Proximity of stock to highest call congestion at
540 raises expectation of a breakout propelling
momentum towards 560-570
Thus Call Ladder Spread is recommended
: INR 20000 between 560-580
: INR 3500
: Buy future above 595
Target
Stop loss
Hedge
6
7

MOSt Quantitative Outlook - Monthly
April 2017
Economic Events Calendar, April 2017
7

Disclaimer: This document has been prepared by Motilal Oswal Securities Limited (hereinafter referred to as Most) to provide information about the company(ies)
and/sector(s), if any, covered in the report and may be distributed by it and/or its affiliated company(ies). This report is for personal information of the selected
recipient/s and does not construe to be any investment, legal or taxation advice to you. This research report does not constitute an offer, invitation or inducement
to invest in securities or other investments and Motilal Oswal Securities Limited (hereinafter referred as MOSt) is not soliciting any action based upon it. This report
is not for public distribution and has been furnished to you solely for your general information and should not be reproduced or redistributed to any other person
in any form. This report does not constitute a personal recommendation or take into account the particular investment objectives, financial situations, or needs
of individual clients. Before acting on any advice or recommendation in this material, investors should consider whether it is suitable for their particular
circumstances and, if necessary, seek professional advice. The price and value of the investments referred to in this material and the income from them may go
down as well as up, and investors may realize losses on any investments. Past performance is not a guide for future performance, future returns are not
guaranteed and a loss of original capital may occur.
MOSt and its affiliates are a full-service, integrated investment banking, investment management, brokerage and financing group. We and our affiliates have
investment banking and other business relationships with a some companies covered by our Research Department. Our research professionals may provide input
into our investment banking and other business selection processes. Investors should assume that MOSt and/or its affiliates are seeking or will seek investment
banking or other business from the company or companies that are the subject of this material and that the research professionals who were involved in preparing
this material may educate investors on investments in such business . The research professionals responsible for the preparation of this document may interact
with trading desk personnel, sales personnel and other parties for the purpose of gathering, applying and interpreting information. Our research professionals
are paid on twin parameters of performance & profitability of MOSt.
MOSt generally prohibits its analysts, persons reporting to analysts, and members of their households from maintaining a financial interest in the securities or
derivatives of any companies that the analysts cover. Additionally, MOSt generally prohibits its analysts and persons reporting to analysts from serving as an officer,
director, or advisory board member of any companies that the analysts cover. Our salespeople, traders, and other professionals or affiliates may provide oral or
written market commentary or trading strategies to our clients that reflect opinions that are contrary to the opinions expressed herein, and our proprietary
trading and investing businesses may make investment decisions that are inconsistent with the recommendations expressed herein. In reviewing these materials,
you should be aware that any or all of the foregoing among other things, may give rise to real or potential conflicts of interest. MOSt and its affiliated
company(ies), their directors and employees and their relatives may; (a) from time to time, have a long or short position in, act as principal in, and buy or sell the
securities or derivatives thereof of companies mentioned herein. (b) be engaged in any other transaction involving such securities and earn brokerage or other
compensation or act as a market maker in the financial instruments of the company(ies) discussed herein or act as an advisor or lender/borrower to such
company(ies) or may have any other potential conflict of interests with respect to any recommendation and other related information and opinions.; however
the same shall have no bearing whatsoever on the specific recommendations made by the analyst(s), as the recommendations made by the analyst(s) are
completely independent of the views of the affiliates of MOSt even though there might exist an inherent conflict of interest in some of the stocks mentioned
in the research report
Reports based on technical and derivative analysis center on studying charts company's price movement, outstanding positions and trading volume, as opposed
to focusing on a company's fundamentals and, as such, may not match with a report on a company's fundamental analysis. In addition MOST has different
business segments / Divisions with independent research separated by Chinese walls catering to different set of customers having various objectives, risk profiles,
investment horizon, etc, and therefore may at times have different contrary views on stocks sectors and markets.
Unauthorized disclosure, use, dissemination or copying (either whole or partial) of this information, is prohibited. The person accessing this information specifically
agrees to exempt MOSt or any of its affiliates or employees from, any and all responsibility/liability arising from such misuse and agrees not to hold MOSt or any
of its affiliates or employees responsible for any such misuse and further agrees to hold MOSt or any of its affiliates or employees free and harmless from all losses,
costs, damages, expenses that may be suffered by the person accessing this information due to any errors and delays. The information contained herein is based
on publicly available data or other sources believed to be reliable. Any statements contained in this report attributed to a third party represent MOSt's
interpretation of the data, information and/or opinions provided by that third party either publicly or through a subscription service, and such use and
interpretation have not been reviewed by the third party. This Report is not intended to be a complete statement or summary of the securities, markets or
developments referred to in the document. While we would endeavor to update the information herein on reasonable basis, MOSt and/or its affiliates are under
no obligation to update the information. Also there may be regulatory, compliance, or other reasons that may prevent MOSt and/or its affiliates from doing so.
MOSt or any of its affiliates or employees shall not be in any way responsible and liable for any loss or damage that may arise to any person from any inadvertent
error in the information contained in this report. MOSt or any of its affiliates or employees do not provide, at any time, any express or implied warranty of any
kind, regarding any matter pertaining to this report, including without limitation the implied warranties of merchantability, fitness for a particular purpose, and
non-infringement. The recipients of this report should rely on their own investigations.
This report is intended for distribution to institutional investors. Recipients who are not institutional investors should seek advice of their independent financial
advisor prior to taking any investment decision based on this report or for any necessary explanation of its contents.
Most and it's associates may have managed or co-managed public offering of securities, may have received compensation for investment banking or merchant
banking or brokerage services, may have received any compensation for products or services other than investment banking or merchant banking or brokerage
services from the subject company in the past 12 months.
Most and it's associates have not received any compensation or other benefits from the subject company or third party in connection with the research report.
Subject Company may have been a client of Most or its associates during twelve months preceding the date of distribution of the research report
MOSt and/or its affiliates and/or employees may have interests/positions, financial or otherwise of over 1 % at the end of the month immediately preceding the
date of publication of the research in the securities mentioned in this report. To enhance transparency, MOSt has incorporated a Disclosure of Interest Statement
in this document. This should, however, not be treated as endorsement of the views expressed in the report.
Motilal Oswal Securities Limited is under the process of seeking registration under SEBI (Research Analyst) Regulations, 2014.
There are no material disciplinary action that been taken by any regulatory authority impacting equity research analysis activities
Motilal Oswal Securities Limited is registered as a Research Analyst under SEBI (Research Analyst) Regulations, 2014. SEBI Reg. No. INH000000412
A graph of daily closing g prices of securities is available at www.nseindia.com and http://economictimes.indiatimes.com/markets/stocks/stock-quotes.
Analyst Certification
The views expressed in this research report accurately reflect the personal views of the analyst(s) about the subject securities or issues, and no part of the
compensation of the research analyst(s) was, is, or will be directly or indirectly related to the specific recommendations and views expressed by research analyst(s)
in this report. The research analysts, strategists, or research associates principally responsible for preparation of MOSt research receive compensation based upon
various factors, including quality of research, investor client feedback, stock picking, competitive factors and firm revenues
Disclosure of Interest Statement
1.Analyst ownership of the stocks mentioned above
2.Served as an officer, director or employee
No
No
Regional Disclosures (outside India)
This report is not directed or intended for distribution to or use by any person or entity resident in a state, country or any jurisdiction, where such distribution,
publication, availability or use would be contrary to law, regulation or which would subject MOSt & its group companies to registration or licensing requirements
within such jurisdictions.
Motilal Oswal Securities Ltd
Motilal Oswal Tower, Level 6, Sayani Road, Prabhadevi, Mumbai 400 025
Phone: (91-22) 30894200 Fax: (91-22) 22885038. E-mail: info@motilaloswal.com
8