BSE SENSEX
29,927
S&P CNX
9,262
Info Edge India
CMP: INR837
TP: INR1,000 (+19%)
Significant improvement in Zomato’s performance in FY17
80% revenue growth; 81% reduction in cash burn
7 April 2017
Update
| Sector:
Technology
Buy
Stock Info
Bloomberg
Equity Shares (m)
52-Week Range (INR)
1, 6, 12 Rel. Per (%)
M.Cap. (INR b)
M.Cap. (USD b)
Avg Val, INRm
Free float (%)
1,012/710
-2/-17/-12
97.3
1.5
67.0
79.0
Zomato detailed some key financials for FY17 on its blog, indicating continued
INFOE IN
traction in the business and also detailing certain unit economics in food delivery.
121.7
Key highlights:
Food ordering drives growth
Zomato reported revenue growth of 80% YoY to USD49m in FY17, contributed by
ad sales (USD38m; 78% of total) and the newly launched food ordering service
(USD9m; +8x YoY). 44% of incremental revenue was driven by food ordering. Exit
revenue in March 2017 was USD5m, implying annualized revenue rate of USD60m.
Financials Snapshot (INR b)
2017E 2018E 2019E
Y/E Mar
7.9
8.9
10.1
Sales
2.2
2.4
2.8
EBITDA
2.2
2.2
2.6
PAT
16.9
17.9
21.0
EPS (INR)
30.1
6.2
17.1
EPS Gr. (%)
159.4 169.6 182.3
BV/Sh. (INR)
11.1
10.9
11.9
RoE (%)
11.1
10.9
11.9
RoCE (%)
38.6
42.8
39.4
Payout (%)
Valuation
47.4
44.6
38.1
P/E (x)
36.7
32.7
27.2
EV/EBITDA (x)
10.1
8.9
7.7
EV/Sales (x)
Shareholding pattern (%)
Dec-16 Sep-16 Dec-15
As On
Promoter
42.6
42.9
43.2
DII
13.1
12.1
10.4
FII
33.3
33.9
35.1
Others
11.0
11.1
11.3
FII Includes depository receipts
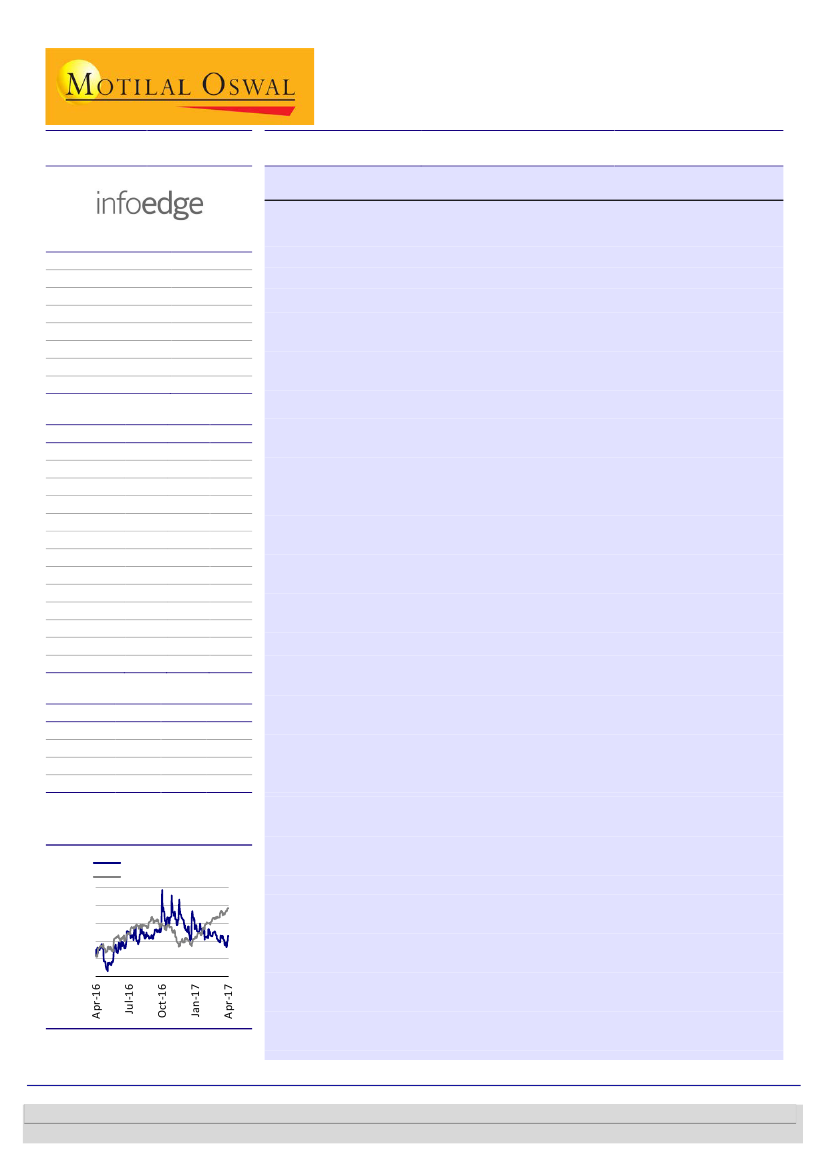
Stock Performance (1-year)
Info Edg.(India)
Sensex - Rebased
Unit economics explained
Monthly order volumes in March stood at 2.1m (up four-fold YoY), 80% of
which were fulfilled by restaurants and 20% by Zomato.
Zomato has refrained from discounting, and applies it to <2% of the orders.
27% of the orders are discounted by the restaurants themselves.
Despite not discounting, on average, Zomato makes INR21 per order fulfilled
by the restaurant and loses ~INR9 per order it processes by itself. This is
primarily because of higher delivery and processing costs incurred by Zomato
when directly fulfilling.
On average, INR50 per order is paid to delivery partners. It costs its partners
INR62 to fulfill an order received from Zomato. Were Zomato to deliver on its
own, the delivery costs would work out to INR105 per day (lower volume
versus delivery partners).
Model allows less marketing spend
Zomato’s classified business (has 8.5m monthly unique customers in India) makes it
seamless for customers to move and transact (food ordering/table booking). This is
unlike other e-commerce players which pay large amounts to first acquire
customers and then to re-engage them. There is massive room to continue growing
transactions without spending much, as so far <3% of Zomato’s unique visitors are
currently ordering as well.
Valuation and view
1,000
940
880
820
760
700
The sharp reduction in Zomato’s burn is a significant positive, and if revenue
growth momentum continues on this base, the concerns on USD1b valuation
will be abated, particularly considering multiple valuation write-downs and
business shutdowns over past 12 months in the sector.
With the standalone business’ real estate segment struggling amid underlying
market slowdown, the blip in recruitment growth last quarter for INFOE was a
new worry. This will be the first full quarter of demonetization, and thus, the
recruitment business may remain soft for a while.
Amid growth pressure on standalone operations, robust execution in Zomato
will help provide a base for the stock, and continued scale may make a case for
capital raise at higher valuation. We have a
Buy
rating on the stock with a
target price of ~INR1,000 (~20% upside).
Investors are advised to refer through important disclosures made at the last page of the Research Report.
Motilal Oswal research is available on www.motilaloswal.com/Institutional-Equities, Bloomberg, Thomson Reuters, Factset and S&P Capital.
Ashish Chopra
(Ashish.Chopra@MotilalOswal.com); +91 22 6129 1530
Sagar Lele
(Sagar.Lele@MotilalOswal.com); +91 22 6129 1531

Info Edge India
Revenue growth of 80% in FY17
Zomato continues to report strong revenue growth, led by the introduction of new
revenue streams and continued growth in ad revenue. Its March 2017 revenue
stood at USD5m, translating to an annualized revenue run-rate of USD60m, 22%
higher than FY17 revenue.
Zomato is clocking 120m monthly visits, up 69% over March 2016. Its monthly active
user count has increased 43% YoY to 53m.
Exhibit 1: Annualized revenue run-rate now at USD60m
Revenue (USDm)
49.0
28.4
15.8
0.4
FY12
2.1
FY13
5.1
FY14
FY15
FY16
FY17
Current
annualized
run-rate
60.0
Source: MOSL, Company
FY17 revenue grew 80% YoY to USD49m, led by:
Ad sales:
Revenue stood at USD38m in FY17. During the year, Zomato stopped
accepting advertising from low-rated restaurants, improving the quality of ads,
increasing visibility and providing smarter targeting.
Food ordering:
Revenue stood at USD9m in FY17, exhibiting growth of 8x YoY.
Effectively 44% of incremental growth in FY17 was driven by the food ordering
business.
Exhibit 2: Annualized revenue run-rate now at USD60m
Food ordering,
18%
Others,
4%
Ad sales, 78%
Source: MOSL, Company
Food ordering – the growth driver
Zomato launched online food ordering services in India and the UAE in FY16.
Volumes increased gradually, reaching 0.5m in March 2016. Momentum picked up
further in this offering, with 2m monthly orders and 8x jump in revenue.
Momentum here should continue, as Zomato expects volumes in April to be higher
by 8% compared to March 2017.
7 April 2017
2

Info Edge India
Zomato’s food ordering services are on offer in 13 cities in India and 3 cities in the
UAE. It intends to launch this service in Beirut in the coming year.
Exhibit 3: Improvement in the food ordering business
Revenue (USD m)
Monthly orders (m)
Average order rating
FY16
1.1
0.5
4.0
FY17
9.0
2.0
4.2
Source: MOSL, Company
Revisiting the unit economics in food ordering (in India)
In May 2016, Zomato processed a total of 750k orders, 80% of which were
fulfilled by restaurants themselves (Type-A orders, Zomato does not deliver
here) and 20% by Zomato through its last mile logistics partners (Type-B orders).
Zomato pays INR50 per order to its delivery partners on average. It costs its
partners INR62 to fulfill an order received from Zomato.
Were Zomato to deliver on its own, the delivery costs would work out to INR105
per day. It is lower for partners as they are able to keep delivery personnel busy
during lean periods for food orders (which they do by serving e-commerce and
grocery).
Processing cost includes the telco data fee incurred when automatically
transmitting a new order over to the restaurant. Then there is the support cost,
which is incurred when something goes wrong and the customer raises an issue
with the support team.
For Type-A orders, there is a two-way conversation to handle – between the
customer and the restaurant. For Type B orders, there is a three-way
conversation to work with – the customer, the restaurant, and the delivery
partner’s person who is on the road.
~35% of all orders are now paid online. The payment gateway fee is not borne
by the restaurant separately.
Exhibit 4: Improvement in the food ordering business
Average order value
Zomato's commission
Delivery fee
Revenue for Zomato
Delivery fee paid to partners
Processing / support cost
Net revenue per order for Zomato
Net revenue in March for 2m orders (INR m)
Type-A Orders
480
8.2%
0%
39.4
-
18.4
21.0
41.9
Type-B Orders
375
8.2%
10%
68.3
50
27.4
(9.1)
(18.3)
Source: MOSL, Company
7 April 2017
3

Info Edge India
Valuation and view
Direct and high-quality play on promising e-commerce opportunity
India’s e-commerce industry is expected to grow from its current size of
USD14b to USD70b by 2020. According to Google, the classifieds segment is
expected to grow at a CAGR of 22.5%, with jobs, real estate and matrimony
constituting two thirds of the market.
As GDP growth revives it India, it will directly benefit INFO’s recruitment
segment, which has had a 7-8pp historical multiplier effect for every 1pp
uptick in GDP growth. Naukri.com’s traffic share is almost 70%.
Initial signs of reducing industry burn vindicate prudent investment strategy
The scenario in venture capital funding appears to have changed over past few
months, with companies making a pivot toward monetization and profitability.
This would imply that the worst in terms of month-on-month burn is behind. We
believe this plays into INFOE’s strategy of staying put to protect its market
leadership in multiple franchises (like 99acres.com), and it can now look forward
to deriving the financial rewards from investments sooner rather than later.
Revival of GDP growth to help flagship recruitment segment:
Naukri.com
should directly and disproportionately benefit from a pick-up in GDP growth.
We expect revenue CAGR of 12% over FY16-19E for its flagship Naukri.com.
Some pressure has been mounting up in the business due to demonetization
and a slowdown in IT hiring. We expect 99acres.com to remain subdued over
the near term amid real estate industry woes, and expect revenue CAGR of 8%
over FY16-19 on a small base.
Disciplined management action drives confidence
Backing strong teams:
Despite buying significant stake in investee
companies, the approach has been to back teams and get involved as and
when guidance is sought.
Prioritizing:
INFOE has been quick to write off its books investments where
either scale visibility dwindled and/or the company’s focus changed
(INR356m to date).
Feeding the virtuous cycle:
Irrespective of business cycles, Nauki.com’s cost
base increases 15-20% every year to stay ahead in terms of product
innovation.
SOTP-based price target of INR1,000:
We adopt a sum-of-the-parts (SOTP)
methodology to value INFOE. We separately value the in-house businesses –
Naukri.com, 99acres.com, Jeevansathi.com, and also INFOE’s share in its
investee companies – Zomato.com, Meritnation.com, Policybazaar.com,
Mydala.com, and Canvera.com. While the recruitment business remains the
cash cow, 99acres.com, along with its holdings in Zomato.com, should drive
significant value for the company, going forward. Our SOTP target price of
INR1,000 implies a 20% upside. We see INFOE as a direct and preferred play on
the fast-expanding e-commerce opportunity. Maintain
Buy
.
7 April 2017
4

Info Edge India
Exhibit 5: SOTP valuation
Segment
Methodology
25x
recruitment
NOPLAT
99acres.com
6x forward
sales
Valuation
ascribed in the
latest round of
funding
Valuation
ascribed in the
latest round of
funding
3x forward
sales
Valuation
ascribed in the
latest round of
funding
3x forward
sales
Valuation
ascribed in the
latest round of
funding
Methodology description
Naukri
We value Naukri.com's post-tax operating profit at 25x.
Historically, INFOE traded at 30x+ when recruitment segment
dominated and all others were insignificantly small (INR20 per
share of investments). INFOE's valuation on overall company's
profits (including yield on cash) was 30x+
Lower end of sales multiple of peers such as rightmove.co.uk,
realestate.com.au, zillow.com, zoopla.co.uk.
All trade in a tight sales band of 6-17x.
Growth in 99acres.com is expected to be higher than peers once
the real estate segment picks up. But we ascribe median multiple
of 6x.
Zomato raised USD60m of funding at a valuation close of USD1b.
INFO did not participate in this round, bringing its stake down to
~47%
Meritnation raised USD4m in the latest round of funding on June
2015. This, as per our analysis, values the company at ~USD125m.
Since there were no new investors, we keep valuation pegged at
previous levels of USD100m.
Earlier, Mydala.com had been looking at raising USD80m, at pre-
money valuation of USD200m; there were expectations around
strong revenue and profitability prospects, and target of USD40m
revenues by FY17. However, INFOE is now contemplating writing
this off.
INFOE's deal with Temasek to sell half its stake in
Policybazaar.com values the company at USD210m.
JS is the 3rd biggest player in the online matrimony market.
We assume 15% CAGR in revenues and value the franchise at 3x
forward revenues.
Canvera raised INR100m from INFOE in latest round of funding
(2QFY16), which increased INFOE's stake from 36% to 38%,
effectively pegging the company's value at INR4,000m.
Valuation
(INR b)
Contribution
(INR per
share)
547
66.6
7.1
58
Zomato.com
30.1
247
Meritnation
3.9
32
Mydala.com
0.0
0
Policybazaar.com
1.4
12
Jeevansathi.com
1.7
14
Canvera
Cash On books
Total
1.2
11.3
10
93
1000
Source: MOSL
Exhibit 6: 1-year forward P/E band
PE (x)
Median(x)
Peak(x)
Min(x)
Avg(x)
73.1
42.1
33.4
Exhibit 7: 1-year forward P/B band
15.0
11.5
PB (x)
Median(x)
Peak(x)
Min(x)
Avg(x)
12.9
82
64
46
28
10
38.5
8.0
4.5
1.0
3.0
5.6
5.2
4.7
19.1
7 April 2017
5

Info Edge India
Story in charts
Exhibit 8: Recruitment segment dominated the standalone
business…
Real Estate,
15
Matrimonial,
7
Recruitment,
74
Recruitment
Source: Company, MOSL
Others, 4
Exhibit 9: …and is the only materially profit-making business
in the group
855
Standalone business EBITDA (INR m)
-5.8
Matrimonial
-100
Real Estate
-57
Others
Source: Company, MOSL
Exhibit 10: Recruitment business is closely linked to GDP
growth…
Recruitment revenue growth (%)
8.9
8.6
25.4
6.7
24.1
4.5
11.3
GDP Growth (%)
7.2
6.7
4.7
9.8
19.6
7.6
19.4
Exhibit 11: …but leadership position to sustain on network
effect
7.8
-7.7
Exhibit 12: Investee company details
Company
Zomato.com
Meritnation.com
Policybazaar.com
Mydala.com
Canvera.com
Happily Unmarried.com
Vacationlabs.com
Bigstylist.com
Bluedolph.in
Total
Written off / provisioned for
Studyplaces.com
99labels.com
Floost.com
Amt. Invested
(INR m)
4,838
968
325
270
901
163
60
64
74
7,663
45
285
26
Holding
%
46
59
10
42
49
44
26
25
35
FY16 summary (INR m)
Revenue
EBITDA
1849.7
-4409.6
287.1
-414.2
2,708.6
--1,647.8
4,845.4
13
47
31
-6,471.6
Source: MOSL, Company
7 April 2017
6

Info Edge India
Financials and Valuations
Income Statement
Y/E Mar
Net Sales
Change (%)
EBITDA
EBITDA Margin (%)
Depreciation
EBIT
Interest
Other Income
Extraordinary items
PBT
Tax
Tax Rate (%)
Min. Int. & Assoc. Share
Reported PAT
Adjusted PAT
Change (%)
2012
3,771
28.3
1,442
38.3
77
1,366
20
395
0
1,740
511
29.3
0
1,230
1,230
46.4
2013
4,372
16.0
1,498
34.3
94
1,404
25
465
-293
1,551
528
34.1
0
1,022
1,315
7.0
2014
5,059
15.7
1,668
33.0
174
1,494
51
432
0
1,876
591
31.5
0
1,285
1,285
-2.3
2015
6,116
20.9
1,822
29.8
173
1,649
30
764
292
2,675
736
27.5
0
1,939
1,647
28.2
2016
7,235
18.3
1,580
21.8
210
1,370
1
827
-160
2,037
621
30.5
0
1,416
1,575
-4.3
2017E
7,933
9.7
2,184
27.5
249
1,935
1
992
174
3,100
869
28.0
0
2,231
2,058
30.6
2018E
8,856
11.6
2,405
27.2
273
2,132
(INR Million)
2019E
10,056
13.5
2,831
28.2
293
2,538
0
945
0
3,077
892
29.0
0
2,185
2,185
6.2
0
1,064
0
3,602
1,044
29.0
0
2,557
2,557
17.1
Balance Sheet
Y/E Mar
Share Capital
Reserves
Net Worth
Debt
Deferred Tax
Total Capital Employed
Gross Fixed Assets
Less: Acc Depreciation
Net Fixed Assets
Capital WIP
Investments
Current Assets
Debtors
Cash & Bank
Loans & Adv, Others
Curr Liabs & Provns
Curr. Liabilities
Provisions
Net Current Assets
Total Assets
2012
546
5,198
5,744
3
0
5,747
908
376
531
94
3,666
3,183
36
2,985
162
1,728
1,496
231
1,456
5,747
2013
1,092
5,563
6,654
5
0
6,659
1,378
471
908
98
4,526
2,974
45
2,710
220
1,847
1,606
241
1,127
6,659
2014
1,092
6,530
7,622
4
0
7,626
1,501
645
857
95
6,306
2,558
50
2,311
196
2,189
1,865
324
368
7,626
2015
1,202
15,422
16,624
3
0
16,627
1,635
700
935
0
14,552
3,934
98
3,007
829
2,794
2,341
452
1,140
16,627
2016
1,209
16,431
17,640
60
0
17,700
1,901
881
1,020
0
7,762
11,795
118
9,522
2,155
2,877
2,448
429
8,918
17,700
2017E
1,211
18,211
19,422
48
0
19,469
2,067
1,130
937
0
10,176
11,547
69
8,399
3,079
3,191
2,844
347
8,356
19,469
2018E
1,211
19,459
20,670
48
0
20,718
2,407
1,403
1,004
0
10,176
(INR Million)
2019E
1,211
21,009
22,220
48
0
22,268
2,747
1,696
1,050
0
10,176
13,266
82
10,009
3,175
3,728
3,381
347
9,538
20,718
15,146
91
11,605
3,450
4,104
3,758
347
11,041
22,268
7 April 2017
7

Info Edge India
Financials and Valuations
Ratios
Y/E Mar
Basic (INR)
EPS
Cash EPS
Book Value
DPS
Payout (incl. Div. Tax.)
Valuation(x)
P/E
Cash P/E
Price / Book Value
EV/Sales
EV/EBITDA
Dividend Yield (%)
Profitability Ratios (%)
RoE
RoCE
RoIC
Turnover Ratios (%)
Fixed Asset Turnover (x)
Debtors (No. of Days)
Leverage Ratios (%)
Net Debt/Equity (x)
2012
11.3
12.0
52.6
1.0
10.4
2013
12.0
12.9
60.9
1.0
9.7
2014
11.8
13.4
69.8
2.5
23.4
2015
13.7
15.1
138.3
3.0
26.4
58.4
52.8
5.8
14.3
48.0
0.0
23.7
24.0
-125.7
6.0
3
21.2
21.5
-119.6
4.3
4
18.0
18.5
-116.2
5.3
4
13.6
13.8
-112.9
6.5
6
2016
13.0
14.7
145.3
4.0
37.0
61.6
54.4
5.5
11.1
50.7
0.0
9.2
9.2
-380.7
7.1
6
2017E
16.9
18.9
159.4
5.4
38.6
47.4
42.2
5.0
10.1
36.7
0.0
11.1
11.1
207.7
8.5
3
2018E
17.9
20.2
169.6
6.4
42.8
44.6
39.6
4.7
8.9
32.7
0.0
10.9
10.9
212.1
8.8
3
2019E
21.0
23.4
182.3
6.9
39.4
38.1
34.2
4.4
7.7
27.2
0.0
11.9
11.9
353.4
9.6
3
-0.5
-0.4
-0.3
-0.2
-0.5
-0.4
-0.5
-0.5
Cash Flow Statement
Y/E Mar
Adjusted EBITDA
Non cash opr. exp (inc)
(Inc)/Dec in Wkg. Cap.
Other operating activities
CF from Op. Activity
(Inc)/Dec in FA & CWIP
Free cash flows
(Pur)/Sale of Invt
Others
CF from Inv. Activity
Inc/(Dec) in Net Worth
Inc / (Dec) in Debt
Divd Paid (incl Tax) & Others
CF from Fin. Activity
Inc/(Dec) in Cash
Add: Opening Balance
Closing Balance
2012
1,442
-245
385
0
1,582
-1,103
479
517
0
-586
0
-1
-48
-49
947
2,038
2,986
2013
1,498
-421
-187
0
890
-2,012
-1,122
988
0
-1,024
-18
2
-127
-143
-276
2,986
2,709
2014
1,668
-334
-425
0
908
-1,024
-115
9
0
-1,015
-36
0
-255
-291
-398
2,709
2,311
2015
1,822
146
2
0
1,970
-2,151
-181
-6,279
0
-8,430
7,497
-4
-337
7,156
696
2,311
3,007
2016
1,580
-771
6,706
0
7,515
-1,620
5,895
7,744
0
6,124
25
0
-726
-701
12,938
3,007
15,946
2017E
2,184
-656
-1,617
0
-88
-530
-619
-7,810
0
-8,340
20
1
-796
-775
-9,204
15,946
6,742
2018E
2,405
-892
429
0
1,942
-340
1,602
945
0
605
(INR Million)
2019E
2,831
-1,044
92
0
1,879
-340
1,539
1,064
0
724
0
0
-936
-936
1,611
6,742
8,353
0
0
-1,007
-1,007
1,595
8,353
9,948
7 April 2017
8

Info Edge India
NOTES
7 April 2017
9

Disclosures
This document has been prepared by Motilal Oswal Securities Limited (hereinafter referred to as Most) to provide information about the company (ies) and/sector(s), if any, covered in the report and may be distributed by it
and/or its affiliated company(ies). This report is for personal information of the selected recipient/s and does not construe to be any investment, legal or taxation advice to you. This research report does not constitute an
offer, invitation or inducement to invest in securities or other investments and Motilal Oswal Securities Limited (hereinafter referred as MOSt) is not soliciting any action based upon it. This report is not for public distribution
and has been furnished to you solely for your general information and should not be reproduced or redistributed to any other person in any form. This report does not constitute a personal recommendation or take into
account the particular investment objectives, financial situations, or needs of individual clients. Before acting on any advice or recommendation in this material, investors should consider whether it is suitable for their
particular circumstances and, if necessary, seek professional advice. The price and value of the investments referred to in this material and the income from them may go down as well as up, and investors may realize losses
on any investments. Past performance is not a guide for future performance, future returns are not guaranteed and a loss of original capital may occur.
MOSt and its affiliates are a full-service, integrated investment banking, investment management, brokerage and financing group. We and our affiliates have investment banking and other business relationships with a some
companies covered by our Research Department. Our research professionals may provide input into our investment banking and other business selection processes. Investors should assume that MOSt and/or its affiliates are
seeking or will seek investment banking or other business from the company or companies that are the subject of this material and that the research professionals who were involved in preparing this material may educate
investors on investments in such business . The research professionals responsible for the preparation of this document may interact with trading desk personnel, sales personnel and other parties for the purpose of
gathering, applying and interpreting information. Our research professionals are paid on twin parameters of performance & profitability of MOSt.
MOSt generally prohibits its analysts, persons reporting to analysts, and members of their households from maintaining a financial interest in the securities or derivatives of any companies that the analysts cover.
Additionally, MOSt generally prohibits its analysts and persons reporting to analysts from serving as an officer, director, or advisory board member of any companies that the analysts cover. Our salespeople, traders, and
other professionals or affiliates may provide oral or written market commentary or trading strategies to our clients that reflect opinions that are contrary to the opinions expressed herein, and our proprietary trading and
investing businesses may make investment decisions that are inconsistent with the recommendations expressed herein. In reviewing these materials, you should be aware that any or all of the foregoing among other things,
may give rise to real or potential conflicts of interest. MOSt and its affiliated company(ies), their directors and employees and their relatives may; (a) from time to time, have a long or short position in, act as principal in, and
buy or sell the securities or derivatives thereof of companies mentioned herein. (b) be engaged in any other transaction involving such securities and earn brokerage or other compensation or act as a market maker in the
financial instruments of the company(ies) discussed herein or act as an advisor or lender/borrower to such company(ies) or may have any other potential conflict of interests with respect to any recommendation and other
related information and opinions.; however the same shall have no bearing whatsoever on the specific recommendations made by the analyst(s), as the recommendations made by the analyst(s) are completely independent
of the views of the affiliates of MOSt even though there might exist an inherent conflict of interest in some of the stocks mentioned in the research report
Reports based on technical and derivative analysis center on studying charts company's price movement, outstanding positions and trading volume, as opposed to focusing on a company's fundamentals and, as such, may not match with a report on a
company's fundamental analysis. In addition MOST has different business segments / Divisions with independent research separated by Chinese walls catering to different set of customers having various objectives, risk profiles, investment horizon,
etc, and therefore may at times have different contrary views on stocks sectors and markets.
Unauthorized disclosure, use, dissemination or copying (either whole or partial) of this information, is prohibited. The person accessing this information specifically agrees to exempt MOSt or any of its affiliates or employees
from, any and all responsibility/liability arising from such misuse and agrees not to hold MOSt or any of its affiliates or employees responsible for any such misuse and further agrees to hold MOSt or any of its affiliates or
employees free and harmless from all losses, costs, damages, expenses that may be suffered by the person accessing this information due to any errors and delays. The information contained herein is based on publicly
available data or other sources believed to be reliable. Any statements contained in this report attributed to a third party represent MOSt’s interpretation of the data, information and/or opinions provided by that third party
either publicly or through a subscription service, and such use and interpretation have not been reviewed by the third party. This Report is not intended to be a complete statement or summary of the securities, markets or
developments referred to in the document. While we would endeavor to update the information herein on reasonable basis, MOSt and/or its affiliates are under no obligation to update the information. Also there may be
regulatory, compliance, or other reasons that may prevent MOSt and/or its affiliates from doing so. MOSt or any of its affiliates or employees shall not be in any way responsible and liable for any loss or damage that may
arise to any person from any inadvertent error in the information contained in this report. MOSt or any of its affiliates or employees do not provide, at any time, any express or implied warranty of any kind, regarding any
matter pertaining to this report, including without limitation the implied warranties of merchantability, fitness for a particular purpose, and non-infringement. The recipients of this report should rely on their own
investigations.
This report is intended for distribution to institutional investors. Recipients who are not institutional investors should seek advice of their independent financial advisor prior to taking any investment decision based on this
report or for any necessary explanation of its contents.
Most and it’s associates may have managed or co-managed public offering of securities, may have received compensation for investment banking or merchant banking or brokerage services, may have received any
compensation for products or services other than investment banking or merchant banking or brokerage services from the subject company in the past 12 months.
Most and it’s associates have not received any compensation or other benefits from the subject company or third party in connection with the research report.
Subject Company may have been a client of Most or its associates during twelve months preceding the date of distribution of the research report
MOSt and/or its affiliates and/or employees may have interests/positions, financial or otherwise of over 1 % at the end of the month immediately preceding the date of publication of the research in the securities mentioned
in this report. To enhance transparency, MOSt has incorporated a Disclosure of Interest Statement in this document. This should, however, not be treated as endorsement of the views expressed in the report.
Motilal Oswal Securities Limited is registered as a Research Analyst under SEBI (Research Analyst) Regulations, 2014. SEBI Reg. No. INH000000412
Pending Regulatory inspections against Motilal Oswal Securities Limited:
SEBI pursuant to a complaint from client Shri C.R. Mohanraj alleging unauthorized trading, issued a letter dated 29th April 2014 to MOSL notifying appointment of an Adjudicating Officer as per SEBI regulations to hold inquiry
and adjudge violation of SEBI Regulations; MOSL replied to the Show Cause Notice whereby SEBI granted us an opportunity of Inspection of Documents. Since all the documents requested by us were not covered we have
requested to SEBI vide our letter dated June 23, 2015 to provide pending list of documents for inspection.
List of associate companies of Motilal Oswal Securities Limited -Click
here to access detailed report
Analyst Certification
The views expressed in this research report accurately reflect the personal views of the analyst(s) about the subject securities or issues, and no part of the compensation of the research analyst(s) was, is, or will be directly or
indirectly related to the specific recommendations and views expressed by research analyst(s) in this report. The research analysts, strategists, or research associates principally responsible for preparation of MOSt research
receive compensation based upon various factors, including quality of research, investor client feedback, stock picking, competitive factors and firm revenues
Info Edge India
Disclosure of Interest Statement
Analyst ownership of the stock
No
Served as an officer, director or employee -
No
A graph of daily closing prices of securities is available at www.nseindia.com and http://economictimes.indiatimes.com/markets/stocks/stock-quotes
Regional Disclosures (outside India)
This report is not directed or intended for distribution to or use by any person or entity resident in a state, country or any jurisdiction, where such distribution, publication, availability or use would be contrary to law,
regulation or which would subject MOSt & its group companies to registration or licensing requirements within such jurisdictions.
For Hong Kong:
This report is distributed in Hong Kong by Motilal Oswal capital Markets (Hong Kong) Private Limited, a licensed corporation (CE AYY-301) licensed and regulated by the Hong Kong Securities and Futures
Commission (SFC) pursuant to the Securities and Futures Ordinance (Chapter 571 of the Laws of Hong Kong) “SFO”. As per SEBI (Research Analyst Regulations) 2014 Motilal Oswal Securities (SEBI Reg No. INH000000412) has
an agreement with Motilal Oswal capital Markets (Hong Kong) Private Limited for distribution of research report in Kong Kong. This report is intended for distribution only to “Professional Investors” as defined in Part I of
Schedule 1 to SFO. Any investment or investment activity to which this document relates is only available to professional investor and will be engaged only with professional investors.” Nothing here is an offer or solicitation
of these securities, products and services in any jurisdiction where their offer or sale is not qualified or exempt from registration. The Indian Analyst(s) who compile this report is/are not located in Hong Kong & are not
conducting Research Analysis in Hong Kong.
For U.S.
Motilal Oswal Securities Limited (MOSL) is not a registered broker - dealer under the U.S. Securities Exchange Act of 1934, as amended (the"1934 act") and under applicable state laws in the United States. In addition MOSL is
not a registered investment adviser under the U.S. Investment Advisers Act of 1940, as amended (the "Advisers Act" and together with the 1934 Act, the "Acts), and under applicable state laws in the United States.
Accordingly, in the absence of specific exemption under the Acts, any brokerage and investment services provided by MOSL, including the products and services described herein are not available to or intended for U.S.
persons.
This report is intended for distribution only to "Major Institutional Investors" as defined by Rule 15a-6(b)(4) of the Exchange Act and interpretations thereof by SEC (henceforth referred to as "major institutional investors").
This document must not be acted on or relied on by persons who are not major institutional investors. Any investment or investment activity to which this document relates is only available to major institutional investors
and will be engaged in only with major institutional investors. In reliance on the exemption from registration provided by Rule 15a-6 of the U.S. Securities Exchange Act of 1934, as amended (the "Exchange Act") and
interpretations thereof by the U.S. Securities and Exchange Commission ("SEC") in order to conduct business with Institutional Investors based in the U.S., MOSL has entered into a chaperoning agreement with a U.S.
registered broker-dealer, Motilal Oswal Securities International Private Limited. ("MOSIPL"). Any business interaction pursuant to this report will have to be executed within the provisions of this chaperoning agreement.
The Research Analysts contributing to the report may not be registered /qualified as research analyst with FINRA. Such research analyst may not be associated persons of the U.S. registered broker-dealer, MOSIPL, and
therefore, may not be subject to NASD rule 2711 and NYSE Rule 472 restrictions on communication with a subject company, public appearances and trading securities held by a research analyst account.
For Singapore
Motilal Oswal Capital Markets Singapore Pte Limited is acting as an exempt financial advisor under section 23(1)(f) of the Financial Advisers Act(FAA) read with regulation 17(1)(d) of the Financial Advisors Regulations and is a
subsidiary of Motilal Oswal Securities Limited in India. This research is distributed in Singapore by Motilal Oswal Capital Markets Singapore Pte Limited and it is only directed in Singapore to accredited investors, as defined in
the Financial Advisers Regulations and the Securities and Futures Act (Chapter 289), as amended from time to time.
In respect of any matter arising from or in connection with the research you could contact the following representatives of Motilal Oswal Capital Markets Singapore Pte Limited:
Varun Kumar
Varun.kumar@motilaloswal.com
Contact : (+65) 68189232
Office Address:21 (Suite 31),16 Collyer Quay,Singapore 04931
INFO EDGE INDIA
7 April 2017
Motilal Oswal Tower, Level 9, Sayani Road, Prabhadevi, Mumbai 400 025
Phone: +91 22 3982 5500 E-mail: reports@motilaloswal.com
Motilal Oswal Securities Ltd
10