27 April 2017
Market snapshot
Equities - India
Close
Chg .%
Sensex
30,133
0.6
Nifty-50
9,352
0.5
Nifty-M 100
18,023
-0.2
Equities-Global
Close
Chg .%
S&P 500
2,387
0.0
Nasdaq
6,025
0.0
FTSE 100
7,289
0.2
DAX
12,473
0.0
Hang Seng
10,318
0.4
Nikkei 225
19,289
1.1
Commodities
Close
Chg .%
Brent (US$/Bbl)
51
-0.5
Gold ($/OZ)
1,265
-0.4
Cu (US$/MT)
5,689
0.2
Almn (US$/MT)
1,956
0.1
Currency
Close
Chg .%
USD/INR
64.1
-0.3
USD/EUR
1.1
0.1
USD/JPY
111.3
0.7
YIELD (%)
Close
1MChg
10 Yrs G-Sec
7.0
0.0
10 Yrs AAA Corp
7.9
0.0
Flows (USD b)
26-Apr
MTD
FIIs
-0.1
-0.2
DIIs
0.2
1.0
Volumes (INRb)
26-Apr
MTD*
Cash
345
301
F&O
7,953
5,107
Note: YTD is calendar year, *Avg
YTD.%
13.2
14.2
25.6
YTD.%
6.6
11.9
2.0
8.6
9.8
0.9
YTD.%
-7.8
9.1
3.0
14.8
YTD.%
-5.5
3.3
-5.0
YTDchg
0.4
0.3
YTD
6.4
1.2
YTD*
281
4,589
Today’s top research theme
Economy: Is fiscal policy reaching limits?
v
Over the past few years, states' tax receipts have weakened sizably, increasing
their reliance on the center. The combined tax-to-GDP ratio budgeted for
2017-18 is still meaningfully lower than the peak seen over a decade ago. Not
surprisingly then, the states have budgeted 13-year lowest growth in their
total spending, in line with the 12-year lowest growth budgeted by the center.
v
Not only the center, but the states too are focused on investments.
Consequently, the states have budgeted for 15-year lowest growth in
consumption spending. As per the second advance estimates, government
consumption spending is estimated to have grown 17% in FY17 and
contributed one-fourth to real GDP growth of 7.1%.
v
With flows from fiscal taps slowing and private investments remaining
lackluster, it might be difficult for private consumption to offset the entire
adverse effect. We would not be surprised if real GDP growth fails to pick up
in FY18.
Research covered
Cos/Sector
Economy
Axis Bank
LIC Housing Fin.
IDFC Bank
Zensar Technologies
KPIT Technologies
Results Expectation
Key Highlights
Is fiscal policy reaching limits?
NIMs surprises positively; Pool of stress loans remain unchanged
Core retail growth remains moderate at <10%YoY; Valuation limits upside
Focusing on retail assets; stressed assets stable
Two steps ahead, one step back; Profitability bogged down by restructuring
In-line performance, excluding the addition of MicroFuzzy
Biocon | Kotak Mah. Bank | Maruti | Shriram Trans | TVS Motor
Quote of the day
Piping hot news
If a financial institution is too big to fail, it
Sebi allows options trading in commodities
v
Capital market regulator the Securities and Exchange Board of India (Sebi) on
is too big to exist.
Wednesday announced the much-awaited commodity market reform of
permitting exchanges to launch options contracts.
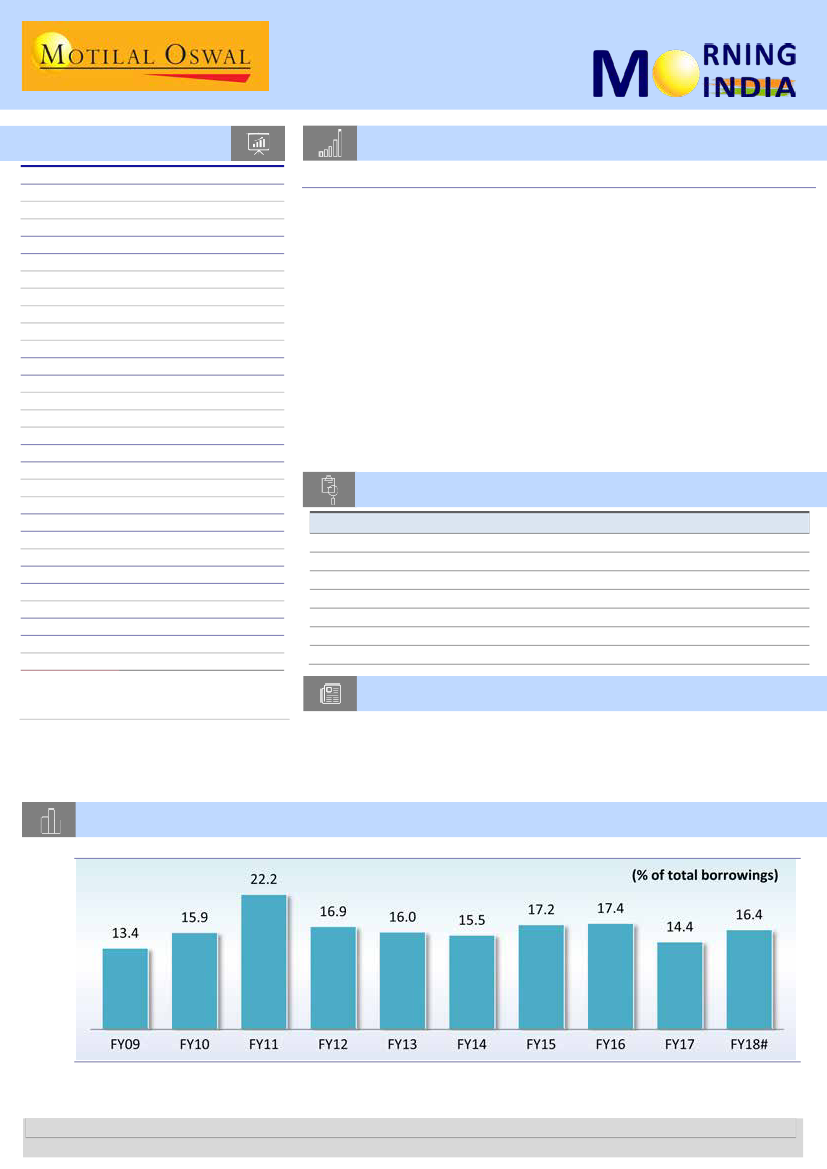
Chart of the Day: Economy (Is fiscal policy reaching limits?)
States estimated to borrow INR4.4t in FY18 (INRb) of which ~17% is planned in the first quarter
#Based on our estimate of full-year borrowings by all states
Source: States budgets, RBI, CEIC, MoSL
Research Team (Gautam.Duggad@MotilalOswal.com)
Motilal Oswal research is available on www.motilaloswal.com/Institutional-Equities, Bloomberg, Thomson Reuters, Factset and S&P Capital.
Investors are advised to refer through important disclosures made at the last page of the Research Report.

In the news today
Kindly click on numbers for the detailed news link
1
Setback to India as
international panel rejects
stay on Cairn arbitration
n a setback to India, an
international arbitration panel has
rejected its demand for a stay on
an arbitration initiated by British
oil explorer Cairn Energy plc
against a Rs 10,247 crore
retrospective tax notice…
2
Tata Motors, the most impacted company by last month's Supreme Court
ban on registration of vehicles meeting BS-III emission standards, said it
might be exporting at least half of its 15,000 impacted light, medium and
heavy commercial vehicles (CVs). For the rest, it is hoping the industry will
get a window of opportunity from the court. "The stock with our dealers is
(now) close to nil. The bulk of the 15,000 vehicles we have in stocks is
skewed towards light CVs. We have done an analysis and can easily export
around 8,000," said Ravindra Pisharody, executive director at the
country's biggest CV company…
Tata Motors aims to export about 8,000 BS-III commercial vehicles
3
Miners warn of 80-mt iron ore
deficit on lease extension
delay
The iron ore mining sector faces a
challenge a little down the line, as
licences of 250 mines are to lapse
in three years from now. Only 50
of these are in operation,
producing 80 million tonnes (mt)
annually, a little over 80 per cent
of these in Odisha…
4
No move to tax farm income,
clarifies Arun Jaitley
The Centre sought to distance
itself from proposals to tax
agricultural income, on
Wednesday, with Finance Minister
Arun Jaitley dismissing any such
plans. “To obviate any confusion
on the subject, I categorically state
that the Central Government has
no plan to impose any tax on
agriculture income,” said Jaitley…
5
We’re cautiously optimistic
about credit growth in FY18,
says Jairam Sridharan CFO,
Axis Bank
6
Kingfisher Looks to Take Beer
Market by Storm
India's largest beermaker United
Breweries (UB) is betting on its
latest strong brew, Kingfisher
Storm, to wean away customers
from rival Carlsberg that has
steadily gained 15% market share
over the past five years. Storm
will directly compete with
Carlsberg Elephant, Tuborg
Strong, and the recently
introduced Tuborg Classic…
7
HDFC may sell realty, digital
units to Quikr for 5% stake
Housing Development Finance
Corp. Ltd (HDFC) is in talks with
online classifieds company Quikr
India Pvt. Ltd to sell its brokerage
business HDFC Realty and its
digital business HDFC Red in an-all
stock deal, four people with direct
knowledge of the matter said…
Axis Bank on Wednesday reported
a 43% year-on-year (y-o-y) fall in
net profit to Rs 1,225 crore for the
March quarter. The bank’s watch
list has reduced 15% over the
previous quarter and stood at Rs
9,436 crore, leading to a rise in
bad loans. CFO Jairam Sridharan
said the bank is cautiously
optimistic about credit growth in
FY18…
27 April 2017
2

Thematic | States Budget
Economy
Is fiscal policy reaching limits?
From our combined study of central and state budgets, it appears so
Though every minute detail of the union budget is examined closely, state budgets do not
receive their due share of attention. Together, state budgets constitute ~150% of the union
budget and the states’ market borrowings are expected to increase from less than 50% of
the center’s in FY16 to 75% in FY18. To better grasp fiscal policy implications, a detailed
analysis of the combined budgets of both the center and the states is essential. Through
this report, we also intend to address the lack of contemporary studies on state budgets.
Our key findings:
n
Over the past few years, states’ tax receipts have weakened sizably, increasing their
reliance on the center. The combined tax-to-GDP ratio budgeted for 2017-18 is still
meaningfully lower than the peak seen over a decade ago. Not surprisingly then, the
states have budgeted 13-year lowest growth in their total spending, in line with the
12-year lowest growth budgeted by the center.
Fiscal deficit of the center and
states in the past three decades
(% of GDP)
Centre
8
6
4
2
0
States*
n
Not only the center, but the states too are focused on investments. Consequently, the
states have budgeted for 15-year lowest growth in consumption spending. As per the
second advance estimates, government consumption spending is estimated to have
grown 17% in FY17 and contributed one-fourth to real GDP growth of 7.1%.
n
With flows from fiscal taps slowing and private investments remaining lackluster, it
might be difficult for private consumption to offset the entire adverse effect. We
would not be surprised if real GDP growth fails to pick up in FY18.
Why should one read this report?
It is widely argued that the Union Budget receives unduly high attention, while state
budgets do not receive their due share of attention. With government consumption
spending accounting for ~10% of GDP and estimated to have contributed more than
20% to real GDP growth in FY17, the general government (center + states) is more
relevant than the center alone.
There are at least three reasons why states’ budgets should be given at least as
much importance as the center’s.
Firstly,
states account for about three-fifth of the
general government’s total consumption (revenue spending excluding interest
payments) and investment (capital spending).
Secondly,
while the center has kept its
gross market borrowings broadly unchanged over the past six years, the states have
almost trebled their borrowings. States’ securities (also known as state development
loans, SDLs) are expected to be more than 75% of the center’s securities in FY18 (as
against less than 50% just three years ago).
Finally,
with states getting about 40% of
the taxes collected by the center (after the recommendation of the fourteenth
finance commission), state budgets are more important than ever.
Apart from Reserve Bank of India (RBI), we are not aware of any other organization
producing comprehensive data or research on states’ budgets. The RBI reports too
are generally released with a lag of 12-14 months (the recent RBI report due for
release will contain data on 2016-17 budget estimates, though 2017-18 budgets
3
* Aggregate data of 17 states
Economy
Is fiscal policy reaching
limits?
Mr Nikhil Gupta
27 April 2017

were presented by states last month). To fill this vacuum, we conducted this in-
depth study, covering 17 major states that account for ~85% of the national GDP,
~90% of gross market borrowings by all states, ~85% of all states’ budgets. The 17
states covered are: Andhra Pradesh (AP), Bihar (BH), Chhattisgarh (CG), Gujarat (GJ),
Haryana (HR), Himachal Pradesh (HP), Jammu & Kashmir (JK), Jharkhand (JH),
Karnataka (KA), Kerala (KL), Madhya Pradesh (MP), Maharashtra (MH), Odisha (OR),
Rajasthan (RJ), Tamil Nadu (TN), Telangana (TG), and West Bengal (WB). Although
we have historical data for three other major states – Punjab (PB), Uttarakhand (UK)
and Uttar Pradesh (UP), they are not included in our study because these states
have not yet presented their 2017-18 budgets.
This report is divided into three sections. Section-I provides five themes for the
financial markets after careful study of the combined budget for the general
government
1
. In section-II, we analyze the combined budget of the center and the
states. In the third and final section, we examine the pooled budgets of 17 states.
Exhibit 1: Trends in states’* fiscal deficit in the past two decades
4.8
5.3
4.6
4.6
Fiscal deficit (INRb)
4.7
4.8
3.7
2.9
2.1
1.7
2.5
3.3
2.3
2.1
2.1
2.4
2.8
3.1
2.9
3.1
% of GDP
2.6
* Combined data for 17 states
Source: State budget documents, CEIC, RBI, MOSL
Exhibit 2: States have increased their reliance on market
borrowings, while the center has reduced it (% of GFD)
120
90
60
30
0
FY91 FY94 FY97 FY00 FY03 FY06 FY09 FY12 FY15FY18BE
* Aggregate data of 17 states
Centre
States*
Exhibit 3: All states have budgeted to borrow INR4.4t in FY18
– up 22% from FY17 (INRb)
5,000
4,000
3,000
2,000
1,000
0
Source: Union/State budget documents, CEIC, RBI, CSO, MOSL
27 April 2017
4

26 April 2017
4QFY17 Results Update | Sector: Financials
Axis Bank
Neutral
BSE SENSEX
27,309
Bloomberg
Equity Shares (m)
M.Cap.(INR b)/(USD b)
52-Week Range (INR)
1, 6, 12 Rel. Per (%)
12M Avg Val (INR M)
Free float (%)
S&P CNX
8,435
AXSB IN
2,382.8
1245.4 / 18.3
638 / 425
3/-1/-8
5068
71.2
CMP: INR517
n
TP: INR525 (+1%)
NIMs surprises positively; Pool of stress loans remain unchanged
Axis Bank’s (AXSB) PAT of INR12.25b beat our estimate of INR8.3b by 47%. Key
positives are a) Core NIMs improved 10bp QoQ to 3.83% b) Strong loan growth
of 7% QoQ c) Share of Retail and SME loans increased to 58.2% vs 55.5% a
quarter ago and d) Average daily CASA growth stood at 26% YoY with SA
growth at 29% YoY; Average CASA ratio stood at 43%
Total pool of gross stress loans was largely unchanged at INR412b (10.2% of
customer assets). Net stress loans proportion stood at INR283b vs INR279b a
quarter ago.
Slippages of INR48b were in line with those in the prior quarter (slippage ratio
of 5.68% annualized). Around 74% of slippages (INR35.7b) were from the
watchlist (70% in 3QFY17). However, this included one cement account of
INR16.6b that slipped into NPL as well as got recovered/upgraded, both, during
the quarter. Excluding this, slippage ratio would be 3.72% annualized.
AXSB also sold loans worth INR23.54b gross (INR18.2b net) to ARCs against net
sale consideration of INR16.9b comprising INR2.7b in cash and INR14.2b in SRs.
FY17 was a tough year for AXSB with the significant balance sheet clean up. We
expect this to continue in FY18 as well. RoE have declined from 17% in FY16 to
7% in FY17.
Valuation and view:
We largely maintain the earnings estimates and expected
benefit of reduction in credit cost is compensated by lower margins. In FY17,
trading gains contributed 20% of operating profits vs FY13-16 average of 6%.
We model this to decline to 15% of PPoP in FY18 leading to flat PPoP. Core
PPoP is expected to grow 5% YoY lower than balance sheet growth of 11% YoY.
Continued clean up and expected pressure on core income is likely to keep
return ratios under pressure. We expect RoAs of ~0.9% and RoEs of ~10% in
FY18. We expect earnings to normalize only in FY19. Maintain Neutral with a
target price of INR525. At our target price, AXSB will trade at 1.9x March 2019
BV and 12.8x earnings
n
Financials & Valuation (INR b)
Y/E March
2016 2017E 2018E
n
NII
168.3 179.8 204.8
OP
161.0 178.0 188.1
NP
82.2
33.5
59.5
NIM (%)
3.8
3.6
3.6
EPS (INR)
34.5
14.1
25.0
BV/Sh. (INR)
216.8 230.8 251.4
n
RoE (%)
17.1
6.3
10.3
RoA (%)
1.7
0.6
0.9
n
P/E(X)
14.0
34.4
19.4
P/BV (X)
2.2
2.1
1.9
n
27 April 2017
5

26 April 2017
4QFY17 Results Update | Sector: Financials
LIC Housing Finance
BSE SENSEX
30,133
Bloomberg
Equity Shares (m)
M.Cap.(INR b)/(USD b)
52-Week Range (INR)
1, 6, 12 Rel. Per (%)
Avg Val. (INR m)
Free float (%)
S&P CNX
9,352
LICHF IN
Core retail growth remains moderate at <10%YoY; Valuation limits upside
505.0
n
LIC Housing Finance (LICHF) reported 4QFY17 PAT of INR5.3b (+18% YoY), in
341.4/5.3
line with our estimate. The quarter was characterized by stable loan growth, a
688 / 432
continued increase in share of LAP/builder loans and stable asset quality.
10/7/31
1260
n
Loan book growth was 15.5% YoY (6.8% QoQ), in line with the trend witnessed
over past 5-6 quarters. Growth continues to be driven by the non-retail
59.7
CMP: INR676
TP: INR723 (7%) Downgrade to Neutral
Financials & Valuations (INR b)
Y/E March
2017 2018E 2019E
NII
36.5
40.4
46.2
PPP
32.4
35.8
41.0
Adj. PAT
19.3
22.5
25.8
Adj. EPS (INR)
38.2
44.6
51.2
EPS Gr. (%)
16.3
16.6
14.8
BV/Sh (INR)
213.2 248.9 289.9
RoAA (%)
1.5
1.5
1.5
RoE (%)
19.4
19.3
19.0
Payout (%)
18.8
19.7
19.7
Valuations
P/E (x)
17.5
15.0
13.1
P/BV (x)
3.1
2.7
2.3
Div. Yield (%)
0.9
1.1
1.3
n
n
n
n
n
n
portfolio (65% YoY growth in LAP and 60% in builder loans). Disbursements in
LAP were INR45b (+18% YoY), while those in builder financing were INR12b
(+93% YoY). The QoQ increase in the LAP book was the highest ever at INR41b.
In line with the trend of past few quarters, the individual home loan book
continues to grow at a modest pace of 9.1% YoY, driven by ~11% disbursement
growth.
Margins (calculated) continued their upward trajectory, improving 11bp QoQ
to 2.97%, driven by 46bp reduction in cost of funds (calculated). Margins are
the highest in past 24 quarters. We expect spreads to remain largely stable at
these levels, with lower yields in home loans offset by higher share of non-core
loans and continued reduction in cost of funds. We believe cost of funds can
decline further from 4QFY17 levels (8.37%).
For full year FY17, PAT grew 16.3% YoY to INR19.3b. RoA/RoE was 1.5%/19.4%.
Operating expenses increased 25% YoY to INR1.97b, 6% more than our
estimate, driven by higher employee as well as establishment costs.
Other highlights:
(a) Share of floating rate loans increased from 62% in 3QFY17
to 70% in 4QFY17. (b) Tier I ratio stood at 14%.
Valuation and view:
Despite being the second largest HFC, LICHF has managed
to grow at ~15% YoY consistently. Large share of incremental growth is now
coming from high-yielding LAP and builder financing, which is helping to
negate yield pressure on the core retail portfolio. We believe growth in these
segments is necessary to sustain spreads. We marginally cut earnings
estimates for FY18/19 to factor in pressure on retail business. The stock has
run up 20% in last three months. At current valuations, we see limited upside.
We thus downgrade to
Neutral
with a TP of INR723 (2.5x FY19E BVPS).
27 April 2017
6

26 April 2017
4QFY17 Results Update | Sector: Financials
IDFC Bank
Neutral
BSE SENSEX
30,133
Bloomberg
Equity Shares (m)
M.Cap.(INR b)/(USDb)
52-Week Range (INR)
1, 6, 12 Rel. Per (%)
Avg. Val, INR m
Free float (%)
S&P CNX
9,352
IDFCBK IN
3392.6
207.0 / 3.0
83 / 44
-2/-29/0
621
47.1
CMP: INR61
n
n
TP: INR62 (2%)
Focusing on retail assets; stressed assets stable
IDFC Bank’s (IDFCBK) PAT rose 7% YoY to INR1.76b (12% beat), led by lower-
than-estimated opex and provisioning.
Total income was largely stable YoY at INR5.6b (28% miss), driven by 21% YoY
growth in NII to INR5b, offset by a 59% decline in non-interest income to
INR563m. NII missed our estimate by 5% due to pressure on margins. The
decline in non-interest income was on account of INR258m of trading losses, as
against INR782m of trading gains in 4QFY16.
Operating expenses came in 20% below estimate at INR3.0b (1% YoY, -22%
QoQ), driven by lower employee expenses (-30% YoY). Management has
guided for average 2HFY17 employee cost as a run-rate (without considering
new employee addition). C/I ratio remained largely stable YoY at 53%.
GNPL fell 57% QoQ to INR15.4b, resulting in GNPL ratio declining sequentially
from 7% to 3%. This reduction is due to sale of INR40b NPLs to an ARC.
Loan book growth remains sluggish. Advances grew 8% YoY (+5% QoQ) to
INR494b. Management targets to increase the share of retail loans from 25% to
55-60% in three years via both organic and inorganic opportunities.
Total deposits increased 49% QoQ to INR402b. CASA deposits more than
doubled QoQ to INR20.9b. However, we suspect this could be on account of
one-off float balances in current accounts.
Other highlights:
(1) Tier-1 ratio remains healthy at 18.5%; (2) Core fee income
increased significantly from INR595m in 4QFY16 to INR821m in 4QFY17.
Valuation view:
Near-term earnings are likely to remain volatile due to
transition cost, trading gains volatility and portfolio acquisitions (to fulfill PSL
requirements). Stress loans too remain high. Over medium-to-long term,
higher leverage, low cost-to-assets and higher share of infra bonds will lead to
higher sustainable RoA/RoE. Near-term uncertainty remains high. We value the
bank at 1.3x FY19 BV. Maintain
Neutral
with a revised TP (based on RI model)
of INR62 (1.3x FY19E BV).
Financials & Valuations (INR b)
Y/E March
2017E 2018E 2019E
NII
20.2
23.0
29.8
OP
17.5
18.3
24.0
NP
10.2
11.2
14.5
NIM (%)
2.3
2.0
2.1
EPS (INR)
3.0
3.3
4.3
EPS Gr. (%)
10.1
28.8
BV/Sh. (INR)
43.2
45.7
49
ABV/Sh. (INR)
40.6
42.8
46
RoE (%)
7.2
7.4
9.0
RoA (%)
1.0
0.9
0.9
P/E(X)
20.3
18.5
14.3
P/BV (X)
1.4
1.3
1.2
n
n
n
n
n
n
27 April 2017
7

Zensar Technologies
BSE SENSEX
30,039
Bloomberg
Equity Shares (m)
M.Cap.(INRb)/(USDb)
52-Week Range (INR)
1, 6, 12 Rel. Per (%)
Avg Val, INRm
Free float (%)
S&P CNX
9,313
ZENT IN
45
37.5 / 0.6
Profitability bogged down by restructuring
1136 / 814
n
Revenue decline led by ramp-up delays:
ZENT’s 4QFY17 revenue declined
-11/-20/-30
4.9% QoQ (est. of +2.7%) to USD112m. The decline was led by absence of
36
Product revenue (~USD8m), which sees a bump-up in 3Q, and delays in
51.4
26 April 2017
Q4FY17 Results Update | Sector: Technology
CMP: INR835
TP: INR1,020(+22%)
Buy
Two steps ahead, one step back
Financials & Valuations (INR b)
2017
2018E
Y/E Mar
30.8
32.8
Net Sales
3.9
4.3
EBITDA
2.5
3.0
PAT
54.9
67.6
EPS (INR)
-19.5
23.1
Gr. (%)
356.9
408.9
BV/Sh (INR)
16.3
17.7
RoE (%)
22.3
21.6
RoCE (%)
15.2
12.4
P/E (x)
2.3
2.0
P/BV (x)
2019E
37.5
5.1
3.5
78.4
16.0
470.2
17.8
22.7
10.6
1.8
n
n
Estimate change
TP change
Rating change
n
Quarterly Performance (Consolidated)
Y/E March
Revenue (USD m)
QoQ (%)
Revenue (INR m)
YoY (%)
GPM (%)
SGA (%)
EBITDA
EBITDA Margin (%)
EBIT Margin (%)
Other income
ETR (%)
PAT
QoQ (%)
YoY (%)
EPS (INR)
Headcount
Utilization (%)
Offshore rev. (%)
1Q
111
5.1
7,046
16.5
31.7
16.4
1,080
15.3
13.8
148
29.8
762
6.2
36.3
17.6
7,895
79.0
35.0
FY16
2Q
116
4.8
7,564
16.8
32.1
16.6
1,171
15.5
14.0
229
26.9
913
19.8
35.7
20.6
8,050
80.0
37.0
3Q
115
-1.4
7,568
5.5
30.6
16.2
1,089
14.4
12.9
95
30.4
715
-21.7
2.9
15.8
8,192
82.0
34.0
ramp-ups leading to some right-shifting of revenue. While this resulted in a
26% decline in IM revenue (19% of total), the Applications business was
stable (+1.7% QoQ). Due to a weak 4Q and ongoing reconstitution of the
business, FY17 revenue grew by 3.5% YoY CC.
Restructuring takes a toll on margins:
EBITDA margin contracted 450bp
QoQ to 9.3%, led by [1] restructuring in Multi-vendor services (MVS)
business (~USD3m), [2] pricing decline in some large customers (USD1.6m)
and [3] one-time expense of USD2m related to property taxes and
provisioning for Indian government projects. Even after excluding one-offs,
margins shrunk 270bp QoQ to 11.1%. PAT at INR217m declined 73.3% QoQ.
Dismal headline, strong undercurrents:
Several phases of ZENT’s
restructuring have been under execution, with progress seen in account
mining, launch of new services, thrust on Digital, addition of leadership,
revamping of sales function and pruning of non-core businesses. This has
taken a toll on FY17 results, with revenue growth of 3.5% YoY CC and margin
contraction of 160bp. While headline numbers look dismal, the underlying
signs of strategy execution remain encouraging.
Valuation view:
Factoring a slower trajectory of turnaround in business, we
have cut revenues by 6.2% / 6.7% and EBITDA margins by 145bp / 116bp,
driving EPS correction of 17% / 15% for FY18E/19E. For revenue/earnings
CAGR of 10/19% over FY17-19E, we maintain Buy with a revised price target
of INR1,020—discounting FY19E EPS by 13x.
4Q
111
-3.7
7,464
13.5
30.8
18.5
922
12.4
10.7
116
21.1
703
-1.7
-2.1
15.5
8,256
81.0
36.0
1Q
114
3.1
7,624
8.2
29.1
15.3
1,053
13.8
12.5
169
30.5
763
8.5
0.1
16.9
8,238
79.8
31.2
FY17
2Q
116
1.8
7,767
2.7
29.7
15.6
1,092
14.1
12.5
37
28.2
687
-10.0
-24.8
15.2
8,316
80.1
33.8
FY16
3Q
118
1.3
7,922
4.7
30.0
16.2
1,090
13.8
12.4
183
29.1
811
18.1
13.4
18.0
8,564
79.5
33.5
4Q
112
-4.9
7,492
0.4
28.0
18.7
697
9.3
7.7
-236
28.9
217
-73.3
-69.1
4.8
8,524
79.2
34.5
453
5.4
29,643
12.8
31.3
16.9
4,262
14.4
12.8
588
27.3
3,094
17.0
68.2
8,256
80.5
35.5
FY17
459
1.4
30,805
3.9
29.2
16.4
3,932
12.8
11.3
153
29.3
2,478
-19.9
54.9
8,524
79.7
33.2
Est.
4QFY17 Var. (% / bp)
121
-7.4
2.7
-756bp
8,037
-6.8
7.7
-730bp
30.6
-263bp
16.0
270bp
1,176
-40.7
14.6
-533bp
13.2
-549bp
-75
213.7
28.0
684
-68.3
-15.7
-5754bp
-2.7
-6642bp
15.2
8,564
-0.5
80.0
-80bp
33.6
88bp
27 April 2017
8

RESULTS
FLASH
KPIT Technologies
BSE SENSEX
30,133
S&P CNX
9,352
26 April 2017
Results Flash | Sector: Technology
CMP: INR130
n
TP: INR150(+15%)
Neutral
We will revisit our estimates
post earnings call/management
interaction.
In-line performance, excluding the addition of MicroFuzzy
4QFY17 revenue grew 4.4% QoQ to USD128m, beating estimate of +1.2%.
Growth in the quarter included USD4m from the integration of MicroFuzzy, a
recently acquired automotive engineering company based in Germany.
Excluding this, revenue was in line with our expectation.
Gross margin expanded 20bp QoQ to 29.2% (est. of 28.9%), while EBITDA
margin contracted 10bp QoQ to 10.1% (est. of 10.0%) due to INR appreciation
(-40bp), integration costs related to MicroFuzzy and increased travelling
expenses.
Adjusted PAT was INR537m (+13.1% QoQ), higher than our estimate of
INR451m (-5.0% QoQ), primarily led by higher revenue.
Conference Call Details
Date:
27 April 2017
Time:
04:00pm IST
Dial-in details:
+91-22-3960 0695
n
Financials & Valuations (INR b)
2016
2017E
Y/E Mar
Net Sales
33.2
35.6
EBITDA
3.5
4.0
NP
2.1
2.7
EPS (INR)
11.9
13.7
EPS Gr. (%)
-15.3
15.1
BV/Sh. (INR)
79.2
93.0
RoE (%)
14.3
16.0
RoCE (%)
15.9
15.7
Payout (%)
16.8
14.6
Div. Yield
1.5
1.5
2018E
th
n
38.8
n
KPIT guided for 6-8% CC growth in FY18. However, this would include
4.2
additional revenue from MicroFuzzy, which implies organic growth of 4-6%.
2.9
14.5
n
The company expects better profitability, led by higher utilization through
5.9
absorption of recently added freshers, delivery excellence and a focus on
107.5
automation. QoQ improvement in profitability is targeted despite headwinds
14.5
on account of INR appreciation.
14.5
13.8
Valuation and view:
We will revisit our estimates post the earnings call. Outlook on
1.5
growth recovery and margin resurrection will be keenly sought. Based on current
Guidance of 6-8% for FY18
estimates, it trades at 9.4/8.9x FY18/19E EPS. Maintain
Neutral.
Quarterly Performance (Consolidated)
Y/E March
Revenue (USD m)
QoQ (%)
Revenue (INR m)
YoY (%)
GPM (%)
SGA (%)
EBITDA
EBITDA Margin (%)
EBIT Margin (%)
Other income
Interest
ETR (%)
PAT
QoQ (%)
YoY (%)
EPS (INR)
Headcount
Util excl. trainees (%)
Offshore rev. (%)
Fixed Price (%)
1Q
118
-3.3
7,583
9.9
28.2
18.7
718
9.5
7.3
106
47
27.9
444
-11.8
-12.6
2.2
10,839
66.4
44.7
26.2
FY16
2Q
3Q
125
123
5.3
-1.0
8,123
8,130
7.2
4.3
32.1
32.9
18.1
18.3
1,139
1,186
14.0
14.6
11.9
12.3
86
36
44
35
25.4
26.5
751
735
69.1
-2.1
6.3
12.5
3.8
3.7
10,659 10,559
69.7
69.1
44.9
41.2
27.1
29.1
4Q
124
0.7
8,407
10.2
35.3
19.1
1,359
16.2
13.6
20
25
13.4
885
20.4
75.7
4.4
10,910
70.2
42.1
26.4
1Q
120
-3.5
8,032
5.9
28.9
18.3
855
10.7
8.3
116
56
24.3
551
-37.8
24.0
2.8
11,288
68.1
41.5
28.5
FY17
2Q
3Q
123
123
3.0
-0.4
8,310
8,307
2.3
2.2
29.5
29.0
18.5
18.8
914
846
11.0
10.2
8.6
7.9
49
29
14
66
25.1
23.1
562
475
2.0
-15.5
-25.2
-35.4
2.8
3.7
11,666 11,881
69.2
69.2
43.3
43.6
28.0
33.7
FY16
4Q
128
4.4
8,585
2.1
29.2
19.0
870
10.1
7.3
12
0
15.3
537
13.1
-39.3
2.7
12,110
69.2
43.4
490
0.3
32,243
7.8
32.2
18.6
4,353
13.5
11.4
248
152
22.8
2,815
18.7
14.1
10,910
68.8
43.2
FY17
494
0.8
33,234
3.1
29.1
18.7
3,486
10.5
8.0
207
136
22.2
2,125
-24.5
11.9
12,110
68.9
43.0
Est.
3QFY17
124
1.2
8,284
-1.5
28.9
18.9
830
10.0
7.6
20
63
23.1
451
-5.0
-49.0
2.3
11,770
70.0
43.8
Var. (% /
bp)
3.2
319bp
3.6
358bp
26bp
14bp
4.9
12bp
-36bp
-36.4
-99.3
19.1
1811bp
972bp
2.9
-80bp
-43bp
27 April 2017
9

March 2017 Results Preview | Sector: Healthcare
Biocon
Bloomberg
Equity Shares (m)
M. Cap. (INR b)/(USD b)
52-Week Range (INR)
1,6,12 Rel Perf. (%)
BIOS IN
200.0
224 / 3
1162 / 482
1 / 11 / 92
n
n
CMP: INR1122 TP: INR800 (-29%)
n
Sell
Financial Snapshot (INR Billion)
y/e march
2016 2017E 2018E 2019E
Sales
EBITDA
NP
EPS (INR)
EPS Gro. (%)
BV/Sh. (INR)
RoE (%)
RoCE (%)
Valuations
P/E (x)
P/BV (x)
EV/EBITDA
(x)
Div. Yield (%)
48.3
5.5
28.7
0.4
33.5
5.0
22.3
0.7
31.6
4.5
19.3
0.8
25.2
4.0
15.0
1.0
34.5
7.9
4.6
23.2
15.5
202.7
11.5
15.9
40.8
10.2
6.7
33.5
44.1
226.4
14.8
10.0
49.5
11.9
7.1
35.6
6.2
251.6
14.1
10.1
61.7
15.1
8.9
44.5
25.0
283.0
15.7
14.6
n
n
Key issues to watch out
Biocon’s revenue is likely to increase 6% YoY to INR10b, driven by
muted growth in CRO division, 13% growth in bio-pharma sales
and licensing income at INR67m.
EBITDA is expected to increase 32% YoY to INR2.4b, with EBITDA
margins at 24.6%.
We expect PAT to decline to INR1.6b, primarily owing to one time
gain in 4Q FY16. The key thing to watch would be the impact of
fire at the R&D center of Syngene.
Key growth drivers for FY17E/18E will be 1) commercialization
and ramp-up of the insulin plant in Malaysia, 2) ramp-up in CRO
division, 3) contribution from API/immuno-suppressants supplies
to partners and 4) branded formulations in India. However, capex
for long-term initiatives is likely to exert pressure on profitability
and return ratios in the near term.
The recent run-up in the stock price primarily on the back of
positive developments in the Biosimilars portfolio. Although the
progress is impressive, we believe there are still uncertainties that
cap the upside potential. In the near term, commissioning of the
Malaysia plant would exert pressure on profits. We maintain Sell
with a TP of INR800 @ 20x 1HFY19E EPS
Ø
Update on Middle-East problems.
Ø
Progress on Rh-Insulin/Glargine in Europe/US and other out-
licensing opportunities.
Quarterly Performance Consolidated
Y/E March
FY16
FY17E
3Q
10,290
24.2
7,680
2,610
25.4
710
90
630
2,440
550
22.5
180
1,710
66.0
16.6
4QE
11,286
19.4
8,514
2,772
24.6
714
35
548
2,571
536
20.8
186
1,849
-44.0
16.4
1Q
2Q
3Q
4Q
1Q
2Q
Net Sales
8,105
7,860
8,282
9,450
9,814
9,400
YoY Change (%)
12.8
4.9
8.8
13.8
21.1
19.6
Total Expenditure
6,127
6,270
6,483
7,598
7,276
7,150
EBITDA
1,978
1,590
1,799
1,852
2,538
2,250
Margins (%)
24.4
20.2
21.7
19.6
25.9
23.9
Depreciation
591
610
621
647
661
680
Interest
44
30
15
166
57
70
Other Income
304
-750
289
3,014
502
520
PBT
1,647
200
1,452
4,053
2,322
2,020
Tax
376
290
241
591
552
420
Rate (%)
22.8
145.0
16.6
14.6
23.8
20.8
Minority Interest
33
20
181
159
104
130
Adj PAT
1,238
970
1,030
742
1,466
1,470
YoY Change (%)
20.2
-4.9
13.4
-63.2
34.6
51.5
Margins (%)
15.3
12.3
12.4
7.9
17.0
15.6
E: MOSL Estimates; Note - Quarterly nos will not add up to full-year nos due to restatements
(INR Million)
FY16
34,507
12.8
26,654
7,853
22.8
2,423
102
1,192
6,520
1,131
17.3
744
4,646
-7.0
13.5
FY17E
40,790
18.2
30,620
10,170
24.9
2,765
252
2,200
9,353
2,058
22.0
600
6,695
44.1
16.4
27 April 2017
10

March 2017 Results Preview | Sector: Financials - Banks
Kotak Mahindra Bank
Bloomberg
Equity Shares (m)
M. Cap. (INR b)/(USD b)
52-Week Range (INR)
1,6,12 Rel Perf. (%)
KMB IN
1834.4
1629 / 25
896 / 656
6 / 7 / 12
n
CMP: INR888
n
TP: INR1,017 (+15%)
Buy
Financial Snapshot (INR b)
Y/E MARCH
2016 2017E 2018E 2019E
NII
69.0
80.7
90.6 110.3
OP
40.4
58.1
69.3
89.2
NP
20.9
33.2
40.8
53.4
Cons. NP
34.6
48.2
59.2
75.7
NIM (%)
4.1
4.4
4.4
4.4
Cons.
EPS 18.9
26.3
32.3
41.3
(INR) (%)
EPS Gr.
39.2
22.9
27.8
Cons. BV. (INR) 182
207
238
278
Cons. RoE (%)
10.9
13.5
14.5
16.0
RoA (%)
1.1
1.6
1.8
2.0
Payout (%)
5.1
5.8
5.8
5.8
Valuations
P/E(X) (Cons.)
47.1
33.8
27.5
21.5
P/BV
(X) 4.9
4.3
3.7
3.2
(Cons.) (%)
Div. Yield
0.0
0.1
0.1
0.1
n
n
We expect the standalone bank to report 15% loan growth and
12.5% deposit growth in 4QFY17. NIM is likely to decline ~5bp
QoQ, but improve 16bp YoY. Overall, we expect NII growth of 13%
YoY. CASA retention would be a key driver of NII and NIM.
With strong digital initiatives, fast-paced customer acquisition and
merger synergies from eIVBL, fee income would be a key growth
driver for the bank. We factor in fee income growth of 20% in 4Q
and expect an improving trend in the coming quarters.
We expect asset quality to remain stable, with GNPA less than
2.5% and NNPA at 1%, led by high provision coverage ratio.
On a reported basis, we expect standalone bank earnings to grow
28% YoY. The stock trades at 3.2x FY19E consolidated BV and
21.5x FY19E consolidated EPS. Maintain
Buy.
Key issues to watch for
Ø
Guidance on balance sheet growth.
Ø
Performance on CASA, fees and growth – the initial pain of
merger is behind now.
Ø
Performance of non-banking subsidiaries and their contribution
to overall profit.
Quarterly Performance
Y/E March
1Q
FY16
2Q
3Q
4Q
1Q
FY17E
2Q
FY16
3Q
4QE
21,008
13.1
15,312
28.2
8,878
27.6
1,393
497
74
846
240
170
5
804
-190
12,716
20.6
69,004
63.4
40,411
34.8
20,898
12.0
5,025
1,540
320
2,515
1,050
720
50
2,510
-19
34,608
13.7
FY17E
Kotak Bank (standalone)
Net Interest Income
15,982 16,787 17,662 18,572
19,191 19,954
% Change (Y-o-Y)
59.5
61.6
66.7
65.4
20.1
18.9
Operating Profit
5,970 10,448 12,052 11,942
13,150 14,401
% Change (Y-o-Y)
-10.3
42.4
63.4
38.7
120.3
37.8
Net Profit
1,898
5,695
6,347
6,958
7,420
8,133
% Change (Y-o-Y)
-55.8
28.1
36.6
32.0
291.0
42.8
Other Businesses
Kotak Prime
1,190
1,270
1,260
1,300
1,200
1,300
Kotak Mah. Investments
300
360
390
500
400
530
Kotak Mah. Capital Co
30
70
60
170
230
50
Kotak Securities
670
780
550
510
600
960
International subs
250
320
260
220
130
310
Kotak Mah. AMC & Trustee Co.
200
230
40
250
190
70
Kotak Investment Advisors
0
0
-10
50
110
10
Kotak OM Life Insurance
660
480
600
770
710
630
Con.adj and MI
-30
230
-40
-180
-240
30
Conso. PAT
5,168
9,435
9,457 10,548
10,750 12,023
% Change (Y-o-Y)
-25.9
31.5
32.0
15.5
108.0
27.4
E: MOSL Estimates, Quarterly numbers vary from full year number due to difference in reporting
20,503
16.1
15,277
26.8
8,798
38.6
1,330
480
70
850
220
160
0
680
80
12,668
33.9
80,656
16.9
58,140
43.9
33,228
59.0
5,223
1,907
424
3,256
900
590
125
2,824
-320
48,156
39.1
27 April 2017
11

March 2017 Results Preview | Sector: Automobiles
Maruti Suzuki
Bloomberg
Equity Shares (m)
M. Cap. (INR b)/(USD b)
52-Week Range (INR)
1,6,12 Rel Perf. (%)
MSIL IN
302.1
1915 / 29
6356 / 3419
4 / 5 / 58
CMP: INR6,285 TP:INR7,299 (+16%)
Buy
Financial Snapshot (INR b)
Y/E MARCH
2016 2017E 2018E 2019E
Sales
EBITDA
Adj. PAT
EPS Gr. (%)
BV/Sh. (INR)
RoE (%)
RoCE (%)
Payout (%)
Valuations
P/E (x)
P/CE (x)
EV/EBITDA (x)
40.3
25.2
19.3
24.7
18.5
16.0
0.7
20.4
15.4
12.2
1.0
16.7
12.9
9.7
1.1
576.5 682.7 816.1 945.3
89.0 104.6 130.7 156.0
53.7
23.4
19.9
27.2
23.7
74.5
62.8
22.4
30.7
22.2
91.2 111.2
21.5
23.0
30.9
23.9
21.6
23.1
30.5
22.9
Con.adj.EPSINR 155.5 253.2 307.6 374.1
894.0 1,083 1,313 1,597
n
Volume grew by ~15% YoY (+7% QoQ) in 4QFY17 to ~414,439
units, led by continuous better performance from Baleno and
Brezza, with ongoing high waiting period.
n
Net realization is likely to improve 6% YoY (+3.3% QoQ) to
INR449,769 per unit, boosting net revenue by ~22% YoY (+10.5%
QoQ) to INR186.4b. Growth in realization is likely to be driven by
improvement in product mix due to compact UV, Vitarra Brezza,
and premium hatchback, Baleno.
n
We expect margin to decline 80 bp YoY (-20bp QoQ) to 14.6% led
by impact of commissioning of Gujarat plant and higher fixed cost
due to same. Higher commodity prices are likely to be offset by
hike in prices.
n
EBITDA is estimated to grow by 15% YoY (+9% QoQ) at INR27.2b.
n
We expect PAT to grow ~17% YoY (+5% QoQ) to INR18.2b led by
pre- operative expenses of Gujarat plant taken as extraordinary
item and lower other income due to higher yield.
n
The stock trades at 16.8x FY18E and 14.7x FY19E EPS. Maintain
Buy.
Key issues to watch
Ø
Update on demand scenario, channel inventory, discounting trends
and new launches.
Div. Yield (%)
0.6
*Consol. & adjusted
Ø
Gujarat plant product pipeline.
Quarterly Performance
1Q
341,329
13.8
391,907
2.8
133,769
17.1
67.4
3.5
12.9
21,673
16.2
2,065
190
6,716
16,832
28.2
12,081
58.5
FY16
2Q
3Q
353,335 374,182
9.8
15.5
392,013 401,227
2.5
3.1
138,512 150,132
12.5
19.1
66.9
68.6
3.0
3.3
13.9
13.8
22,457
21,452
16.2
14.3
4,736
2,425
178
244
6,694
7,221
20,321
16,412
26.3
27.9
14,973
11,830
73.6
42.7
4Q
360,354
3.9
425,002
8.1
153,151
12.4
65.9
3.9
14.7
23,594
15.4
5,384
203
7,608
21,167
26.3
15,602
21.5
1Q
348,443
2.1
428,202
9.3
149,204
11.5
67.9
3.9
13.4
22,157
14.9
4,833
181
6,389
20,420
27.2
14,862
23.0
FY17E
2Q
3Q
418,470 387,251
18.4
3.5
426,382 435,500
8.8
8.5
178,428 168,648
28.8
12.3
67.7
69.2
2.9
3.7
12.4
12.4
30,374
24,890
17.0
14.8
8,126
5,919
197
290
6,300
6,349
32,003
24,170
25.1
27.8
23,980
17,445
60.2
47.5
(INR Million)
FY16
FY17E
4QE
414,439 1,429,200 1,568,603
15.0
10.6
9.8
449,769 403,394 435,217
5.8
4.3
7.9
186,402 576,530 682,682
21.7
15.4
18.4
68.8
67.4
68.4
3.7
3.4
3.5
12.9
13.8
12.7
27,209
88,962 104,630
14.6
15.4
15.3
5,080
14,610
23,958
207
815
875
6,929
28,239
25,967
23,669
74,518 100,262
27.5
28.0
26.8
18,231
53,654
74,529
16.8
44.6
38.9
Total Volumes (nos)
Change (%)
Realizations (INR/car)
Change (%)
Net operating revenues
Change (%)
RM Cost (% of sales)
Staff Cost (% of sales)
Other Cost (% of sales)
EBITDA
EBITDA Margins (%)
Non-Operating Income
Interest
Depreciation
PBT
Effective Tax Rate (%)
Adjusted PAT
Change (%)
E:MOSL Estimates
27 April 2017
12

March 2017 Results Preview | Sector: Financials
Shriram Transport Fin.
Bloomberg
Equity Shares (m)
M. Cap. (INR b)/(USD b)
52-Week Range (INR)
1,6,12 Rel Perf. (%)
SHTF IN
226.9
251 / 4
1325 / 778
17 / -16 / -1
CMP: INR1,108 TP: INR1,289 (+16%)
Buy
Financial Snapshot (INR b)
Y/E March
Net Inc.
PPP
PAT
Cons.PAT
EPS (INR)
Cons. EPS (INR)
BV/Sh (INR)
Cons. BV (INR)
RoA on AUM (%)
RoE (%)
Payout (%)
Valuations
P/Cons. EPS (x)
P/Cons. BV (x)
Div. Yield (%)
2016 2017E 2018E 2019E
50.7 54.8 62.8 69.7
38.4 42.8 49.2 54.3
11.8 12.5 18.3 22.4
12.1 12.5 18.6 22.8
51.9 55.1 80.8 98.8
53.3 55.3 81.9 100.5
447 491 554 632.0
450 493 558 637.1
2.1
2.0
2.7
3.0
12.2 11.7 15.5 16.7
22.3 21.2 21.2 21.2
20.8
2.5
0.9
20.0
2.2
0.9
13.5
2.0
1.3
11.0
1.7
1.6
n
SHTF’s AUM is expected to continue to slow down to 11% YoY and
6% QoQ, driven by 21% YoY decline in disbursements (4QFY16
was a high base).
n
Calculated margins on AUMs would decline QoQ, given higher
share of newer vehicles and impact of interest reversals. As a
result, we expect 5% YoY decline in NII.
n
GNPLs would increase from 7.3% in 3Q (excluding RBI
dispensation) to 8.3% in 4Q. Consequently, PCR is expected to
drop from 75% to 61% in 4QFY17.
n
We factor in provisions of INR8.2b, as against INR6.1b in 3QFY17.
n
The stock trades at 2x FY18E and 1.7x FY19E consolidated BV.
Maintain
Buy.
Key issues to watch for
Ø
Business growth and momentum, and management
commentary on the same.
Ø
Movement in borrowing costs and margins.
Ø
Asset quality trends, given impact of demonetization.
Ø
Recoveries in equipment financing portfolio.
SHTF: Quaterly Performance
Y/E March
FY16
FY17
1Q
2Q
3Q
4Q
1Q
2Q
3Q
Interest Income
22,015 22,402 23,677 27,207 24,764 24,626 24,438
Interest expenses
11,972 12,059 12,239 14,474 13,165 13,358 12,825
Net Interest Income
10,043 10,343 11,438 12,733 11,598 11,268 11,613
YoY Growth (%)
39.3
31.3
24.5
34.3
15.5
8.9
1.5
Securitisation income
1,313
1,586
1,768
1,705
1,876
2,262
2,508
Net Income (Incl. Securitization)
11,356 11,929 13,205 14,438 13,474 13,530 14,121
YoY Growth (%)
17.4
18.4
25.4
33.0
18.6
13.4
6.9
Fees and Other Income
162
211
191
197
167
169
183
Net Operating Income
11,519 12,140 13,396 14,635 13,641 13,699 14,304
YoY Growth (%)
16.2
18.6
25.5
32.9
18.4
12.8
6.8
Operating Expenses
2,905
3,001
3,287
3,896
3,341
3,138
2,905
Operating Profit
8,613
9,139 10,110 10,739 10,300 10,561 11,398
YoY Growth (%)
16.4
19.3
26.8
33.9
19.6
15.6
12.7
Provisions
3,823
3,997
4,400
8,567
4,603
4,621
6,105
Profit before Tax
4,790
5,142
5,710
2,172
5,697
5,940
5,293
Tax Provisions
1,579
1,761
1,959
733
1,956
2,063
1,834
Net Profit
3,211
3,381
3,751
1,439
3,741
3,877
3,460
YoY Growth (%)
4.8
11.9
20.1
-54.6
16.5
14.7
-7.8
AUM Growth (%)
11.3
13.8
16.6
23.1
23.6
19.1
14.6
Securitization Inc. / Net Inc. (%)
11.4
13.1
13.2
11.7
13.7
16.5
17.5
Cost to Income Ratio (%)
25.2
24.7
24.5
26.6
24.5
22.9
20.3
Tax Rate (%)
33.0
34.3
34.3
33.7
34.3
34.7
34.6
E: MOSL Estimates; * Quarterly nos and full year nos will not tally due to different way of reporting financial nos
(INR Million)
FY16
FY17
4QE
24,308
13,334
10,974
-13.8
2,717
13,691
-5.2
175
13,866
-5.3
3,241
10,625
-1.1
8,363
2,263
791
1,471
2.2
11.0
19.6
23.4
35.0
95,300
50,744
44,556
32.0
6,171
50,727
23.3
762
51,489
23.1
13,089
38,400
23.7
20,586
17,814
6,032
11,782
-4.8
23.1
12.0
25.4
33.9
98,136
52,683
45,453
2.0
9,362
54,816
8.1
647
55,463
7.7
12,625
42,838
11.6
23,692
19,146
6,644
12,502
6.1
11.0
16.9
22.8
34.7
27 April 2017
13

March 2017 Results Preview | Sector: Automobiles
TVS Motor Company
Bloomberg
Equity Shares (m)
M. Cap. (INR b)/(USD b)
52-Week Range (INR)
1,6,12 Rel Perf. (%)
TVSL IN
475.1
214 / 3
453 / 278
1 / 12 / 23
CMP: INR450
TP:INR500 (+11%)
Buy
Financial Snapshot (INR b)
Y/E March
2016 2017E 2018E 2019E
Sales
EBITDA
Adj. PAT
EPS (INR)
EPS Gr. (%)
BV/Sh (INR)
RoE (%)
RoCE (%)
Payout (%)
Valuations
P/E (x)
P/BV (x)
EV/EBITDA (x)
Div. Yield (%)
51.5
11.5
30.6
0.6
41.8
9.6
25.3
0.6
30.9
7.8
19.3
0.6
21.7
6.1
13.7
0.9
112.4
7.5
4.3
9.1
24.2
40.8
24.1
23.3
33.7
121.2
8.9
5.3
11.2
23.4
48.7
25.1
25.9
29.5
142.0
11.4
7.2
15.2
35.0
60.2
27.8
30.3
23.8
164.6
15.6
10.2
21.6
42.2
77.0
31.4
35.6
22.3
n
Total volume growth moderated to 2.2% YoY (-6% QoQ) to
674,921 units led by increase in Scooter and Moped volume
partially offset by decline in Motorcycle volumes post
demonetization.
n
Moped and scooter volume increased by 14% YoY (-5% QoQ) and
13% YoY (+1% QoQ), respectively, while motorcycle volume
decline 13% YoY (-13% QoQ) led by benign rural growth.
n
Net realization is likely to decline ~2% YoY (+1% QoQ) to
INR41,972 per unit as share of motorcycle decreased. As a result,
net sales would grow marginally by ~1% YoY to ~INR28.3b.
n
Margin should expand 40bp YoY (-60bp QoQ) to 6.7%, driven by
benefit of operating leverage and better product mix YoY. Also
price increase to offset commodity inflation.
n
We expect PAT to decline ~14% YoY (-23% QoQ) to INR1b led by
higher depreciation by 41% YoY and higher tax rate.
n
We are increasing multiple from 18x to 20x.
n
The stock trades at 29.7x FY18E and 20.9x FY19E EPS;
Buy.
Key issues to watch
Ø
Launch of product with BMW tie up
Ø
EBITDA margin target of double digits by FY18
S/A Quarterly Performance
Y/E March (INR m)
Volumes (units)
Growth (%)
Realization (INR/unit)
Growth (%)
Net Sales
Growth (%)
RM (% of sales)
Emp cost ( % of sales)
Other exp (% of sales)
EBITDA
EBITDA Margin(%)
Interest
Depreciation
Other Income
PBT after EO Exp
Tax rate (%)
Adjusted PAT
Growth (%)
1Q
638,033
9.2
40,344
2.2
25,741
11.7
73.0
6.0
14.2
1,728
6.7
130
504
210
1304
23.2
1,001
38.4
FY16
FY17
2Q
3Q
4Q
1Q
2Q
3Q
4QE
FY16
FY17E
678,749 702,044 660,540 717,964 815,562 718,562 674,921 2,678,338 2,927,009
0.4
7.1
9.6
12.5
20.2
2.4
2.2
6.3
9.3
41,803 41,250 42,622 40,127 42,014 41,519 41,972
41,981
41,420
5.3
1.9
4.6
(0.5)
0.5
0.7
(1.5)
5.3
(1.3)
28,374 28,959 28,154 28,809 34,265 29,834 28,328
112,439
121,236
5.8
9.2
14.6
11.9
20.8
3.0
0.6
12.0
7.8
72.1
72.3
70.2
72.6
72.3
72.0
71.2
71.4
72.1
5.7
6.1
5.8
6.3
5.8
6.4
6.8
5.9
6.3
14.2
14.4
17.6
14.2
13.8
14.2
15.3
16.0
14.4
2,270
2,102
1,785
2,004
2,767
2,185
1,895
7,507
8,850
8.0
7.3
6.3
7.0
8.1
7.3
6.7
6.7
7.3
115
98
131
98
94
115
106
462
414
565
621
518
660
724
720
729
1,898
2,833
195
248
243
362
392
348
309
513
1,411
1785
1631
1380
1608
2340
1698
1368
5,660
7015
25.5
26.3
14.7
24.6
24.2
21.9
25.6
23.6
24.0
1,330
1,202
1,178
1,213
1,774
1,327
1,018
4,321
5,331
40.2
33.3
30.1
21.2
33.4
10.4
(13.5)
24.2
23.4
27 April 2017
14

In conversation
1. PVR Cinemas: Expect 8-10% growth in ad revenues going
ahead; Gautam Dutta, CEO
n
n
n
n
Have signed a deal with IMAX for five additional screens. The total cost will be
about Rs 50-55 crore which is close to about Rs 10-10.5 crore per screen.
Out of the five, two screens are being planned to be fitted into cinemas, which
are ready. So the revenue should start trickling-in in about four months' time.
Remaining three screens are planned for new sites of the company in Chennai,
Hyderabad and Delhi. The revenue for these three screens will be garnered by
the year end.
The company has a huge headroom to grow the ad revenues as it will be
utilising 9 minutes per screen per show.
2. HDFC Bank: The best is yet to come in terms of loan growth;
Aditya Puri, MD
n
n
n
n
The bank is in a sweet spot to take benefit of the uptick in the economy because
the bank does not have an non-performing asset (NPA) issue, it is well
capitalized, it has the largest distribution network and is a major in digital
banking.
Don’t think the quarter 4 numbers are stellar, the best is yet to come.
The rural economy is picking up as the government spends more and more
money there. The harvests have been good and if we get a good monsoon, that
would be a roaring area for us which is doing very well.
The low cost deposits have increased from Rs 2.87 lakh crore to Rs 3.09 lakh
crore in 90 days, it is remaining at that level. Do not expect to see any more
withdrawl.
3. Persistent Systems: Expect double-digit revenue growth in
FY18; Anand Deshpande, Founder, MD & CEO
n
n
n
n
Great quarter from the perspective of asset quality as well as collection
efficiency. Collection efficiency stood at 107% in the previous quarter.
Saw disbursement growing at 23% in the quarter, and at 18-19% YoY. AUM
growth stood at 14% over a large base.
Average monsoon coupled with increased spending on infrastructure in the
major states would improve the rural cashflows, which would augur well for the
company.
Have taken 90-day dispensation benefit taken in the past quarter. Out of the
32k customers, 24k have been fully resolved, 4k have been partially resolved
and the rest 4k have been defaults.
27 April 2017
15

From the think tank
1. The Indian Economy is in a sweet spot. by Radhika Rao
n
India’s real GDP growth accelerated from 5.7 per cent y-o-y in FY13 to 7.9 per
cent last year. The economy hit a road bump in FY17 as growth slowed to 7.2
per cent y-o-y in the first three quarters. Fortunately, this will be temporary.
Growth will pick up again to 7.6 per cent this year through an improvement in
consumption, timely rains, higher public sector spending, and better export
growth. Investment growth will however continue to trail because of ongoing
deleveraging in the corporate sector and stressed banks’ balance sheets.
2. The stent fiasco. by PT Jyothi Datta
n
It is alarming and a tad worrying when a couple of top stent makers decide to
withdraw some products from the country — a move, they say, is in response to
the Government’s price control efforts. A stand-off between the Government
and industry is not without precedent; price control on medicines is an example.
But medical devices have come into the Government’s price net for the first
time. And here it would be advisable to learn from the challenges with price
control on medicines rather than tread a similar collision course. Caught in the
crossfire between two power centres, Government and industry, are hapless
patients.
3. The changing face of the urban leisure economy. by Livemint
n
Last week, Uttar Pradesh chief minister Yogi Adityanath recommended that
single-screen-theatre owners who are shutting shop be encouraged to refurbish
their movie halls as miniplexes instead. It is, in the larger scheme of things, a
minor matter for a state’s chief executive. But the changing nature of movie-
going in India also reflects upon urbanization and migration, and the dynamics
of growth and equality. The Indian cinema hall was once a great leveller,
bringing patrons from all socio-economic classes under one roof to engage in a
common activity.
4. Still a mental fiscal exercise. by Swaminathan S Anklesaria
Aiyar
n
The N K Singh Committee has suggested a new Fiscal Responsibility and Budget
Management (FRBM) Act to replace the old one. It has many eminently sensible
proposals. Its most obvious shortcoming is that its recommendations have no
teeth, and rely on good sense and fiscal rules that can easily be broken -as often
happened in the past. This asks a lot of Indian politicians who love spending
sprees. FRBM-1called for the Centre's fiscal deficit to be cut to 3% by 2008. That
target is finally going to be achieved a good 10 years later.
27 April 2017
16

International
5. The creeping influence of nepotism in Trump’s America. by
Edward Luce
n
What exactly is the role of a first daughter? That question in Berlin this week
had Ivanka Trump fumbling for a reply. Without having ever won a vote, Donald
Trump’s elder daughter is now among the world’s most influential people. Her
husband, Jared Kushner, is the Trump administration’s plenipotentiary by virtue
of his marriage. Both appear to be nice people: friends describe them as
“normal”. But their ascent to the pinnacle of US power has no parallel in
modern western democracy. The Germans are not alone in wondering what to
make of it.
27 April 2017
17

Click excel icon
for detailed
valuation guide
CMP
(INR)
884
88
2,888
1,117
22,617
1,548
26,027
818
549
230
3,310
1,351
221
6,407
451
502
TP
% Upside
EPS (INR)
(INR) Downside FY17E FY18E FY19E
1,084
98
3,282
1,266
22,924
1,406
28,811
841
608
270
3,390
1,573
-
7,299
609
500
23
12
14
13
1
-9
11
3
11
17
2
16
14
35
0
29.3
4.2
133.7
25.3
472.3
89.9
615.4
22.3
23.2
8.4
172.2
61.7
5.4
253.2
11.5
11.2
37.3
43.4
5.2
6.6
154.8 174.0
37.2
50.6
667.8 764.1
107.6 140.6
854.5 1,047.6
29.4
37.4
34.1
43.4
9.8
11.9
185.1 188.3
75.4
89.5
9.9
11.8
307.6 374.1
29.4
62.0
15.2
21.6
Valuation snapshot
P/E (x)
P/B (x)
ROE (%)
FY17E FY18E FY17E FY18E FY17E FY18E FY19E
30.2
20.7
21.6
44.2
47.9
17.2
42.3
36.8
23.7
27.4
19.2
21.9
41.3
25.3
39.1
44.8
28.4
37.5
26.2
29.4
21.4
27.3
16.0
20.8
29.2
NM
34.3
43.2
8.7
21.6
26.3
24.1
NM
13.1
48.7
10.5
637.3
31.5
33.0
19.1
29.7
38.1
17.7
14.6
47.2
33.9
14.6
17.7
11.7
46.7
13.1
23.7
17.0
18.7
30.0
33.9
14.4
30.5
27.8
16.1
23.5
17.9
17.9
22.5
20.8
15.3
33.1
20.3
21.7
20.8
27.0
18.0
23.1
15.5
16.0
24.7
6.0
27.9
29.7
7.8
17.1
20.9
9.6
11.3
9.2
11.6
9.2
7.6
13.4
16.9
5.3
12.8
27.6
18.5
11.7
37.4
30.6
12.3
14.8
8.6
25.5
11.3
6.0
4.0
6.0
6.6
9.1
2.6
14.9
6.6
2.7
4.0
7.0
3.3
2.6
5.9
1.8
10.3
4.2
2.2
2.7
2.5
1.9
4.4
1.9
1.4
4.4
0.7
4.3
4.8
0.8
3.3
3.0
1.2
0.7
0.7
0.7
1.0
0.4
0.9
1.3
0.5
1.0
7.9
4.0
1.7
12.6
6.3
3.5
3.2
2.7
2.9
2.4
4.9
3.6
5.3
5.7
7.6
2.3
10.7
5.5
2.4
3.5
6.0
3.0
2.3
4.9
1.6
8.3
3.6
2.1
2.4
2.3
1.7
4.0
1.8
1.3
3.8
0.7
3.8
4.2
0.8
2.9
2.8
1.1
0.7
0.6
0.7
0.9
0.4
0.9
1.2
0.5
0.9
6.3
3.3
1.6
10.5
5.7
3.1
2.7
2.4
2.7
2.1
21.7
20.6
29.5
15.7
18.2
16.4
40.7
19.6
12.1
14.5
39.5
14.5
6.4
22.4
4.7
25.1
14.7
6.2
10.9
10.7
9.0
17.9
10.5
7.1
16.0
-21.1
13.5
12.9
9.7
18.6
11.5
5.0
-2.5
5.2
1.4
10.1
0.1
3.0
3.9
2.8
3.2
22.7
29.6
14.4
30.4
19.1
25.5
19.4
23.9
6.4
19.7
22.9
22.3
30.2
20.5
24.5
16.9
40.9
21.6
15.9
15.0
36.2
13.9
10.8
23.0
11.2
27.8
18.0
9.9
12.4
8.9
10.0
18.2
9.8
8.7
16.5
11.6
14.5
15.2
10.0
18.0
13.3
11.9
6.0
7.0
5.8
10.6
5.2
6.7
7.3
9.7
7.1
25.5
19.3
13.9
30.6
18.1
27.0
19.7
29.0
10.9
20.2
22.0
24.9
30.0
23.7
23.4
18.9
36.7
22.9
17.5
16.0
31.9
14.7
11.5
23.1
20.4
31.4
21.2
15.7
14.0
9.6
11.7
19.0
10.5
10.1
17.3
12.5
16.0
17.4
11.3
19.7
14.8
14.8
9.2
10.5
7.3
11.1
6.1
8.3
9.3
13.0
9.2
27.3
20.4
14.5
30.9
17.1
29.6
20.1
32.2
12.9
20.6
Company
Reco
Automobiles
Amara Raja
Buy
Ashok Ley.
Buy
Bajaj Auto
Buy
Bharat Forge
Buy
Bosch
Neutral
CEAT
Buy
Eicher Mot.
Buy
Endurance Tech. Buy
Escorts
Buy
Exide Ind
Buy
Hero Moto
Neutral
M&M
Buy
Mahindra CIE Not Rated
Maruti Suzuki Buy
Tata Motors
Buy
TVS Motor
Buy
Aggregate
Banks - Private
Axis Bank
Neutral
DCB Bank
Neutral
Equitas Hold. Buy
Federal Bank
Buy
HDFC Bank
Buy
ICICI Bank
Buy
IDFC Bank
Neutral
IndusInd
Buy
J&K Bank
Neutral
Kotak Mah. Bk Buy
RBL Bank
Under Review
South Indian
Neutral
Yes Bank
Buy
Aggregate
Banks - PSU
BOB
Buy
BOI
Neutral
Canara
Neutral
IDBI Bk
Neutral
Indian Bk
Buy
OBC
Neutral
PNB
Buy
SBI
Buy
Union Bk
Neutral
Aggregate
NBFCs
Bajaj Fin.
Buy
Bharat Fin.
Neutral
Dewan Hsg.
Buy
GRUH Fin.
Neutral
HDFC
Buy
Indiabulls Hsg Buy
LIC Hsg Fin
Buy
Manappuram Not Rated
M&M Fin.
Buy
Muthoot Fin
Buy
517
183
167
94
1,547
277
61
1,466
78
900
550
24
1,580
510
170
220
108
1,790
350
63
1,700
75
1,017
-
21
2,110
-1
-7
32
14
16
26
3
16
-4
13
-13
34
13.8
7.0
5.7
4.4
56.8
17.3
3.0
50.1
-25.2
26.3
12.7
2.8
73.2
23.9
8.8
6.2
5.2
67.1
17.8
3.8
59.4
13.0
32.3
18.5
3.1
92.2
42.2
11.2
7.4
6.7
79.4
20.5
4.8
72.0
15.4
41.6
24.3
3.8
116.2
182
163
330
75
307
160
166
286
161
224
129
310
49
360
138
186
340
174
23
-21
-6
-34
17
-14
12
19
8
7.5
-5.7
25.2
1.5
29.3
0.3
5.3
8.7
8.5
19.0
14.5
35.9
6.4
33.3
21.0
12.4
16.9
30.5
26.1
23.7
57.6
8.6
38.1
26.0
16.6
23.3
45.3
1,312
792
431
384
1,585
1,011
676
96
331
389
1,448
859
500
421
1,752
1,227
723
-
400
465
10
9
16
10
11
21
7
21
19
34.4
44.6
29.6
8.1
46.7
69.0
38.2
8.2
7.1
29.7
47.5
42.8
36.7
10.3
51.7
82.2
45.6
11.1
12.9
34.5
64.0
55.1
42.7
12.5
57.3
101.6
54.6
14.0
16.4
40.0
27 April 2017
18

Click excel icon
for detailed
valuation guide
CMP
(INR)
158
766
205
2,221
1,053
TP
% Upside
EPS (INR)
(INR) Downside FY17E FY18E FY19E
117
-26
25.7
27.2
30.2
831
9
28.6
34.0
40.2
134
-35
31.4
35.0
40.4
2,689
1,289
21
22
91.8
55.3
134.5
81.9
164.6
100.5
Valuation snapshot
P/E (x)
P/B (x)
ROE (%)
FY17E FY18E FY17E FY18E FY17E FY18E
6.1
5.8
1.1
0.9
17.9
17.0
26.8
22.5
4.3
3.6
17.3
17.5
6.5
5.9
1.2
1.0
19.9
19.1
24.2
19.1
18.2
77.4
27.8
31.8
47.9
48.3
21.5
38.0
56.8
54.3
11.1
20.8
32.7
24.9
78.5
42.4
32.9
43.7
25.4
30.3
36.2
50.4
47.5
35.6
68.9
17.0
40.2
29.2
80.0
25.0
NM
NM
52.9
44.0
37.9
53.9
49.4
47.9
40.3
42.0
46.5
33.8
48.8
34.7
51.6
53.1
16.5
12.9
15.6
54.6
24.6
30.8
33.3
40.4
20.1
33.2
31.0
40.2
11.7
17.9
27.5
19.3
51.9
36.1
23.6
36.2
19.5
27.6
30.5
36.7
32.6
18.6
44.5
13.5
23.5
25.5
38.7
23.1
49.9
43.2
40.0
34.9
28.4
48.9
42.7
40.2
35.6
34.4
40.2
30.1
43.7
31.1
45.8
46.0
2.9
2.1
3.2
9.2
5.3
1.3
9.1
36.6
1.1
8.1
6.8
11.0
2.0
3.2
3.4
2.1
7.2
7.3
-1.9
4.9
3.5
5.0
4.1
2.5
3.6
2.1
4.6
1.9
1.7
3.7
4.1
4.5
3.4
6.0
9.6
5.0
3.7
16.6
18.9
25.0
10.5
12.4
9.7
7.7
33.6
9.2
8.2
15.9
2.6
1.9
2.8
7.9
4.6
1.2
7.9
24.9
1.1
7.4
6.1
9.9
1.7
2.8
3.1
1.9
6.2
6.3
-2.1
4.5
3.1
4.4
3.7
2.4
3.6
2.0
4.2
1.7
1.6
3.3
4.0
3.9
3.2
5.4
7.9
4.5
3.4
14.6
15.0
23.4
9.0
10.5
8.3
6.8
35.0
8.1
7.5
13.8
12.7
11.7
17.5
11.9
20.4
4.0
20.2
94.3
5.4
22.6
11.7
20.3
19.2
16.6
10.9
8.6
9.2
18.4
NM
11.6
8.9
17.6
11.2
5.0
7.5
6.0
6.8
11.7
4.0
13.3
5.2
19.6
-3.7
-3.1
19.2
12.0
9.8
32.8
43.1
54.9
28.3
33.8
22.5
24.6
67.6
28.4
16.4
33.3
16.5
15.5
18.0
14.4
18.8
4.0
25.3
73.3
5.5
23.2
20.7
24.6
15.7
16.8
11.9
10.0
11.9
18.6
-8.8
12.9
16.7
17.1
12.1
6.8
11.0
10.9
9.8
13.2
6.2
13.6
10.5
18.0
6.6
13.1
21.7
13.6
11.9
31.8
39.2
60.1
27.2
33.0
22.2
24.0
78.4
27.6
17.1
32.1
FY19E
16.8
17.6
19.1
17.5
16.7
18.1
15.9
19.1
4.0
31.2
66.1
6.0
25.3
19.2
25.1
14.6
16.2
12.7
11.8
14.2
19.0
-11.0
13.2
17.3
17.1
12.8
7.1
14.2
13.2
12.9
14.8
7.7
16.0
14.7
18.5
11.3
20.8
23.5
15.7
13.8
32.4
38.0
68.5
27.1
33.2
21.9
23.1
92.5
28.7
18.1
34.6
Company
Reco
PFC
Neutral
Repco Home
Buy
REC
Neutral
Shriram
City
Buy
Union
STF
Buy
Aggregate
Capital Goods
ABB
Neutral
Bharat Elec.
Buy
BHEL
Sell
Blue Star
Neutral
CG Cons. Elec. Buy
CG Power &
Sell
Indu.
Cummins
Neutral
GE T&D
Neutral
Havells
Neutral
Inox Wind
Neutral
K E C Intl
Buy
L&T
Buy
Pennar Eng.
Not Rated
Siemens
Neutral
Solar Ind
Neutral
Suzlon Energy Not Rated
Thermax
Sell
Va Tech Wab. Buy
Voltas
Sell
Aggregate
Cement
Ambuja Cem. Buy
ACC
Neutral
Birla Corp.
Buy
Dalmia Bharat Buy
Grasim Inds.
Neutral
India Cem
Neutral
J K Cements
Buy
JK Lakshmi Ce Buy
Ramco Cem
Buy
Orient Cem
Buy
Prism Cem
Buy
Shree Cem
Buy
Ultratech
Buy
Aggregate
Consumer
Asian Paints
Neutral
Britannia
Buy
Colgate
Buy
Dabur
Neutral
Emami
Buy
Godrej Cons.
Neutral
GSK Cons.
Neutral
HUL
Neutral
ITC
Buy
Jyothy Lab
Neutral
Marico
Buy
1,425
180
176
676
220
78
1,011
342
485
195
219
1,751
144
1,335
806
21
1,028
673
412
1,190
180
115
680
221
45
990
340
425
175
175
1,750
-
1,340
800
-
781
760
370
-16
0
-35
1
0
-42
-2
0
-12
-10
-20
0
0
-1
-24
13
-10
18.4
6.5
5.5
14.1
4.6
3.6
26.6
6.0
8.9
17.5
10.5
53.6
5.8
17.0
19.0
0.6
23.5
26.5
13.6
26.1
7.3
5.7
20.3
5.5
3.9
30.5
11.0
12.1
16.6
12.3
63.6
7.5
25.7
22.3
0.9
28.4
34.5
14.9
32.6
8.5
5.8
29.5
6.7
4.5
36.5
11.4
14.1
17.7
13.5
74.4
10.0
33.5
26.5
1.0
31.5
40.3
16.9
246
1,603
767
2,112
1,167
205
951
474
696
158
114
19,219
4,233
277
1,521
869
2,392
1,067
152
1,103
526
815
167
118
20,072
4,928
12
-5
13
13
-9
-26
16
11
17
6
4
4
16
4.9
33.7
21.5
30.7
68.7
5.1
32.6
5.9
27.8
-1.8
-0.6
363.2
96.1
6.7
49.2
41.2
47.5
86.6
8.7
37.2
12.2
30.1
3.2
2.6
480.6
121.4
7.2
63.6
54.4
70.1
111.1
11.9
49.3
17.8
36.2
5.8
4.8
642.3
159.1
1,105
3,562
1,037
294
1,028
1,725
5,210
941
291
411
323
1,145
4,065
1,200
310
1,295
1,740
5,410
945
320
380
340
4
14
16
5
26
1
4
0
10
-8
5
20.5
72.2
21.7
7.3
24.5
37.1
153.9
19.3
8.4
8.0
6.1
22.6
83.3
25.8
8.3
29.8
42.9
173.1
21.5
9.3
9.0
7.0
26.7
101.7
31.6
9.7
36.0
49.8
190.8
24.8
11.0
10.5
8.4
27 April 2017
19

Click excel icon
for detailed
valuation guide
CMP
(INR)
6,427
14,234
247
727
7,425
762
1,892
TP
% Upside
(INR) Downside
6,665
4
17,480
23
250
1
740
2
8,790
18
1,030
35
2,025
7
EPS (INR)
FY18E FY19E
139.2 163.3
305.1 388.4
6.9
12.5
18.3
20.5
167.7 198.8
14.3
18.4
42.2
58.7
Valuation snapshot
P/E (x)
P/B (x)
ROE (%)
FY17E FY18E FY17E FY18E FY17E FY18E
54.5
46.2
20.6
17.8
39.0
41.4
60.4
46.7
24.9
19.7
41.3
42.2
304.8 35.6
3.0
2.8
1.3
8.2
43.8
39.8
11.3
9.2
27.9
25.4
51.0
44.3
13.8
11.9
29.0
28.8
71.4
53.2
8.5
7.5
12.6
15.0
66.1
44.9
12.5
9.9
20.8
22.1
42.9
37.6
12.7
11.1
29.6
29.5
28.8
24.8
29.3
15.6
35.0
37.8
31.1
15.0
34.3
92.0
22.0
21.9
73.9
38.3
22.3
32.1
23.7
41.3
25.3
26.1
21.1
47.6
40.8
32.2
16.4
14.0
34.6
66.2
18.5
NM
11.5
10.2
18.0
76.5
NM
36.8
46.4
40.5
11.6
13.9
NM
14.7
21.9
22.9
25.7
13.3
33.1
25.7
25.3
19.6
23.5
73.3
18.1
19.3
45.9
21.7
17.5
26.2
19.7
33.3
18.7
21.3
17.5
37.5
30.4
17.1
8.7
11.3
25.3
35.8
16.5
43.0
10.6
10.1
15.8
44.5
NM
31.1
30.5
29.4
8.7
12.7
NM
10.9
6.2
5.5
9.1
3.9
5.0
7.6
3.4
3.6
3.2
2.4
4.4
3.5
16.5
3.1
4.6
5.2
4.5
8.3
6.0
4.6
2.7
21.1
3.5
2.3
2.2
2.2
3.8
19.0
4.6
1.1
1.9
0.8
3.5
7.8
4.3
9.3
10.3
6.6
1.7
3.8
0.3
2.2
5.1
4.6
7.0
3.1
4.5
6.2
3.1
3.3
2.9
2.1
3.4
2.6
19.7
2.8
3.8
4.7
3.8
6.8
5.0
3.9
2.4
16.1
3.3
2.1
2.0
1.9
3.5
12.4
4.1
1.0
1.6
0.7
3.0
6.8
3.7
8.5
8.4
5.8
1.4
3.2
0.3
1.9
23.3
24.4
35.9
28.8
14.3
21.4
11.0
25.4
9.8
2.7
20.1
18.8
22.4
8.4
22.8
16.2
19.8
22.2
25.9
17.6
11.5
50.5
8.8
7.2
12.4
16.7
11.0
33.6
26.2
-4.1
18.5
7.7
20.7
10.6
-21.7
25.1
29.1
16.3
15.4
24.4
-7.5
16.2
25.5
22.0
30.9
26.0
13.6
26.5
12.2
17.7
12.9
3.1
19.0
15.8
43.0
13.5
23.8
18.1
20.9
22.5
29.3
18.3
14.8
48.6
11.2
12.9
19.4
17.8
13.7
42.0
26.2
2.5
16.8
7.1
20.6
16.3
0.0
27.3
30.3
19.6
17.5
27.2
-4.5
18.7
FY19E
41.9
43.2
13.2
23.4
29.5
16.8
23.8
30.4
26.0
21.7
29.9
23.9
15.3
27.9
13.8
18.8
15.2
6.1
19.1
18.3
56.9
15.9
22.1
19.4
21.0
20.7
29.6
18.9
14.8
46.8
11.8
15.3
25.4
18.6
14.9
43.9
26.8
8.8
15.8
7.0
20.4
22.0
11.1
29.0
29.4
21.6
16.8
25.4
-0.6
17.9
Company
Nestle
Page Inds
Parag Milk
Pidilite Ind.
P&G Hygiene
United Brew
United Spirits
Aggregate
Healthcare
Alembic Phar
Alkem Lab
Ajanta Pharma
Aurobindo
Biocon
Cadila
Cipla
Divis Lab
Dr Reddy’s
Fortis Health
Glenmark
Granules
GSK Pharma
IPCA Labs
Lupin
Sanofi India
Sun Pharma
Syngene Intl
Torrent Pharma
Aggregate
Logistics
Allcargo
Logistics
Blue Dart
Concor
Gateway
Distriparks
Gati
Transport Corp.
Aggregate
Media
Dish TV
D B Corp
Den Net.
Hind. Media
HT Media
Jagran Prak.
PVR
Siti Net.
Sun TV
Zee Ent.
Aggregate
Metals
Hindalco
Hind. Zinc
JSPL
JSW Steel
Reco
Neutral
Buy
Neutral
Neutral
Buy
Buy
Neutral
FY17E
118.0
235.6
0.8
16.6
145.7
10.7
28.6
Neutral
Neutral
Buy
Buy
Sell
Buy
Neutral
Neutral
Neutral
Buy
Neutral
Buy
Neutral
Neutral
Buy
Buy
Buy
Not Rated
Buy
624
1,965
1,640
625
1,128
453
555
644
2,611
216
893
149
2,551
606
1,371
4,136
643
537
1,430
630
1,850
2,028
915
800
510
550
600
3,050
250
990
160
2,700
540
1,850
5,000
850
-
1,700
1
-6
24
46
-29
12
-1
-7
17
16
11
7
6
-11
35
21
32
19
21.6
79.3
56.0
40.1
32.2
12.0
17.9
43.0
76.1
2.3
40.6
6.8
34.5
15.8
61.4
129.0
27.1
13.0
56.6
28.5
85.7
63.8
47.0
34.1
17.7
22.0
32.9
110.9
2.9
49.2
7.7
55.5
27.9
78.6
157.8
32.5
16.1
76.3
35.8
100.0
79.6
54.6
42.7
23.0
28.5
38.6
147.2
6.5
60.5
11.3
64.4
37.3
88.8
189.9
38.7
18.0
93.4
Buy
Not Rated
Neutral
Buy
Not Rated
Not Rated
191
4,878
1,213
268
137
237
203
-
1,042
314
-
-
6
-14
17
9.0
102.5
29.7
8.3
8.4
16.9
10.9
129.9
39.9
15.7
15.9
21.0
12.3
163.2
44.9
20.1
23.9
25.9
Buy
Buy
Neutral
Buy
Neutral
Buy
Buy
Neutral
Neutral
Buy
96
379
94
290
82
194
1,588
37
924
528
115
450
90
360
90
225
1,667
40
860
610
21
19
-5
24
9
16
5
9
-7
16
1.4
20.4
-3.6
25.2
8.0
10.8
20.8
-1.8
25.1
11.4
2.7
23.0
2.2
27.4
8.2
12.2
35.7
0.0
29.7
17.3
4.3
26.5
8.5
30.3
8.7
13.9
56.8
1.2
34.5
20.6
Buy
Sell
Buy
Buy
197
273
113
199
235
235
181
222
19
-14
60
12
16.9
19.7
-22.3
13.6
22.6
21.5
-17.5
18.3
25.4
23.7
-2.2
20.5
27 April 2017
20

Click excel icon
for detailed
valuation guide
CMP
(INR)
68
129
60
234
454
TP
% Upside
EPS (INR)
(INR) Downside FY17E FY18E FY19E
83
23
3.9
5.3
5.8
178
38
12.1
12.3
13.0
30
-50
-7.4
-12.6
0.4
250
7
17.7
24.7
27.7
440
-3
18.9
39.4
45.7
Valuation snapshot
P/E (x)
P/B (x)
ROE (%)
FY17E FY18E FY17E FY18E FY17E FY18E
17.3
12.6
1.3
1.2
7.5
9.6
10.7
10.5
1.7
1.6
13.4
15.5
NM
NM
0.7
0.8
-8.1
-15.4
13.2
9.5
1.5
1.4
11.4
15.0
24.1
11.5
3.6
2.9
13.6
28.2
18.2
14.2
1.4
1.4
7.9
9.6
13.1
19.1
47.6
21.2
10.0
9.9
24.6
10.3
11.4
14.8
19.3
13.3
13.6
85.2
51.0
54.4
17.4
14.0
16.3
14.5
11.3
13.3
19.2
12.4
12.6
15.4
26.4
17.3
13.2
14.5
12.8
15.8
32.5
23.5
NM
115.7
41.2
16.6
18.3
16.5
13.9
13.5
15.0
13.6
14.3
20.8
17.1
12.0
11.0
24.3
11.0
9.8
11.2
16.2
11.6
12.4
48.3
46.0
46.7
14.1
12.5
14.5
14.1
9.4
12.3
15.7
12.3
9.8
13.2
21.7
16.5
12.0
14.2
10.3
15.1
70.3
21.8
NM
28.0
857.0
13.8
12.4
27.8
11.6
11.6
12.6
3.3
2.1
4.9
2.4
2.7
2.4
5.2
2.7
1.1
1.2
4.3
1.4
1.8
8.6
10.2
10.0
2.8
3.5
4.0
3.0
1.6
5.0
3.1
1.9
1.6
2.4
10.1
5.4
2.4
2.3
2.3
3.7
2.1
3.8
1.2
-71.5
2.4
6.7
2.1
1.2
1.4
2.2
2.4
2.9
1.9
4.1
2.2
2.3
2.1
4.5
2.3
1.0
1.2
3.6
1.3
1.7
9.4
8.9
9.0
2.5
3.4
3.5
2.7
1.4
4.1
2.8
1.8
1.5
2.3
8.1
5.6
2.2
2.1
1.9
3.5
2.0
3.4
1.6
46.1
2.4
6.7
1.8
1.2
1.3
1.9
2.2
27.1
13.0
10.7
12.0
27.8
26.0
22.3
29.6
9.8
8.4
23.9
11.9
13.3
10.1
21.5
18.4
16.2
27.0
26.5
23.3
13.7
41.4
16.8
14.1
13.5
17.0
42.5
33.5
20.1
16.9
19.1
23.5
6.5
15.7
-4.2
-50.2
5.7
40.6
11.1
7.3
10.6
17.3
15.9
22.7
14.0
21.5
13.5
20.7
20.4
19.7
22.7
10.8
11.1
24.0
11.8
13.4
19.5
20.6
19.3
17.6
27.8
25.3
21.4
15.9
36.6
18.9
14.9
15.9
18.1
41.3
32.4
19.5
15.5
20.4
23.1
2.9
15.9
-25.3
924.0
0.3
48.8
15.8
4.3
11.9
17.5
17.4
FY19E
9.9
15.1
0.5
15.6
26.5
12.0
21.4
14.4
22.0
14.5
18.6
18.8
19.2
21.4
11.6
11.7
27.2
11.2
13.2
24.9
20.3
19.7
17.9
28.1
23.5
21.2
14.9
32.1
20.5
14.7
16.0
20.3
40.8
32.3
19.2
15.7
19.7
22.3
5.2
16.7
-37.1
117.3
2.3
53.5
15.2
1.4
13.3
17.7
18.3
Company
Nalco
NMDC
SAIL
Vedanta
Tata Steel
Aggregate
Oil & Gas
BPCL
GAIL
Gujarat Gas
Gujarat St. Pet.
HPCL
IOC
IGL
MRPL
Oil India
ONGC
PLNG
Reliance Ind.
Aggregate
Retail
Jubilant Food
Titan Co.
Aggregate
Technology
Cyient
HCL Tech.
Hexaware
Infosys
KPIT Tech
L&T Infotech
Mindtree
Mphasis
NIIT Tech
Persistent Sys
Tata Elxsi
TCS
Tech Mah
Wipro
Zensar Tech
Aggregate
Telecom
Bharti Airtel
Bharti Infratel
Idea Cellular
Tata Comm
Aggregate
Utiltites
Coal India
CESC
JSW Energy
NTPC
Power Grid
Aggregate
Others
Reco
Buy
Buy
Sell
Neutral
Sell
Buy
Neutral
Sell
Neutral
Buy
Buy
Neutral
Neutral
Buy
Neutral
Buy
Neutral
731
414
831
188
538
433
1,064
126
326
180
430
1,416
763
349
735
162
604
441
1,023
114
382
172
454
1,264
4
-16
-12
-14
12
2
-4
-9
17
-5
6
-11
55.9
21.7
17.5
8.9
53.5
43.7
43.3
12.2
28.6
12.2
22.2
106.6
53.7
28.9
40.0
11.0
44.9
39.4
43.8
11.4
33.1
16.1
26.5
121.7
58.4
32.5
49.0
13.2
45.8
41.0
49.4
12.8
37.8
17.3
36.2
127.8
Neutral
Neutral
1,050
480
1,110
485
6
1
12.3
9.4
21.7
10.4
29.1
11.8
Buy
Buy
Neutral
Buy
Neutral
Buy
Neutral
Neutral
Neutral
Buy
Buy
Neutral
Buy
Neutral
Buy
532
801
223
914
129
714
478
531
457
580
1,567
2,310
428
491
838
620
1,000
235
1,200
150
800
475
550
470
700
1,780
2,400
550
500
1,200
16
25
6
31
16
12
-1
4
3
21
14
4
28
2
43
30.6
57.2
13.7
62.9
11.5
53.6
24.9
42.7
36.2
37.7
59.3
133.4
32.5
33.8
65.3
37.8
64.3
15.4
64.7
13.8
58.0
30.5
43.0
46.8
43.9
72.1
139.7
35.7
34.6
81.4
44.1
70.3
16.7
71.1
15.0
60.8
36.5
44.9
52.9
51.4
89.0
149.6
40.2
38.2
92.0
Buy
Buy
Buy
Buy
358
366
86
717
410
435
120
811
15
19
40
13
11.0
15.5
-3.0
6.2
5.1
16.7
-15.4
25.6
9.4
19.9
-16.9
44.1
Buy
Buy
Buy
Buy
Buy
277
924
64
166
205
335
970
73
199
243
21
5
15
20
18
16.7
50.4
3.9
11.9
15.3
20.1
74.7
2.3
14.3
17.7
22.1
82.2
0.8
17.3
20.7
27 April 2017
21

Click excel icon
for detailed
valuation guide
CMP
(INR)
405
584
437
264
359
169
2,742
305
1,114
195
806
296
113
519
568
517
707
1,218
2,575
171
872
2,448
1,746
320
1,427
6,382
186
390
TP
% Upside
(INR) Downside
430
6
-
532
22
274
4
-
229
35
3,334
22
287
-6
1,092
-2
232
19
1,000
24
230
-22
-
-
649
14
551
7
843
19
1,400
15
2,841
10
210
1,046
2,200
1,825
371
1,288
5,281
140
393
23
20
-10
5
16
-10
-17
-25
1
EPS (INR)
FY18E FY19E
21.8
28.6
14.2
17.7
14.9
15.2
8.6
11.4
19.6
25.1
6.9
7.6
112.9 166.7
13.9
16.9
64.7
78.0
17.5
21.1
17.9
21.0
8.2
11.5
7.6
10.0
18.5
22.1
28.6
36.1
31.0
36.7
23.1
38.3
30.0
42.5
89.3
109.3
8.6
34.8
127.1
99.9
10.3
35.1
137.7
4.6
11.9
10.5
43.6
164.7
125.1
13.3
42.9
176.0
5.4
16.0
Valuation snapshot
P/E (x)
P/B (x)
ROE (%)
FY17E FY18E FY17E FY18E FY17E FY18E
30.0
18.6
2.7
2.5
10.4
14.0
53.7
41.1
5.8
5.3
11.3
13.4
32.0
29.4
33.7
30.3 110.9 108.6
34.2
30.6
9.0
7.4
28.9
26.5
22.5
18.3
3.9
3.5
18.2
20.1
52.0
24.7
4.5
3.4
9.0
15.7
40.6
24.3
5.6
4.6
15.1
20.7
26.7
22.0
8.1
6.5
34.7
33.0
28.6
17.2
19.5
16.6
72.2 104.1
14.2
11.1
4.1
2.9
33.8
30.8
47.8
45.0
5.1
4.8
11.1
10.9
118.4 36.3
4.6
4.1
3.8
11.5
20.4
14.9
1.7
1.7
8.6
11.7
30.2
28.1
4.7
4.1
16.5
15.5
24.2
19.9
4.1
3.8
17.3
19.8
19.9
16.7
5.4
4.3
29.9
28.7
47.4
30.6
3.5
3.2
8.6
9.6
46.3
40.6
4.7
4.5
10.6
11.3
35.3
28.9
10.7
10.0
30.4
35.9
25.7
28.7
32.9
21.2
41.5
52.8
59.7
50.4
55.7
19.9
25.1
19.3
17.5
31.0
40.6
46.3
40.7
32.6
6.5
7.9
3.2
3.3
5.5
28.7
9.5
13.3
5.1
5.5
6.3
2.9
2.9
4.9
24.5
8.6
10.7
4.6
26.0
30.9
10.0
16.5
13.9
56.8
16.5
29.4
9.5
30.0
27.9
15.7
17.4
16.8
65.0
19.4
29.1
14.8
FY19E
16.3
15.0
100.4
28.6
22.7
17.0
24.3
32.4
106.3
27.3
11.9
14.3
14.8
16.2
22.9
27.7
16.3
15.0
39.6
30.9
27.8
18.2
19.1
19.1
66.3
22.2
27.6
17.5
Company
Reco
Arvind
Buy
Bata India
Under Review
Castrol India
Buy
Century Ply.
Buy
Coromandel Intl Under Review
Delta Corp
Buy
Dynamatic Tech Buy
Eveready Inds. Buy
Interglobe
Neutral
Indo Count
Buy
Info Edge
Buy
Inox Leisure
Sell
Jain Irrigation Under Review
Just Dial
Under Review
Kaveri Seed
Buy
Kitex Garm.
Buy
Manpasand
Buy
MCX
Buy
Monsanto
Buy
Navneet
Buy
Education
PI Inds.
Buy
Piramal Enterp. Buy
SRF
Buy
S H Kelkar
Buy
Symphony
Sell
TTK Prestige
Neutral
V-Guard
Neutral
Wonderla
Buy
FY17E
13.5
10.9
13.6
7.7
15.9
3.3
67.6
11.4
39.0
13.7
16.9
2.5
5.5
17.2
23.4
26.0
14.9
26.3
72.9
6.6
30.4
74.5
82.4
7.7
27.0
106.9
3.7
7.0
27 April 2017
22

MOSL Universe stock performance
Company
Automobiles
Amara Raja
Ashok Ley.
Bajaj Auto
Bharat Forge
Bosch
CEAT
Eicher Mot.
Endurance Tech.
Escorts
Exide Ind
Hero Moto
M&M
Mahindra CIE
Maruti Suzuki
Tata Motors
TVS Motor
Banks - Private
Axis Bank
DCB Bank
Equitas Hold.
Federal Bank
HDFC Bank
ICICI Bank
IDFC Bank
IndusInd
J&K Bank
Kotak Mah. Bk
RBL Bank
South Indian
Yes Bank
Banks - PSU
BOB
BOI
Canara
IDBI Bk
Indian Bk
OBC
PNB
SBI
Union Bk
NBFCs
Bajaj Fin.
Bharat Fin.
Dewan Hsg.
GRUH Fin.
HDFC
Indiabulls Hsg
LIC Hsg Fin
Manappuram
M&M Fin.
Muthoot Fin
PFC
Repco Home
REC
STF
Shriram City Union
1 Day (%)
0.6
-0.5
-0.3
-1.6
0.1
6.3
-0.2
-1.8
-0.4
-2.1
0.1
3.3
-1.1
1.0
1.2
2.7
0.4
-0.1
-0.9
0.4
0.7
1.6
3.0
0.9
-1.1
0.2
-3.1
-3.0
1.5
-0.2
2.8
-0.5
0.6
-1.2
2.8
3.2
0.1
-1.0
-2.2
-1.5
0.1
-2.4
2.4
-0.4
0.4
2.2
-2.9
-1.2
-1.9
0.0
-1.0
-3.3
-3.7
1M (%)
0.7
0.4
1.5
10.0
-1.3
17.8
6.8
11.9
4.0
7.2
-2.0
5.9
10.8
6.7
-4.2
17.4
5.7
10.1
5.5
5.2
8.6
0.8
0.4
5.5
4.6
2.5
11.6
18.7
3.4
7.4
22.8
12.4
-1.4
17.0
10.8
17.6
3.7
4.9
11.2
-6.0
19.1
2.3
8.4
5.6
12.7
-1.1
3.1
11.3
8.6
14.3
17.8
2.2
6.2
12M (%)
-7.0
-17.9
13.3
38.2
11.1
35.7
29.1
227.3
56.0
12.9
-0.3
9.4
65.6
7.5
52.3
7.7
89.0
20.7
95.1
39.0
9.0
15.7
43.5
13.3
28.4
46.2
73.6
12.2
67.4
58.5
5.1
206.5
64.7
84.4
42.6
22.8
87.5
35.0
109.5
44.4
40.5
48.6
46.5
138.7
9.2
96.3
73.7
15.5
123.6
6.7
30.3
Company
Capital Goods
ABB
Bharat Elec.
BHEL
Blue Star
CG Cons. Elec.
CG Power & Inds Sol.
Cummins
GE T&D
Havells
Inox Wind
K E C Intl
L&T
Pennar Eng.
Siemens
Solar Ind
Suzlon Energy
Thermax
Va Tech Wab.
Voltas
Cement
Ambuja Cem.
ACC
Birla Corp.
Dalmia Bharat
Grasim Inds.
India Cem
J K Cements
JK Lakshmi Ce
Ramco Cem
Orient Cem
Prism Cem
Shree Cem
Ultratech
Consumer
Asian Paints
Britannia
Colgate
Dabur
Emami
Godrej Cons.
GSK Cons.
HUL
ITC
Jyothy Lab
Marico
Nestle
Page Inds
Parag Milk
Pidilite Ind.
P&G Hygiene
United Brew
United Spirits
Healthcare
Alembic Phar
Alkem Lab
Ajanta Pharma
Aurobindo
1 Day (%)
0.8
-0.4
-1.1
-0.1
-0.4
-1.6
4.3
-0.6
0.0
-1.4
0.2
0.3
0.6
-0.5
-0.9
0.2
-2.6
-3.1
-1.2
0.0
-0.3
-0.4
1.2
-1.1
1.3
-2.7
-2.2
-0.2
-3.7
0.3
0.7
0.0
0.7
2.5
0.0
0.2
0.8
-1.4
-0.3
1.8
3.4
3.4
3.7
1.6
0.6
0.1
0.0
1.1
0.6
-1.7
2.1
-1.0
-0.9
0.1
1M (%)
19.3
15.5
5.2
10.8
11.1
1.4
9.5
9.2
8.7
12.2
4.9
12.9
14.1
7.4
9.2
10.0
13.1
0.5
6.0
7.0
14.9
10.9
11.2
10.0
29.8
7.6
9.5
7.7
23.2
15.6
18.3
6.6
3.7
7.9
5.9
4.5
-0.1
3.6
0.1
4.6
3.4
16.4
10.8
1.4
-2.9
9.9
5.5
6.8
-1.5
-15.0
3.6
-11.2
-10.2
-9.2
12M (%)
10.2
51.0
36.3
55.7
30.6
14.6
-10.0
40.2
-26.6
73.0
36.7
-2.2
13.8
18.5
43.7
33.6
17.0
38.7
9.8
12.4
97.2
144.6
43.1
128.7
54.9
30.1
54.6
2.6
30.0
53.4
29.6
26.0
25.6
22.9
10.4
3.5
27.1
-12.7
6.2
33.0
35.6
27.9
9.9
10.7
20.1
15.4
0.4
-21.4
1.5
61.3
6.4
-19.4
27 April 2017
23

MOSL Universe stock performance
Company
Biocon
Cadila
Cipla
Divis Lab
Dr Reddy’s
Fortis Health
Glenmark
Granules
GSK Pharma
IPCA Labs
Lupin
Sanofi India
Sun Pharma
Syngene Intl
Torrent Pharma
Logistics
Allcargo Logistics
Blue Dart
Concor
Gateway Distriparks
Gati
Transport Corp.
Media
Dish TV
D B Corp
Den Net.
Hind. Media
HT Media
Jagran Prak.
PVR
Siti Net.
Sun TV
Zee Ent.
Metals
Hindalco
Hind. Zinc
JSPL
JSW Steel
Nalco
NMDC
SAIL
Vedanta
Tata Steel
Oil & Gas
BPCL
GAIL
Gujarat Gas
Gujarat St. Pet.
HPCL
IOC
IGL
MRPL
Oil India
ONGC
PLNG
Reliance Ind.
Retail
Jubilant Food
1 Day (%)
-3.3
-0.9
0.4
-0.4
-1.3
-0.2
-0.8
-1.1
-0.6
2.0
-0.4
-2.9
0.0
-1.8
-1.3
6.0
-0.4
-0.2
-1.3
-0.2
0.5
0.2
-1.0
-2.6
-1.0
-1.1
0.1
-0.7
-1.1
-0.4
0.0
2.7
0.1
-0.2
2.3
0.5
-1.1
-0.4
-0.4
0.1
-1.1
0.5
-1.2
-4.1
-4.2
-0.7
0.5
-1.8
-0.6
-0.7
0.2
-1.1
-1.3
1M (%)
-1.3
1.6
-6.4
3.4
-0.5
22.1
0.6
8.6
-7.4
3.3
-7.6
-11.1
-8.6
2.9
1.3
14.7
-3.2
21.1
5.2
-1.8
8.4
-10.7
-0.1
16.6
1.8
0.9
10.8
11.4
-3.4
22.4
1.9
1.3
-15.5
-5.7
6.5
-9.9
-5.5
-3.3
-12.2
-7.9
12.6
8.5
13.1
18.6
3.8
16.2
5.9
23.6
-2.2
-6.1
8.5
10.1
-2.8
12M (%)
99.8
37.8
2.7
-39.2
-16.3
21.0
7.4
12.6
-31.7
22.4
-13.1
-1.6
-21.1
42.0
0.1
21.3
-17.3
11.9
-6.7
14.7
44.0
4.7
15.2
4.4
11.1
-8.1
17.3
94.9
4.1
159.1
27.8
90.9
58.2
52.0
45.7
47.4
31.8
30.5
120.8
26.7
49.8
51.7
58.2
35.0
88.3
99.6
85.9
82.3
36.2
26.2
64.0
39.3
-20.4
Company
Titan Co.
Technology
Cyient
HCL Tech.
Hexaware
Infosys
KPIT Tech
L&T Infotech
Mindtree
Mphasis
NIIT Tech
Persistent Sys
Tata Elxsi
TCS
Tech Mah
Wipro
Zensar Tech
Telecom
Bharti Airtel
Bharti Infratel
Idea Cellular
Tata Comm
Utiltites
Coal India
CESC
JSW Energy
NTPC
Power Grid
Others
Arvind
Bata India
Castrol India
Century Ply.
Coromandel Intl
Delta Corp
Dynamatic Tech
Eveready Inds.
Interglobe
Indo Count
Info Edge
Inox Leisure
Jain Irrigation
Just Dial
Kaveri Seed
Kitex Garm.
Manpasand
MCX
Monsanto
Navneet Educat.
PI Inds.
Piramal Enterp.
SRF
S H Kelkar
Symphony
TTK Prestige
V-Guard
Wonderla
1 Day (%)
-0.7
-0.6
-2.3
-0.8
-1.6
-1.3
-1.0
1.7
-0.2
4.9
2.1
-1.3
0.0
-2.2
-0.8
-8.6
1.1
-2.6
0.5
0.5
-0.5
-0.5
-0.6
-0.1
-1.3
-0.7
0.8
-1.2
-1.1
-2.3
-4.1
-1.7
0.4
0.5
0.3
-0.7
-0.3
-2.6
-0.6
-1.6
-1.0
-0.7
4.6
-0.2
1.2
-0.8
-2.8
0.8
-1.5
-1.7
-2.7
-1.3
-0.7
1M (%)
7.1
12.7
-8.1
0.8
-11.4
-2.1
3.6
1.9
-12.0
8.7
-3.8
4.5
-4.8
-9.8
-4.3
-8.6
5.2
17.8
-5.9
-1.8
-7.1
11.6
2.9
0.9
6.0
3.6
8.3
4.5
6.7
13.3
-4.2
-4.2
22.3
9.2
-4.1
-2.0
18.5
19.1
-9.5
1.4
22.7
-1.5
0.2
3.0
23.1
2.1
31.7
9.6
4.7
-6.0
9.9
10.3
1.9
12M (%)
28.9
16.8
-5.8
-9.2
-25.9
-14.8
-32.4
8.5
-6.3
-20.6
-21.7
-7.1
-10.1
-11.6
-14.3
-0.7
0.5
-30.9
70.5
-4.0
68.9
-6.7
17.9
41.5
42.4
3.4
10.7
43.2
61.9
98.8
23.1
20.5
8.2
-7.0
1.8
38.2
77.4
-39.8
41.1
12.7
30.8
38.2
48.5
91.6
35.2
123.1
29.6
34.8
15.6
40.3
166.0
0.6
27 April 2017
24

THEMATIC/STRATEGY RESEARCH GALLERY

REPORT GALLERY
RECENT INITIATING COVERAGE REPORTS
Rs

DIFFERENTIATED PRODUCT GALLERY

Disclosures
This document has been prepared by Motilal Oswal Securities Limited (hereinafter referred to as Most) to provide information about the company (ies) and/sector(s), if any, covered in the report and may be distributed by it and/or its
affiliated company(ies). This report is for personal information of the selected recipient/s and does not construe to be any investment, legal or taxation advice to you. This research report does not constitute an offer, invitation or
inducement to invest in securities or other investments and Motilal Oswal Securities Limited (hereinafter referred as MOSt) is not soliciting any action based upon it. This report is not for public distribution and has been furnished to
you solely for your general information and should not be reproduced or redistributed to any other person in any form. This report does not constitute a personal recommendation or take into account the particular investment
objectives, financial situations, or needs of individual clients. Before acting on any advice or recommendation in this material, investors should consider whether it is suitable for their particular circumstances and, if necessary, seek
professional advice. The price and value of the investments referred to in this material and the income from them may go down as well as up, and investors may realize losses on any investments. Past performance is not a guide for
future performance, future returns are not guaranteed and a loss of original capital may occur.
MOSt and its affiliates are a full-service, integrated investment banking, investment management, brokerage and financing group. We and our affiliates have investment banking and other business relationships with a some
companies covered by our Research Department. Our research professionals may provide input into our investment banking and other business selection processes. Investors should assume that MOSt and/or its affiliates are
seeking or will seek investment banking or other business from the company or companies that are the subject of this material and that the research professionals who were involved in preparing this material may educate investors
on investments in such business . The research professionals responsible for the preparation of this document may interact with trading desk personnel, sales personnel and other parties for the purpose of gathering, applying and
interpreting information. Our research professionals are paid on twin parameters of performance & profitability of MOSt.
MOSt generally prohibits its analysts, persons reporting to analysts, and members of their households from maintaining a financial interest in the securities or derivatives of any companies that the analysts cover. Additionally, MOSt
generally prohibits its analysts and persons reporting to analysts from serving as an officer, director, or advisory board member of any companies that the analysts cover. Our salespeople, traders, and other professionals or affiliates
may provide oral or written market commentary or trading strategies to our clients that reflect opinions that are contrary to the opinions expressed herein, and our proprietary trading and investing businesses may make investment
decisions that are inconsistent with the recommendations expressed herein. In reviewing these materials, you should be aware that any or all of the foregoingamong other things, may give rise to real or potential conflicts of interest.
MOSt and its affiliated company(ies), their directors and employees and their relatives may; (a) from time to time, have a long or short position in, act as principal in, and buy or sell the securities or derivatives thereof of companies
mentioned herein. (b) be engaged in any other transaction involving such securities and earn brokerage or other compensation or act as a market maker in the financial instruments of the company(ies) discussed herein or act as an
advisor or lender/borrower to such company(ies) or may have any other potential conflict of interests with respect to any recommendation and other related information and opinions.; however the same shall have no bearing
whatsoever on the specific recommendations made by the analyst(s), as the recommendations made by the analyst(s) are completely independent of the views of the affiliates of MOSt even though there might exist an inherent
conflict of interest in some of the stocks mentioned in the research report Reports based on technical and derivative analysis center on studying charts company's price movement, outstanding positions and trading volume, as
opposed to focusing on a company's fundamentals and, as such, may not match with a report on a company's fundamental analysis. In addition MOST has different business segments / Divisions with independent research
separated by Chinese walls catering to different set of customers having various objectives, risk profiles, investment horizon, etc, and therefore may at times have different contrary views on stocks sectors and markets.
Unauthorized disclosure, use, dissemination or copying (either whole or partial) of this information, is prohibited. The person accessing this information specifically agrees to exempt MOSt or any of its affiliates or employees from,
any and all responsibility/liability arising from such misuse and agrees not to hold MOSt or any of its affiliates or employees responsible for any such misuse and further agrees to hold MOSt or any of its affiliates or employees free
and harmless from all losses, costs, damages, expenses that may be suffered by the person accessing this information due to any errors and delays. The information contained herein is based on publicly available data or other
sources believed to be reliable. Any statements contained in this report attributed to a third party represent MOSt’s interpretation of the data, information and/or opinions provided by that third party either publicly or through a
subscription service, and such use and interpretation have not been reviewed by the third party. This Report is not intended to be a complete statement or summary of the securities, markets or developments referred to in the
document. While we would endeavor to update the information herein on reasonable basis, MOSt and/or its affiliates are under no obligation to update the information. Also there may be regulatory, compliance, or other reasons that
may prevent MOSt and/or its affiliates from doing so. MOSt or any of its affiliates or employees shall not be in any way responsible and liable for any loss or damage that may arise to any person from any inadvertent error in the
information contained in this report. MOSt or any of its affiliates or employees do not provide, at any time, any express or implied warranty of any kind, regarding any matter pertaining to this report, including without limitation the
implied warranties of merchantability, fitness for a particular purpose, and non-infringement. The recipients of this report should rely on their own investigations.
This report is intended for distribution to institutional investors. Recipients who are not institutional investors should seek advice of their independent financial advisor prior to taking any investment decision based on this report or for
any necessary explanation of its contents.
Most and it’s associates may have managed or co-managed public offering of securities, may have received compensation for investment banking or merchant banking or brokerage services, may have received any compensation
for products or services other than investment banking or merchant banking or brokerage services from the subject company in the past 12 months.
Most and it’s associates have not received any compensation or other benefits from the subject company or third party in connection with the research report.
Subject Company may have been a client of Most or its associates during twelve months preceding the date of distribution of the research report
MOSt and/or its affiliates and/or employees may have interests/positions, financial or otherwise of over 1 % at the end of the month immediately preceding the date of publication of the research in the securities mentioned in this
report. To enhance transparency, MOSt has incorporated a Disclosure of Interest Statement in this document. This should, however, not be treated as endorsement of the views expressed in the report.
Motilal Oswal Securities Limited is registered as a Research Analyst under SEBI (Research Analyst) Regulations, 2014. SEBI Reg. No. INH000000412
Pending Regulatory inspections against Motilal Oswal Securities Limited:
SEBI pursuant to a complaint from client Shri C.R. Mohanraj alleging unauthorized trading, issued a letter dated 29th April 2014 to MOSL notifying appointment of an Adjudicating Officer as per SEBI regulations to hold inquiry and
adjudge violation of SEBI Regulations; MOSL replied to the Show Cause Notice whereby SEBI granted us an opportunity of Inspection of Documents. Since all the documents requested by us were not covered we have requested to
SEBI vide our letter dated June 23, 2015 to provide pending list of documents for inspection.
List of associate companies of Motilal Oswal Securities Limited -Click
here to access detailed report
Analyst Certification
The views expressed in this research report accurately reflect the personal views of the analyst(s) about the subject securities or issues, and no part of the compensation of the research analyst(s) was, is, or will be directly or
indirectly related to the specific recommendations and views expressed by research analyst(s) in this report. The research analysts, strategists, or research associates principally responsible for preparation of MOSt research receive
compensation based upon various factors, including quality of research, investor client feedback, stock picking, competitive factors and firm revenues
Disclosure of Interest Statement
Analyst ownership of the stock
Served as an officer, director or employee
Companies where there is interest
No
No
A graph of daily closing prices of securities is available at www.nseindia.com and http://economictimes.indiatimes.com/markets/stocks/stock-quotes
Regional Disclosures (outside India)
This report is not directed or intended for distribution to or use by any person or entity resident in a state, country or any jurisdiction, where such distribution, publication, availability or use would be contrary to law, regulation or which
would subject MOSt& its group companies to registration or licensing requirements within such jurisdictions.
For Hong Kong:
This report is distributed in Hong Kong by Motilal Oswal capital Markets (Hong Kong) Private Limited, a licensed corporation (CE AYY-301) licensed and regulated by the Hong Kong Securities and Futures
Commission (SFC) pursuant to the Securities and Futures Ordinance (Chapter 571 of the Laws of Hong Kong) “SFO”. As per SEBI (Research Analyst Regulations) 2014 Motilal Oswal Securities (SEBI Reg No. INH000000412) has
an agreement with Motilal Oswal capital Markets (Hong Kong) Private Limited for distribution of research report in Kong Kong. This report is intended for distribution only to “Professional Investors” as defined in Part I of Schedule 1 to
SFO. Any investment or investment activity to which this document relates is only available to professional investor and will be engaged only with professional investors.” Nothing here is an offer or solicitation of these securities,
products and services in any jurisdiction where their offer or sale is not qualified or exempt from registration. The Indian Analyst(s) who compile this report is/are not located in Hong Kong & are not conducting Research Analysis in
Hong Kong.
Motilal Oswal Securities Limited (MOSL) is not a registered broker - dealer under the U.S. Securities Exchange Act of 1934, as amended (the"1934 act") and under applicable state laws in the United States. In addition MOSL is not a
registered investment adviser under the U.S. Investment Advisers Act of 1940, as amended (the "Advisers Act" and together with the 1934 Act, the "Acts), and under applicable state laws in the United States. Accordingly, in the
absence of specific exemption under the Acts, any brokerage and investment services provided by MOSL, including the products and services described herein are not available to or intended for U.S. persons.
This report is intended for distribution only to "Major Institutional Investors" as defined by Rule 15a-6(b)(4) of the Exchange Act and interpretations thereof by SEC (henceforth referred to as "major institutional investors"). This
document must not be acted on or relied on by persons who are not major institutional investors. Any investment or investment activity to which this document relates is only available to major institutional investors and will be
engaged in only with major institutional investors. In reliance on the exemption from registration provided by Rule 15a-6 of the U.S. Securities Exchange Act of 1934, as amended (the "Exchange Act") and interpretations thereof by
the U.S. Securities and Exchange Commission ("SEC") in order to conduct business with Institutional Investors based in the U.S., MOSL has entered into a chaperoning agreement with a U.S. registered broker-dealer, Motilal Oswal
Securities International Private Limited. ("MOSIPL"). Any business interaction pursuant to this report will have to be executed within the provisions of this chaperoning agreement.
The Research Analysts contributing to the report may not be registered /qualified as research analyst with FINRA. Such research analyst may not be associated persons of the U.S. registered broker-dealer, MOSIPL, and therefore,
may not be subject to NASD rule 2711 and NYSE Rule 472 restrictions on communication with a subject company, public appearances and trading securities held by a research analyst account.
For Singapore
Motilal Oswal Capital Markets Singapore Pte Limited is acting as an exempt financial advisor under section 23(1)(f) of the Financial Advisers Act(FAA) read with regulation 17(1)(d) of the Financial Advisors Regulations and is a
subsidiary of Motilal Oswal Securities Limited in India. This research is distributed in Singapore by Motilal Oswal Capital Markets Singapore Pte Limited and it is only directed in Singapore to accredited investors, as defined in the
Financial Advisers Regulations and the Securities and Futures Act (Chapter 289), as amended from time to time.
In respect of any matter arising from or in connection with the research you could contact the following representatives of Motilal Oswal Capital Markets Singapore Pte Limited:
Varun Kumar
Varun.kumar@motilaloswal.com
Contact : (+65) 68189232
Office Address:21 (Suite 31),16 CollyerQuay,Singapore 04931
For U.S
13 December 2016
Motilal Oswal Tower, Level 9, Sayani Road, Prabhadevi, Mumbai 400 025
Phone: +91 22 3982 5500 E-mail: reports@motilaloswal.com
Motilal Oswal Securities Ltd
20