Shriram Transport Finance
BSE SENSEX
30,030
Bloomberg
Equity Shares (m)
M.Cap.(INRb)/(USDb)
52-Week Range (INR)
1, 6, 12 Rel. Per (%)
Avg Val, INRm
Free float (%)
S&P CNX
9,342
SHTF IN
226.9
236.9 / 3.6
1325 / 778
-1/-11/-11
826
73.9
27 April 2017
4QFY17 Results Update | Sector: Financials
CMP: INR1,044
TP: INR1,269 (+22%)
Buy
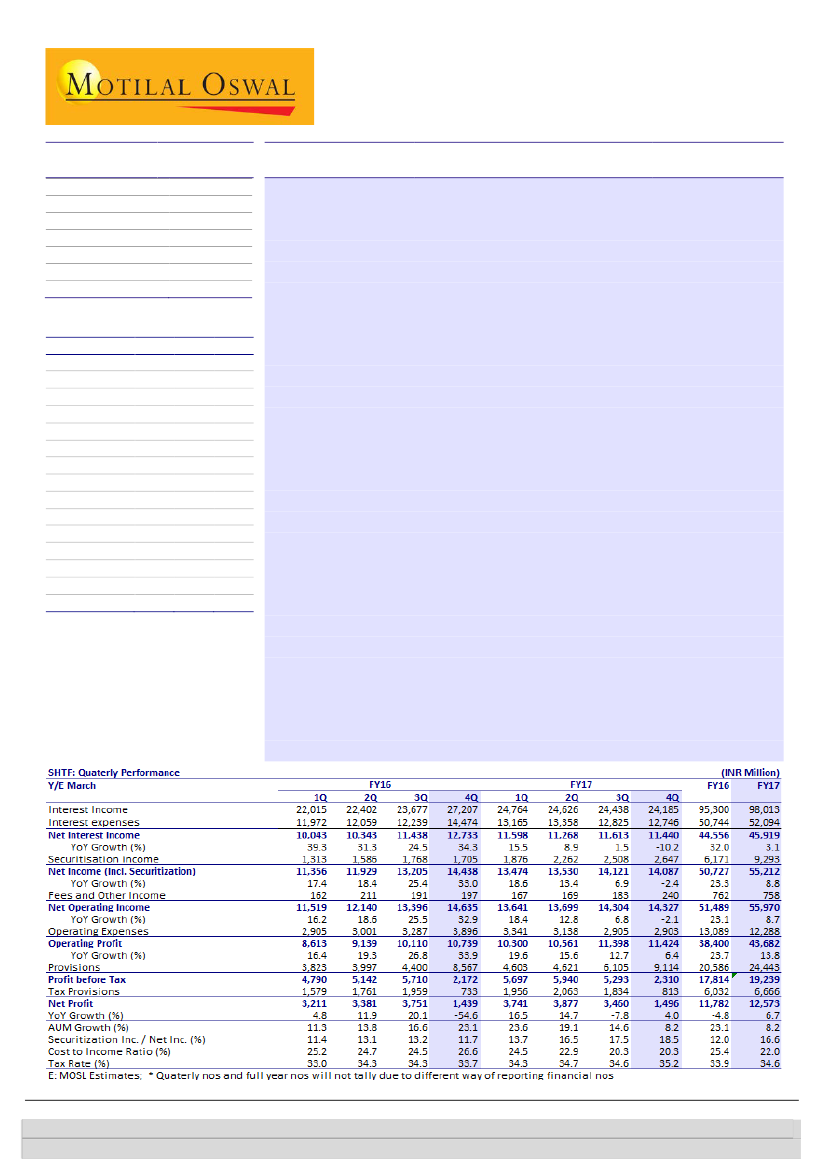
Performance better than expectation despite migration to 120dpd
Shriram Transport’s (SHTF) 4QFY17 PAT of INR1.5b was in line with our
estimate. Better-than-expected margins and controlled opex led to an 8% beat
on operating profit (+6% YoY).
Despite migration to 120dpd (15% of GNPA), management kept its focus on
balance sheet strength. PCR declined to just 70% from 75% a quarter ago.
Hence, provisioning was higher than estimate and led to in-line PAT.
Disbursement in old vehicle loans was INR93.5b, in line with the trend
witnessed over past 6-7 quarters. Management guided that a complete
recovery is 2-3 quarters away and that near-term growth will be driven by
improved agri demand. Management guided for 12-15% AUM growth in FY18.
Reported NIM on AUM contracted 20bp QoQ to 6.97%, driven by lower yields
due to interest reversals. However, we are enthused by the reduction in cost of
funds over past two quarters (-60bp). SHTF has borne significantly higher cost
of funds than peers (refer to Exhibit 2) due to high cost of legacy borrowings.
We expect a gradual decline in cost of funds over next 1-2 years as these
borrowings are replaced by lower-cost NCDs.
GNPL ratio increased 160bp QoQ to 8.2% due to the impact of NPA recognition
migration. GNPL on 180dpd basis was 4.55% v/s 4.5% in 2QFY17 and 4.3% in
4QFY16 (ignoring QoQ comparison due to demon impact).
PAT for FY17 was up 7% YoY at INR12.6b, while RoA/RoE was 1.7%/11.7%.
Valuation and view:
SHTF’s return ratios are at cyclical lows, with decadal high
credit cost and NPLs. We believe the worst of asset quality troubles is behind, and
SHTF should witness improving return ratios due to lower credit costs. Additionally,
we believe margin compression fears are overplayed with the company yet to reap
significant benefit on CoF. Delayed pick-up in infra activities is a risk. We cut our
FY18-19 estimates by 6%/2% to factor in slower AUM growth and higher PCR. The
stock trades at 1.9x/1.6x FY18/19E BV.
BUY
with a TP of INR1,269 (2x FY19E BVPS).
Financials & Valuations (INR b)
Y/E March
2017 2018E 2019E
Net Inc.
55.2 61.0 69.4
PPP
43.7 47.9 54.6
PAT
12.6 17.3 22.0
Cons.PAT
12.6 17.6 22.4
EPS (INR)
55.4 76.3 96.9
Cons. EPS (INR)
55.6 77.4 98.6
BV/Sh (INR)
498
554 634.0
Cons. BV (INR)
493
556 638.0
RoA on AUM (%)
2.0
2.6
2.9
RoE (%)
11.7 14.5 16.3
Payout (%)
21.2 18.6 17.4
Valuations
P/Cons. EPS (x)
18.8 13.5 10.6
P/Cons. BV (x)
2.1
1.9
1.6
Div. Yield (%)
1.0
1.2
1.4
Alpesh Mehta
(Alpesh.Mehta@MotilalOswal.com); +91 22 6129 1526
Piran Engineer
(Piran.Engineer@motilaloswal.com); +91 22 6129 1539
Investors are advised to refer through important disclosures made at the last page of the Research Report.
Motilal Oswal research is available on www.motilaloswal.com/Institutional-Equities, Bloomberg, Thomson Reuters, Factset and S&P Capital.

Shriram Transport Finance
Exhibit 1: Quarterly performance v/s our estimates and reasons for deviation (INR m)
Y/E March
Net Income
% Change (Y-o-Y)
Other Income
Total Net Income
Operating Expenses
Operating Profit
Provisions
Profit before Tax
Tax Provisions
Net Profit
% Change (Y-o-Y)
4QFY17A
14,087
-10.2
240
14,327
2,903
11,424
9,114
2,310
813
1,496
4.0
4QFY17E
13,691
-13.8
175
13,866
3,241
10,625
8,363
2,263
791
1,471
2.2
Var (%)
3
37
3
-10
8
9
2
3
2
Comments
Better than expected margins
Lower employee expenses
Higher PCR than expected
In-line
Source: MOSL, Company
AUM grew 3.3% QoQ and
8.2% YoY to INR788b
Disbursements muted; AUM to pick up in FY18
Old vehicle disbursements declined 13% YoY to INR94b, while new vehicle
disbursements declined 39% YoY to INR11.7b.
Consequently, AUM growth moderated from 15% YoY in 3QFY17 to 8% YoY in
the quarter. Growth has been moderate in both, used and new vehicles.
Passenger vehicles witnessed strong 17% AUM growth, while growth in other
segments was sub-10%.
Management has guided to AUM growth of 12-15% in FY18.
Significant scope to reduce cost of funds
SHTF will reap huge benefits
on cost of funds due to
refinance of high cost
legacy borrowings.
Reported NIM on AUM declined 20bp QoQ to 6.97% driven by lower yields due
to interest reversals. However, we are enthused by the reduction in cost of
funds over the past 2 quarters (60bp reduction).
We believe SHTF is poised to reap significant benefits on cost of funds over the
medium term.
SHTF has borne significantly higher cost of funds than peers
due to high cost of legacy borrowings.
Exhibit 2:
Trend in cost of borrowings of SHTF v/s peers (%)
Q1 2016
SHTF
MMFS
CIFC
10.8
9.7
9.9
Q2 2016
10.7
9.6
9.9
Q3 2016
10.4
9.5
9.6
Q4 2016
11.8
9.2
9.5
Q1 2017
10.5
9.3
9.4
Q2 2017
10.4
9.1
9.3
Q3 2017
10.0
9.1
9.1
Q4 2017
9.8
8.4
NA
Source: Company, MOSL
A quick glance through the 2016 Annual Report suggests that the majority of
SHTF’s market borrowings are at interest rates in excess of 10% (a sizeable
portion in excess of 12% too).
We expect gradual decline in cost of funds over
the next 1-2 years with refinancing of maturing borrowings and the company is
currently borrowing at ~8-8.25% via NCDs.
Interestingly, the company raised INR13.5b from Masala Bonds at 8.25% in the
quarter.
Incrementally, the company is able to raise money from the market at ~8% and
from banks at ~8.5%. Incremental yields are in the range of 16-17%.
27 April 2017
2

Shriram Transport Finance
Management expects C/I
ratio to return to run-rate
of 22-23%
Fourth consecutive quarter of operating expense decline
Employee expense of INR1.27b (v/s our estimate of INR1.7b) surprised us
positively. This was despite the addition of almost 3,000 new employees.
Lower employee cost was driven by lower stipends for new employees.
Management has guided to a pick-up in employee expenses and expects the C/I
ratio to normalize at 22-23% (20.3% in 4QFY17).
SHTF plans to hire 1,000-1,500 new employees in FY18.
Expect credit costs to
decline from 3.2% in FY17
to 2.3% in FY19.
Asset quality largely stable due to RBI dispensation
GNPL ratio increased 160bp sequentially to 8.2%. Around 100bp of this increase
was attributed to migration to 120dpd.
Interestingly, around half of the accounts that received the NPA dispensation
benefit in 3Q have been upgraded while the rest have slipped into NPA.
GNPL on 180dpd basis was 4.55% v/s 4.5% in 2QFY17 and 4.3% in 4QFY16
(ignoring QoQ comparison due to demon impact). PCR is robust at 70%.
We expect asset quality to remain largely stable on an apples-to-apples basis
and expect credit costs to decline from 3.2% in FY17 to 2.3% in FY19.
Valuation and view
SHTF’s return ratios are just off cyclical lows with decadal high credit cost and
NPLs.
We believe the worst of asset quality troubles are behind and the company
should witness improving return ratios due to lower credit costs. Delayed pick-
up in infra activities is a risk.
Additionally, we believe margin compression fears are overplayed, with the
company yet to reap significant benefit on CoF.
We cut our FY18-19 estimates by 6%/2% to factor in slower AUM growth and
higher PCR. The stock trades at 1.9x/1.6x FY18/19E BV. We use RI model with Rf:
7%, CoE: 13.1% and terminal growth rate: 5% to arrive at a TP of INR1,269 (2x
FY19E BVPS).
Buy.
Exhibit 3: Downgrade estimates to factor in higher provisions
INR b
NII (incl. Sec. Inc.)
Other Income
Total Income
Operating Expenses
Operating Profits
Provisions
PBT
Tax
PAT
AUM
Margins (inc securitisation)
Credit Cost
RoA
RoE
Old Est
FY18
FY19
62.8
69.7
0.7
0.8
63.5
70.5
14.3
16.2
49.2
54.3
21.2
20.8
28.0
33.5
9.7
11.0
18.3
22.4
888
999
7.41
7.39
2.47
2.17
2.7
3.0
15.5
16.7
New Est.
FY18
FY19
61.0
69.4
0.8
0.9
61.8
70.3
13.9
15.7
47.9
54.6
21.5
21.8
26.4
32.8
9.1
10.8
17.3
22.0
883
1,003
7.30
7.36
2.54
2.27
2.6
2.9
14.5
16.3
Change (%)
FY18
FY19
-2.9
-0.4
-2.6
-2.7
-2.6
1.3
-5.6
-5.6
-5.6
-0.6
-0.2
-3.1
0.6
4.7
-2.0
-2.0
-2.0
0.4
Source: MOSL, Company
27 April 2017
3

Shriram Transport Finance
Conference call highlights
Business Updates
Expect to maintain NIM at ~7%. However, due to continued reduction in cost of
funds, it could expand by 15-20bp
Expect 12-15% AUM growth in FY18. In 1HFY18, passenger vehicles and tractors
will drive growth. M&HCV pickup will happen in 2HFY18.
GST could be a short-to-medium term disruption.
Management is bullish on agri demand in FY18. Infra–led demand could resume
in 2HFY18.
The company is not financing vehicles more than 10 years old anymore. Such
vehicles account for only ~5-7% of the total loan book.
Incremental cost of funds – Bonds: 8%, Bank: 8.5%; Incremental yield: 16-17%
Asset Quality
Equipment financing subsidiary – Loan book: INR8.8b, GNPL: INR7.3b,
Provisions: INR6.83b. Collections were INR2.7b in 4Q.
Around half of the accounts that would have slipped into NPL if not for the BRI
dispensation in 3Q have recovered, while the other half has slipped into NPL.
Writeoffs – 4Q: INR3.45b, 3Q: INR3.05b and FY17: INR11b
GNPL ratio as of 180dpd is 4.55% (v/s 4.5% in 2QFY17 and 4.3% in FY16). Impact
of NPA transition to 120dpd was ~100bp.
Interest reversal for 4Q is INR400m
Others
Share of Cash collection has returned to 40-45% compared to the trough of 30%
in January, as cash has returned to the system.
Management is bullish on traction in May and June due to robust rabi crop
harvest.
Strong pre-buying demand witnessed in February.
Around 15% of the loan book is financing to 8 years+ old vehicles
Opex was flat sequentially despite higher headcount as new employees receive
only a nominal stipend in the first 6 months. Management expects C/I ratio to
return to 21-22% levels going forward
.
27 April 2017
4

Shriram Transport Finance
Exhibit 4: Quarterly snapshot
FY15
1Q
2Q
3Q
4Q
1Q
2Q
Profit and Loss (INR m)
Net Income
7,209 7,877 9,187
Operating Expenses
2,515 2,575 2,702
Employee
1,012 1,066 1,069
Others
1,502 1,509 1,632
Operating Profits
7,398 7,661 7,973
Provisions
2,966 3,154 3,269
NPAs/ Bad debts
2,874 3,070 3,153
Standard assets
92
84
116
PBT
4,432 4,506 4,704
Taxes
1,368 1,484 1,580
PAT
3,064 3,022 3,124
Asset Quality
GNPA
15,466 16,745 17,797
NNPA
3,135 3,492 3,561
Gross NPAs (%)
3.7
3.7
3.6
Net NPAs (%)
0.8
0.8
0.7
PCR (Calculated, %)
79.7 79.1
80.0
Ratios (%)
Cost to Income
26.0 25.6
25.7
Provision to operating profit
40.1 41.2
41.0
Tax Rate
30.9 32.9
33.6
Total CAR
22.9 22.0
21.1
Business Details (INR b)
AUM
544
556
571
On book Loans
405
441
490
Off book (Securitization)
139
114
81
Total Borrowings
364
407
438
AUM Mix (%)
New CV Loans
10
9
8
Used CV loans
90
89
90
Disbursements Details (INR B)
Total
74.1 81.6
90.0
New CV Loans
4.1
5.4
6.3
Used CV loans
70.0 76.2
83.7
Securitisation Details
Done during quarter (INR B)
1.7
5.3
0.0
Securitization inc as a % to net
inc
25.5 21.8
12.7
Total Borrowing Mix (%)
Banks / FIs
79.9 81.0
81.6
Retail
20.1 19.0
18.4
Other Details
Branches
666
700
719
Employees
17,075 16,410 16,290
FY16
3Q
4Q
1Q
11,598
3,341
1,519
1,822
10,300
4,603
4,550
54
5,697
1,956
3,741
2Q
11,268
3,138
1,392
1,746
10,561
4,621
4,632
-11
5,940
2,063
3,877
FY17
3Q
11,613
2,905
1,305
1,600
11,398
6,105
6,090
16
5,293
1,834
3,460
4Q
Variation (%)
QoQ YoY
(10)
(25)
(33)
(19)
6
6
6
8
6
11
4
40
45
9,478 10,043 10,343 11,438 12,733
2,991 2,905 3,001 3,287 3,896
1,148 1,234 1,311 1,466 1,880
1,843 1,672 1,690 1,821 2,016
8,023 8,613 9,139 10,110 10,739
3,241 3,823 3,997 4,400 8,567
3,234 3,768 3,914 4,324 8,282
7
56
82
76
285
4,782 4,790 5,142 5,710 2,172
1,615 1,579 1,761 1,959 733
3,167 3,211 3,381 3,751 1,439
11,440
(1)
2,903
(0)
1,266
(3)
1,638
2
11,424
0
9,114
49
8,805
45
309 1,894
2,310
(56)
813
(56)
1,496
(57)
26
57
18,941 21,304 23,296 25,357 38,702 41,259 42,420 43,062 54,084
3,791 4,579 5,029 5,023 11,437 12,202 12,518 10,577 16,590
3.8
4.1
4.2
4.3
6.2
6.4
6.6
6.6
8.2
0.8
0.9
0.9
0.9
1.9
2.0
2.0
1.7
2.7
80.0
78.5
78.4
80.2
70.4
70.4
70.5
75.4 69.3
27.6
40.4
33.8
20.5
591
492
99
443
8
92
91.3
8.1
83.2
37.8
12.7
80.4
19.6
25.6
44.4
33.0
20.1
605
518
88
444
8
92
92.3
7.8
84.6
8.3
11.6
79.8
20.2
25.2
43.7
34.3
19.2
633
551
82
460
8
92
95.1
9.7
85.4
15.6
13.3
80.0
20.0
24.9
43.5
34.3
18.5
665
584
81
480
8
92
27.0
79.8
33.7
17.6
728
619
109
498
10
90
24.8
44.7
34.3
17.4
748
640
108
510
11
89
106.6
12.6
94.0
21.6
13.9
80.8
19.2
23.2
43.8
34.7
17.4
753
637
116
518
10
90
98.0
5.0
93.0
29.0
16.7
81.2
18.8
20.6
53.6
34.6
17.6
763
643
120
511
10
90
81.2
5.7
75.6
26.0
17.8
80.8
19.2
20.6
79.8
35.2
16.9
788
655
133
531
10
90
105.2
11.7
93.5
35.6
18.8
81.5
18.5
3
2
11
4
8
6
22
7
104.8 127.1
13.0
19.2
91.8 107.9
19.8
13.4
80.2
19.8
46.2
11.8
80.6
19.4
30
107
24
(17)
(39)
(13)
741
770
800
822
853
879
899
905
918
16,160 16,061 16,608 17,398 19,170 19,125 17,162 15,993 18,885
27 April 2017
5

Shriram Transport Finance
Story in charts
Exhibit 5: Disbursements declined 17% YoY
Disbursements (INR b)
39
31
25
16 16
Growth (%)
39
15
3
(23) (17)
82
90
91
92
95 105 127 107 98
81 105
67 67 63 68 70 71 69 74 79 86 83 86 87 88 85 86 85 84 83
Exhibit 6: Proportion of off-book assets stable (%)
On Books
Off Books
13
(7)
33 33 37 32 30 29 31 26 21 14 17 14 13 12 15 14 15 16 17
74
Exhibit 7: AUM mix largely stable
Used CVs (%)
New CVs (%)
Exhibit 8: Securitization during 4Q stood at INR36b
Assets Securitized (INR b)
54
43
30
14
28
23
2
5
0
8
38
16
20
46
22
29 26
36
21 21 19 17 16 13 12 10 9 8 8 8 8 8 10 11 10 10 10
79 79 81 83 84 87 88 90 89 90 92 92 92 92 90 89 90 90 90
4
Exhibit 9: NIM (% on AUM) declined 20bp sequentially
Reported NIM (%)
Exhibit 10: GNPL increased due to NPL migration
GNPAs (%)
27 April 2017
6

Shriram Transport Finance
Financials and valuations
Income Statement
Y/E March
Financing Income
Finanancing charges
Net Financing income
Change (%)
Income from securitisation
Net Income (Incl Secur)
Change (%)
Other Income
Net Income
Change (%)
Employee Cost
Brokerage & Commission
Other Operating Exp.
Operating Profit
Change (%)
Total Provisions
% to operating income
PBT
Tax
Tax Rate (%)
PAT
Change (%)
Proposed Dividend
2013
45,028
28,439
16,588
36.1
18,057
34,645
7.4
1,885
36,530
8.9
3,848
948
3,065
28,670
8.5
8,508
29.7
20,162
6,556
32.5
13,606
8.2
1,590
2014
62,664
38,982
23,683
42.8
12,796
36,479
5.3
1,655
38,134
4.4
4,089
1,227
4,245
28,573
-0.3
10,293
36.0
18,280
5,638
30.8
12,642
-7.1
1,588
2015
77,779
44,029
33,750
42.5
7,379
41,129
12.7
707
41,836
9.7
4,296
609
5,878
31,054
8.7
12,630
40.7
18,424
6,046
32.8
12,378
-2.1
1,815
2016
95,300
50,744
44,556
32.0
6,171
50,727
23.3
762
51,489
23.1
5,891
587
6,611
38,400
23.7
20,586
53.6
17,814
6,032
33.9
11,782
-4.8
2,269
2017
98,013
52,094
45,919
3.1
9,293
55,212
8.8
758
55,970
8.7
5,482
645
6,160
43,682
13.8
24,443
56.0
19,239
6,666
34.6
12,573
6.7
2,301
2018E
104,806
53,462
51,344
11.8
9,669
61,013
10.5
834
61,847
10.5
6,305
723
6,876
47,943
9.8
21,506
44.9
26,437
9,121
34.5
17,316
37.7
2,771
(INR Million)
2019E
116,800
57,324
59,476
15.8
9,882
69,358
13.7
918
70,276
13.6
7,187
810
7,676
54,603
13.9
21,794
39.9
32,809
10,827
33.0
21,982
26.9
3,297
2020E
131,565
63,079
68,487
15.1
11,119
79,606
14.8
1,009
80,615
14.7
8,194
907
8,568
62,947
15.3
24,316
38.6
38,631
12,748
33.0
25,883
17.7
3,882
Balance Sheet
Y/E March
Capital
Reserves & Surplus
Net Worth
Borrowings
Change (%)
Other Liabilities
Total Liabilities
Investments
Change (%)
Loans
Change (%)
Net Fixed Assets
Net Current Assets
Total Assets
E: MOSL Estimates
2013
2,269
69,679
71,947
310,025
34.1
22
381,995
35,689
-10.0
311,227
41.1
601
34,478
381,995
2014
2,269
80,463
82,732
359,200
15.9
22
441,955
27,253
-23.6
364,878
17.2
1,007
48,818
441,955
2015
2,269
90,111
92,380
442,800
23.3
0
535,180
33,272
22.1
492,271
34.9
1,007
8,629
535,180
2016
2,269
99,272
101,541
497,907
12.4
0
599,448
13,562
-59.2
637,701
29.5
1,011
-52,825
599,448
2017
2,269
110,753
113,022
531,110
6.7
0
644,132
15,494
14.2
678,402
6.4
838
-50,601
644,132
2018E
2,269
123,466
125,735
582,679
9.7
0
708,414
17,818
15.0
757,996
11.7
1,062
-68,461
708,414
2019E
2,269
141,590
143,860
656,753
12.7
0
800,613
20,490
15.0
864,009
14.0
1,113
-84,999
800,613
2020E
2,269
162,931
165,200
744,997
13.4
0
910,197
23,564
15.0
988,314
14.4
1,139
-102,820
910,197
27 April 2017
7

Shriram Transport Finance
Financials and valuations
Ratios
Y/E March
Spreads Analysis (%)
Avg. Yield - on Financing portfolio
Avg Cost of funds
Int Spread on Financing portfolio
NIM (incl Securitisation)
NIM (Excl Securitisation)
Profitability Ratios (%)
RoE
RoA
Int. Expended/Int.Earned
Other Inc./Net Income
Efficiency Ratios (%)
Op. Exps./Net Income
Empl. Cost/Op. Exps.
Asset-Liability Profile (%)
Loans/Borrowings Ratio
Net NPAs to Adv.
Leverage
Average leverage
2013
16.3
10.5
5.8
7.7
6.2
2014
17.3
11.6
5.6
7.1
7.0
2015
17.0
11.0
6.0
7.3
7.9
2016
16.3
10.8
5.6
7.7
7.9
2017
14.4
10.1
4.3
7.3
7.0
2018E
14.1
9.6
4.5
7.3
7.1
2019E
13.9
9.3
4.7
7.4
7.3
2020E
13.7
9.0
4.7
7.4
7.4
20.6
4.0
63.2
54.6
16.3
3.1
62.2
37.9
14.1
2.5
56.6
19.3
12.2
2.1
53.2
13.5
11.7
2.0
53.2
18.0
14.5
2.6
51.0
17.0
16.3
2.9
49.1
15.4
16.7
2.6
47.9
15.0
21.5
49.0
25.1
42.8
25.8
39.8
25.4
45.0
22.0
44.6
22.5
45.3
22.3
45.9
21.9
46.4
100.4
0.8
5.3
5.1
101.6
0.8
5.3
5.3
111.2
0.8
5.8
5.6
128.1
1.9
5.9
5.9
127.7
2.7
5.7
5.8
130.1
3.5
5.6
5.7
131.6
3.4
5.6
5.6
132.7
3.5
5.5
5.5
Valuations
Standalone BV (INR)
BV Growth (%)
Price-BV (x)
Consolidated BV (INR)
Price-BV (x)
Standalone EPS (INR)
Growth (%)
Price-Earnings (x)
Consolidated EPS (INR)
EPS Growth (%)
Price-Earnings (x)
Dividend
Dividend Yield (%)
E: MOSL Estimates
317
19.8
3.3
323
3.2
60.0
7.9
17.4
64.5
11.6
16.2
7.0
0.7
365
15.0
2.9
375
2.8
55.7
-7.1
18.7
59.9
-7.2
17.4
7.0
0.7
407
11.7
2.6
408
2.6
54.6
-2.1
19.1
45.3
-24.3
23.0
10.0
1.0
447
9.9
2.3
450
2.3
51.9
-4.8
20.1
53.3
17.6
19.6
10.0
1.0
498
11.3
2.1
493
2.1
55.4
6.7
18.8
55.6
4.2
18.8
10.0
1.0
554
11.2
1.9
556
1.9
76.3
37.7
13.7
77.4
39.3
13.5
12.2
1.2
634
14.4
1.6
638
1.6
96.9
26.9
10.8
98.6
27.3
10.6
14.5
1.4
728
14.8
1.4
732
1.4
114.1
17.7
9.2
114.3
16.0
9.1
17.1
1.6
27 April 2017
8

Shriram Transport Finance
Corporate profile
Company description
Exhibit 1: Sensex rebased
Shriram Transport Finance (SHTF) established in
1979, is one of the largest asset financing NBFCs in
India with asset under management of INR788b as
of March 2017. SHTF's primary focus is on financing
pre-owned commercial vehicles. It is among the
leading financing institutions in the organized sector
for the commercial vehicle industry for first time
users ("FTUs"), and small road transport operators
("SRTOs"). It also provides financing for passenger
commercial vehicles, multi-utility vehicles, etc.
Source: MOSL/Bloomberg
Exhibit 2: Shareholding pattern (%)
Mar-17
Promoter
DII
FII
Others
26.1
2.2
47.4
24.4
Dec-16
26.1
3.5
37.3
33.1
Mar-16
26.1
2.2
24.0
47.8
Source: Capitaline
Exhibit 3: Top holders
Holder Name
PIRAMAL ENTERPRISES LIMITED
SANLAM LIFE INSURANCE LIMITED
ABU DHABI INVESTMENT AUTHORITY -
(Under sub accounts)
CENTAURA INVESTMENTS (MAURITIUS) PTE
LTD
NEW WORLD FUND INC
% Holding
10.0
3.0
2.3
1.9
1.9
Source: Capitaline
Note: FII Includes depository receipts
Exhibit 4: Top management
Name
S Lakshminarayanan
Jasmeet Singh Gujral
Vivek M Achwal
Designation
Chairman
Managing Director & CEO
Company Secretary
Exhibit 5: Directors
Name
Amitabh Chaudhry
Kishori Udeshi
Puneet Bhatia
Ramakrishnan Subramanian
Name
Gerrit Van Heerde
Sumatiprasad M Bafna
D V Ravi
S Sridhar
Source: Capitaline
*Independent
Exhibit 6: Auditors
Name
G D Apte & Co
S R Batliboi & Co LLP
Type
Statutory
Statutory
Exhibit 7: MOSL forecast v/s consensus
EPS
(INR)
FY17
FY18
FY19
MOSL
forecast
55.6
77.4
98.6
Consensus
forecast
61.5
82.0
100.6
Variation (%)
-9.5
-5.7
-1.9
Source: Bloomberg
Source: Capitaline
27 April 2017
9

This document has been prepared by Motilal Oswal Securities Limited (hereinafter referred to as Most) to provide information about the company (ies) and/sector(s), if any, covered
Shriram
and may be distributed by it and/or
in the report
Transport Finance
its affiliated company(ies). This report is for personal information of the selected recipient/s and does not construe to be any investment, legal or taxation advice to you. This research report does not constitute an offer, invitation or
inducement to invest in securities or other investments and Motilal Oswal Securities Limited (hereinafter referred as MOSt) is not soliciting any action based upon it. This report is not for public distribution and has been furnished to
you solely for your general information and should not be reproduced or redistributed to any other person in any form. This report does not constitute a personal recommendation or take into account the particular investment
objectives, financial situations, or needs of individual clients. Before acting on any advice or recommendation in this material, investors should consider whether it is suitable for their particular circumstances and, if necessary, seek
professional advice. The price and value of the investments referred to in this material and the income from them may go down as well as up, and investors may realize losses on any investments. Past performance is not a guide
for future performance, future returns are not guaranteed and a loss of original capital may occur.
MOSt and its affiliates are a full-service, integrated investment banking, investment management, brokerage and financing group. We and our affiliates have investment banking and other business relationships with a some
companies covered by our Research Department. Our research professionals may provide input into our investment banking and other business selection processes. Investors should assume that MOSt and/or its affiliates are
seeking or will seek investment banking or other business from the company or companies that are the subject of this material and that the research professionals who were involved in preparing this material may educate
investors on investments in such business . The research professionals responsible for the preparation of this document may interact with trading desk personnel, sales personnel and other parties for the purpose of gathering,
applying and interpreting information. Our research professionals are paid on twin parameters of performance & profitability of MOSt.
MOSt generally prohibits its analysts, persons reporting to analysts, and members of their households from maintaining a financial interest in the securities or derivatives of any companies that the analysts cover. Additionally,
MOSt generally prohibits its analysts and persons reporting to analysts from serving as an officer, director, or advisory board member of any companies that the analysts cover. Our salespeople, traders, and other professionals or
affiliates may provide oral or written market commentary or trading strategies to our clients that reflect opinions that are contrary to the opinions expressed herein, and our proprietary trading and investing businesses may make
investment decisions that are inconsistent with the recommendations expressed herein. In reviewing these materials, you should be aware that any or all of the foregoing among other things, may give rise to real or potential
conflicts of interest. MOSt and its affiliated company(ies), their directors and employees and their relatives may; (a) from time to time, have a long or short position in, act as principal in, and buy or sell the securities or derivatives
thereof of companies mentioned herein. (b) be engaged in any other transaction involving such securities and earn brokerage or other compensation or act as a market maker in the financial instruments of the company(ies)
discussed herein or act as an advisor or lender/borrower to such company(ies) or may have any other potential conflict of interests with respect to any recommendation and other related information and opinions.; however the
same shall have no bearing whatsoever on the specific recommendations made by the analyst(s), as the recommendations made by the analyst(s) are completely independent of the views of the affiliates of MOSt even though
there might exist an inherent conflict of interest in some of the stocks mentioned in the research report
Reports based on technical and derivative analysis center on studying charts company's price movement, outstanding positions and trading volume, as opposed to focusing on a company's fundamentals and, as such, may not
match with a report on a company's fundamental analysis. In addition MOST has different business segments / Divisions with independent research separated by Chinese walls catering to different set of customers having various
objectives, risk profiles, investment horizon, etc, and therefore may at times have different contrary views on stocks sectors and markets.
Unauthorized disclosure, use, dissemination or copying (either whole or partial) of this information, is prohibited. The person accessing this information specifically agrees to exempt MOSt or any of its affiliates or employees from,
any and all responsibility/liability arising from such misuse and agrees not to hold MOSt or any of its affiliates or employees responsible for any such misuse and further agrees to hold MOSt or any of its affiliates or employees free
and harmless from all losses, costs, damages, expenses that may be suffered by the person accessing this information due to any errors and delays. The information contained herein is based on publicly available data or other
sources believed to be reliable. Any statements contained in this report attributed to a third party represent MOSt’s interpretation of the data, information and/or opinions provided by that third party either publicly or through a
subscription service, and such use and interpretation have not been reviewed by the third party. This Report is not intended to be a complete statement or summary of the securities, markets or developments referred to in the
document. While we would endeavor to update the information herein on reasonable basis, MOSt and/or its affiliates are under no obligation to update the information. Also there may be regulatory, compliance, or other reasons
that may prevent MOSt and/or its affiliates from doing so. MOSt or any of its affiliates or employees shall not be in any way responsible and liable for any loss or damage that may arise to any person from any inadvertent error in
the information contained in this report. MOSt or any of its affiliates or employees do not provide, at any time, any express or implied warranty of any kind, regarding any matter pertaining to this report, including without limitation
the implied warranties of merchantability, fitness for a particular purpose, and non-infringement. The recipients of this report should rely on their own investigations.
This report is intended for distribution to institutional investors. Recipients who are not institutional investors should seek advice of their independent financial advisor prior to taking any investment decision based on this report or
for any necessary explanation of its contents.
Most and it’s associates may have managed or co-managed public offering of securities, may have received compensation for investment banking or merchant banking or brokerage services, may have received any compensation
for products or services other than investment banking or merchant banking or brokerage services from the subject company in the past 12 months.
Most and it’s associates have not received any compensation or other benefits from the subject company or third party in connection with the research report.
Subject Company may have been a client of Most or its associates during twelve months preceding the date of distribution of the research report
MOSt and/or its affiliates and/or employees may have interests/positions, financial or otherwise of over 1 % at the end of the month immediately preceding the date of publication of the research in the securities mentioned in this
report. To enhance transparency, MOSt has incorporated a Disclosure of Interest Statement in this document. This should, however, not be treated as endorsement of the views expressed in the report.
Motilal Oswal Securities Limited is registered as a Research Analyst under SEBI (Research Analyst) Regulations, 2014. SEBI Reg. No. INH000000412
Pending Regulatory inspections against Motilal Oswal Securities Limited:
SEBI pursuant to a complaint from client Shri C.R. Mohanraj alleging unauthorized trading, issued a letter dated 29th April 2014 to MOSL notifying appointment of an Adjudicating Officer as per SEBI regulations to hold inquiry and
adjudge violation of SEBI Regulations; MOSL replied to the Show Cause Notice whereby SEBI granted us an opportunity of Inspection of Documents. Since all the documents requested by us were not covered we have requested
to SEBI vide our letter dated June 23, 2015 to provide pending list of documents for inspection.
List of associate companies of Motilal Oswal Securities Limited -
Click here to access detailed report
Analyst Certification
The views expressed in this research report accurately reflect the personal views of the analyst(s) about the subject securities or issues, and no part of the compensation of the research analyst(s) was, is, or will be directly or
indirectly related to the specific recommendations and views expressed by research analyst(s) in this report. The research analysts, strategists, or research associates principally responsible for preparation of MOSt research
receive compensation based upon various factors, including quality of research, investor client feedback, stock picking, competitive factors and firm revenues
Disclosure of Interest Statement
Analyst ownership of the stock
Served as an officer, director or employee -
SHRIRAM TRANSPORT FINA
No
No
Disclosures
A graph of daily closing prices of securities is available at www.nseindia.com and http://economictimes.indiatimes.com/markets/stocks/stock-quotes
Regional Disclosures (outside India)
This report is not directed or intended for distribution to or use by any person or entity resident in a state, country or any jurisdiction, where such distribution, publication, availability or use would be contrary to law, regulation or
which would subject MOSt & its group companies to registration or licensing requirements within such jurisdictions.
For Hong Kong:
This report is distributed in Hong Kong by Motilal Oswal capital Markets (Hong Kong) Private Limited, a licensed corporation (CE AYY-301) licensed and regulated by the Hong Kong Securities and Futures
Commission (SFC) pursuant to the Securities and Futures Ordinance (Chapter 571 of the Laws of Hong Kong) “SFO”. As per SEBI (Research Analyst Regulations) 2014 Motilal Oswal Securities (SEBI Reg No. INH000000412)
has an agreement with Motilal Oswal capital Markets (Hong Kong) Private Limited for distribution of research report in Kong Kong. This report is intended for distribution only to “Professional Investors” as defined in Part I of
Schedule 1 to SFO. Any investment or investment activity to which this document relates is only available to professional investor and will be engaged only with professional investors.” Nothing here is an offer or solicitation of
these securities, products and services in any jurisdiction where their offer or sale is not qualified or exempt from registration. The Indian Analyst(s) who compile this report is/are not located in Hong Kong & are not conducting
Research Analysis in Hong Kong.
For U.S.
Motilal Oswal Securities Limited (MOSL) is not a registered broker - dealer under the U.S. Securities Exchange Act of 1934, as amended (the"1934 act") and under applicable state laws in the United States. In addition MOSL is
not a registered investment adviser under the U.S. Investment Advisers Act of 1940, as amended (the "Advisers Act" and together with the 1934 Act, the "Acts), and under applicable state laws in the United States. Accordingly, in
the absence of specific exemption under the Acts, any brokerage and investment services provided by MOSL, including the products and services described herein are not available to or intended for U.S. persons.
This report is intended for distribution only to "Major Institutional Investors" as defined by Rule 15a-6(b)(4) of the Exchange Act and interpretations thereof by SEC (henceforth referred to as "major institutional investors"). This
document must not be acted on or relied on by persons who are not major institutional investors. Any investment or investment activity to which this document relates is only available to major institutional investors and will be
engaged in only with major institutional investors. In reliance on the exemption from registration provided by Rule 15a-6 of the U.S. Securities Exchange Act of 1934, as amended (the "Exchange Act") and interpretations thereof by
the U.S. Securities and Exchange Commission ("SEC") in order to conduct business with Institutional Investors based in the U.S., MOSL has entered into a chaperoning agreement with a U.S. registered broker-dealer, Motilal
Oswal Securities International Private Limited. ("MOSIPL"). Any business interaction pursuant to this report will have to be executed within the provisions of this chaperoning agreement.
The Research Analysts contributing to the report may not be registered /qualified as research analyst with FINRA. Such research analyst may not be associated persons of the U.S. registered broker-dealer, MOSIPL, and
therefore, may not be subject to NASD rule 2711 and NYSE Rule 472 restrictions on communication with a subject company, public appearances and trading securities held by a research analyst account.
For Singapore
Motilal Oswal Capital Markets Singapore Pte Limited is acting as an exempt financial advisor under section 23(1)(f) of the Financial Advisers Act(FAA) read with regulation 17(1)(d) of the Financial Advisors Regulations and is a
subsidiary of Motilal Oswal Securities Limited in India. This research is distributed in Singapore by Motilal Oswal Capital Markets Singapore Pte Limited and it is only directed in Singapore to accredited investors, as defined in the
Financial Advisers Regulations and the Securities and Futures Act (Chapter 289), as amended from time to time.
In respect of any matter arising from or in connection with the research you could contact the following representatives of Motilal Oswal Capital Markets Singapore Pte Limited:
Varun Kumar
Varun.kumar@motilaloswal.com
Contact : (+65) 68189232
Office Address:21 (Suite 31),16 Collyer Quay,Singapore 04931
Kadambari Balachandran
kadambari.balachandran@motilaloswal.com
(+65) 68189233 / 65249115
27 April 2017
Motilal Oswal Tower, Level 9, Sayani Road, Prabhadevi, Mumbai 400 025
Phone: +91 22 3982 5500 E-mail: reports@motilaloswal.com
Motilal Oswal Securities Ltd
10