Shriram City Union Finance
BSE SENSEX
29,895
Bloomberg
Equity Shares (m)
M.Cap.(INR b)/(USD b)
52-Week Range (INR)
1, 6, 12 Rel. Per (%)
Avg Val, (INR m)
Free float (%)
S&P CNX
9,312
SCUF IN
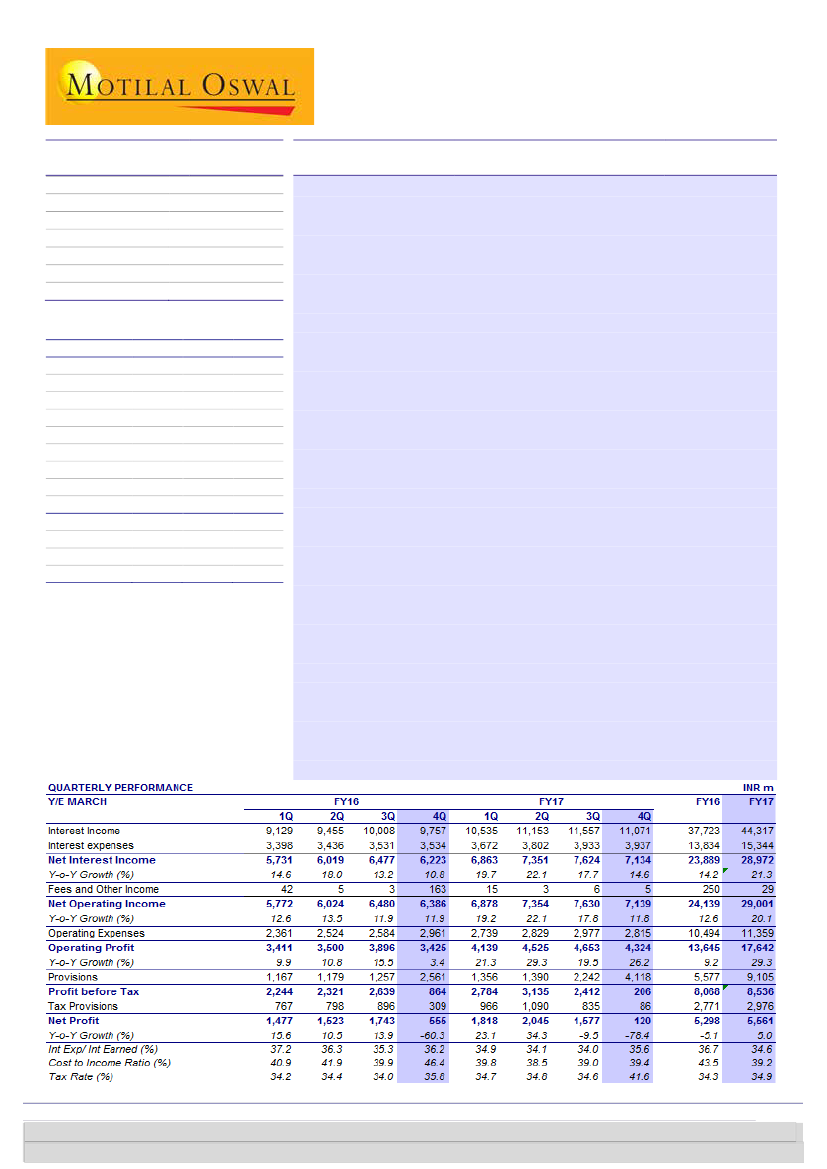
Strong operating performance; estimates largely unchanged
65.9
n
Shriram City Union Finance’s (SCUF) 4QFY17 PAT declined 78% YoY to
141.0/2.1
INR120m. However, this belies the strong operating performance in the
2650 / 1507
quarter. Operating profit was up 26% YoY (est. of +11%), driven by strong
-8/-23/11
loan growth, lower cost of funds and controlled opex.
124
66.2
n
After a muted 3Q, disbursements picked up 20% YoY to INR62.5b. As a
3 May 2017
4QFY17 Results Update | Sector: Financials
CMP: INR2,138
TP: INR2,689 (+26%)
Buy
Financials & Valuations (INR b)
Y/E March
2017 2018E
NII
28.9
33.7
PPP
17.6
21.0
PAT
5.6
8.6
EPS (INR)
84
130
EPS Gr. (%)
5
55
BV/Sh. (INR)
750
859
RoA (%)
2.7
3.6
RoE (%)
11.8
16.2
Payout (%)
23
17
Valuations
P/E (x)
25.3
16.4
P/BV (x)
2.9
2.5
Div. Yield (%)
0.7
0.8
2019E
39.5
n
24.8
10.9
165
26
n
997
3.9
17.8
16
13.0
2.1
n
1.0
n
result, AUM grew 18% YoY (+2.6% QoQ) to INR231b, driven by MSME
loans. Management continues to target 20%+ AUM growth in the non-
gold financing portfolio.
Total operating expenses declined 5% YoY/QoQ to INR2.8b, driven by a
9% decline in employee costs. Management is confident of improvement
in opex ratios in FY18/19 as the impact of the new MSME loan sourcing
strategy (under consultation with McKinsey) plays out.
Asset quality performed better than expectations. GNPL ratio of 6.73%
beat our estimate of 7.47%; however, write-offs were high at INR1.4b
(2.5% annualized). Collections, which dipped 9.9% in 3QFY17, improved
to 8.2% in the quarter. The company continues to make prudent
provisions on its NPLs, with PCR of 73% at the end of the quarter. Note
that SCUF’s PCR is best-in-class among our NBFC coverage companies.
Shriram Housing Finance, however, had a tough quarter with a decline in
disbursements (30% QoQ, 53% YoY) due to a difficult environment. The
company also sold loans (NPLs) worth INR500m to ARCIL, due to which
GNPL ratio improved 95bp QoQ to 2.6% (5.3% incl. sold-down loans).
Valuation and view:
SCUF is a niche play in the retail NBFC space with a
focus on MSME lending. Its business model offers high growth potential
with strong profitability. While we expect GNPL% to rise due to NPA
migration by FY18, we believe loan loss provisioning will decline as SCUF
has strong PCR of 73%. We believe this is a 3.5-4.0%+ RoA and 17-18%
RoE business on a run-rate basis. We keep our estimates largely
unchanged as lower opex in FY18/19 is offset by higher credit costs.
Buy
with a TP of INR2,689 (2.7x FY19E BVPS).
Alpesh Mehta
(Alpesh.Mehta@MotilalOswal.com); +91 22 3982 5415
Piran Engineer
(Piran.Engineer@MotilalOswal.com); +91 22 3980 4393
Investors are advised to refer through important disclosures made at the last page of the Research Report.
Motilal Oswal research is available on www.motilaloswal.com/Institutional-Equities, Bloomberg, Thomson Reuters, Factset and S&P Capital.

Shriram City Union Finance
Exhibit 1:
Quarterly performance v/s our estimates and reasons for deviation (INR m)
Y/E MARCH
Interest Income
Interest expenses
Net Interest Income
Y-o-Y Growth (%)
Fees and Other Income
Net Operating Income
Y-o-Y Growth (%)
Operating Expenses
Operating Profit
Y-o-Y Growth (%)
Provisions
Profit before Tax
Tax Provisions
Net Profit
Y-o-Y Growth (%)
Int Exp/ Int Earned (%)
Cost to Income Ratio (%)
Tax Rate (%)
4QFY17E
10,857
4,040
6,817
10
176
6,993
10
3,110
3,883
13
2,945
938
326
612
10
37.2
44.5
34.8
4QFY17A
11,071
3,937
7,134
15
5
7,139
12
2,815
4,324
26
4,118
206
86
120
-78
35.6
39.4
41.6
Var (%)
2
-3
5
53
-97
2
24
-9
11
96
40
-78
-74
-80
Comments
Better than expected margins
In-line
Lower employee expenses
High write-offs and higher PCR than expected
High provisions lead to PAT miss
Source: MOSL, Company
Disbursement growth
picked up sequentially to
20% YoY
.
AUM growth robust despite demonetization
n
n
n
n
n
Disbursements picked up after a muted 3Q and were up 20% YoY to INR62.5b.
AUM grew 18% YoY (2.6% QoQ) to INR231b. Growth was driven by MSME loans
(+20% YoY), auto loans (+21% YoY) and personal loans (+60% YoY).
Growth in the gold loan portfolio remains sluggish and is not expected to pick up
anytime soon.
Loan mix remains largely unchanged with share of MSME loans at 55%, 2W
loans and 18%, gold loans at 15% and other loans at 13%.
Management targets 20-25% AUM (ex-gold loans) growth in FY18, with MSME
financing continuing to gain share.
Employee expenses were
down 9% YoY
Spreads decline 120bp sequentially; Opex declines 5% QoQ
n
n
n
Calculated spreads declined 120bp sequentially to 10% driven by lower yields
due to interest reversals. However, on a YoY basis, spreads declined only 30bp.
Calculated cost of funds declined 50bp QoQ to 9.4% - the largest sequential
drop in cost of funds in the last 16 quarters.
Employee expenses declined 9% YoY driven by lower incentive payouts. Other
opex was largely stable YoY.
Best-in-class PCR of 73%.
Asset quality deteriorates marginally on an apples-to-apples basis
n
n
n
GNPL ratio increased ~225bp sequentially to 6.73%. Note that SCUF used the RBI
relaxation on NPA recognition in 3Q, without which, GNPL ratio would have
been 90bp higher at 5.4%. We, however, do not have clarity on how much from
this 90bp slipped into NPL in 4Q and how much remained standard. Also, there
was 55bp impact from migration to 120dpd NPA recognition.
Write-offs during the quarter were INR1.4b and for FY17 were INR4.5b.
Management took a prudent approach and maintained a robust PCR of 73%.
3 May 2017
2

Shriram City Union Finance
Conference call highlights
Business Updates
n
n
n
n
n
n
Management expects quarterly disbursements of INR28-30b in MSME financing
segment going forward.
The reason for two wheeler disbursements slowing down in 4QFY17 was
partially due to BS-III impact, where the company chose to stop disbursements
in certain states.
Management expects some yield compression in urban markets in the coming
quarters.
AUM (excluding gold loans) growth in FY18 is expected at 20-25%.
AUM growth in the housing finance subsidiary is expected to be 50-60% in FY18.
Management expects to maintain C/I ratio at 40% going forward.
Write-offs were INR1.41b for 4QFY17 and INR 4.46b for FY17.
Management expects that the shift from 120 dpd to 90 dpd will reduce PCR
from 73% to 60%.
4QFY17 GNPA is 9.72% on 90 dpd (9.5% in 3QFY17), 6.7% on 120 dpd (7.5% in
3QFY17) and 6.16% for 150 dpd (4.49% in 3QFY17).
The HFC subsidiary received SARFAESI late due to which they resorted to
mortgage suits which took time and resulted in the need to sell to ARCs. HFC
ARC sales involved a loss of INR26m.
Since the last two quarters, the HFC has slowed down on construction finance
and also capped ticket size of the loans at INR3m. The existing retail housing
loan portfolio average ticket size is between INR0.8m to INR1m and
construction portfolio average ticket size is INR10m.
Out of the total RBI dispensation amount accounted for in 3QFY17, 60% - 70%
has been recovered in 4QFY17 and the remaining should be recovered by
2QFY18
Interest reversal amounted to INR560m for 4QFY17.
The impact of competition from small banks and newer NBFCs was not felt this
quarter and they will still take around 3 to 4 years for them to give sizeable
competition to SCUF.
The management said that 30% of AUM is constituted of customers outside
South India. They also mentioned that they had a good experience outside
South India in regions like U.P, Bihar, etc as far as the credit quality is concerned.
In states of Maharashtra and Tamil Nadu the company has seen a fast growth in
auto loan (used and new cars and used tractors).
SCUF is a niche play in the retail NBFC space with the focus on MSME lending. Its
business model offers high growth potential with strong profitability and low
competition.
While SCUF has maintained GNPL (180dpd) <4.0% over the cycle, we expect it to
rise to ~8% by FY19 on account of migration to 90dpd and some impact of
demonetization. Yet, loan loss provisioning will decline as SCUF has strong PCR
of 73%, more than peers.
3
Asset Quality
n
n
n
n
n
n
n
Others
n
n
Valuation and view
n
n
3 May 2017

Shriram City Union Finance
n
We believe this is a 3.5-4.0%+ RoA business on a run-rate basis. After all the
impact of NPA migration is over, we expect RoA/RoE of 3.9%/17.8% in FY19. We
believe a company growing at 18-20% YoY with a run-rate RoE of 16-18%
warrants a re-rating. We keep our FY18/19E estimates largely unchanged. We
use RI model with Rf: 7%, CoE: 13.3% and terminal growth rate of 5% to arrive at
a target price of 2,689 (2.7x FY19E P/B).
BUY.
Exhibit 2:
We cut estimates for FY17 to factor in higher provisions
INR B
NII
Other Income
Total Income
Operating Expenses
Operating Profits
Provisions
PBT
Tax
PAT
Loans
Borrowings
Margins
Credit Cost
RoA
RoE
Old Est.
FY18
FY19
33.8
40.1
0.3
0.3
34.0
40.4
13.8
16.2
20.3
24.2
6.6
7.5
13.6
16.7
4.8
5.8
8.9
10.9
266
320
200
240
13.5
13.4
2.6
2.4
3.7
3.9
16.5
17.5
New Est.
% Change
FY18
FY19
FY18
FY19
33.7
39.5
0
-1
0.3
0.3
0
0
34.0
39.8
0
-1
12.9
15.0
-6
-7
21.0
24.8
4
2
7.8
8.1
18
8
13.2
16.7
-3
0
4.6
5.8
-4
-1
8.6
10.9
-3
0
270
320
2
0
202
238
1
-1
13.3
13.1
-1
-2
3.0
2.6
17
8
3.6
3.9
-3
0
16.2
17.8
-2
1
Source: MOSL, Company
3 May 2017
4

Shriram City Union Finance
Exhibit 3: Quarterly Snapshot
FY15
1Q
Profit and Loss (INR m)
Interest Income
Interest Expenses
Net Income
Other Income
Operating Expenses
Employee
Others
Operating Profits
Provisions
PBT
Taxes
Reported PAT
Asset Quality
GNPA (INR m)
NNPA (INR m)
GNPA ratio (%)
NNPA ratio (%)
PCR (%)
Ratios (%)
Cost to Income
Tax Rate
CAR
Tier I
RoA
RoE
Key Details (INR m)
AUM
Disbursements
AUM Mix (%)
MSME
2W
Gold
Others
8,465
3,463
5,001
126
2,023
786
1,236
3,105
1,208
1,897
620
1,277
2Q
8,482
3,382
5,100
207
2,150
1,004
1,146
3,157
1,089
2,069
691
1,378
3Q
8,956
3,235
5,721
69
2,416
1,108
1,309
3,373
1,171
2,202
773
1,429
4Q
8,920
3,303
5,617
92
2,396
1,218
1,178
3,313
1,070
2,243
748
1,496
1Q
9,129
3,398
5,731
42
2,361
1,151
1,210
3,411
1,167
2,244
767
1,477
2Q
FY16
3Q
4Q
1Q
2Q
FY17
3Q
4Q
Variation (%)
QoQ YoY
-4
0
-6
-18
-5
0
-10
-7
84
-91
-90
-92
13
11
15
-97
-5
-9
0
26
61
-76
-72
-78
9,455 10,008 9,757 10,535 11,153 11,557 11,071
3,436 3,531 3,534 3,672 3,802 3,933 3,937
6,019 6,477 6,223 6,863 7,351 7,624 7,134
5
3
163
15
3
6
5
2,524 2,584 2,961 2,739 2,829 2,977 2,815
1,243 1,210 1,528 1,376 1,345 1,394 1,388
1,281 1,374 1,433 1,363 1,484 1,583 1,427
3,500 3,896 3,425 4,139 4,525 4,653 4,324
1,179 1,257 2,561 1,356 1,390 2,242 4,118
2,321 2,639 864
2,784 3,135 2,412
206
798
896
309
966
1,090
835
86
1,523 1,743 555
1,818 2,045 1,577
120
3,860
840
2.9
0.6
78.2
39.4
32.7
29.2
24.0
3.0
20.4
4,150
830
2.9
0.6
80.0
40.5
33.4
30.4
25.2
3.2
14.4
4,610
970
3.0
0.6
79.0
41.7
35.1
30.4
25.5
3.4
14.5
4,910
1,070
3.1
0.7
78.4
42.0
33.3
29.5
0.0
3.4
14.6
5,320
1,090
3.2
0.7
79.5
40.9
34.2
28.0
24.1
3.2
14.2
5,820
1,150
3.3
0.7
80.2
41.9
34.4
27.8
0.0
3.2
14.1
6,320
1,230
3.4
0.7
80.5
39.9
34.0
27.1
0.0
3.5
15.6
9,800 10,240 10,340
2,970 2,930 2,820
5.2
5.1
5.0
1.6
1.5
1.4
69.7
71.4
72.7
46.4
35.8
26.6
23.8
2.7
12.2
39.8
34.7
25.7
23.2
3.4
15.8
38.5
34.8
25.8
23.4
3.7
17.1
9,930
1,250
4.5
0.6
87.4
39.0
34.6
24.7
22.6
2.7
12.9
15,370
4,100
6.7
1.8
73.3
39.4
41.6
23.9
22.3
0.2
1.0
55
228
57
38
153,930 155,570 161,770 167,170 174,830 181,650 190,160 195,760 204,730 213,900 225,440 231,320
0
41,550 45,370 46,680 42,340 45,270 46,650 52,230 53,980 55,670 51,460 62,450
52
19
15
14
52
18
18
12
53
18
17
12
53
18
18
11
53
19
15
13
53
16
20
11
53
18
18
11
54
18
17
11
55
18
16
11
56
18
14
12
55
18
15
12
55
18
15
13
3
21
18
20
Source: Company, MOSL
3 May 2017
5

Shriram City Union Finance
Story in charts
Exhibit 4: Strong AUM growth on a YoY basis
AUM (INR b)
14 14
Growth (%)
17 18 17 17 18 19 18
14
15
19
52
Exhibit 5: AUM mix largely stable (%)
Others
12
18
18
52
12
17
18
53
11
18
18
53
Gold
13
15
19
53
11
20
16
53
11
18
18
53
2W
11
17
18
54
11
16
18
55
MSME
12
14
18
56
12
15
18
55
13
15
18
55
0
-9
-7
3
8
Source: MOSL, Company
Exhibit 6: Liability profile stable (%)
Others
14
54
6
51
10
0
53
24
CPs
7
51
23
16
9
0
53
21
17
Banks
8
6
47
20
19
7
3
53
18
19
NCD
7
6
53
14
20
7
1
59
12
21
Retail Deposit
7
5
56
11
21
7
6
56
10
21
6
9
56
9
20
6
12
56
7
19
Exhibit 7: Cost/Avg AUM ratio continues to decline
C/I ratio (%)
5.4 5.6
4.9 5.1
Cost/Avg AUM (%)
4.9
6.1
6.1 5.8
5.5 5.7 5.6
5.5 5.4 5.4
32
43
Source: MOSL, Company
Exhibit 8: Lowered PCR in the quarter
GNPA (%)
77
78
80
79
78
80
NNPA (%)
80
81
73
PCR (%)
81
73
Exhibit 9: Dip in RoA/RoE due to high credit costs
20.4
RoA (%)
14.4 14.5 14.6 14.2 14.1 15.6
RoE (%)
12.2
15.8 17.1
12.9
70
70
1.0
3.0 3.2 3.4 3.4 3.2 3.2 3.5 2.7 3.4 3.7 2.7 0.2
Source: MOSL, Company
3 May 2017
6

Shriram City Union Finance
Exhibit 10:
Financials: Valuation metrics
Rating
66
ICICIBC*
HDFCB
AXSB
KMB*
YES
IIB
IDFC Bk
FB
DCBB
JKBK
SIB
Equitas
RBL
Private Aggregate
SBIN (cons)*
PNB
BOI
BOB
CBK
UNBK
OBC
INBK
Public Aggregate
Banks Aggregate
HDFC*
LICHF
IHFL
GRHF
REPCO
DEWH
Housing Finance
RECL
POWF
Infra Finance
SHTF
MMFS
BAF
SCUF
MUTH
SKSM
Asset Finance
FY19E
Buy
Buy
Neutral
Buy
Buy
Buy
Neutral
Buy
Neutral
Neutral
Neutral
Buy
Under
Review
Buy
Buy
Neutral
Buy
Neutral
Neutral
Neutral
Buy
CMP
Mcap
EPS (INR)
P/E (x)
BV (INR)
P/BV (x)
RoA (%)
FY19E
1.22
1.78
1.26
1.88
1.84
1.88
0.93
0.81
0.97
0.72
0.59
1.66
1.26
0.45
0.43
0.33
0.75
0.43
0.59
0.31
0.72
RoE (%)
FY18E
9.8
18.2
9.9
14.5
18.0
16.5
7.4
10.9
12.4
11.6
10.0
8.9
14.6
7.3
6.7
6.0
11.9
7.0
9.7
5.2
10.6
FY19E
10.5
19.0
15.7
15.7
19.7
17.3
9.0
12.5
14.0
12.5
11.3
9.6
17.3
9.3
8.3
9.2
14.8
10.5
13.0
6.1
11.1
(INR) (USDb) FY18E FY19E FY18E FY19E FY18E FY19E
273
25.0 17.8 20.5 15.3 13.3 158.0 172.4
1,541
61.6 67.1 79.4 23.0 19.4 387 448
501
18.9 23.4 41.2 21.4 12.2 244 278
914
26.2 32.3 40.5 28.3 22.6 239 278
1,632
11.6 92.2 116.2 17.7 14.0 468 635
1,437
13.4 59.4 72.0 24.2 19.9 385 447
65
3.5
3.3
4.3
19.7 15.3
46
49
112
3.0
5.8
7.3
19.5 15.4
55
61
194
0.9
8.8 11.2 22.1 17.3
75
85
80
0.6
13.0 15.4
6.2
5.2
117 129
26
0.5
3.1
3.8
8.3
6.8
32
35
162
0.9
6.2
7.4
26.1 22.0
73
80
586
289
174
185
190
368
179
175
336
3.4
34.9
5.7
3.0
6.8
3.1
1.8
0.9
2.4
17.6
16.9
12.4
14.5
19.0
35.9
30.5
21.0
33.3
23.8
23.3
16.6
23.7
26.1
57.6
45.3
26.0
38.1
33.2
15.2
14.0
12.8
10.0
10.3
5.8
8.4
10.1
24.6
10.9
10.5
7.8
7.3
6.4
3.9
6.7
8.8
128
243
191
249
167
525
328
413
327
148
262
205
267
187
569
368
433
356
FY18E FY19E FY18E
1.73 1.58 1.23
3.98 3.44 1.81
2.05 1.80 0.86
3.83 3.29 1.75
3.49 2.57 1.78
3.73 3.21 1.87
1.43 1.33 0.88
2.03 1.83 0.78
2.59 2.28 0.94
0.69 0.62 0.69
0.80 0.73 0.54
2.22 2.02 1.92
4.58
1.06
0.91
0.74
1.14
0.70
0.54
0.42
1.03
3.97
0.97
0.85
0.69
1.02
0.65
0.48
0.40
0.94
1.21
0.36
0.36
0.23
0.60
0.31
0.45
0.28
0.71
Buy
Neutral
Buy
Neutral
Buy
Buy
Neutral
Neutral
Buy
Buy
Buy
Buy
Buy
Neutral
1,571
707
1,083
402
760
444
211
161
1,017
328
1,270
2,138
396
783
38.9
5.6
7.0
2.2
0.8
2.2
6.5
6.7
3.6
2.9
10.6
2.2
2.4
1.7
38.4 43.2 23.7
44.6 51.2 15.9
82.2 101.6 13.2
10.3 12.5 39.1
34.0 40.2 22.3
36.7 42.7 12.1
35.0
27.2
77.4
12.9
47.5
134.5
34.5
32.4
40.4
30.2
98.6
16.4
64.0
164.6
40.0
45.3
6.0
5.9
13.1
25.3
26.8
15.9
11.5
24.2
18.8
13.8
10.7
32.1
18.9
10.4
5.2
5.3
10.3
20.0
19.9
13.0
9.9
17.3
225
249
322
37
210
278
196
169
283
290
364
44
247
311
227
191
4.03
2.84
3.36
10.94
3.62
1.60
1.07
0.95
2.86
2.44
2.97
9.08
3.08
1.43
0.93
0.84
1.59
2.48
4.86
2.12
1.91
3.07
1.78
1.52
3.15
2.49
2.14
1.37
3.10
2.76
2.56
1.59
3.59
3.73
4.11
3.54
1.83
1.54
3.09
2.49
2.09
1.31
3.12
2.72
2.91
1.73
3.66
3.85
4.12
3.69
18.1
19.3
27.0
30.6
17.5
13.9
19.1
17.0
14.5
10.9
25.5
16.5
20.2
16.7
17.1
19.0
29.6
30.9
17.6
14.5
19.1
16.8
16.3
12.9
27.3
17.5
20.6
19.5
556 638 1.83
122 132 2.68
207 261 6.15
870 1,008 2.46
182 207 2.18
210 255 3.73
*Multiples adj. for value of key ventures/Investments; For ICICI Bank and HDFC Ltd BV is adjusted for investments in subsidiaries
3 May 2017
7

Shriram City Union Finance
Financials and valuations
Income Statement
Y/E March
Financing Income
Financing charges
Net Financing income
Change (%)
Income from securitisation
Net Income (Incl Secur)
Change (%)
Fee & Other Income
Net Income
Change (%)
Employee Cost
Other Operating Exp.
Operating Income
Change (%)
Total Provisions
% to operating income
PBT
Tax
Tax Rate (%)
PAT
Change (%)
Proposed Dividend
Balance Sheet
Y/E March
Capital
Reserves & Surplus
Net Worth
Net Worth
Borrowings
Change (%)
Other Liabilities & Prov.
Total Liabilities
Investments
Change (%)
Loans
Change (%)
Net Fixed Assets
Net Current Assets
Total Assets
2012
17,824
9,286
8,538
24.3
2,624
11,162
45.1
76
11,238
46.1
924
3,330
6,985
46.6
1,743
25.0
5,242
1,816
34.7
3,425
42.4
335
2013
27,012
14,105
12,907
51.2
3,460
16,367
46.6
75
16,442
46.3
2,239
3,987
10,215
46.2
3,559
34.8
6,657
2,160
32.5
4,496
31.3
464
2014
29,312
13,507
15,805
22.4
2,207
18,012
10.1
487
18,500
12.5
2,708
4,531
11,261
10.2
3,462
30.7
7,799
2,587
33.2
5,211
15.9
611
2015
33,104
13,432
19,672
24.5
1,243
20,915
16.1
519
21,434
15.9
4,116
4,820
12,499
11.0
4,088
32.7
8,411
2,830
33.6
5,581
7.1
1,028
2016
37,065
13,834
23,231
18.1
658
23,889
14.2
250
24,139
12.6
5,132
5,362
13,645
9.2
5,577
40.9
8,068
2,771
34.3
5,298
-5.1
989
2017
43,819
15,465
28,355
22.1
497
28,852
20.8
29
29,001
20.1
5,503
5,857
17,641
29.3
9,105
51.6
8,536
2,976
34.9
5,560
5.0
1,055
2018E
50,357
17,200
33,157
16.9
559
33,716
16.9
250
33,966
17.1
6,273
6,643
21,050
19.3
7,848
37.3
13,202
4,602
34.9
8,600
54.7
1,187
(INR Million)
2019E
2020E
59,264
70,092
20,460
24,216
38,803
45,876
17.0
18.2
665
787
39,469
46,663
17.1
18.2
300
300
39,769
46,963
17.1
18.1
7,340
8,588
7,645
8,997
24,784
29,379
17.7
18.5
8,110
9,601
32.7
32.7
16,674
19,778
5,813
6,895
34.9
34.9
10,861
12,883
26.3
18.6
1,450
1,582
(INR Million)
2019E
2020E
659
659
65,044
76,027
65,703
76,686
65,724
76,707
238,451 282,326
18.3
18.4
0
0
304,175 359,032
10,546
11,601
10.0
10.0
319,573 378,415
18.3
18.4
851
692
-26,795
-31,675
304,175 359,032
2012
524
15,982
16,506
17,350
97,914
71.5
0
115,264
178
223.0
110,900
58.0
525
3,660
115,264
2013
554
21,537
22,092
22,528
127,287
30.0
0
149,815
730
309.9
137,795
24.3
884
10,407
149,815
2014
593
28,390
28,983
29,017
120,491
-5.3
0
149,508
6,276
759.5
129,835
-5.8
1,014
12,384
149,508
2015
659
40,352
41,011
41,036
124,017
2.9
0
165,054
9,817
56.4
160,275
23.4
823
-5,861
165,054
2016
659
44,457
45,116
45,136
144,084
16.2
0
189,220
7,923
-19.3
191,406
19.4
849
-11,309
188,869
2017
659
48,750
49,410
49,430
168,330
16.8
0
217,760
8,716
10.0
225,537
17.8
929
-17,422
217,760
2018E
659
55,925
56,584
56,604
201,555
19.7
0
258,159
9,587
10.0
270,092
19.8
930
-22,451
258,159
E: MOSL Estimates
3 May 2017
8

Shriram City Union Finance
Financials and valuations
Ratios
Y/E March
Spreads Analysis (%)
Yield on loans
Cost of funds
Interest Spread
NIMs (incl Securitisation inc) on AUM
2012
19.0
12.0
7.0
10.4
2013
20.9
12.5
8.4
11.2
2014
21.2
10.9
10.3
11.8
2015
21.9
11.0
11.0
13.3
2016
20.7
10.3
10.4
13.2
2017
20.7
9.9
10.8
13.5
2018E
20.0
9.3
10.7
13.3
2019E
19.8
9.3
10.5
13.1
2020E
19.8
9.3
10.5
13.0
Profitability Ratios (%)
RoE
RoA
Int. Expended/Int.Earned
Other Inc. (incl. Sec. Inc.) / Net
Income
Efficiency Ratios (%)
Op. Exps./Net Income
Empl. Cost/Op. Exps.
Asset-Liability Profile (%)
Loans/Borrowings Ratio
Leverage
Average leverage
Valuations
Book Value (INR)
BV Growth (%)
Price-BV (x)
Adjusted BV (INR)
Price-ABV (x)
EPS (INR)
EPS Growth (%)
Price-Earnings (x)
DPS (INR)
Dividend Yield (%)
E: MOSL Estimates
23.2
3.7
52.1
24.0
22.5
3.4
52.2
21.5
20.2
3.5
46.1
14.6
15.9
3.5
40.6
8.2
12.3
3.0
37.3
3.8
11.8
2.7
35.3
1.8
16.2
3.6
34.2
2.4
17.8
3.9
34.5
2.4
18.1
3.9
34.5
2.3
37.8
21.7
37.9
36.0
39.1
37.4
41.7
46.1
43.5
48.9
39.2
48.4
38.0
48.6
37.7
49.0
37.4
48.8
113.3
7.0
6.4
108.3
6.8
6.9
107.8
5.2
5.9
129.2
4.0
4.5
132.8
4.2
4.1
134.0
4.4
4.3
134.0
4.6
4.5
134.0
4.6
4.6
134.0
4.7
4.7
331.3
35.4
6.5
328.6
6.5
65.4
34.7
32.7
6.4
0.3
406.5
22.7
5.3
399.7
5.3
81.1
24.0
26.4
8.4
0.4
489.5
20.4
4.4
484.9
4.4
87.9
8.3
24.3
10.0
0.5
622.7
27.2
3.4
617.0
3.5
84.7
-3.7
25.2
15.0
0.7
684.6
10.0
3.1
668.9
3.2
80.4
-5.1
26.6
15.0
0.7
749.8
9.5
2.9
728.0
2.9
84.3
5.0
25.3
16.0
0.7
858.6
14.5
2.5
817.1
2.6
130.4
54.7
16.4
18.0
0.8
996.9
16.1
2.1
948.9
2.3
164.7
26.3
13.0
22.0
1.0
1,163.5
16.7
1.8
1,112.8
1.9
195.4
18.6
10.9
24.0
1.1
3 May 2017
9

Shriram City Union Finance
Corporate profile: Shriram City Union Finance
Shriram City Union Finance (SCUF) is a deposit-
taking NBFC focusing on retail lending. Established
in 1986 as Shriram Hire Purchase Finance, it is a
part of three-decade old Shriram Group. It offers
loans to small and medium business enterprises,
two-wheeler loans, loans against gold and home
loans via its subsidiary Shriram Housing Finance in
rural and semi-urban areas of India. In 2014,
Piramal Enterprises picked up a 10% stake at
INR1,200 per share. The company has an AUM of
over INR230b with ~1,000 branches spread across
the country..
Exhibit 11: Shareholding pattern (%)
Mar-17
Promoter
DII
FII
Others
33.8
6.0
21.9
38.4
Dec-16
33.8
6.2
20.1
39.9
Mar-16
33.8
1.8
17.4
47.0
Company description
Exhibit 10: Sensex rebased
Exhibit 12: Top holders
Holder Name
Dynasty Acquisition FPI Ltd
Piramal Enterprises Limited
EAST BRIDGE CAPITAL MASTER FUND
MATTHEWS INDIA FUND
MORGAN STANLEY ASIA (SINGAPORE)
% Holding
20.4
10.0
3.9
2.8
2.3
Note: FII Includes depository receipts
Exhibit 13:
Top management
Name
R Duruvasan
Vipen Kapur
Ranvir Dewan
P P Pattanayak
S Krishnamurthy
Designation
Managing Director
Director
Director
Director
Director
Exhibit 14: Directors
Name
R Duruvasan
Vipen Kapur *
Ranvir Dewan *
P P Pattanayak *
S Krishnamurthy *
G S Sundararajan *
Venkataraman Murali *
*Independent
Name
Maya S Sinha *
Shashank Singh *
Khushru B Jijina *
Debendranath Sarangi *
Gerrit Lodewyk Van Heerde *
C R Dash *
Exhibit 15: Auditors
Name
Pijush Gupta & Co
Type
Statutory
Exhibit 16: MOSL forecast v/s consensus
EPS
(INR)
FY17
FY18
FY19
MOSL
forecast
84.3
130.4
164.7
Consensus
forecast
104.8
131.4
175.2
Variation
(%)
-19.6
-0.8
-6.0
3 May 2017
10

Shriram City Union Finance
NOTES
3 May 2017
11

Disclosures
This document has been prepared by Motilal Oswal Securities Limited (hereinafter referred to as Most) to provide information about the company (ies) and/sector(s), if any, covered in the report and may be distributed by it and/or its
affiliated company(ies). This report is for personal information of the selected recipient/s and does not construe to be any investment, legal or taxation advice to you. This research report does not constitute an offer, invitation or
inducement to invest in securities or other investments and Motilal Oswal Securities Limited (hereinafter referred as MOSt) is not soliciting any action based upon it. This report is not for public distribution and has been furnished to
you solely for your general information and should not be reproduced or redistributed to any other person in any form. This report does not constitute a personal recommendation or take into account the particular investment
objectives, financial situations, or needs of individual clients. Before acting on any advice or recommendation in this material, investors should consider whether it is suitable for their particular circumstances and, if necessary, seek
professional advice. The price and value of the investments referred to in this material and the income from them may go down as well as up, and investors may realize losses on any investments. Past performance is not a guide for
future performance, future returns are not guaranteed and a loss of original capital may occur.
MOSt and its affiliates are a full-service, integrated investment banking, investment management, brokerage and financing group. We and our affiliates have investment banking and other business relationships with a some
companies covered by our Research Department. Our research professionals may provide input into our investment banking and other business selection processes. Investors should assume that MOSt and/or its affiliates are
seeking or will seek investment banking or other business from the company or companies that are the subject of this material and that the research professionals who were involved in preparing this material may educate investors
on investments in such business . The research professionals responsible for the preparation of this document may interact with trading desk personnel, sales personnel and other parties for the purpose of gathering, applying and
interpreting information. Our research professionals are paid on twin parameters of performance & profitability of MOSt.
MOSt generally prohibits its analysts, persons reporting to analysts, and members of their households from maintaining a financial interest in the securities or derivatives of any companies that the analysts cover. Additionally, MOSt
generally prohibits its analysts and persons reporting to analysts from serving as an officer, director, or advisory board member of any companies that the analysts cover. Our salespeople, traders, and other professionals or affiliates
may provide oral or written market commentary or trading strategies to our clients that reflect opinions that are contrary to the opinions expressed herein, and our proprietary trading and investing businesses may make investment
decisions that are inconsistent with the recommendations expressed herein. In reviewing these materials, you should be aware that any or all of the foregoing among other things, may give rise to real or potential conflicts of interest.
MOSt and its affiliated company(ies), their directors and employees and their relatives may; (a) from time to time, have a long or short position in, act as principal in, and buy or sell the securities or derivatives thereof of companies
mentioned herein. (b) be engaged in any other transaction involving such securities and earn brokerage or other compensation or act as a market maker in the financial instruments of the company(ies) discussed herein or act as an
advisor or lender/borrower to such company(ies) or may have any other potential conflict of interests with respect to any recommendation and other related information and opinions.; however the same shall have no bearing
whatsoever on the specific recommendations made by the analyst(s), as the recommendations made by the analyst(s) are completely independent of the views of the affiliates of MOSt even though there might exist an inherent
conflict of interest in some of the stocks mentioned in the research report Reports based on technical and derivative analysis center on studying charts company's price movement, outstanding positions and trading volume, as
opposed to focusing on a company's fundamentals and, as such, may not match with a report on a company's fundamental analysis. In addition MOST has different business segments / Divisions with independent research
separated by Chinese walls catering to different set of customers having various objectives, risk profiles, investment horizon, etc, and therefore may at times have different contrary views on stocks sectors and markets.
Unauthorized disclosure, use, dissemination or copying (either whole or partial) of this information, is prohibited. The person accessing this information specifically agrees to exempt MOSt or any of its affiliates or employees from,
any and all responsibility/liability arising from such misuse and agrees not to hold MOSt or any of its affiliates or employees responsible for any such misuse and further agrees to hold MOSt or any of its affiliates or employees free
and harmless from all losses, costs, damages, expenses that may be suffered by the person accessing this information due to any errors and delays. The information contained herein is based on publicly available data or other
sources believed to be reliable. Any statements contained in this report attributed to a third party represent MOSt’s interpretation of the data, information and/or opinions provided by that third party either publicly or through a
subscription service, and such use and interpretation have not been reviewed by the third party. This Report is not intended to be a complete statement or summary of the securities, markets or developments referred to in the
document. While we would endeavor to update the information herein on reasonable basis, MOSt and/or its affiliates are under no obligation to update the information. Also there may be regulatory, compliance, or other reasons that
may prevent MOSt and/or its affiliates from doing so. MOSt or any of its affiliates or employees shall not be in any way responsible and liable for any loss or damage that may arise to any person from any inadvertent error in the
information contained in this report. MOSt or any of its affiliates or employees do not provide, at any time, any express or implied warranty of any kind, regarding any matter pertaining to this report, including without limitation the
implied warranties of merchantability, fitness for a particular purpose, and non-infringement. The recipients of this report should rely on their own investigations.
This report is intended for distribution to institutional investors. Recipients who are not institutional investors should seek advice of their independent financial advisor prior to taking any investment decision based on this report or for
any necessary explanation of its contents.
Most and it’s associates may have managed or co-managed public offering of securities, may have received compensation for investment banking or merchant banking or brokerage services, may have received any compensation
for products or services other than investment banking or merchant banking or brokerage services from the subject company in the past 12 months.
Most and it’s associates have not received any compensation or other benefits from the subject company or third party in connection with the research report.
Subject Company may have been a client of Most or its associates during twelve months preceding the date of distribution of the research report
MOSt and/or its affiliates and/or employees may have interests/positions, financial or otherwise of over 1 % at the end of the month immediately preceding the date of publication of the research in the securities mentioned in this
report. To enhance transparency, MOSt has incorporated a Disclosure of Interest Statement in this document. This should, however, not be treated as endorsement of the views expressed in the report.
Motilal Oswal Securities Limited is registered as a Research Analyst under SEBI (Research Analyst) Regulations, 2014. SEBI Reg. No. INH000000412
Pending Regulatory inspections against Motilal Oswal Securities Limited:
SEBI pursuant to a complaint from client Shri C.R. Mohanraj alleging unauthorized trading, issued a letter dated 29th April 2014 to MOSL notifying appointment of an Adjudicating Officer as per SEBI regulations to hold inquiry and
adjudge violation of SEBI Regulations; MOSL replied to the Show Cause Notice whereby SEBI granted us an opportunity of Inspection of Documents. Since all the documents requested by us were not covered we have requested to
SEBI vide our letter dated June 23, 2015 to provide pending list of documents for inspection.
List of associate companies of Motilal Oswal Securities Limited -Click
here to access detailed report
Shriram City Union Finance
Analyst Certification
The views expressed in this research report accurately reflect the personal views of the analyst(s) about the subject securities or issues, and no part of the compensation of the research analyst(s) was, is, or will be directly or
indirectly related to the specific recommendations and views expressed by research analyst(s) in this report. The research analysts, strategists, or research associates principally responsible for preparation of MOSt research receive
compensation based upon various factors, including quality of research, investor client feedback, stock picking, competitive factors and firm revenues
Disclosure of Interest Statement
§
Analyst ownership of the stock
§
Served as an officer, director or employee
Shriram City Union Finance
No
No
A graph of daily closing prices of securities is available at www.nseindia.com and http://economictimes.indiatimes.com/markets/stocks/stock-quotes
Regional Disclosures (outside India)
This report is not directed or intended for distribution to or use by any person or entity resident in a state, country or any jurisdiction, where such distribution, publication, availability or use would be contrary to law, regulation or which
would subject MOSt & its group companies to registration or licensing requirements within such jurisdictions.
For Hong Kong:
This report is distributed in Hong Kong by Motilal Oswal capital Markets (Hong Kong) Private Limited, a licensed corporation (CE AYY-301) licensed and regulated by the Hong Kong Securities and Futures
Commission (SFC) pursuant to the Securities and Futures Ordinance (Chapter 571 of the Laws of Hong Kong) “SFO”. As per SEBI (Research Analyst Regulations) 2014 Motilal Oswal Securities (SEBI Reg No. INH000000412) has
an agreement with Motilal Oswal capital Markets (Hong Kong) Private Limited for distribution of research report in Kong Kong. This report is intended for distribution only to “Professional Investors” as defined in Part I of Schedule 1 to
SFO. Any investment or investment activity to which this document relates is only available to professional investor and will be engaged only with professional investors.” Nothing here is an offer or solicitation of these securities,
products and services in any jurisdiction where their offer or sale is not qualified or exempt from registration. The Indian Analyst(s) who compile this report is/are not located in Hong Kong & are not conducting Research Analysis in
Hong Kong.
Motilal Oswal Securities Limited (MOSL) is not a registered broker - dealer under the U.S. Securities Exchange Act of 1934, as amended (the"1934 act") and under applicable state laws in the United States. In addition MOSL is not a
registered investment adviser under the U.S. Investment Advisers Act of 1940, as amended (the "Advisers Act" and together with the 1934 Act, the "Acts), and under applicable state laws in the United States. Accordingly, in the
absence of specific exemption under the Acts, any brokerage and investment services provided by MOSL, including the products and services described herein are not available to or intended for U.S. persons.
This report is intended for distribution only to "Major Institutional Investors" as defined by Rule 15a-6(b)(4) of the Exchange Act and interpretations thereof by SEC (henceforth referred to as "major institutional investors"). This
document must not be acted on or relied on by persons who are not major institutional investors. Any investment or investment activity to which this document relates is only available to major institutional investors and will be
engaged in only with major institutional investors. In reliance on the exemption from registration provided by Rule 15a-6 of the U.S. Securities Exchange Act of 1934, as amended (the "Exchange Act") and interpretations thereof by
the U.S. Securities and Exchange Commission ("SEC") in order to conduct business with Institutional Investors based in the U.S., MOSL has entered into a chaperoning agreement with a U.S. registered broker-dealer, Motilal Oswal
Securities International Private Limited. ("MOSIPL"). Any business interaction pursuant to this report will have to be executed within the provisions of this chaperoning agreement.
The Research Analysts contributing to the report may not be registered /qualified as research analyst with FINRA. Such research analyst may not be associated persons of the U.S. registered broker-dealer, MOSIPL, and therefore,
may not be subject to NASD rule 2711 and NYSE Rule 472 restrictions on communication with a subject company, public appearances and trading securities held by a research analyst account.
For Singapore
Motilal Oswal Capital Markets Singapore Pte Limited is acting as an exempt financial advisor under section 23(1)(f) of the Financial Advisers Act(FAA) read with regulation 17(1)(d) of the Financial Advisors Regulations and is a
subsidiary of Motilal Oswal Securities Limited in India. This research is distributed in Singapore by Motilal Oswal Capital Markets Singapore Pte Limited and it is only directed in Singapore to accredited investors, as defined in the
Financial Advisers Regulations and the Securities and Futures Act (Chapter 289), as amended from time to time.
In respect of any matter arising from or in connection with the research you could contact the following representatives of Motilal Oswal Capital Markets Singapore Pte Limited:
Varun Kumar
Varun.kumar@motilaloswal.com
Contact : (+65) 68189232
Office Address:21 (Suite 31),16 Collyer Quay,Singapore 04931
For U.S
3 May 2017
Motilal Oswal Tower, Level 9, Sayani Road, Prabhadevi, Mumbai 400 025
Phone: +91 22 3982 5500 E-mail: reports@motilaloswal.com
Motilal Oswal Securities Ltd
12