4 May 2017
Corporate performance
4QFY17: Expectations v/s delivery
Today’s top research theme
Bulls & Bears: Markets consolidate gains; Cyclicals outshine Defensives
v
After delivering 19% returns in FY17, the Nifty made a good start to FY18 with
1.4% gains in April-2017. Indian currency has also rallied 5.4% in the first four
months of CY17, bolstering dollar index returns. However, at 22.5x trailing 12
months and 19x FY18E P/E, valuations do not offer much comfort unless
accompanied by an earnings surprise, in our view.
v
Barring Healthcare, Technology, Oil & Gas and Utilities, all other sectors trade
at a premium to their respective LPA. Cement is now trading at a premium of
53% and 41% on P/E and P/B basis v/s LPA. In this edition of ‘Bulls & Bears’,
we take a deep dive into valuation metrics of the Oil & Gas sector.
v
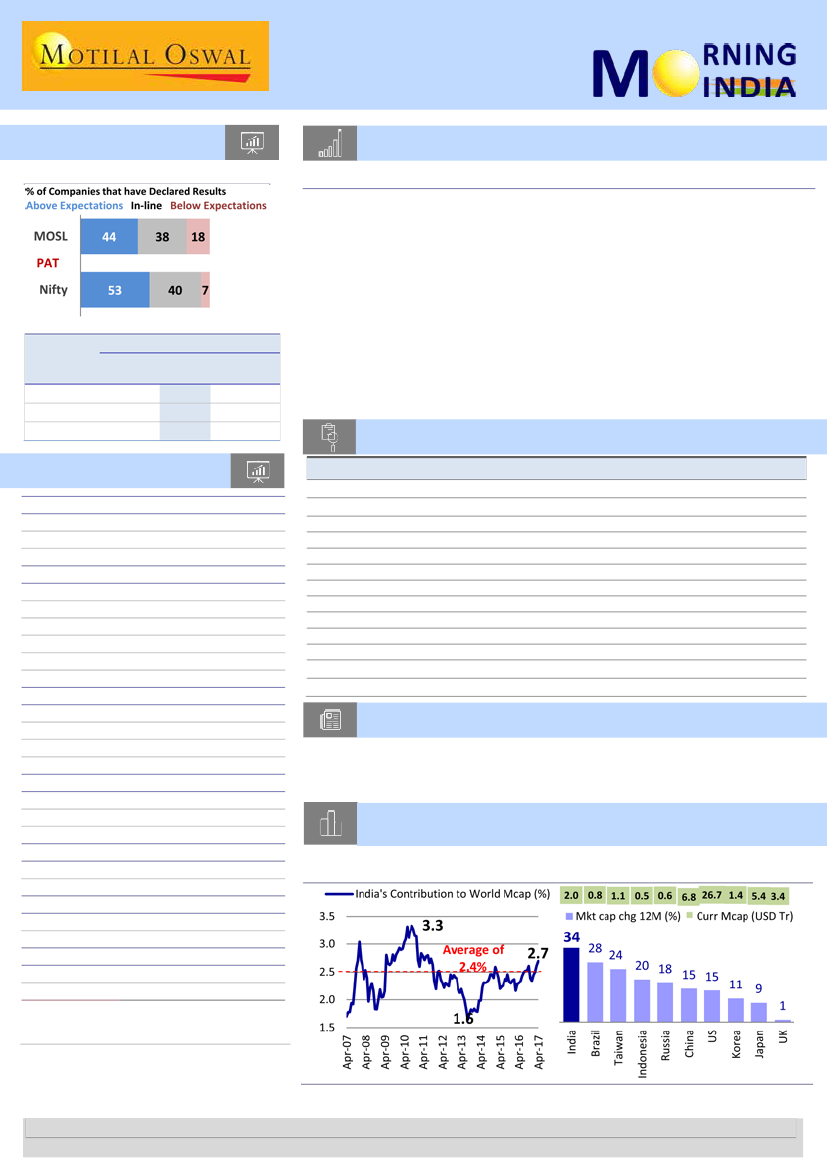
India’s share in world market cap inches above historical average. Over last 12
months, world market cap has increased 14.4% (USD9.2t); India’s market cap
has increased 34%.
(no of
companies)
Sales
EBIDTA
PAT
Growth (YoY, %)
MOSL
Nifty
Sensex
(45)
(15)
(8)
15.7
16.8
17.5
7.8
10.3
3.7
9.7
1.4
7.8
Research covered
Cos/Sector
Key Highlights
Markets consolidate gains; Cyclicals outshine Defensives
Economic activity growth at five-year low in 4QFY17
Microfinance: Collections picking up in troubled states
Core profitability surprises positively; Stress pool down 3% QoQ
Remarkable volume growth, despite weak operating environment
In-line results; Outlook remains positive
(Result Flash) Strong performance on all fronts
Strong operating performance; estimates largely unchanged
Weak results; investment pay-off still some time away
Spate of new launches planned in a tough environment
Bajaj Auto volumes
Unitech Auto | Balaji Telefilms | Unison | Tiger Logistics
Emami | Exide Ind | HDFC | L&T Infotech | MCX | Tata Comm
Bulls & Bears
EcoScope
Financials
ICICI Bank
Marico
Ajanta Pharma
Dewan Hsg. Fin.
Shriram City Union
Alembic Pharma
Parag Milk Foods
Automobiles
MOBIZ - Key Takeaways
Results Expectation
Market snapshot
Equities - India
Close
Chg .%
Sensex
29,895
-0.1
Nifty-50
9,312
0.0
Nifty-M 100
18,126
-0.3
Equities-Global
Close
Chg .%
S&P 500
2,388
-0.1
Nasdaq
6,073
-0.4
FTSE 100
7,235
-0.2
DAX
12,528
0.2
Hang Seng
10,174
0.0
Nikkei 225
19,446
0.0
Commodities
Close
Chg .%
Brent (US$/Bbl)
50
-1.2
Gold ($/OZ)
1,238
-1.4
Cu (US$/MT)
5,567
-3.5
Almn (US$/MT)
1,916
-0.3
Currency
Close
Chg .%
USD/INR
64.1
-0.1
USD/EUR
1.1
0.1
USD/JPY
112.4
0.2
YIELD (%)
Close
1MChg
10 Yrs G-Sec
7.0
0.0
10 Yrs AAA Corp
8.2
0.0
Flows (USD b)
3-May
MTD
FIIs
-0.1
-0.1
DIIs
0.0
0.1
Volumes (INRb)
3-May
MTD*
Cash
295
298
F&O
3,671
3,659
Note: YTD is calendar year, *Avg
YTD.%
12.3
13.8
26.3
YTD.%
6.7
12.8
1.3
9.1
8.3
1.7
YTD.%
-9.8
7.5
0.8
12.4
YTD.%
-5.6
3.8
-3.9
YTDchg
0.4
0.6
YTD
6.2
1.7
YTD*
283
4,612
Piping hot news
Cabinet approves new NPA policy to deal with stressed assets
v
The Union Cabinet, led by Prime Minister Narendra Modi, on Wednesday
approved a new framework for dealing with Rs 6 lakh crore worth …
Chart of the Day: India’s share in world market cap inches above
historical average
Trend in India's contribution to world
market cap (%)
Market cap change in last 12 months (%)
Quote of the day
Financial crises are an unfortunate but
necessary consequence of modern
capitalism.
Research Team (Gautam.Duggad@MotilalOswal.com)
Source: Company, MOSL
Motilal Oswal research is available on www.motilaloswal.com/Institutional-Equities, Bloomberg, Thomson Reuters, Factset and S&P Capital.
Investors are advised to refer through important disclosures made at the last page of the Research Report.

In the news today
Kindly click on numbers for the detailed news link
1
Domestic steel gets
infrastructure boost
Domestic steel will now get
preference in infrastructure under
the National Steel Policy approved
by the Union Cabinet on
Wednesday. The move would
boost the sales of debt-laden
companies.…
2
The Indian economy will grow 7.4 per cent this fiscal and 7.6 per cent in
the next as the bankruptcy and goods and services tax (GST) laws will help
create a better business friendly environment, the Asian Development
Bank (ADB) said on Wednesday. Ahead of its 50th annual meeting to be
attended by finance minister and central bank governors of member
nations, the multilateral agency's Chief Economist Yasuyuki Sawada said
the reforms like GST and the new bankruptcy law will make it easier to do
business in India….
GDP to grow 7.4% in FY18; GST, bankruptcy law big positives: ADB
3
Funding for infra projects will
be a concern, says L&T official
Long term funding for large
infrastructure projects will
continue to be an issue till banks
are fully recapitalised and the
government comes out with new
mechanisms and models of
funding, according to
Subramanian Sarma, CEO & MD,
L&T Hydrocarbon Engineering…
4
Regional air routes: Govt may
tweak norms in Round 2 of
bidding
There is likely to be a revision to
the minimum number of seats on
which the government will provide
subsidy to an airline for operating
to airports in tier II and tier III cities
under the regional air connectivity
scheme. The regional air
connectivity scheme, popularly
called UDAN ( Ude Desh Ka Aam
Naagrik )…
5
IOC plans capex of Rs 2k cr, to
commission 1,000-km
pipelines in FY18
State-run Indian Oil Corporation
plans capital expenditure (capex)
of Rs 2,000 crore and commission
around 1,000 km of pipelines in
the current financial year to
further augment its current
pipeline network of around
13,000 km…
6
Passenger vehicle sales
forecast to grow at 9-11% over
the next five years
Passenger vehicles sales in India,
the world’s fifth largest car
market, are expected to expand
at a faster pace over the next five
years as pay raises for
government employees, courtesy
the 7th Pay Commission, and a
recovery in rural incomes boost
demand for personal transport…
7
Ujjivan SFB to open 171
branches by year-end
Ujjivan Small Finance Bank
(Ujjivan SFB) will be accelerating
expansion of the branch network
and will open up to 171 branches
across the country by the end of
this year, Samit Ghosh, CEO and
MD of Ujjivan SFB, said…
4 May 2017
2

India Valuations Handbook
Strategy: Markets consolidate gains; Cyclicals outshine Defensives
n
Bulls & Bears
Database Periodical | 4 May 2017
n
n
n
n
n
Good start to FY18; mid-caps continue outperforming Nifty:
After delivering 19% returns in FY17, the Nifty
made a good start to FY18 with 1.4% gains in April-2017. Notably, the index delivered positive returns for the
fourth consecutive month, led by benign global cues, strong domestic liquidity and a good start to the 4QFY17
result season. Indian currency has also rallied 5.4% in the first four months of CY17, bolstering dollar index
returns. However, at 22.5x trailing 12 months and 19x FY18E P/E, valuations do not offer much comfort unless
accompanied by an earnings surprise, in our view. The mid-cap index, after delivering 35% returns in FY17, rose
5.2% in April.
Momentum sustains; liquidity benign:
Both the Nifty and Mid-cap index maintained positive momentum of the
previous year in April. The market also saw ninth consecutive month of domestic mutual fund inflows (USD 1.5b
in April). FII outflows came in at USD 0.3b after two months of inflows. Over last 12 months, MSCI EM and MSCI
India have delivered 15-16% returns each. However, over last five years, MSCI India outperformed MSCI EM by
96%. In April, India-Sensex (+12%), Korea (+9%), Brazil (+9%) and Indonesia (+7%) were the best performers
among the key global markets. Russia was the only market delivering negative returns (-10%).
Valuations at 8% premium to 10-year average:
The Sensex trades at a 12-month forward P/E of 18.7x, at an 8%
premium to long-period average of 17.3x. MSCI India trades at a 47% premium to MSCI EM (historical average
premium: 42%). Over last five years, mid-caps have outperformed the Nifty by 65%.
Sectoral performance trends; Defensives lag Cyclicals:
In April, Real Estate (+20%), Capital Goods (+9%), Cement
(+8%), Oil & Gas (+7%) and PSU Banks (+5%) were the top outperformers, whereas Technology (-7%), Metals (-
4%) and Healthcare (-2%) delivered weak returns. Barring Healthcare, Technology, Oil & Gas and Utilities, all
other sectors trade at a premium to their respective LPA. Cement is now trading at a premium of 53% and 41%
on P/E and P/B basis v/s LPA. In this edition of ‘Bulls & Bears’, we take a deep dive into valuation metrics of the
Oil & Gas sector.
Snippets of 4QFY17 performance from first 41 results:
Sales, EBITDA and PAT for 41 MOSL universe companies
that have reported their 4QFY17 results have grown at 15.8%, 12.3% and 6.8% v/s expectations of 16.7%, 8.2%
and 1.1%, respectively.
Caution and stock selection key in a market bereft of valuation comfort:
The Nifty has delivered 14% returns YTD
CY17, led by positive global cues, the BJP’s strong performance in state elections, pragmatic budget, strong
macroeconomic backdrop and continued healthy liquidity. However, this rally has come without concurrent changes
in earnings estimates; on the contrary, we had cut our Sensex EPS estimates for FY18/19 by 4% each in our recently
released 4QFY17 Preview Strategy report. While early 4QFY17 results have shown strong trends, we believe progress
of monsoon, currency movement and smooth GST implementation will be the key catalysts for market. In our model
portfolio (released along with Preview Strategy note), we have turned cautious and increased our weights in sectors
that offer relative valuation comfort (Healthcare, Oil & Gas). We believe the market at current valuations lacks margin
of safety (especially mid-caps), and thus caution and stock selection become even more important.
Nifty MoM change (%) — fourth consecutive month of positive return
Nifty MoM Change (%)
10.8
4.0
1.6
4.2
1.7
2.0
7.6
4.6
0.2
0.5
4.7
3.7 3.3
3.1
0.8
3.6
2.0
0.3
6.6
1.5
1.6
0.1
4.8
1.4
1.4
4 May 2017
3

n
n
n
Sectoral valuation trends; Capital Goods, Cement and Oil top outperformers:
Capital Goods trades at a 20% discount
to historical P/B average and slightly above its historical P/E average. PSUs are driving capex, while private capex is yet
to show traction.
Cement
trades at EV/EBITDA of 14.4x, at a 63% premium to historical average. Cement sector all-India prices
increased by ~4% MoM, led by price hikes across most regions, particularly south, north and east.
Oil & Gas
trades at its historical average valuations of 1.6x on P/B and P/E of 11.7x v/s 10-year average of 11.8x. Brent
averaged ~USD53/bbl (v/s ~USD52/bbl in March) amid reports of non-compliance by non-OPEC, high compliance by
OPEC members and increasing US shale oil production.
PE (x)
Relative to
Sensex P/E (%)
10 Yr
Current
Avg
5
-15
11
-6
-29
-64
-15
-27
69
50
45
1
100
72
9
27
51
29
-28
-30
-37
-31
140
87
-20
-7
-
38
-37
-12
PB (x)
Current
3.5
2.8
1.0
2.7
3.2
3.3
11.1
3.7
6.4
1.3
1.6
8.7
3.4
2.1
1.5
10 Yr
Avg
3.0
2.2
1.1
2.3
4.1
2.3
9.7
4.1
4.4
1.6
1.6
9.2
4.3
2.7
1.8
Prem/
Disc (%)
16.4
28.0
-11.1
19.0
-20.4
40.9
14.4
-8.4
44.9
-16.8
-1.4
-5.8
-20.1
-21.5
-17.3
Relative to
Sensex P/B (%)
10 Yr
Current
Avg
30
13
4
-18
-64
-60
0
-15
19
47
20
-14
309
269
37
52
135
63
-52
-43
-40
-39
220
245
26
58
-21
1
-44
-31
Sector valuations: Defensives lag Cyclicals
Sector
Current
Auto
Banks - Private
Banks - PSU
NBFC
Capital Goods
Cement
Consumer
Healthcare
Media
Metals
Oil & Gas
Retail
Technology
Telecom
Utilities
19.6
20.7
13.3
15.8
31.6
27.1
37.3
20.4
28.3
13.4
11.7
45.0
14.9
Loss
11.8
10 Yr
Avg
15.0
16.5
5.2
12.7
26.7
17.7
29.6
22.0
22.5
12.3
11.8
32.5
16.1
22.4
14.8
Prem/
Disc (%)
30.7
25.0
154.4
24.3
18.1
53.0
26.3
-7.3
25.6
9.1
-1.1
38.2
-7.8
-
-20.6
Global equities: India best-performing market for CY17 YTD
n
India’s share in world market cap inches above historical average
n
For CY17 YTD, MSCI EM (+13%), India-Sensex (+12%), Korea (+9%), Brazil (+9%)
and Indonesia (+7%) were the best performers among the key global markets.
Russia (-10%) is the only key market to deliver negative returns.
India’s share in the world market cap is at 2.7%, above at its long-term average
of 2.4%. Over last 12 months, world market cap has increased 14.4% (USD9.2t);
India’s market cap has increased 34%.
Market cap change in last 12 months (%)
2.0
0.8
28
1.1
0.5
0.6
6.8 26.7 1.4
5.4
3.4
Trend in India's contribution to world market cap (%)
3.5
3.0
2.5
2.0
1.5
India's Contribution to World Mcap (%)
3.3
Average of 2.4%
34
2.7
Mkt cap chg 12M (%)
24
20
18
15
Curr Mcap (USD Tr)
15
11
9
1
1.6
4 May 2017
4

E
CO
S
COPE
Economic activity growth at five-year low in 4QFY17
Expect real GDP growth for the quarter to decelerate to ~6%
n
3 May 2017
The Economy Observer
India’s monthly economic activity index (EAI) eased to below 1% YoY in March 2017, marking its lowest growth in the
past 15 months. Consequently, EAI grew ~2% YoY in 4QFY17, the slowest in the past five years. For the full-year FY17,
EAI grew 5%, similar to the growth witnessed in the past two years.
n
Further details show that while investments were broadly unchanged in March, a sharp decline in consumption
spending by the central government weakened overall consumption. High growth in imports also dragged EAI.
Our EAI shares a very good correlation with official GDP (excluding discrepancies). Consistent weakness in EAI points to
deceleration in real GDP, which we expect will grow ~6% in 4QFY17 against 7.2% in the first three quarters of FY17.
n
n
n
EAI grew only 1.7% YoY in
the last quarter of FY17 –
lower than 6.1% growth in
the first three quarters
n
n
Our EAI has a very strong
correlation with real GDP
(excluding discrepancies);
we expect real GDP growth
to decelerate to ~6% in
4QFY17
n
India’s economic activity growth fell to 0.5% YoY in March 2017…:
Preliminary
estimates reveal that India’s EAI grew only 0.5% YoY in February 2017, marking
the lowest growth in 15 months
(Exhibit 1).
As we have noted earlier, economic
activity growth has weakened considerably post demonetization, which is
reflected in our monthly index from December onwards. March was the
fourth
consecutive month of sub-4% growth.
A look at the sub-components shows
that while the decline in investments was slower than in the previous three
months, fiscal-driven weakness in consumption led to the slowdown in March
(Exhibit 2).
…implying five-year lowest growth in 4QFY17:
A look at the quarterly data
shows that EAI grew only 1.7% YoY in the last quarter of FY17 – lower than 6.1%
growth in the first three quarters. Not only was the growth in consumption the
lowest in three years, the decline in investments was also higher than in
3QFY17. For the full-year FY17, EAI grew 5%, similar to the growth in the past
two years.
Weakness in March driven by soft consumption spending…:
Our index for
consumption growth eased to a 22-month low of 3.6% YoY in March 2017,
almost entirely driven by an estimated decline in the central government’s core
revenue spending excluding interest payments
(Exhibit 3).
Further, we believe
that investments were unchanged in March, primarily due to an estimated
improvement in IIP for capital goods
(Exhibit 4).
Other indicators have, however,
done better than in the past few months (see
Exhibit 7-8
for the heat map).
…and higher trade deficit:
Further, real imports grew faster than exports (35.1%
v/s 18.6%), leading to a widening of trade deficit
(Exhibit 5).
It deducted 1.4pp
from EAI growth in March 2017.
Consistent weakness in EAI to be reflected in 4QFY17 GDP growth:
Although
there is no one-to-one correlation between our EAI and official GDP growth due
to underlying differences discussed in our
earlier report,
our EAI has a very
strong correlation with real GDP (excluding discrepancies) estimates
(Exhibit 6).
We expect real GDP growth to decelerate to ~6% in 4QFY17.
Note: Estimates of Economic Activity Index (EAI) for the month prior to the recently concluded month are released in the first
few business days of every month. So, March’s EAI is released today.
4 May 2017
5

Sector Update | 3 May 2017
Financials
Microfinance: Collections picking up in troubled states
Vast opportunity, yet clouded by collection uncertainty in key states
n
n
n
n
We recently attended the
MFIN Conclave - Microfinance in Asia: A Mosaic.
Based on
discussions with the delegates and industry experts, the consensus is around
improvement in the asset quality situation from February levels. However, in certain
pockets, the situation remains grim.
The top-5 states, which accounted for ~50% of the AUM at the end of February, had
70%+ of the problems.
Borrowers are gradually coming to terms now with the importance of maintaining a
good credit record – they are realizing that repayments are the only way to ensure
future loans from organized financiers.
Amongst the larger states, Uttar Pradesh (10% of industry AUM and 20%+ problem at
PAR >0DPD) is improving at a healthy pace. However, certain pockets in Maharashtra
(Vidharbha region) remain areas of concern.
Asset quality issues moderating: At PAR, delinquencies stand at ~20.9%
Post the initial issues related to demonetization, RBI dispensation-related confusion,
and state and local elections, the situation has been slowly normalizing since March
2017. From the borrowers’ demand for complete loan waiver to waiver of charges
to reduction in interest rates, lenders have ultimately agreed to extend the loan
tenures (lack of options). At PAR (>0d), delinquency levels are ~21% and are unlikely
to fall steeply, given the inability of customers to make balloon payments of overdue
installments. Hence, delinquencies will remain high for a significant time period. The
loan repayment schedules are being extended, and the PAR (portfolio at risk) is
likely to reduce sharply only when the loan nears the end of the repayment period
and the borrower is removed from the books.
Lessons to be learnt from AP crisis and recent issues
Growth has been aggressive to the extent that it has compromised the basics of
some prudent lending practices. The approach should have been to grow steadily
with focus on understanding consumer behavior and learning from defaults in this
unique customer segment. Increasing trend in the ticket sizes raises red flags for the
industry. The difference between the Andhra Pradesh (AP) crisis and the current
scenario is that this time there are numerous troubled geographies.
Separating wheat from the chaff: Sustainable businesses to emerge winners
Given the uncertainties in predicting asset quality, adequate provisions/buffers must
be made in the good times to protect against the current calamitous situation. The
current phase may weed out several players – companies that focus on long-term
sustainable RoE v/s just maximizing RoE will be the survivors. There has been an
increasing talk of JLG model not being the best approach to cater to this customer
profile. Instead, individual secured lending such as consumer finance, housing,
business loans, vehicle finance, and savings/remittance products would entrench
relationships. MFIs should have a huge role to play in low cost housing. Of the
INR700b MFI industry, only INR220m has gone into housing. Current regulations
allow MFI companies to go up to 15% for non-microfinance financing.
4 May 2017
6

Digitalization: Huge opportunity and strong infrastructure in place…
Key enablers for digitalization in the MFI space are in place with 1b+ mobile
phones/aadhar cards/bank accounts. There is a strong push from the government to
make 60m households digitally literate over the next three years, with a target of
25b digital transactions by the end of FY18 (ambitious, given that the current
number is 2.7b transactions). The National Optic Fiber Program, which aims to
connect 250,000 gram panchayats with the internet, is crucial. Innovative
applications like BHIM and the UPI will be key enablers.
...however, challenges persists
The MFI industry in India covers 160m-170m households, that is, ~830m borrowers.
Of these, only 6% of the borrowers have access to computers. In the age group of
14-29 years, only 18% know how to operate computers. Only 1/3
rd
of the 900m
unique mobile phone users have smartphones – however, incrementally 50% of the
new phones sold are smartphones. A very small proportion of the villages have
access to internet and the National Optic Fiber project of the government could be a
game changer in this regard. Inadequate ATM infrastructure and low withdrawal
limits in
Jan Dhan
accounts is a huge deterrent to MFI companies disbursing in cash.
Despite having the necessary technology, the lack of acceptance is a roadblock.
Role of credit bureaus needs to be enhanced
Panelists also put forward the case for enhancing the role of credit bureaus to
provide insights rather than just raw data. There is a need for a single repository
wherein information of all sectors / individuals is available so as to encourage
simplicity and efficiency and avoid overlap. A single view/credit report is the desired
outcome. Lenders on their part must invest today in data storage and should strive
to take a holistic view on the customer before lending.
Disbursements picking up again; near-term uncertainties remain
After AUM decline until February 2017, March has seen MoM rise in AUM. However,
incremental growth is largely coming from existing customers. At the industry level,
>60 DPD delinquency levels are at 9.8%. At the aggregate level, 5-10% of the
portfolio may turn bad. Overleveraging remains a key issue for the sector (according
to published research, 9% of the outstanding loans amount is from third lenders –
above the maximum two-lender rule). In our view, near-term uncertainties on
collections would continue. Central elections remain a key medium-term risk.
4 May 2017
7

3 May 2017
4QFY17 Results Update | Sector: Financials
ICICI Bank
Buy
BSE SENSEX
29,921
Bloomberg
Equity Shares (m)
M.Cap.(INRb)/(USDb)
52-Week Range (INR)
1, 6, 12 Rel. Per (%)
Avg Val, INRm
Free float (%)
S&P CNX
9,314
ICICIBC IN
Core profitability surprises positively; Stress pool down 3% QoQ
5,821
n
ICICIBC’s reported PAT of INR20.2b missed our estimate by 12% due to
1,576.5 / 23.2
higher-than-expected provisioning. Core PPoP growth of 8% YoY surprised
298 / 181
positively (15% beat). Key positives: a) Strong NII growth of 10% QoQ, aided
2/11/6
by an impressive NIM performance (+45bp QoQ; includes interest collection
4708
from NPLs). b) 85% of Q4 slippages originated from watch list and OSRL of
100.0
CMP: INR272
TP: INR365 (+34%)
Financials & Valuations (INR b)
Y/E March
2017 2018E
NII
217.4
234.0
OP
264.9
218.6
NP
98.0
98.0
NIM (%)
3.3
3.3
EPS (INR)
16.8
16.8
EPS Gr (%)
0.6
0.0
BV/Sh (INR)*
149.0
161.0
ABV/Sh (INR)*
118.4
127.6
RoE (%)
10.1
9.1
RoA (%)
1.3
1.2
AP/E (x)
11.8
10.9
AP/BV (x)
1.3
1.1
2019E
267.3
246.5
112.1
3.3
19.2
14.3
174.6
152.2
9.8
1.2
8.8
1.0
n
n
n
3Q. c) Pool of net stressed loans (NNPA + other forms of stress loans)
declined 3% QoQ to INR548b (11.8% of loans). d) Fee income growth of 10%
YoY, helped by strong retail fee growth of ~20% YoY. e) Average daily CASA
ratio improvement of 170bp QoQ to 46.5%.
Slippages during the quarter were INR112.9b, of which INR53.8b relates to a
cement account (part of the watch list), which the RBI has asked banks to
recognize as NPA. Nearly half of this exposure is expected to be upgraded
soon, as it is part of an impending M&A transaction. Excluding this, slippages
continued to moderate to ~INR59b, as against INR70b in 3Q and ~INR80b in
2Q. Non-watch list and RL slippages declined to INR15b from INR20.5b a
quarter ago.
Other highlights:
(1) Floating provisions of INR15b utilized completely in
4QFY17. (2) Reversed INR2.9b of gain on repatriation booked on foreign
operations (as per RBI guideline) in 9M. (3) Added 345 branches during the
quarter, taking total to 4,850. (4) Declared the dividend of INR2.5/share and
announced bonus issue of 1 share for every 10 shares held.
Valuation and view:
Overall pool of stressed loans is showing signs of
stability, and bulk of NPA recognition is happening from watch list and OSRL.
Further expected measures by GoI/RBI for resolution of lumpy stressed
loans provide comfort. Strong capitalization (tier I of 14.4%), significant
improvement in granularity of book (~57% retail + SME) and sustained
improvement in liability profile (helping to de-risk business) are the key
positives. We have cut estimates by 5% to factor in NIM moderation with
rising competition; reiterate
Buy
with SOTP of INR365 (FY19-based).
4 May 2017
8

3 May 2017
4QFY17 Results Update | Sector: Consumer
Marico
BSE SENSEX
29,921
Bloomberg
Equity Shares (m)
M.Cap.(INRb)/(USDb)
52-Week Range (INR)
1, 6, 12 Rel. Per (%)
Avg Val, INRm/ Vol m
Free float (%)
S&P CNX
9,314
MRCO IN
1,290.2
411.4 / 6.2
325 / 235
7/10/2
348
40.3
CMP: INR319
TP: INR335 (+5%)
Downgrade to Neutral
Remarkable volume growth, despite weak operating environment
n
Financials & Valuations (INR b)
Y/E Mar
2017 2018E 2019E
Net Sales
59.2
67.5
78.1
EBITDA
11.4
12.4
14.9
PAT
8.1
9.0
10.9
EPS (INR)
6.3
6.9
8.4
Gr. (%)
12.1
10.5
21.1
BV/Sh (INR)
18.0
21.1
23.0
RoE (%)
31.5
30.3
32.7
RoCE (%)
47.7
46.1
65.4
P/E (x)
50.8
45.9
37.9
P/BV (x)
17.7
15.1
13.9
n
n
n
Estimate change
TP change
Rating change
Strong volume growth:
Marico’s (MRCO) consolidated net sales rose 2.2% YoY
(est. of +4.4%) to INR13.2b. Domestic volumes increased 10% YoY (est. of +7%),
despite 8% growth in the base quarter. Domestic revenues grew 6% YoY, while
reported international revenues declined 8% (-5% CC). Parachute sales grew
11% with 15% volume growth (est. of +11%), Saffola sales grew 3% with 6%
volume growth (est. of mid-single-digit increase), and Value Added Hair Oils
sales grew 9% with 10% volume growth (est. of mid-single-digit increase).
Consolidated gross margin contracted 180bp YoY (est. of -300bp) to 51.6%.
EBITDA came in 17.7% ahead of expectations, mainly led by lower-than-
expected contraction in gross margin (despite a huge increase in material
costs) and a sharp cut in A&P (-410bp YoY). EBITDA increased 20.1% YoY (est.
of +2.1% YoY) to INR2.5b, with the margin expanding 290bp YoY (est. of -30bp)
to 19.2%. Adj. PAT increased 25.5% YoY (est. of +6.2%) to INR1.7b.
FY17 performance:
Consolidated sales declined 1.6% YoY to INR59.2b. EBITDA
margin was up 200bp YoY to 19.3%. Adj. PAT rose 12.1% YoY to INR8.1b,
registering the sixth consecutive year of double-digit growth. Inventory days
rose to 67 from 58 due to an increase in costs of copra and other materials.
Downgrade to Neutral:
Strength of the business model has been
demonstrated again through double-digit volume growth. We remain positive
on the longer-term earnings growth prospects. MRCO’s investment in
distribution technology is far ahead of peers, which should serve them in good
stead over the long term. After our upgrade to Buy in December, the stock has
appreciated ~25%, and at 37.9x FY19E EPS, valuations are no longer attractive
from a one-year investment viewpoint. We thus downgrade to
Neutral
with a
target price of INR335 (40x FY19EPS, 10% premium to three-year average).
4 May 2017
9

3 May 2017
4QFY17 Results Update | Sector: Healthcare
Ajanta Pharma
Buy
BSE SENSEX
29,921
Bloomberg
Equity Shares (m)
M.Cap.(INRb)/(USDb)
52-Week Range (INR)
1, 6, 12 Rel. Per (%)
Avg Val, INRm
Free float (%)
S&P CNX
9,314
AJP IN
586
146.7 / 2.2
2150 / 1400
-7/-24/-7
291
26.2
CMP: INR1,658
TP: INR2,028(+22%)
In-line results; Outlook remains positive
AJP posted in-line sales of INR4.8b (est. of INR4.7b). EBITDA margin of 35.9%,
adjusted for forex loss accounting for mark-to-market, was significantly better
than estimate of 33.8% due to a superior product mix. Higher depreciation on
account of commercialization of the Guwahati facility and lower-than-expected
other income led to PBT growing at a lower rate than EBITDA. As a result,
adjusted PAT grew 4% YoY to INR1.2b (est. of INR1.2b).
n
US, India and Asia drive sales growth:
Sales grew 12% YoY, led by healthy
growth in India sales and strong momentum in US sales. Currency
stabilization led to a revival in Asia segment sales (+15% YoY) after two
quarters of decline. Africa sales declined 24% YoY due to lower anti-malaria
sales, impacting overall growth for the quarter.
n
Aggressive ANDA filings expected in FY18:
AJP continued to post robust
performance in the US, with sales at INR450m v/s INR50m in the previous
quarter, led by sustained business from approved products. AJP has ~15
ANDAs pending for approval and intends to file 12-15 in FY18.
st
n
Inspection update:
In 4QFY17, AJP had successful 1 USFDA inspection at its
Dahej facility. The USFDA issued one observation at its Paithan facility, which
is minor in nature, in our view.
n
Capex guidance:
AJP guided for capex of ~INR3bn in FY18, largely toward
the Guwahati facility, R&D and maintenance.
n
Healthy FY17 performance:
AJP posted sales growth of 14.9% YoY to
INR20b, EBITDA margin of 35.2% and PAT growth of 25.7% YoY to INR5.2b.
Valuation:
We remain positive on AJP, given its aggressive filings in the US and
better-than-industry growth in India branded sales. We tweak FY18 estimates to
factor in better EBITDA margin and a marginal fall in Africa sales. We maintain
FY19 estimates and TP of 2,028 on 25x FY19E earnings. Reiterate
Buy.
Financials & Valuations (INR b)
FY17 FY18E
Y/E Mar
Net Sales
20.0
22.6
EBITDA
7.0
7.9
PAT
5.2
5.9
EPS (INR)
58.4
66.4
Gr. (%)
24.0
13.6
BV/Sh (INR)
177.2
233.0
P/E(x)
28.4
25.0
P/B (x)
9.4
7.1
ROE (%)
37.7
32.3
RoCE (%)
36.4
31.9
FY19E
27.5
9.4
7.1
79.9
20.3
300.0
20.8
5.5
30.0
29.6
Estimate change
TP change
Rating change
Quarterly Performance (Consolidated)
4 May 2017
10

RESULTS
FLASH
Dewan Housing
BSE SENSEX
29,921
S&P CNX
9,314
3 May2017
Results Flash | Sector: Financials
CMP: INR444
Strong performance on all fronts
n
We will revisit our estimates
post earnings call/management
interaction.
Conference Call Details
Date:
4 May 2017
Time:
03:00pm IST
Dial-in details:
+91-22-3938 1079
th
n
n
Financials & Valuations (INR b)
Y/E March
2017 2018E 2019E
NII
20.0
23.9
28.4
PPP
16.2
19.8
23.7
Adj. PAT
9.3
11.5
13.4
EPS (INR)
29.7
36.7
42.7
EPS Gr. (%)
27.0
29.3
16.4
BV (INR)
250
277
310
RoAA (%)
1.3
1.4
1.3
RoE (%)
13.9
13.9
14.6
Payout (%)
23.2
23.2
23.2
Valuations
P/E (x)
15.7
12.2
10.4
P/BV (x)
1.8
1.6
1.4
P/ABV (x)
1.8
1.6
1.4
Div. Yield (%)
1.3
1.6
1.9
n
n
n
n
Dewan Housing Finance’s (DEWH) 4QFY17 PAT grew 31% YoY to INR2.48b
(excluding the gain on the sale of 50% stake in the life insurance subsidiary).
Strong AUM growth, YoY reduction in cost-to-income ratio and an
improvement in spreads were the highlights of the quarter.
Disbursement growth picked up sequentially and was 11.2% YoY for the quarter.
AUM growth was healthy at 6.7% QoQ/20.2% YoY, with AUM crossing INR835b.
The company continues to diversify into non-retail lending (its share in total loan
book increased from 31% to 34% QoQ). Borrowing mix, however, was largely
stable. The company continues to reduce its cost of borrowings by negotiating
better rates with banks and refinancing maturing NCDs at lower rates.
Reported margin expanded 8bp YoY, but shrunk 3bp QoQ to 3.04%. Reduction
in cost of funds to 8.83% (-84bp YoY, -37bp QoQ) was the main driver of spread
improvement. We await further details on loan yield trends.
C/I ratio (-460bp YoY to 27.2%) was in line with the trend witnessed over past
three quarters. For FY17, C/I ratio declined 320bp YoY to 26.9%. We believe
DEWH will continue focusing on opex reduction.
Asset quality was stable, with GNPL ratio of 0.94% as of 4QFY17.
Valuation and view:
DEWH continues capitalizing on its mortgage lending
expertise in an underpenetrated market. Its focuses on being a core mortgage
finance player,
as evident from
its divestment
of
non-core assets
(such
as the
life insurance business). Also, management’s continued commitment toward
lowering operating cost should improve return ratios
and
investor sentiment.
We believe
its
gradual transformation to a core mortgage player with strong
growth and healthy return ratios would result in further re-rating. We look to
revise our rating and TP post concall on 4 May.
4 May 2017
11

Shriram City Union Finance
BSE SENSEX
29,895
Bloomberg
Equity Shares (m)
M.Cap.(INR b)/(USD b)
52-Week Range (INR)
1, 6, 12 Rel. Per (%)
Avg Val, (INR m)
Free float (%)
S&P CNX
9,312
SCUF IN
Strong operating performance; estimates largely unchanged
65.9
n
Shriram City Union Finance’s (SCUF) 4QFY17 PAT declined 78% YoY to
141.0/2.1
INR120m. However, this belies the strong operating performance in the
2650 / 1507
quarter. Operating profit was up 26% YoY (est. of +11%), driven by strong
-8/-23/11
loan growth, lower cost of funds and controlled opex.
124
66.2
n
After a muted 3Q, disbursements picked up 20% YoY to INR62.5b. As a
3 May 2017
4QFY17 Results Update | Sector: Financials
CMP: INR2,138
TP: INR2,689 (+26%)
Buy
Financials & Valuations (INR b)
Y/E March
2017 2018E
NII
28.9
33.7
PPP
17.6
21.0
PAT
5.6
8.6
EPS (INR)
84
130
EPS Gr. (%)
5
55
BV/Sh. (INR)
750
859
RoA (%)
2.7
3.6
RoE (%)
11.8
16.2
Payout (%)
23
17
Valuations
P/E (x)
25.3
16.4
P/BV (x)
2.9
2.5
Div. Yield (%)
0.7
0.8
2019E
39.5
n
24.8
10.9
165
26
n
997
3.9
17.8
16
13.0
2.1
n
1.0
n
result, AUM grew 18% YoY (+2.6% QoQ) to INR231b, driven by MSME
loans. Management continues to target 20%+ AUM growth in the non-
gold financing portfolio.
Total operating expenses declined 5% YoY/QoQ to INR2.8b, driven by a
9% decline in employee costs. Management is confident of improvement
in opex ratios in FY18/19 as the impact of the new MSME loan sourcing
strategy (under consultation with McKinsey) plays out.
Asset quality performed better than expectations. GNPL ratio of 6.73%
beat our estimate of 7.47%; however, write-offs were high at INR1.4b
(2.5% annualized). Collections, which dipped 9.9% in 3QFY17, improved
to 8.2% in the quarter. The company continues to make prudent
provisions on its NPLs, with PCR of 73% at the end of the quarter. Note
that SCUF’s PCR is best-in-class among our NBFC coverage companies.
Shriram Housing Finance, however, had a tough quarter with a decline in
disbursements (30% QoQ, 53% YoY) due to a difficult environment. The
company also sold loans (NPLs) worth INR500m to ARCIL, due to which
GNPL ratio improved 95bp QoQ to 2.6% (5.3% incl. sold-down loans).
Valuation and view:
SCUF is a niche play in the retail NBFC space with a
focus on MSME lending. Its business model offers high growth potential
with strong profitability. While we expect GNPL% to rise due to NPA
migration by FY18, we believe loan loss provisioning will decline as SCUF
has strong PCR of 73%. We believe this is a 3.5-4.0%+ RoA and 17-18%
RoE business on a run-rate basis. We keep our estimates largely
unchanged as lower opex in FY18/19 is offset by higher credit costs.
Buy
with a TP of INR2,689 (2.7x FY19E BVPS).
4 May 2017
12

Alembic Pharmaceuticals
BSE SENSEX
29,895
Bloomberg
Equity Shares (m)
M.Cap.(INRb)/(USDb)
52-Week Range (INR)
1, 6, 12 Rel. Per (%)
Avg Val, INRm
Free float (%)
Financials & Valuations (INR b)
Y/E MAR
Sales
EBITDA
NP
EPS (INR)
EPS Gro. (%)
BV/Sh. (INR)
RoE (%)
RoCE (%)
P/E (x)
P/BV (x)
EV/EBITDA(x)
2017
31.0
6.1
4.0
21.6
-43.5
100.3
23.1
22.0
28.0
6.0
18.4
2018E
36.2
7.5
4.9
26.0
20.7
120.3
23.6
22.6
23.2
5.0
15.2
2019E
42.3
9.2
6.1
32.1
23.3
146.4
24.1
23.3
18.8
4.1
12.2
n
S&P CNX
9,312
ALPM IN
189
117.9 / 1.8
709 / 518
-4/-19/-17
72
27.3
3 May 2017
4QFY17 Results Update | Sector: Healthcare
CMP: INR606
n
TP: INR640(+6%)
Neutral
Weak results; investment pay-off still some time away
4Q results below estimates:
Sales increased 17.8% YoY (-4% QoQ) to INR7.4b
(~7% below est.) due to muted growth in India business and lower-than-
expected growth in international formulations segment. EBITDA margin
contracted ~70bp QoQ to 18% due to high R&D expense (15% of sales). PAT
of INR930m was flat YoY and increased 8% QoQ (missed estimate due to
weak operating profit, partially offset by a lower tax rate of ~14%).
Domestic business to revive in FY18; approval rate in US to improve:
Domestic business delivered muted growth of 2.9% YoY, impacted by
demonetization and NLEM-related price control (~INR70-80m impact).
ALPM, however, expects growth to bounce back to low teens. International
business sales fell 10% QoQ due to competition in Abilify and limited new
launches (four launches in FY17). ANDA filing rate increased significantly,
with 10 filings in 4Q v/s 10 in 9MFY17 and historical run-rate of 6-8 filings. It
expects to launch 8-10 new ANDAs in FY18, which should help offset the
Abilify impact.
Concall takeaways:
(a) Capex for FY18 to be ~INR7b; (b) R&D expense to
remain high as ALPM plans to file ~100 ANDAs over next three years;
(c)
Oncology oral solids and injectable facilities to be operational by 1HFY18
end;
(d)
Onco injectable filing to start from 2HFY18;
(e)
General injectable
and Derma filings in the US to start from FY19;
(f)
ALPM is working on 40
Derma projects, of which 10-12 filings to happen by early-FY19;
(g)
Specialty
segment grew 13% in 4Q, while Acute segment declined 8%. Both segments
are expected to bounce back to industry-level growth.
Investments in niche areas to fetch return in medium term:
We believe
intensifying competition in Abilify, coupled with high R&D expense and a
rise in depreciation due to planned capex of INR7b, will keep profit growth
under check. We maintain
Neutral
with a TP of INR640 @20x FY19E EPS (v/s
INR630 @20x 1HFY19E EPS). We cut FY18E/FY19E EPS by 9%/10% as we
build high R&D expense and the impact of pricing pressure in the US.
(INR Million)
n
Estimate change
TP change
Rating change
n
Quarterly Performance (Consolidated)
4 May 2017
13

Parag Milk Foods
BSE SENSEX
29,921
S&P CNX
9,314
3 May 2017
Update
| Sector:
Consumer
CMP: INR239
TP: INR250 (+5% )
Neutral
Spate of new launches planned in a tough environment
High RM costs continue exerting pressure on earnings
We met management of Parag Milk Foods (PARAG) to get updates on its business
and future plans.
n
Procuremen cost still up, expected to come down by July-August:
Raw milk
prices are still high, increasing 3% between December 2016 and April 2017
(+20% YoY). The company is also facing shortage of milk, albeit manageable, as
aggregators have also started supplying to other players. PARAG follows a milk
procurement arrangement, wherein 80% is sourced directly and 20% from
aggregators. The company took a price hike of 8% across its portfolio in mid-
January (peers also took hikes of 7-8% but with a lag). However, we note that
price increases taken so far are not adequate, which could keep margins under
pressure. In our view, further price hikes (company is in process of taking
another ~6% hike, the timing of which is not decided yet) could cushion
margins to some extent, but have an adverse initial impact on volumes in a
downbeat consumption environment, especially if competitors follow suit with
a lag .
n
Sales look better after price hikes by competitors:
Liquid milk sales were good
in 4QFY17, while product sales were affected due to price increases taken
ahead of peers. April, however, seems to be better with competitors also
increasing prices. Mix continues to remain weak, impacted by higher
procurement in 3Q and then product volume weakness in 4Q. Besides this,
rural demand continues to be muted.
n
Strategy for recently launched whey protein brand
Avvatar:
The company is
targeting gyms, modern trade, dieticians and nutritionists for offline expansion
of this brand. It has already tied up with online platforms like Amazon. The
biggest differentiator for the product is the protein content (lower cost per
protein). It has 1.5-1.9x higher protein content compared to peers like ON. The
biggest test for PARAG will be to communicate the same to its channel
partners. To boost sales of this product, the company plans to conduct
programs for gym trainers. It will also try to make gyms as retail outlets rather
than just source of information. Management also claims that
Avvatar
tastes
better than other brands. The company had invested INR1.1b in its whey plant,
where it targets production of 4MT per day. Management targets INR750m of
sales from this product.
Stock Info
Bloomberg
Equity Shares (m)
52-Week Range (INR)
1, 6, 12 Rel. Per (%)
M.Cap. (INR b)
M.Cap. (USD b)
Avg Val, INRm
Free float (%)
PARAG IN
84.1
357 / 202
4 /-32 /-
20.1
0.3
120
52.5
Financials Snapshot (INR b)
FY17E FY18E FY19E
Y/E MARCH
17.3
19.9
23.8
Net Sales
0.8
1.5
2.2
EBITDA (INR b)
0.1
0.6
1.0
NP
0.8
6.9
12.5
EPS
-87.9 756.4
79.4
EPS Gr (%)
81.1
88.1 100.5
BV/Share (INR)
P/E (x)
293.7
34.3
19.1
P/BV (x)
2.9
2.7
2.4
RoE (%)
1.3
8.2
13.2
RoCE (%)
3.5
7.6
11.3
Shareholding pattern (%)
As On
Mar-17
Promoter
47.5
DII
2.3
FII
24.7
Others
25.6
Dec-16
47.5
4.0
27.4
21.1
FII Includes depository receipts
Stock Performance (1-year)
Parag Milk Foods
Sensex Rebased
350
320
290
260
230
200
4 May 2017
14

n
n
n
Distribution expansion and new launch plans for FY18:
The company plans to
adopt a three-pronged approach in distribution (increasing penetration in
current outlets, opening more outlets in present cities and adding new cities).
Ø
The company will be launching a new beverage brand
Slurp
within a month
to mark its foray into the fruit-based beverage market. The INR11b Indian
packaged juices market is projected to grow at a CAGR of ~15% over next
few years, as per Technopak. The product will be priced at INR20 (v/s INR15
for competing products).
Slurp’s
differentiating factors are: (a) presence of
pure Alphonso mangoes and (b) presence of dash of milk. Initially, the
company plans a pilot launch in four key cities. Management is targeting
INR750-800m sales from its flavored milk brand ‘Top-Up’ and ‘Slurp’ in FY18.
Ø
The company will also be launching a colostrum (milk produced by a cow
just before and after pregnancy)-based product this year in association with
a Swedish company. The technology and the brand will be of the Swedish
company. This premium product will be available at INR125 for a 25gm
sachet. Relationship with farmers, technology from the Swedish company
and knowhow to store the material are the key differentiating factors.
Ø
The company also has plans to enter the larger milk-based protein category
with its Avvatar brand (competing with Protinex and Nutralite).
Other takeaways:
(1) There has been a steep increase in YoY inventory for SMP
and cheese. There was an increase in debtor days in December (now back to
normal but still is slightly up YoY). Creditor days remain flat at ~100 on account
of packaging and other materials. Creditor days on milk procurement are ~15.
(2) Recovery of sales tax may take a year. (3) Expansion of cheese plant capacity
to 60MT from 40MT was completed in April.
Valuation and view:
Procurement costs remain high. While management has
taken a price increase in 4QFY17, we believe it is not adequate. Also, further
planned hikes are likely to have an adverse initial impact on volumes in a
downbeat consumption environment. Intense quarterly volatility is a negative
surprise that was revealed for the first time in the brief listing history of the
company. Moreover, there is uncertainty about the performance of the new
launch pipeline, particularly
Slurp
(it is almost entirely fruit juice and not
catering to PARAG’s core dairy products category). These launches, especially in
a muted demand environment, could also postpone RoCE improvement. We
maintain our target price of INR250 based on 20x Mar’19 EPS (35% discount to
FMCG sector multiple, given low RoE and high volatility). Maintain
Neutral.
4 May 2017
15

Automobiles
Bajaj Auto
CMP: INR2,905
Bloomberg
Equity Shares (m)
52-Week Range (INR)
1, 6, 12 Rel. Per (%)
Financial & Valuation (INR b)
Y/E MARCH
2017E 2018E
Sales
217.8 248.5
EBITDA
45.2 50.9
NP
38.7 44.8
Adj. EPS (INR) 133.7 154.8
EPS Gr. (%)
1.4 15.9
BV/Sh. (INR)
480.3 545.0
RoE (%)
29.5 30.2
RoCE (%)
28.8 29.4
Payout (%)
58.5 58.2
Valuation
P/E (x)
21.7 18.8
P/BV (x)
6.0
5.3
EV/EBITDA (x) 15.4 13.3
Div. Yield (%)
2.2
2.6
BJAUT IN
289.4
3122/2366
2/-6/0
Update | Sector: Automobiles
4 May 2017
TP: INR3,282 (+13%)
Buy
April volume above estimate at 330k; flat YoY
Domestic volume decline 21% YoY; while exports up 46% YoY
n
M.Cap. (INR b) / (USD b) 840.6/13.1
2019E
282.9
58.1
50.4
174.0
12.4
614.6
30.0
29.2
60.0
16.7
4.7
11.3
3.1
n
n
n
n
n
n
n
BJAUT’s April 2017 sales were 329,800 units (higher than our estimate of ~271,500),
flat YoY. Domestic volume declined by 21% YoY (+5% MoM) while exports grew by a
strong 46% YoY. Overall FY18 volume est. at 4.03m asking for a residual monthly run
rate of 336.3k units.
Domestic volumes declined 21% YoY to 177.9k units (v/s our estimate of 168.5k units).
On a MoM basis, domestic volumes grew 5%.
Motorcycle volumes grew by ~1% YoY. Domestic motorcycle sales declined 19% YoY to
161.9k; while there was a MoM recovery, YoY growth still continues to be under
pressure. Motorcycle exports grew by a strong 44% YoY. Domestic MC market decline
was led by preponement in March due to heavy discounts.
Dominar volume came in at 2k units, led by a good response for the product. Dominar
exports have also started with 1k units. Management is very positive on the brand
going forward.
3W volumes were the worst hit on demonetization impact. Domestic 3Ws declined by
38% YoY while 3W exports recovered back growing 59% YoY.
Export volumes grew 46% YoY (+48% MoM) at 151,913 units, an 18 month high, led by
strong growth in both MC and 3W segment. As per management on exports, “South
Asia, Nepal, and Bangladesh have done very well, Sri Lanka is still struggling, Africa has
stabilized, in fact this month of April, not much exports into Nigeria but still we could
make this number and Nigeria is again getting better with very good retails of almost
of about 16,000 units in two wheelers in the month of April.”
In May, BJAUT is looking at 3.5lac plus volume with recovery in domestic MC market
with 2lac plus volume.
The stock trades at 18.8x/16.7x FY18E/19E EPS. Maintain Buy.
Snapshot of volumes for Apr-17
YoY
Company Sales
Bajaj Auto
Motorcycles
Total Two-Wheelers
Three-Wheelers
Domestic
Exports
Apr-17
329,800
293,932
293,932
35,868
177,887
151,913
Apr-16
330,109
291,898
291,898
38,211
226,133
103,976
YoY (%)
chg
-0.1
0.7
0.7
-6.1
-21.3
46.1
MoM
MoM (%)
Mar-17
FY18 estimate
chg
272,197
21.2
4,029,646
244,235
20.3
3,561,327
244,235
20.3
3,561,327
27,962
28.3
468,319
169,279
5.1
2,511,190
102,918
47.6
1,518,456
Gr. (%)
9.9
10.6
10.6
5.0
11
7.6
Residual FY18 YTD
Residual
Monthly Monthly
Growth (%)
Run rate Run rate
10.9
11.6
11.6
6.0
15.0
4.5
336,350
297,036
297,036
39,314
212,118
124,231
329,800
293,932
293,932
35,868
177,887
151,913
4 May 2017
16

Unitech Automobiles
Stable utilization and freight rates augur well for demand
Discounts still high, though moderated from recent peaks
We had hosted Mr Tony Arora, Promoter, Unitech Automobiles. Unitech Automobiles is
one of the largest CV dealers (Tata Motors) in India. Mr Arora also has several other
business interests including logistics services, logistic parks, etc. Key takeaways:
n
Stable fleet utilization and stable freight rates augur well for CV demand recovery.
n
Discounts for trucks are currently ~INR0.25m, against ~INR0.3m in March 2017 and
peak of INR0.4-0.45m.
n
Post AL’s launch of exhaust gas recirculation (EGR)-based solution for BS-4 compliance,
TTMT has launched EGR-based BS-4 compliant trucks last week.
n
Spares and service could be a big opportunity for BS-4 trucks, given higher use of
electronics and sophisticated technology, which could restrict the ability of road-side
mechanics to repair BS-4 trucks.
Event Update | Sector: Automobiles
3 May 2017
Stable utilization and freight rates driving inquiries
n
n
n
Stable freight rates despite the fall in fuel prices over the past 2-3 quarters and
65-70% fleet utilization augurs well for fleet operators’ profitability.
Unitech Automobiles expects recovery in freight rates to pre-demonetization
levels, as the liquidity situation is now back to normal.
This should augur well for CV demand in the medium term.
Discounts still very high, though down from peak
n
n
n
The discount on trucks is presently at INR0.25m, down from INR0.3m in March
2017 and the peak of INR0.4-0.45m.
Ashok Leyland (AL) has garnered market share, with an aggressive approach and
better propositions like focus on single truck operators, improving reach in
North/East India and aggressive pricing.
Given their higher costs, MNC truck makers are no competition for the likes of
TTMT. Indian infrastructure is not suitable for the MNCs’ trucks. Hence, Unitech
Automobiles does not see any major threat from MNC truck makers.
Tata Motors has also launched EGR-based BS-4 vehicles
n
n
n
Jinesh Gandhi
(Jinesh@MotilalOswal.com)
+91 22 3982 5416
Jigar Shah
(Jigar.Shah@MotilalOswal.com)
+91 22 6129 1534
Tata Motors (TTMT) had initially launched BS-4 compliant vehicles based on
selective catalytic reduction (SCR), which is a widely used technology to comply
with BS-4 emission norms.
AL was the first to use exhaust gas recirculation (EGR) technology for
compliance, as it has the advantage of lower initial cost and operating cost.
Last week, TTMT too has launched EGR-based BS-4 compliant trucks, though
dealers are yet to receive the EGR-based products.
Availability of BS-4 vehicle is an issue
n
Unitech Automobiles has managed to clear off BS-3 inventory, with no
significant increase in discounts, as customers opted to pre-buy instead of
buying higher priced BS-4 trucks.
17
4 May 2017

n
n
n
Inquiries for BS-4 vehicles have been improving gradually, but supply issues due
to limited production are restricting sales of BS-4 vehicles.
The OEMs are sorting out issues related to education/training for repair and
maintenance of BS-4 vehicles by visiting workshops.
The average prices of BS-4 vehicles are higher by at least INR150k.
Repair and maintenance for BS-4 an opportunity for organized mechanics
n
n
n
Reliance on organized repair/maintenance shops would increase, as BS-4 trucks
use differentiated technology. To be able to repair and maintain BS-4 trucks,
mechanics require rigorous training.
Given that unorganized mechanics are less equipped with BS-4 technology
know-how, organized players stand to benefit due BS-4 migration.
Currently, 30-35% of the vehicles sold come to the dealers for repair and
maintenance.
Valuation and view
We believe CV demand will remain weak in the short term due to pre-buying in
March 2017, cost inflation of 12-15% (BS-4 and commodity price), and
implementation of GST from July 2017. We expect M&HCV volumes for the industry
to grow ~5% in FY18. These short-term challenges notwithstanding, we recommend
Ashok Leyland
as the best bet on the CV cycle. We also like its initiatives to reduce
dependence on the India truck business by diversifying into exports, LCVs, spares
and defense. We like Tata Motors for the strong recovery in JLR business.
4 May 2017
18

Balaji Telefilms
Testing new waters
Subscription-based digital foray – ALT Balaji
Established TV content provider
n
Event Update | Sector: Oil & Gas
3 May 2017
Scaling down high-risk movie business
n
Balaji Telefilms provides television programming to the top four GECs (Sony,
Star, Viacom and Zee). With ~10 shows weekly (~1,000 hours of programming in
FY16), the TV business has garnered ~20-25% market share of prime-time GECs.
The business generates revenues of ~INR2.5b (FY16), with ~10 prime-time
shows. It has ~10-15% annual growth potential, led by an increase in
programming hours, better pricing and content on national broadcaster
Doordarshan. Pricing is largely on cost-plus model, with ~INR2.5m/hour average
pricing on the back of an 18% EBITDA margin. Given Balaji’s good track record, it
commands ~20% premium to the market.
This segment has two movies in the WIP stage with investment of ~INR500-
600m, which is largely spent. These movies are scheduled to be released in Q1
and Q2 of FY18, releasing capital. Due to high volatility, the earlier ambitious
strategy of 8–10 movies a year has been curtailed. The movie business will see
limited capital allocation, with ~20% IRR target. Management is not planning
any new project, and will remain selective with green lighting projects. The
segment could see 1–2 projects yearly to attract talent.
Digital foray ‘ALT Balaji’ could drive growth
1. Launch of subscription-based digital platform:
ALT Balaji offering exclusive,
premium shows was launched in April 2017. It has come up with five exclusive
shows, with plans to roll out one show every fortnight. Thus, the platform would
feature ~32 exclusive shows every year, with ~250 hours of content. Until now,
the company was engaged in content production with no connect to end-
consumer and no IP ownership (which is owned by the broadcaster). Digital
provides an opportunity to break this cycle and own consumer/content IP,
creating a B2C entertainment company.
2. Bridging content gap of ~25m premium household market:
Of 165m
households, ~25m are already paying INR1,000-2,000/month on entertainment,
telecom and internet. Average INR600/month leaves an INR180b opportunity.
ALT Balaji value proposition is to address the content gap in the market where
TV shows largely cater to housewives and online content is largely a re-run. The
platform is positioned as a leading GEC for digital audience. In the digital space,
most TV players offer catch-up TV, while other ad-based players provide limited
content. Moreover, the likes of Amazon and Netflix have limited Indian content
and are highly expensive.
3.
Testing the S-VOD model:
The company plans to adopt subscription model at
~INR60-90/month, reaching a subscriber base of 4m by FY20 and thus breaking
even in the same year. We believe the subscription model may be tested, given
limited consumer interest toward paid content in an Indian context (it is
successful internationally though). However, ad model or bundling model could
see healthy traction, with high competition in the telecom, ecommerce and
19
Aliasgar Shakir
(Aliasgar.Shakir@MotilalOswal.com)
+91 22 3982 5423
4 May 2017

handset market mitigating investment risk, and the company tying up with
certain players to address this issue.
4. Investment of INR3b over three years:
Balaji has earmarked investment of
~INR3b in the venture over three years (INR1b annually). Of this, ~75% will go
toward content creation, while the rest will be toward marketing. Additional
~INR500m variable cost could be required toward technology and other
overheads. It has ~INR2.30b of cash balance (INR1.5b raised through US-based
funds for digital venture), and additional INR700m will be generated from
internal accruals of the TV business. Distribution will be through four routes: 1)
subscription model through “Balaji ALT” app. 2) Handset bundling (Mircomax,
others). 3) E-commerce bundling (like Amazon Prime). 4) Telco/ISP platform
bundling (Airtel Wync, Jio Play).
Core TV business to grow at 10-15%; Digital biz – the dark horse
n
In FY18, existing TV business could see ~10-15% revenue/EBITDA growth, with
EBITDA of ~INR 450m and PAT of ~INR350m as per company expectation on
standalone basis (excluding movie business).
RoC profile – TV business RoCE at 25%, but overall subdued
n
TV business records ~25-30% RoCE, with INR300m EBIT and INR1.2b capital
employed. However, overall RoCE is depressed at 7% due to ~INR3b in WIP
toward the movie and digital businesses, which will generate revenues in FY18.
The current productive asset is meager INR1.2b (25% of total balance sheet size)
due to investment in ALT Balaji and the movie business. This makes capital
allocation highly critical for the company.
Valuation and view
n
Trading at P/E of 23x on FY18E standalone basis as per company expectation.
This does not include any incremental profits from movie/digital businesses with
~INR3-3.5b CWIP in FY18E, which could be an additional option value.
4 May 2017
20

Event Update | Sector: Oil & Gas
3 May 2017
Unison
Developing CGD infrastructure in Ratnagiri
Unison, an unlisted subsidiary of Ashoka Buildcon, recently won the CGD license
for Ratnagiri.
Difficult terrain makes a case for virtual infrastructure
The hilly terrain makes laying of pipelines a challenge. Unison plans to use type-IV
cascades and lay pipelines only for last mile connectivity. Though cascades are
expensive, using type-IV cascades would reduce costs. The company would also get
gas at a higher pressure (49bar) than other CGD companies (18bar), eliminating
compression cost. Right of Usage charges in Ratnagiri are also much lower than in
the National Capital Region or in Mumbai. The parent’s experience in infrastructure
would come handy in laying of pipelines.
CNG segment offers potential
A total of ~20,000 auto-rickshaws ply in the city. At 3kg/day, this would result in a
demand for 0.08mmscmd of CNG. Besides, a CNG station at Ratnagiri also makes
CNG an option for vehicles plying on the Mumbai-Goa highway. Unison has signed
an agreement with GAIL for supply of gas for CNG and PNG-residential. Its first CNG
outlet is expected to come up by October 2017.
PNG-industrial has immense potential
Unison is in the process of signing contracts for a total of ~10,000scmd with two
large consumers in the Parshuram Lote industrial area. The Indian Railways is also
coming up with a locomotive workshop at Lote. Supply agreements for LNG have
been finalized with IOCL. If the mega refinery comes up at Ratnagiri, it would result
in an exponential growth in demand for gas from industries.
Long-term prospects
Swarnendu Bhushan
(Swarnendu .Bhushan@MotilalOswal.com)
+91 22 3982 5432
Abhinil Dahiwale
(
Abhinil.Dahiwale@MotilalOswal.com
)
+91 22 3980 4309
Unison expects a peak of 0.15mmscmd in five years and a peak of ~4mmscmd
eventually. Initially, the capex would be INR500m per year for three years.
Approvals have been coming much faster in the last few years. This has helped CGD
companies greatly in laying of infrastructure. Allocation of domestic gas for CNG and
PNG-residential has been a great boost for the sector. The company sees great
potential for CGD companies in India and looks forward to both organic as well as
inorganic growth in the future.
4 May 2017
21

Tiger Logistics
Pure FCL player in India
n
Event Update | Sector: Oil & Gas
3 May 2017
n
Tiger Logistics is one of India’s leading providers of end-to-end supply chain
solutions. It operates as a full container load (FCL) freight forwarder focused
on the international market, a transportation provider and a custom house
clearing agent (CHA) for domestic clients.
Freight forwarding business contributes ~55% of total revenue, followed by
transportation services (~25%) and CHA services (~20%).
The company operates on an asset light business model. It leases fleet on need
basis from third-party fleet operators, and has a small proportion of fleet on its
own books.
This enables it to focus on improving working capital efficiency rather than asset
creation, generating superior returns. In a low-demand phase, its asset light
model allows it to generate better profits compared to peers.
The company operates as an international freight forwarder for domestic
clients, with majority of business generated from international logistics.
Management sees huge potential in the domestic market and has charted
expansion plans in India. The company plans to expand its business in the south
and east regions by opening four branches.
It intends to leverage its existing network and infrastructure to enter the
domestic logistics segment and be part of the less-than-container-load (LCL)
segment in India.
The company currently operates as an international freight forwarder for
domestic clients with majority of business generated from export logistics.
In an attempt to increase the share of the import logistics business, the
company has opened offices in Dubai and Singapore.
Defense logistics contributes ~10% of overall revenues for the company.
Management sees huge potential for defense logistics, given the government’s
thrust and increased spending toward defense.
Asset light business model
n
n
Focus on domestic markets
n
n
n
Import share to increase
n
n
Defense logistics – a key business
n
Abhishek Ghosh
(Abhishek.Ghosh@MotilalOswal.com)
+91 22 3982 5436
Abhinil Dahiwale
(
Abhinil.Dahiwale@MotilalOswal.com
)
+91 22 3980 4309
4 May 2017
22

March 2017 Results Preview | Consumer
Emami
Bloomberg
Equity Shares (m)
M. Cap. (INR b)/(USD b)
52-Week Range (INR)
1,6,12 Rel Perf. (%)
HMN IN
227.0
236 / 4
1261 / 916
-4 / -17 / -9
n
CMP: INR1,038 TP: INR1,295 (+25%)
n
Buy
We project Emami’s (HMN) sales to decline 2% YoY to INR5.9b,
with ~4% volumes decline.
We expect gross margin to contract 50bp to 63.1% and EBITDA
margin to shrink 30bp to 30.3%. Thus, EBITDA is likely to decline
2.9% YoY to INR1.8b.
PAT is expected to decline 35.6% YoY to INR1b due to a high tax
rate of 38.2% (full year tax rate taken at MAT) compared to 5.2%
in base quarter 4QFY16.
The stock trades at 28.8x FY19E EPS of INR36; maintain
Buy.
Financial Snapshot (INR b)
Y/E March
2016 2017E 2018E 2019E
Sales
EBITDA
NP
EPS (INR)
EPS Gr. (%)
BV/Sh. (INR)
RoE (%)
RoCE (%)
Payout (%)
Valuations
P/E (x)
P/BV (x)
EV/EBITDA (x)
Div. Yld (%)
41.2
16.8
35.2
0.8
42.4
12.5
31.1
1.1
34.8
10.6
27.0
1.2
28.8
8.7
22.7
1.2
23.9
6.8
5.7
25.2
17.7
61.8
43.4
37.9
27.9
25.4
7.6
5.6
24.5
-2.9
82.8
33.8
31.5
45.0
29.1
8.6
6.8
29.8
22.0
33.0
35.0
40.2
33.8
10.1
8.2
36.0
20.6
33.2
38.7
33.3
n
n
97.8 118.9
Key issues to watch for:
Ø
Volume growth and broad consumer demand across categories.
Ø
Outlook for mentha oil prices.
Ø
Competitive intensity, especially from Patanjali.
Quarterly Performance
Y/E MARCH
1Q
Domestic volume Growth (%)
Net Sales
YoY Change (%)
COGS
Gross Profit
Gross margin (%)
Other Expenditure
% to sales
EBITDA
Margins (%)
YoY Change
Depreciation
Interest
Other Income
PBT
Tax
Rate (%)
PAT
YoY Change (%)
Amortization
Reported PAT
E: MOSL Estimates
15.0
5,372
2,114
3,258
60.6
2,271
42.3
987
18.4
88
44
187
1,041
42
4.0
996
137
866
FY16
2Q
13.5
5,306
1,783
3,523
66.4
2,001
37.7
1,523
28.7
92
192
122
1,361
139
10.2
1,219
620
631
3Q
9.3
7,249
2,417
4,831
66.6
2,337
32.2
2,494
34.4
99
172
53
2,276
320
14.0
1,953
617
1,367
-17%
4Q
18.0
6,026
2,193
3,833
63.6
1,992
33.1
1,841
30.6
169
136
88
1,623
87
5.4
1,541
727
850
1Q
18.0
6,444
19.9
2,287
4,157
64.5
2,684
41.7
1,473
22.9
49.2
106
125
51
1,292
117
9.1
1,175
18.0
609
596
FY17
2Q
11.0
5,846
10.2
1,929
3,916
67.0
2,164
37.0
1,752
30.0
15.1
111
160
87
1,568
230
14.7
1,336
9.6
680
690
3Q
0.2
7,260
0.2
2,331
4,928
67.9
2,343
32.3
2,585
35.6
3.7
112
127
82
2,428
381
15.7
2,046
4.8
705
1,377
4QE
-4.0
5,898
-2.1
2,174
3,724
63.1
1,937
32.8
1,787
30.3
-2.9
164
104
86
1,605
614
38.2
992
-35.6
606
385
(INR Million)
FY16
FY17E
14.0
23,937
8.0
8,513
15,424
64.4
8,580
35.8
6,844
28.6
26.7
450
543
449
6,301
459
7.3
5,841
20.7
2,100
3,741
6.5
25,447
6.3
8,722
16,725
65.7
9,128
35.9
7,597
29.9
11.0
493
516
305
6,894
1,341
19.5
5,552
-4.9
2,600
2,952
4 May 2017
23

March 2017 Results Preview | Automobiles
Exide Industries
Bloomberg
Equity Shares (m)
M. Cap. (INR b)/(USD b)
52-Week Range (INR)
1,6,12 Rel Perf. (%)
EXID IN
850.0
194 / 3
232 / 130
4 / 11 / 49
CMP: INR230
TP:INR270 (+17%)
Buy
Financial Snapshot (INR b)
Y/E MARCH
2016 2017E 2018E 2019E
Net Sales
EBITDA
Adj. PAT
Adj. EPS (INR)
EPS Gr. (%)
BV/Sh. (INR)
RoE (%)
RoCE (%)
Payout (%)
Valuations
P/E (x)
P/BV (x)
EV/EBITDA (x)
Div. Yield (%)
30.5
4.3
16.1
1.1
26.8
3.9
14.5
1.0
22.9
3.4
12.4
1.0
18.9
3.0
9.9
1.0
68.4
10.3
6.3
7.4
14.8
52.2
14.1
14.6
32.5
76.5
11.4
7.1
8.4
13.9
58.0
14.5
15.0
26.2
86.3
13.1
8.3
9.8
16.7
65.2
15.0
15.7
22.4
98.8
15.4
10.1
11.9
21.5
74.6
16.0
16.8
18.5
n
We expect net revenue to grow 13% YoY (+15% QoQ) to INR19.9b
as better replacement demand recovery post demonetization and
higher OEM demand too.
n
EBITDA margin is likely to remain flat YoY (+180bp QoQ) to 15.1%
as replacement price has been increased by 10% from Nov 16 to
Mar 17 due to increase in Lead prices.
n
Lead prices have gone down by ~4% QoQ in 3QFY17, the effect of
which will be reflected in 4Q raw material costs.
n
EBITDA is estimated to increase 13.5% YoY (+31% QoQ) to
~INR3b.
n
PAT is likely to increase by 4% YoY (+22% QoQ) to INR1.9b led by
lower other income, higher depreciation and higher tax rate.
n
The stock trades at 23.3x FY18E and 19.2x FY19E EPS; We have
increased the multiple to 20x from 18x reducing discount to 20%
to Amara Raja lead by corrective actions taken by management
and maintain
Buy.
Key issues to watch
Ø
Update on demand environment for OEMs, auto replacement and
industrial battery segments post demonetization.
Ø
Update on market share in autos and non-autos.
Ø
Outlook for raw material cost trend, recent pricing action and currency
hedges, if any.
Ø
Update on technological upgradation.
Ø
Update on capacity expansion plans across product segments.
S/A Quarterly Performance
Y/E March
Net Sales
Growth YoY (%)
RM(%)
Employee cost (%)
Other Exp(%)
EBITDA
EBITDA Margin(%)
Change (%)
Non-Operating Income
Interest
Depreciation
PBT after EO Exp
Effective Tax Rate (%)
Adj. PAT
Change (%)
E: MOSL Estimates
1Q
18,064
-5.4
64.2
6.1
15.1
2,655
14.7
-8.8
31
2
362
2,322
32.9
1,557
-16.0
FY16
2Q
17,442
-0.9
62.2
6.7
16.5
2,553
14.6
22.9
84
0
378
2,259
31.4
1,551
23.3
3Q
15,327
-1.5
59.7
7.6
17.1
2,392
15.6
32.7
75
1
400
2,065
33.0
1,385
42.4
4Q
17,605
7.0
61.0
7.0
17.0
2,652
15.0
11.3
226
0
439
2,439
27.2
1,776
29.1
1Q
20,081
11.2
62.4
6.4
15.5
3,150
15.7
18.6
143
17
491
2,784
29.6
1,961
25.9
FY17
2Q
19,233
10.3
61.1
6.8
16.9
2,927
15.2
14.7
190
6
506
2,606
30.4
1,813
16.9
FY16
3Q
17,253
12.6
60.0
7.4
19.3
2,296
13.3
-4.0
350
46
522
2,079
27.1
1,515
9.4
4QE
19,913
13.1
60.7
6.7
17.5
3,009
15.1
13.5
155
-39
543
2,661
30.4
1,853
4.3
68,437
-0.3
61.8
6.8
16.4
10,251
14.9
12.2
416
3
1,579
9,085
31.0
6,269
14.8
FY17E
76,480
11.8
61.1
6.8
17.2
11,382
14.8
11.0
839
30
2,061
10,129
29.5
7,141
13.9
4 May 2017
24

HDFC Bank
Bloomberg
Equity Shares (m)
M. Cap. (INR b)/(USD b)
52-Week Range (INR)
1,6,12 Rel Perf. (%)
HDFCB IN
2555.4
3663 / 56
1478 / 1043
0 / 5 / 15
CMP: INR1,433
TP: INR1,670 (+16%)
Buy
Financial Snapshot (INR b)
Y/E MARCH
2016 2017E 2018E 2019E
NII
275.9 326.1 382.4 452.3
OP
213.6 251.0 295.5 351.3
NP
123.0 144.6 170.4 201.8
NIM (%)
4.7
4.7
4.6
4.5
EPS (INR)
48.6
56.6
68.3
81.5
EPS Gr. (%)
19.3
16.3
17.9
18.4
BV/Sh. (INR)
287 327.7 380.1 442.6
ABV/Sh. (INR)
284 323.6 373.2 430.8
RoE (%)
18.3
18.5
19.3
19.8
RoA (%)
1.9
1.9
1.8
1.8
Payout (%)
22.9
23.4
23.4
23.4
Valuations
P/E(X)
29.6
25.5
21.6
18.2
P/BV (X)
5.0
4.4
3.8
3.3
P/ABV (X)
5.1
4.5
3.9
3.3
Div. Yield (%)
0.7
0.8
0.9
1.1
n
Loan growth will be moderate at 12% YoY, in line with the
moderate growth environment in the system (still ~2x system
growth). We expect healthy deposit growth of ~18% YoY led by
strong CASA inflows in 3Q, despite USD3b of FCNR (B) redemption
n
Despite pressure on yields, COF decline would help HDFCB to
report stable NIM QoQ at 4.5%. NII is expected to grow at 14%
YoY.
n
Opex growth would largely be in line with growth in total income
at ~16% YoY. Hence, C/I ratio would remain stable QoQ.
n
Moderate PPoP growth would lead to 16% YoY PAT growth, lower
than the trend rate of 20%. Asset quality trends would remain
stable with GNPAs at ~1%.
n
HDFCB trades at 3.3x FY19E BV and 18.2x FY19E EPS. Comfort on
earnings (~18% CAGR over FY16-19) remains high. Maintain
Buy.
Key issues to watch for
Ø
Performance in retail loan/SME portfolio—especially in segments like
CV/CE.
Ø
Trends in digital banking/payment industry and various initiatives by
the bank.
Ø
Overall B/S growth outlook and economic recovery.
Quarterly Performance
Net Interest Income
% Change (Y-o-Y)
Other Income
Net Income
Operating Expenses
Operating Profit
% Change (Y-o-Y)
Other Provisions
Profit before Tax
Tax Provisions
Net Profit
% Change (Y-o-Y)
Operating Parameters
NIM (Reported,%)*
4.3
4.2
4.3
4.3
Deposit Growth (%)
30.1
29.7
26.5
21.2
Loan Growth (%)
22.4
27.9
25.7
27.1
CD Ratio (%)
78.9
82.6
83.3
85.0
CASA Ratio (%)
39.6
39.7
40.0
43.2
Asset Quality
OSRL (INR B)
3.8
4.2
4.4
4.6
OSRL (%)
0.1
0.1
0.1
0.1
Gross NPA (INR B)
38.5
38.3
42.6
43.9
Gross NPA (%)
1.0
0.9
1.0
0.9
E: MOSL Estimates; * Reported on total assets; # Cal. on interest earning assets
1Q
63,888
23.5
24,619
88,507
40,008
48,499
26.2
7,280
41,219
14,262
26,957
20.7
FY16
2Q
66,809
21.2
25,518
92,327
41,898
50,429
24.2
6,813
43,616
14,922
28,695
20.5
3Q
70,685
24.0
28,722
99,407
42,048
57,359
20.0
6,539
50,820
17,251
33,568
20.1
4Q
74,533
24.0
28,659
103,192
45,843
57,349
21.5
6,625
50,725
16,982
33,742
20.2
1Q
77,814
21.8
28,066
105,881
47,689
58,192
20.0
8,667
49,525
17,136
32,389
20.2
4.4
18.5
23.2
82.0
39.9
4.7
0.1
49.2
1.0
FY17E
2Q
3Q
79,936
83,091
19.6
17.6
29,010
31,427
108,945 114,518
48,700
48,425
60,246
66,093
19.5
15.2
7,490
7,158
52,756
58,935
18,202
20,281
34,553
38,653
20.4
15.1
4.2
16.7
18.1
83.6
40.4
4.9
0.1
50.7
1.0
4.1
21.1
13.4
78.0
45.4
5.0
0.1
52.3
1.1
4QE
85,213
14.3
34,266
119,479
53,006
66,473
15.9
7,478
58,994
20,023
38,972
15.5
(INR Million)
FY16
275,915
23.2
107,517
383,432
169,797
213,635
22.7
27,256
186,379
63,417
122,962
20.4
4.3
21.2
27.1
85.0
43.2
4.6
0.1
43.9
0.9
FY17E
326,054
18.2
122,768
448,822
197,820
251,002
17.5
30,793
220,209
75,642
144,567
17.6
18.0
12.0
80.7
18.0
12.0
80.7
54.3
1.0
0.0
0.0
54.3
1.0
4 May 2017
25

March 2017 Results Preview | Sector: Technology
L&T Infotech
Bloomberg
Equity Shares (m)
M. Cap. (INR b)/(USD b)
52-Week Range (INR)
1,6,12 Rel Perf. (%)
Financial Snapshot (INR b)
y/e march
2016 2017E
Sales
EBITDA
PAT
EPS (INR)
EPS Gr. (%)
BV/Sh.
(INR)
RoE (%)
RoCE (%)
Payout (%)
Valuation
P/E (x)
P/BV (x)
EV/EBITDA
(x)
Div Yld (%)
13.6
6.2
11.9
4.4
13.3
5.0
9.9
3.0
12.3
4.1
9.4
3.3
11.7
3.5
8.6
3.4
58.5
10.4
9.2
52.4
21.5
115.6
45.3
39.9
59.6
64.8
12.1
9.4
53.6
2.3
143.5
41.4
44.3
40.0
LTI IN
170.5
123 / 2
725 / 595
-1/-11/-
CMP: INR711
TP: INR800 (+12%)
Buy
2018E
70.7
12.5
10.2
58.0
8.2
173.7
36.6
36.4
40.0
2019E
77.6
13.3
10.6
60.8
4.8
205.3
32.1
33.7
40.0
n
LTI saw revenue growth of 3.8% QoQ CC despite 3Q being a
seasonally weak quarter. This was largely attributed to the ramp-
up of deals won earlier during the year.
n
Led by the higher base, and expectations of new ramp-ups
beginning in FY18, we expect CC growth of 1.3% QoQ. A 40bp
tailwind during the quarter would result in 1.7% USD revenue
growth.
n
Expect 20bp expansion in EBITDA margin to 18.3% as 3Q was
negatively impacted by seasonality and increased share of India in
the overall portfolio. This would be partly offset by INR
appreciation and continued investments in the business.
n
Our PAT estimate for the quarter is INR2.2b, which implies 10.5%
QoQ decline, largely led by translation losses offsetting hedge
gains and resulting in lower other income.
n
The stock trades at 12.3x FY18E and 11.7x FY19E earnings.
Neutral.
Key issues to watch for
Ø
Deal wins and ramp-up schedule for FY18.
Ø
Margin trajectory, going forward, given the increased investments.
Ø
Growth in Digital.
Quarterly Performance
Y/E March
Revenue (USD m)
QoQ (%)
Revenue (INR m)
YoY (%)
GPM (%)
SGA (%)
EBITDA
EBITDA Margin (%)
EBIT Margin (%)
Other income
ETR (%)
PAT
QoQ (%)
YoY (%)
EPS (INR)
Headcount
Util incl. trainees (%)
Attrition (%)
Offshore rev. (%)
E: MOSL Estimates
1Q
209
0.0
13,332
14.5
34.0
18.5
2,068
15.5
12.2
512
18.2
1,746
-21.2
7.5
10.0
20,331
73.8
20.1
51.9
FY16
2Q
3Q
224
225
7.3
0.5
14,682
14,870
18.7
12.4
34.5
36.4
17.9
16.8
2,431
2,914
16.6
19.6
13.6
16.7
532
285
24.4
18.8
1,917
2,245
9.8
17.1
7.2
12.5
11.0
12.8
22,689
22,477
72.8
74.0
19.7
18.5
51.7
51.3
4Q
230
2.1
15,939
20.5
35.0
14.9
3,204
20.1
17.4
500
19.2
2,644
17.8
19.4
15.1
20,072
75.9
18.4
52.4
1Q
231
0.6
15,550
16.6
35.3
15.7
3,050
19.6
16.9
372
21.2
2,359
-10.8
35.1
13.5
19,292
77.4
19.5
51.9
FY17E
2Q
3Q
240
245
3.7
2.3
16,020
16,667
9.1
12.1
35.4
34.3
16.4
16.2
3,044
3,018
19.0
18.1
16.1
15.3
365
598
21.0
21.2
2,326
2,480
-1.4
6.6
21.3
10.5
13.3
14.2
21,074
21,976
78.7
78.1
18.5
18.1
51.2
52.3
FY16
4QE
249
1.7
16,605
4.2
34.3
16.0
3,035
18.3
15.3
261
21.0
2,219
-10.5
-16.1
12.7
22,246
76.0
52.7
887
9.5
58,471
17.5
33.5
15.8
10,359
17.7
14.7
2,802
19.7
9,171
21.5
52.4
20,072
73.8
49.7
(INR m)
FY17E
965
8.8
64,842
10.9
34.8
16.1
12,147
18.7
15.9
1,596
21.1
9,384
2.3
53.6
22,246
77.5
52.0
4 May 2017
26

March 2017 Results Preview | Sector: Others
MCX
Bloomberg
Equity Shares (m)
M. Cap. (INR b)/(USD b)
52-Week Range (INR)
1,6,12 Rel Perf. (%)
MCX IN
51.0
60 / 1
1420 / 814
2 / -16 / 23
CMP: INR1,186 TP: 1,400 (+18%)
n
n
Buy
Financial Snapshot (INR Billion)
y/e Mar
2016 2017E 2018E 2019E
Sales
EBITDA
PAT
EPS (INR)
EPS Gr. (%)
BV/Sh. (INR)
RoE (%)
RoCE (%)
Payout (%)
Valuation
P/E (x)
P/BV (x)
EV/EBITDA (x)
50.9
5.0
85.8
45.2
4.6
75.2
39.7
4.4
49.2
28.0
4.0
26.5
2.1
0.6
0.4
23.4
-5.0
3.5
8.8
0.0
2.4
0.6
1.3
26.3
12.7
10.6
10.4
69.0
2.8
1.0
1.6
30.0
13.9
11.3
11.1
80.6
3.7
1.8
2.2
42.5
41.9
15.0
14.8
56.8
n
n
n
236.1 257.8 273.0 294.7
n
n
Total volumes at MCX traded during the quarter stood at
INR12.4t, down 10.3% QoQ and up 16.5% YoY.
Volumes at MCX have been severely impacted post
demonetization. Gold volumes in 4QFY17 are down 10.9% QoQ
and 51.3% YoY.
However, MCX had taken a 25% price hike last quarter. This drives
our revenue growth estimate of -9.5% QoQ/+3.3% YoY.
Our EBIT margin estimate for the quarter is 14.4%, down 70bp
QoQ and compares with 14.8% in 4QFY16.
There were several one-off costs in 3Q, which we expect to be
absent in 4Q; leading to some support on margins despite the
volume decline.
One-off costs of ~INR50m in 3Q included three quarter’s charge
on variable compensation for employees, revamp of website, shift
of premises and one-time audit undertaken on the advice of SEBI.
Our PAT estimate is INR296m, down 12.8% QoQ and up 3.0% YoY.
Key issues to watch for
Ø
Any move to enter the commodities space by potential competitors
like NSE
Ø
Expectations of volume revival
Ø
Pace of reforms under SEBI
Quarterly Performance
Y/E March
Sales
Q-o-Q Gr. (%)
Staff Costs
Other expenses
Depreciation
EBIT
Margins (%)
Other Income
PBT bef. Exceptional
Tax
Rate (%)
PAT
Q-o-Q Gr. (%)
EPS (INR)
Total volumes (INR t)
Q-o-Q Gr. (%)
Y-o-Y Gr. (%)
E: MOSL Estimates
1Q
518
-1.8
90
282
63
83
16.1
300
382
131
34.3
251
-49.0
4.9
13.6
-3.5
15.4
FY16
2Q
563
8.8
109
318
65
71
12.7
338
409
99
24.2
310
23.5
6.1
14.8
9.2
18.5
3Q
498
-11.6
100
264
64
70
14.0
276
346
110
31.8
236
-24.0
3.5
13.0
-12.0
-3.3
4Q
556
11.6
106
313
54
82
14.8
278
360
72
20.1
287
21.8
5.3
14.9
14.3
5.9
1Q
582
16.9
143
265
49
125
21.5
356
480
152
31.7
328
14.1
6.5
16.0
7.3
17.7
FY17E
2Q
596
7.1
144
257
42
152
25.6
359
511
134
26.3
376
14.8
7.4
16.4
2.3
10.3
FY16
(INR m)
FY17E
3Q
634
6.5
198
296
45
96
15.1
363
459
119
26.0
339
-9.9
6.7
13.9
-15.2
6.4
4Q
574
-9.5
163
284
45
83
14.4
313
395
99
25.0
296
-12.8
5.8
12.4
-10.3
-16.5
2,135
4.8
406
986
246
498
23.3
1,191
1,689
413
24.4
1,277
2.1
25.0
56.3
8.7
2,386
11.8
647
1,058
182
499
20.9
1,390
1,888
505
26.7
1,383
230.7
27.1
58.7
4.1
4 May 2017
27

March 2017 Results Preview | Sector: Telecom
Tata Communications
Bloomberg
Equity Shares (m)
M. Cap. (INR b)/(USD b)
52-Week Range (INR)
1,6,12 Rel Perf. (%)
Financial Snapshot (INR Million)
Y/E March
Sales
EBITDA
NP
EPS (Rs)
EPS Gr. (%)
BV/Sh (INR)
RoE (%)
RoCE (%)
RoIC (%)
Valuations
P/E (x)
P/BV (x)
EV/EBITDA
(x)
EV/Sales (x)
471.5 118.2
-49.9
10.7
1.6
-73.1
10.7
1.6
28.6
47.1
9.4
1.5
16.6
12.3
7.0
1.3
2016
31.0
0.4
1.6
-14.7
-91.6
0.9
1.0
2017
27.2
1.8
6.2
-10.0
-50.2
2.9
3.8
2018E
187.4
30.2
7.3
25.6
312.8
15.6
924.0
8.7
14.1
2019E
201.0
38.6
12.6
44.1
72.6
59.7
117.3
12.9
23.3
205.5 183.6
TCOM IN
285.0
207 / 3
784 / 373
-6 / 13 / 68
CMP: INR727
TP: INR811 (+12%)
Buy
Tata Communications’ core revenue is expected to grow by a
meager 1% to INR44.6b.
Data revenue should grow 1.9% to INR28.2b, adjusting for the
impact of sale of data center business.
Core EBITDA is likely to grow 6% to INR6.3b on the back of 60bp
improvement in EBITDA margin to 14%.
Data segment is expected to grow 5% to INR5.3b, led by 70bp
improvement in data EBITDA margin to 19%.
The stock trades at an EV/EBITDA of 10.7x FY17E and 9.4x FY18E.
1,986.6 298.9
Key monitorables
Data revenue performance (we expect 5% QoQ growth).
Data EBITDA margin (we expect ~70bp QoQ improvement).
Cons. Quarterly Performance
Y/E March
Net Sales
YoY Change (%)
Total Expenditure
EBITDA
Margins (%)
Depreciation
Interest
Other Income
PBT before EO expense
Extra-Ord expense
PBT
Tax
Rate (%)
MI & Profit/Loss of Asso. Cos.
Reported PAT
Adj PAT
YoY Change (%)
Margins (%)
1Q
51,796
1.3
44,505
7,291
14.1
4,888
1,966
930
1,367
0
1,367
931
68.1
3
433
433
-302.5
0.8
FY16
2Q
3Q
51,301 50,995
1.2
3.8
43,580 43,397
7,720 7,598
15.0
14.9
5,694 5,908
1,756 1,730
791
108
1,061
69
0
0
1,061
998
94.1
3
60
60
-93.5
0.1
69
-154
-224.1
3
219
219
-79.8
0.4
4Q
51,452
6.9
43,343
8,109
15.8
7,259
1,689
1,028
190
1,928
-1,738
695
-40.0
5
-2,438
261
-78.8
0.5
1Q
50,317
-2.9
41,690
8,627
17.1
5,378
1,721
608
2,136
920
FY17
2Q
3Q
45,091 43,601
-12.1
-14.5
38,466 37,910
6,625 5,691
14.7
13.1
4,644 4,677
960
999
728
909
1,750
924
0
0
924
923
99.9
-7
7
7
-96.6
0.0
4QE
44,554
-13.4
38,300
6,254
14.0
4,669
1,749
428
264
0
264
87
33.0
3
174
174
-33.4
0.4
(INR Million)
FY16
FY17E
205,539
3.2
174,562
30,978
15.1
22,166
7,191
2,958
4,578
1,928
2,650
2,386
90.0
14
250
443
1,986.6
0.2
183,563
-10.7
156,366
27,197
14.8
19,368
5,429
2,673
5,073
920
4,153
2,701
65.0
8
1,444
1,766
298.9
1.0
1,216
1,750
793
899
65.2
51.4
6
6
418
845
738
845
70.5 1,303.7
1.5
1.9
4 May 2017
28

In conversation
1. RBL Bank: will try to maintain growth rate at 30-35% till 2020;
Vishwavir Ahuja, MD & CEO
n
n
n
n
n
Our general long-term guidance is to grow between 30-35% every year and
based on our vision 2020, should try and maintain annual growth rate in that
range.
Bank’s growth is planned on the basis of an organic strategy across multiple
business segments. Thinking to raise capital in Q2 of FY18.
The average NIMS for the year is close to 3.4%, expect to maintain margins in
that range as well to maintain a very strong growth trajectory.
All the business segments are growing nicely and we are seeing good strong
organic momentum based on the platforms.
The products and the services and the distribution architecture created across
the country is giving further support to the growth trajectory of our franchise.
2. Marico: Expect double-digit constant currency growth in
international business in FY18; Saugata Gupta, MD & CEO
n
n
n
n
In the overall international business we should be getting double digit constant
currency growth in the current fiscal.
Having said that, while GST will lead to far more long-term advantages in terms
of both the economy for the consumer as well as for organised players, in the
immediate term, there would be some kind of a transition hiccup which could
happen in the first half of the year.
As far as the second half is concerned, we already have a low base of
demonetisation in Q3, so overall, we will continue to gun for 8-10 percent.
As far India business is concerned, before the pre-allocation of corporate costs,
a 20% plus kind of a number is what we believe is the best in terms of optimal
number to maximise volume growth and market share.
3. Bajaj Auto: Cautiously optimistic on exports; latam mkt stable,
philippines doing well; S Ravikumar, President-Business
Development
n
n
n
n
The domestic sales number is a big fallout also because of BS-III, BS-IV confusion
and the preponement that has happened though we did not carry any extra
stocks in the pipeline.
Expect from the month of May things to become much better for us; expecting
good growth for in domestic motorcycles.
Dominar exports have already started this month, have already exported over
1,000 units in the month of April. Expecting a good traction from many export
markets – Latin America, and other places.
Expect to do a volume of 3.5lakh plus in the month of May, expect the same
momentum to continue in the month of June as well.
4 May 2017
29

From the think tank
1. SEBI’s options. by The Business Line
n
The first board meeting chaired by SEBI’s new boss Ajay Tyagi last week seems
to have been quite a productive one indeed. Out of the hotchpotch of decisions
made, four stand out — amending securities contracts regulations to permit
options trading in commodities, strengthening the monitoring of the utilisation
of public issue proceeds, integration of equity and commodities broking
businesses, and prohibiting resident Indians and NRIs from investing in
participatory notes. The decision to permit options trading in commodities was
first announced in September 2016 and the regulator has now taken the final
step after public consultations.
2. More farm credit is meaningless. by A Narayanamoorthy & P
Alli
n
An enhanced allocation in farm credit — ₹10 lakh crore, against ₹9 lakh crore in
FY17 — was one of the most impressive announcements in Budget 2017-18. This
looks like a promising step towards fulfilling the Government’s objective of
doubling farm income by 2022. This large budget allocation will help farmers to
invest more and earn better profits in farm ventures. That said, farmers’
organisations have expressed dissatisfaction over the announcement. The bulk
of small and marginal farmers are not at all pleased with the move.
3. Why Punjab needs incentives, not loan waivers. by Pk Joshi,
Tajuddin Khan & Avinash Kishore
n
The newly-elected government in Punjab is considering a loan waiver for
farmers to reduce agrarian distress. According to the recent Situation
Assessment Survey of Farmers (SASF), the average outstanding loan is nearly
three times higher in Punjab compared with the rest of India (Rs 3.31 lakh
versus Rs 1.22 lakh). Farmers in the state may be heavily indebted, but loan
waiver is not the best way to help them. The SASF also shows that less than 20%
of the marginal farmers in Punjab owed money to financial institutions,
compared to nearly 80% of the large farmers ( with holdings of more than 4
hectares).
4. A global agenda for digital economies. by Samir Saran
n
Last month, Germany convened the first-ever G20 “digital ministers” meeting,
indicating how the future of connected societies and economies is now firmly at
the top of the global agenda. In the run- up to the ministerial meeting, a T20
task force comprising think tanks and academia, of which this author was co-
chair, was constituted to offer recommendations that would strengthen digital
economies and manage the “digitalization” of traditional sectors. A prominent
concern outlined by this group related to the threat to global financial systems
because of greater interconnectivity and the creation of novel, untested
architectures to manage payment processes.
4 May 2017
30

5. Time to revisit the idea of public sector banks. by Livemint
n
In his July 2009 budget speech, Pranab Mukherjee had claimed that government
ownership of the financial system was the main reason why the Indian economy
had managed to stay on an even keel despite the turbulence around the world
after the collapse of investment bank Lehman Brothers a few months earlier.
“Never before has Indira Gandhi’s bold decision to nationalize our banking
system exactly 40 years ago—on 14 July 1969—appeared as wise and visionary
as it has over the past few months. Her approach continues to be our inspiration
even as we introduce competition and new technology in this sector,” the then
finance minister had claimed.
6. Phone as a deemed export. by T K Arun
n
Most economic agents lo ok forward to the goods and services tax (GST). A few
await GST with positive dread, including domestic makers of phones or any
other kit covered by the Information Technology Agreement (ITA) of 1997,
which bestows a zero rate of import duty on a range of electronic goods and
components. A zero rate of import duty means no protection for the domestic
manufacturer. Still, a range of information technology products came to be sold
under Indian brand names, competing with products from China. This owed to a
duty arbitrage that the government offered them, even in the absence of
protection via a proper customs duty.
International
7. China wields its soft power in africa with some success. by
david pilling
n
Maxwell Zeken is a 16-year-old Liberian who lives in rural Nimba County. Asked
where he dreams of studying, he says: “I want to study engineering in China and
come back to Liberia to build our roads and our cities. They say you must visit
the Great Wall of China. I regret that my country didn’t build something like
that.” Western governments like to imagine that they have all the soft power in
Africa. After all — if you put aside 100 years or so of colonial predation — for
decades they have been providing emergency relief and supporting health,
education and transparent institutions. What’s more, they are democracies,
with systems worth emulating.
4 May 2017
31

Click excel icon
for detailed
valuation guide
CMP
(INR)
874
83
2,924
1,149
23,349
1,650
25,900
803
569
222
3,368
1,347
241
6,650
447
499
TP
% Upside
EPS (INR)
(INR) Downside FY17E FY18E FY19E
1,084
98
3,282
1,266
22,924
1,741
28,811
841
608
270
3,390
1,573
-
7,319
609
581
24
18
12
10
-2
6
11
5
7
21
1
17
10
36
16
29.3
4.2
133.7
25.3
472.3
93.3
615.4
22.3
23.2
8.4
172.2
61.7
5.4
248.6
11.5
11.7
37.3
43.4
5.2
6.6
154.8 174.0
37.2
50.6
667.8 764.1
104.9 133.9
854.5 1,047.6
29.4
37.4
34.1
43.4
9.8
11.9
185.1 188.3
75.4
89.5
9.9
11.8
300.0 370.9
29.4
62.0
16.7
26.7
Valuation snapshot
P/E (x)
P/B (x)
ROE (%)
FY17E FY18E FY17E FY18E FY17E FY18E FY19E
29.8
19.6
21.9
45.5
49.4
17.7
42.1
36.1
24.5
26.5
19.6
21.8
45.0
26.7
38.8
42.5
29.0
32.6
27.7
28.5
23.3
27.1
15.8
21.7
28.7
NM
34.1
49.3
9.2
22.3
26.3
25.2
NM
14.6
51.7
11.5
697.9
33.0
33.3
21.1
30.6
36.9
37.3
15.0
49.4
33.6
15.7
18.5
11.4
46.3
13.3
23.4
16.0
18.9
30.9
35.0
15.7
30.3
27.3
16.7
22.7
18.2
17.9
24.4
22.2
15.2
29.9
20.7
21.4
22.1
26.1
19.5
23.0
15.3
19.7
24.2
6.2
28.3
33.2
8.3
17.7
21.2
10.0
12.8
10.3
12.3
10.1
8.4
14.0
17.1
5.8
13.2
26.8
24.2
12.1
39.1
30.4
13.2
15.9
8.4
25.3
11.5
5.9
3.8
6.1
6.8
9.4
2.8
14.8
6.5
2.8
3.8
7.1
3.3
2.8
5.6
1.8
9.8
4.2
2.2
2.9
2.4
2.2
4.4
1.9
1.5
4.3
0.8
4.4
5.2
0.9
4.2
3.1
1.2
0.8
0.7
0.7
1.1
0.4
1.0
1.3
0.6
1.0
7.6
4.4
1.8
13.2
6.3
3.8
3.3
2.6
2.9
2.5
4.9
3.4
5.4
5.9
7.8
2.4
10.7
5.4
2.5
3.4
6.1
3.0
2.5
4.8
1.6
7.8
3.6
2.0
2.6
2.2
2.0
4.0
1.7
1.4
3.7
0.7
3.8
4.6
0.8
3.5
2.8
1.1
0.7
0.7
0.7
1.0
0.4
0.9
1.2
0.5
0.9
6.1
3.7
1.6
10.9
5.7
3.4
2.8
2.3
2.7
2.2
21.7
20.6
29.5
15.7
18.2
16.9
40.7
19.6
12.1
14.5
39.5
14.5
6.4
20.3
4.7
25.6
14.3
6.9
10.9
10.7
9.9
17.9
10.5
7.2
16.0
-21.1
13.8
12.3
9.7
18.6
11.7
5.0
-2.5
5.2
1.4
10.1
0.1
3.0
3.9
2.8
3.2
22.7
15.1
14.4
30.4
19.1
25.5
19.4
23.9
6.4
19.7
22.9
22.3
30.2
20.5
24.5
16.3
40.9
21.6
15.9
15.0
36.2
13.9
10.8
21.2
11.0
29.2
17.6
9.9
12.4
8.9
10.9
18.2
9.8
7.4
16.5
11.6
14.5
14.6
10.0
18.0
13.2
11.9
6.0
7.0
5.8
10.6
5.2
6.7
7.3
9.7
7.1
25.5
16.7
13.9
30.6
18.1
27.0
19.3
29.0
10.9
20.2
22.0
24.9
30.0
23.7
23.4
17.9
36.7
22.9
17.5
16.0
31.9
14.7
11.5
22.3
20.4
35.9
21.1
15.7
14.0
9.6
12.5
19.0
10.5
9.0
17.3
12.5
15.7
17.3
11.3
19.7
14.8
14.8
9.2
10.5
7.3
11.1
6.1
8.3
9.3
13.0
9.2
27.3
19.5
14.5
30.9
17.1
29.6
19.0
32.2
12.9
20.6
Company
Reco
Automobiles
Amara Raja
Buy
Ashok Ley.
Buy
Bajaj Auto
Buy
Bharat Forge
Buy
Bosch
Neutral
CEAT
Buy
Eicher Mot.
Buy
Endurance Tech. Buy
Escorts
Buy
Exide Ind
Buy
Hero Moto
Neutral
M&M
Buy
Mahindra CIE Not Rated
Maruti Suzuki Buy
Tata Motors
Buy
TVS Motor
Buy
Aggregate
Banks - Private
Axis Bank
Neutral
DCB Bank
Neutral
Equitas Hold. Buy
Federal Bank
Buy
HDFC Bank
Buy
ICICI Bank
Buy
IDFC Bank
Neutral
IndusInd
Buy
J&K Bank
Neutral
Kotak Mah. Bk Buy
RBL Bank
Under Review
South Indian
Neutral
Yes Bank
Buy
Aggregate
Banks - PSU
BOB
Buy
BOI
Neutral
Canara
Neutral
IDBI Bk
Neutral
Indian Bk
Buy
OBC
Neutral
PNB
Buy
SBI
Buy
Union Bk
Neutral
Aggregate
NBFCs
Bajaj Fin.
Buy
Bharat Fin.
Neutral
Dewan Hsg.
Buy
GRUH Fin.
Neutral
HDFC
Buy
Indiabulls Hsg Buy
LIC Hsg Fin
Neutral
Manappuram Not Rated
M&M Fin.
Buy
Muthoot Fin
Buy
501
194
162
112
1,541
273
65
1,437
80
914
586
26
1,632
525
170
220
125
1,790
350
62
1,700
75
1,050
-
21
2,110
5
-12
36
12
16
28
-5
18
-7
15
-18
29
15.4
7.0
5.7
4.8
56.8
17.3
3.0
50.1
-25.2
26.8
11.9
2.8
73.2
23.4
8.8
6.2
5.8
67.1
17.8
3.3
59.4
13.0
32.3
17.6
3.1
92.2
41.2
11.2
7.4
7.3
79.4
20.5
4.3
72.0
15.4
40.5
23.8
3.8
116.2
190
185
368
79
336
175
174
289
179
224
129
310
49
360
138
186
340
174
18
-30
-16
-38
7
-21
7
18
-3
7.5
-5.7
25.2
1.5
29.3
0.3
5.3
8.7
8.5
19.0
14.5
35.9
6.4
33.3
21.0
12.4
16.9
30.5
26.1
23.7
57.6
8.6
38.1
26.0
16.6
23.3
45.3
1,270
783
444
402
1,571
1,083
707
93
328
396
1,448
769
500
421
1,752
1,227
723
-
400
465
14
-2
13
5
12
13
2
22
17
34.4
21.0
29.6
8.1
46.7
69.0
38.2
8.2
7.1
29.7
47.5
32.4
36.7
10.3
51.7
82.2
44.6
11.1
12.9
34.5
64.0
45.3
42.7
12.5
57.3
101.6
51.2
14.0
16.4
40.0
4 May 2017
32

Click excel icon
for detailed
valuation guide
CMP
(INR)
161
760
211
2,138
1,017
TP
% Upside
EPS (INR)
(INR) Downside FY17E FY18E FY19E
117
-27
25.7
27.2
30.2
831
9
28.6
34.0
40.2
134
-36
31.4
35.0
40.4
2,689
1,269
26
25
91.8
55.6
134.5
77.4
164.6
98.6
Valuation snapshot
P/E (x)
P/B (x)
ROE (%)
FY17E FY18E FY17E FY18E FY17E FY18E
6.3
5.9
1.1
0.9
17.9
17.0
26.6
22.3
4.2
3.6
17.3
17.5
6.7
6.0
1.2
1.1
19.9
19.1
23.3
18.3
18.5
77.1
27.7
31.4
48.2
47.3
21.1
39.6
56.7
53.3
11.4
20.5
32.1
25.0
78.9
41.0
32.3
43.8
25.9
30.6
36.0
49.7
47.7
35.7
71.4
16.8
41.4
30.3
79.2
24.6
NM
NM
53.9
44.8
37.7
54.4
49.5
47.7
38.0
43.8
48.6
33.4
48.5
33.1
47.2
50.1
15.9
13.1
15.9
54.4
24.5
30.4
33.6
39.5
19.8
34.6
30.9
39.5
12.0
17.6
27.1
19.4
52.2
34.9
23.2
36.3
19.8
27.8
30.3
36.6
32.7
18.7
46.0
13.3
24.2
26.6
38.4
22.7
52.8
45.6
40.8
35.5
28.3
49.4
42.9
40.1
35.7
35.9
42.1
29.7
43.4
29.7
41.9
44.9
2.8
2.1
3.2
9.2
5.3
1.2
9.2
35.8
1.1
8.4
6.8
10.8
2.0
3.2
3.4
2.1
7.3
7.0
-1.9
4.9
3.5
5.1
4.0
2.5
3.6
2.1
4.7
1.9
1.7
3.8
4.1
4.4
3.6
6.3
9.8
5.1
3.7
16.8
19.0
24.9
10.0
12.9
10.2
7.6
33.4
8.8
7.5
15.3
2.5
1.8
2.8
7.8
4.6
1.2
7.9
24.3
1.1
7.7
6.1
9.7
1.8
2.8
3.1
1.9
6.2
6.0
-2.0
4.5
3.1
4.5
3.7
2.4
3.6
2.0
4.3
1.7
1.6
3.4
4.0
3.8
3.4
5.7
8.0
4.6
3.4
14.8
15.1
23.4
8.6
11.0
8.7
6.7
34.7
7.7
6.9
13.3
12.7
11.7
17.4
11.9
20.4
4.0
20.2
94.3
5.4
22.6
11.7
20.3
19.2
16.6
10.9
8.6
9.2
18.4
NM
11.6
8.9
17.6
11.2
5.0
7.5
6.0
6.8
11.7
4.0
13.3
5.2
19.6
-3.7
-3.1
19.2
12.0
9.8
32.8
43.1
54.9
28.4
33.8
22.5
24.6
67.6
28.4
16.4
34.2
16.5
14.5
17.9
14.4
18.8
4.0
25.3
73.3
5.5
23.2
20.7
24.6
15.7
16.8
11.9
10.0
11.9
18.6
-8.8
12.9
16.7
17.1
12.1
6.7
11.0
10.9
9.8
13.2
6.2
13.6
10.5
18.0
6.6
13.1
21.7
13.6
11.9
31.8
39.2
60.1
26.0
33.0
22.2
24.0
78.4
27.6
17.1
31.7
FY19E
16.8
17.6
19.1
17.5
16.3
18.0
15.9
19.1
4.0
31.2
66.1
6.0
25.3
19.2
25.1
14.6
16.2
12.7
11.8
14.2
19.0
-11.0
13.2
17.3
17.1
12.8
7.1
14.2
13.2
12.9
14.8
7.7
16.0
14.7
18.5
11.3
20.8
23.5
15.7
13.7
32.4
38.0
68.5
26.3
33.2
21.9
23.1
92.5
28.7
18.1
34.2
Company
Reco
PFC
Neutral
Repco Home
Buy
REC
Neutral
Shriram
City
Buy
Union
STF
Buy
Aggregate
Capital Goods
ABB
Neutral
Bharat Elec.
Buy
BHEL
Sell
Blue Star
Neutral
CG Cons. Elec. Buy
CG Power &
Sell
Indu.
Cummins
Neutral
GE T&D
Neutral
Havells
Neutral
Inox Wind
Neutral
K E C Intl
Buy
L&T
Buy
Pennar Eng.
Not Rated
Siemens
Neutral
Solar Ind
Neutral
Suzlon Energy Not Rated
Thermax
Sell
Va Tech Wab. Buy
Voltas
Sell
Aggregate
Cement
Ambuja Cem. Buy
ACC
Neutral
Birla Corp.
Buy
Dalmia Bharat Buy
Grasim Inds.
Neutral
India Cem
Neutral
J K Cements
Buy
JK Lakshmi Ce Buy
Ramco Cem
Buy
Orient Cem
Buy
Prism Cem
Buy
Shree Cem
Buy
Ultratech
Buy
Aggregate
Consumer
Asian Paints
Neutral
Britannia
Buy
Colgate
Buy
Dabur
Neutral
Emami
Buy
Godrej Cons.
Neutral
GSK Cons.
Neutral
HUL
Neutral
ITC
Buy
Jyothy Lab
Neutral
Marico
Buy
1,420
179
174
681
215
77
1,055
341
476
200
216
1,721
145
1,341
779
21
1,030
685
416
1,190
180
115
680
221
45
990
340
425
175
175
1,750
-
1,340
800
-
781
760
370
-16
1
-34
0
3
-42
-6
0
-11
-12
-19
2
0
3
-24
11
-11
18.4
6.5
5.5
14.1
4.6
3.6
26.6
6.0
8.9
17.5
10.5
53.6
5.8
17.0
19.0
0.6
23.5
26.5
13.6
26.1
7.3
5.7
20.3
5.5
3.9
30.5
11.0
12.1
16.6
12.3
63.6
7.5
25.7
22.3
0.9
28.4
34.5
14.9
32.6
8.5
5.8
29.5
6.7
4.5
36.5
11.4
14.1
17.7
13.5
74.4
10.0
33.5
26.5
1.0
31.5
40.3
16.9
243
1,609
770
2,188
1,156
211
989
469
683
167
120
19,589
4,303
283
1,521
869
2,392
1,067
152
1,103
526
815
167
118
20,072
4,928
17
-5
13
9
-8
-28
12
12
19
0
-2
2
15
4.9
33.7
21.5
30.7
68.7
5.1
32.6
5.9
27.8
-1.8
-0.6
363.2
96.1
6.6
49.2
41.2
47.5
86.6
8.7
37.2
12.2
30.1
3.2
2.6
480.6
121.4
7.2
63.6
54.4
70.1
111.1
11.9
49.3
17.8
36.2
5.8
4.8
642.3
159.1
1,116
3,574
1,034
276
1,071
1,806
5,136
934
277
376
315
1,145
4,065
1,200
295
1,295
1,740
5,410
945
320
380
340
3
14
16
7
21
-4
5
1
15
1
8
20.5
72.2
21.7
7.2
24.5
37.1
153.9
19.3
8.4
8.0
6.3
22.6
83.3
25.8
7.7
29.8
42.9
173.1
21.5
9.3
9.0
7.0
26.7
101.7
31.6
9.1
36.0
49.8
190.8
24.8
11.0
10.5
8.4
4 May 2017
33

Click excel icon
for detailed
valuation guide
CMP
(INR)
6,705
14,714
237
730
7,368
778
1,935
TP
% Upside
(INR) Downside
6,665
-1
17,480
19
250
5
740
1
8,790
19
1,030
32
2,025
5
EPS (INR)
FY18E FY19E
139.2 163.3
305.1 388.4
6.9
12.5
18.3
20.5
167.7 198.8
14.3
18.4
42.2
58.7
Valuation snapshot
P/E (x)
P/B (x)
ROE (%)
FY17E FY18E FY17E FY18E FY17E FY18E
56.8
48.2
21.5
18.6
39.0
41.4
62.5
48.2
25.8
20.3
41.3
42.2
292.5 34.2
2.9
2.7
1.3
8.2
44.0
39.9
11.3
9.2
27.9
25.4
50.6
43.9
13.6
11.8
29.0
28.8
72.9
54.3
8.7
7.7
12.6
15.0
67.6
45.9
12.7
10.1
20.8
22.1
43.1
37.9
12.8
11.2
29.6
29.5
28.0
25.0
29.6
14.6
33.8
37.8
31.0
14.5
34.1
94.2
21.8
21.3
70.2
35.6
20.6
32.8
23.1
38.0
23.7
25.5
20.3
46.2
39.5
30.7
16.3
15.1
34.4
65.6
18.3
NM
11.3
10.2
18.2
75.0
NM
35.1
46.5
40.5
11.6
13.5
NM
14.3
21.3
23.2
26.0
12.4
31.2
25.7
25.2
19.0
23.4
75.1
18.0
18.8
43.6
20.1
16.1
26.8
19.3
30.7
17.6
20.8
16.8
36.5
29.4
16.3
8.6
12.1
25.2
35.5
16.3
46.4
10.4
10.0
16.0
43.6
NM
29.6
30.6
29.4
8.7
12.3
NM
10.6
6.0
5.6
9.2
3.7
4.6
7.6
3.4
3.5
3.2
2.5
4.4
3.4
15.7
2.9
4.3
5.3
4.4
7.7
5.7
4.5
2.6
20.5
3.4
2.2
2.2
2.3
3.8
18.9
4.5
1.2
1.9
0.7
3.5
7.6
4.0
8.8
10.3
6.6
1.7
3.6
0.3
2.2
4.9
4.7
7.1
2.9
4.2
6.2
3.1
3.2
2.9
2.1
3.4
2.5
18.7
2.6
3.5
4.8
3.7
6.3
4.7
3.8
2.3
15.6
3.2
2.0
2.0
2.0
3.5
12.3
4.0
1.1
1.6
0.7
3.1
6.6
3.4
8.1
8.4
5.8
1.4
3.1
0.3
1.8
23.3
24.4
35.9
28.8
13.6
21.4
11.0
25.4
9.8
2.7
20.1
18.8
22.4
8.4
22.8
16.2
19.8
22.2
25.9
17.6
11.5
50.5
8.8
7.2
12.4
16.7
11.0
33.6
26.2
-4.1
18.5
7.7
20.7
10.6
-21.7
25.1
29.1
16.3
15.4
24.4
-7.5
16.2
25.5
22.0
30.9
26.0
13.3
26.5
12.2
17.7
12.9
3.1
19.0
15.8
43.0
13.5
23.8
18.1
20.9
22.5
29.3
18.3
14.8
48.6
11.2
12.9
19.4
17.8
13.7
42.0
26.2
2.5
16.8
7.1
20.6
16.3
0.0
27.3
30.3
19.6
17.5
27.2
-4.5
18.7
FY19E
41.9
43.2
13.2
23.4
29.5
16.8
23.8
30.4
26.0
21.7
29.9
23.9
16.1
27.9
13.8
18.8
15.2
6.1
19.1
18.3
56.9
15.9
22.1
19.4
21.0
20.7
29.6
18.9
14.8
46.8
11.8
15.3
25.4
18.6
14.9
43.9
26.8
8.8
15.8
7.0
20.4
22.0
11.1
29.0
29.4
21.6
16.8
25.4
-0.6
17.9
Company
Nestle
Page Inds
Parag Milk
Pidilite Ind.
P&G Hygiene
United Brew
United Spirits
Aggregate
Healthcare
Alembic Phar
Alkem Lab
Ajanta Pharma
Aurobindo
Biocon
Cadila
Cipla
Divis Lab
Dr Reddy’s
Fortis Health
Glenmark
Granules
GSK Pharma
IPCA Labs
Lupin
Sanofi India
Sun Pharma
Syngene Intl
Torrent Pharma
Aggregate
Logistics
Allcargo
Logistics
Blue Dart
Concor
Gateway
Distriparks
Gati
Transport Corp.
Aggregate
Media
Dish TV
D B Corp
Den Net.
Hind. Media
HT Media
Jagran Prak.
PVR
Siti Net.
Sun TV
Zee Ent.
Aggregate
Metals
Hindalco
Hind. Zinc
JSPL
JSW Steel
Reco
Neutral
Buy
Neutral
Neutral
Buy
Buy
Neutral
FY17E
118.0
235.6
0.8
16.6
145.7
10.7
28.6
Neutral
Neutral
Buy
Buy
Sell
Buy
Neutral
Neutral
Neutral
Buy
Neutral
Buy
Neutral
Neutral
Buy
Buy
Buy
Not Rated
Buy
606
1,986
1,658
584
1,033
454
554
624
2,594
221
885
145
2,422
563
1,264
4,226
627
495
1,342
630
1,850
2,028
915
900
510
550
600
3,050
250
990
160
2,700
540
1,850
5,000
850
-
1,700
4
-7
22
57
-13
12
-1
-4
18
13
12
10
11
-4
46
18
35
27
21.6
79.3
56.0
40.1
30.6
12.0
17.9
43.0
76.1
2.3
40.6
6.8
34.5
15.8
61.4
129.0
27.1
13.0
56.6
28.5
85.7
63.8
47.0
33.1
17.7
22.0
32.9
110.9
2.9
49.2
7.7
55.5
27.9
78.6
157.8
32.5
16.1
76.3
35.8
100.0
79.6
54.6
44.9
23.0
28.5
38.6
147.2
6.5
60.5
11.3
64.4
37.3
88.8
189.9
38.7
18.0
93.4
Buy
Not Rated
Neutral
Buy
Not Rated
Not Rated
183
4,741
1,174
255
136
255
203
-
1,042
314
-
-
11
-11
23
9.0
102.5
29.7
8.3
8.4
16.9
10.9
129.9
39.9
15.7
15.9
21.0
12.3
163.2
44.9
20.1
23.9
25.9
Buy
Buy
Neutral
Buy
Neutral
Buy
Buy
Neutral
Neutral
Buy
95
375
102
286
82
196
1,557
34
881
529
115
450
90
360
90
225
1,667
40
860
610
22
20
-12
26
10
15
7
18
-2
15
1.4
20.4
-3.6
25.2
8.0
10.8
20.8
-1.8
25.1
11.4
2.7
23.0
2.2
27.4
8.2
12.2
35.7
0.0
29.7
17.3
4.3
26.5
8.5
30.3
8.7
13.9
56.8
1.2
34.5
20.6
Buy
Sell
Buy
Buy
197
265
112
193
235
235
181
222
19
-11
61
15
16.9
19.7
-22.3
13.6
22.6
21.5
-17.5
18.3
25.4
23.7
-2.2
20.5
4 May 2017
34

Click excel icon
for detailed
valuation guide
CMP
(INR)
68
128
61
240
441
TP
% Upside
EPS (INR)
(INR) Downside FY17E FY18E FY19E
83
21
3.9
5.3
5.8
178
39
12.1
12.3
13.0
30
-51
-7.4
-12.6
0.4
250
4
17.7
24.7
27.7
440
0
18.9
39.4
45.7
Valuation snapshot
P/E (x)
P/B (x)
ROE (%)
FY17E FY18E FY17E FY18E FY17E FY18E
17.6
12.8
1.3
1.2
7.5
9.6
10.6
10.5
1.7
1.6
13.4
15.5
NM
NM
0.7
0.8
-8.1
-15.4
13.5
9.7
1.5
1.4
11.4
15.0
23.4
11.2
3.5
2.9
13.6
28.2
18.2
14.2
1.4
1.4
7.9
9.6
13.1
19.7
46.8
20.7
9.9
10.1
24.3
10.8
11.5
12.5
19.3
12.9
13.0
85.7
51.4
54.5
17.8
14.6
17.1
14.9
11.0
13.2
19.5
13.3
13.0
15.2
25.8
17.5
12.9
14.7
16.3
15.7
31.4
23.3
NM
114.4
40.2
16.8
18.9
16.4
13.6
13.8
14.2
14.8
13.7
14.8
20.5
16.7
11.8
11.2
24.0
11.5
10.0
9.5
16.2
11.3
11.8
48.6
46.4
46.7
14.4
13.0
15.3
14.5
9.8
12.2
15.9
13.2
10.1
13.1
21.2
16.7
11.8
14.3
13.2
15.1
68.0
21.6
NM
27.7
835.3
13.9
12.7
29.9
11.3
11.9
12.2
12.5
3.4
2.2
4.8
2.4
2.6
2.5
5.1
2.9
1.1
1.3
4.3
1.4
1.8
8.6
10.3
10.0
2.9
3.7
4.2
3.1
1.7
4.9
3.2
2.0
1.7
2.4
9.9
5.5
2.4
2.3
2.5
3.7
2.0
3.7
1.2
-70.7
2.3
6.8
2.2
1.0
1.4
2.2
1.4
2.3
2.9
2.0
4.0
2.1
2.3
2.2
4.4
2.4
1.0
1.2
3.6
1.3
1.6
9.5
8.9
9.0
2.5
3.6
3.6
2.8
1.4
4.1
2.9
1.9
1.5
2.3
7.9
5.6
2.1
2.1
2.2
3.5
2.0
3.3
1.6
45.6
2.3
6.8
1.9
1.0
1.3
1.9
1.3
2.2
27.1
13.0
10.7
12.0
27.8
26.0
22.3
29.6
9.8
10.4
23.9
11.9
13.8
10.1
21.5
18.4
16.2
27.0
26.5
23.3
14.3
41.4
16.8
14.1
13.5
17.0
42.5
33.5
20.1
16.9
16.3
23.5
6.5
15.7
-4.2
-50.2
5.7
40.6
11.1
6.7
10.6
17.3
10.8
15.8
22.7
14.0
21.5
13.5
20.7
20.4
19.7
22.7
10.8
13.0
24.0
11.8
13.8
19.5
20.6
19.3
17.6
27.8
25.3
21.4
15.6
36.6
18.9
14.9
15.9
18.1
41.3
32.4
19.5
15.5
17.7
23.1
2.9
15.9
-25.3
924.0
0.3
48.8
15.8
3.3
11.9
17.5
11.1
17.3
FY19E
9.9
15.1
0.5
15.6
26.5
12.0
21.4
14.4
22.0
14.5
18.6
18.8
19.2
21.4
11.6
14.1
27.2
11.2
13.6
24.9
20.3
19.7
17.9
28.1
23.5
21.2
15.2
32.1
20.5
14.7
16.0
20.3
40.8
32.3
19.2
15.7
17.8
22.3
5.2
16.7
-37.1
117.3
2.3
53.5
15.2
2.8
13.3
17.7
10.6
18.2
Company
Nalco
NMDC
SAIL
Vedanta
Tata Steel
Aggregate
Oil & Gas
BPCL
GAIL
Gujarat Gas
Gujarat St. Pet.
HPCL
IOC
IGL
MRPL
Oil India
ONGC
PLNG
Reliance Ind.
Aggregate
Retail
Jubilant Food
Titan Co.
Aggregate
Technology
Cyient
HCL Tech.
Hexaware
Infosys
KPIT Tech
L&T Infotech
Mindtree
Mphasis
NIIT Tech
Persistent Sys
Tata Elxsi
TCS
Tech Mah
Wipro
Zensar Tech
Aggregate
Telecom
Bharti Airtel
Bharti Infratel
Idea Cellular
Tata Comm
Aggregate
Utiltites
Coal India
CESC
JSW Energy
NTPC
Power Grid
Tata Power
Aggregate
Reco
Buy
Buy
Sell
Neutral
Sell
Buy
Neutral
Sell
Neutral
Buy
Buy
Neutral
Neutral
Buy
Buy
Buy
Neutral
735
426
818
184
532
441
1,051
132
330
191
430
1,370
763
349
735
162
604
441
1,023
114
382
233
454
1,264
4
-18
-10
-12
14
0
-3
-13
16
22
6
-8
55.9
21.7
17.5
8.9
53.5
43.7
43.3
12.2
28.6
15.3
22.2
106.6
53.7
28.9
40.0
11.0
44.9
39.4
43.8
11.4
33.1
20.0
26.5
121.7
58.4
32.5
49.0
13.2
45.8
41.0
49.4
12.8
37.8
22.9
36.2
127.8
Neutral
Neutral
1,057
484
1,110
485
5
0
12.3
9.4
21.7
10.4
29.1
11.8
Buy
Buy
Neutral
Buy
Neutral
Buy
Neutral
Neutral
Neutral
Buy
Buy
Neutral
Buy
Neutral
Buy
544
834
235
936
132
710
486
568
471
575
1,531
2,337
420
496
894
620
1,000
235
1,200
150
800
475
550
470
700
1,780
2,400
550
500
1,020
14
20
0
28
14
13
-2
-3
0
22
16
3
31
1
14
30.6
57.2
13.7
62.9
11.9
53.6
24.9
42.7
36.2
37.7
59.3
133.4
32.5
33.8
54.9
37.8
64.3
15.4
64.7
13.4
58.0
30.5
43.0
46.8
43.9
72.1
139.7
35.7
34.6
67.6
44.1
70.3
16.7
71.1
15.2
60.8
36.5
44.9
52.9
51.4
89.0
149.6
40.2
38.2
78.4
Buy
Buy
Buy
Buy
346
362
84
709
410
435
120
811
18
20
43
14
11.0
15.5
-3.0
6.2
5.1
16.7
-15.4
25.6
9.4
19.9
-16.9
44.1
Buy
Buy
Buy
Buy
Buy
Sell
279
950
63
162
211
82
335
970
88
199
243
69
20
2
39
23
15
-16
16.7
50.4
3.9
11.9
15.3
5.8
20.1
74.7
2.1
14.3
17.7
6.7
22.1
82.2
1.8
17.3
20.7
7.0
4 May 2017
35

Click excel icon
for detailed
valuation guide
CMP
(INR)
419
578
435
256
371
164
2,697
302
1,116
206
845
291
109
506
566
415
700
1,155
2,546
169
861
2,584
1,773
309
1,428
6,292
189
382
TP
% Upside
EPS (INR)
(INR) Downside FY17E FY18E FY19E
430
-
532
274
-
229
3,334
287
1,092
232
1,000
240
-
-
649
551
843
1,400
2,841
210
1,046
2,200
1,825
371
1,288
5,281
140
393
3
22
7
40
24
-5
-2
13
18
-17
13.5
10.9
13.6
7.7
16.0
3.3
67.6
11.4
39.0
13.7
16.9
3.3
5.5
17.2
23.4
26.0
14.9
26.3
72.9
6.6
30.4
74.5
82.4
7.7
27.0
106.9
3.7
7.0
21.8
14.2
14.9
8.6
18.3
6.9
112.9
13.9
64.7
17.5
17.9
8.0
7.6
18.5
28.6
31.0
23.1
30.0
89.3
8.6
34.8
127.1
99.9
10.3
35.1
137.7
4.6
11.9
28.6
17.7
15.2
11.4
23.6
7.6
166.7
16.9
78.0
21.1
21.0
12.0
10.0
22.1
36.1
36.7
38.3
42.5
109.3
10.5
43.6
164.7
125.1
13.3
42.9
176.0
5.4
16.0
Valuation snapshot
P/E (x)
P/B (x)
ROE (%)
FY17E FY18E FY17E FY18E FY17E FY18E FY19E
31.0
53.1
31.9
33.1
23.3
50.3
39.9
26.5
28.6
15.1
50.0
87.1
19.7
29.5
24.1
16.0
47.0
43.9
34.9
25.4
28.3
34.7
21.5
40.1
52.9
58.8
50.9
54.7
19.3
40.7
29.3
29.6
20.3
23.9
23.9
21.8
17.3
11.8
47.1
36.2
14.4
27.4
19.8
13.4
30.3
38.5
28.5
19.6
24.7
20.3
17.7
30.0
40.7
45.7
41.2
32.0
2.8
5.8
33.6
8.7
4.0
4.4
5.5
8.1
19.6
4.3
5.3
5.1
1.7
4.5
4.1
4.3
3.4
4.5
10.6
6.5
7.8
3.4
3.4
5.3
28.8
9.3
13.5
5.0
2.5
5.2
30.2
7.2
3.6
3.3
4.5
6.5
16.6
3.1
5.0
4.5
1.6
4.0
3.8
3.5
3.2
4.2
9.9
5.4
6.2
3.0
2.9
4.8
24.5
8.4
10.8
4.5
10.4
11.3
110.9
28.9
18.2
9.0
15.1
34.7
72.2
33.8
11.1
5.9
8.6
16.5
17.3
29.9
8.6
10.6
30.4
26.0
30.9
10.0
16.5
13.9
56.8
16.5
29.4
9.5
14.0
13.4
108.6
26.5
18.9
15.7
20.7
33.0
104.1
30.8
10.9
12.5
11.7
15.5
19.8
28.7
9.6
11.3
35.9
30.0
27.9
15.7
17.4
16.8
65.0
19.4
29.1
14.8
16.3
15.0
100.4
28.6
21.7
17.0
24.3
32.4
106.3
27.3
11.9
16.2
14.8
16.2
22.9
27.7
16.3
15.0
39.6
30.9
27.8
18.2
19.1
19.1
66.3
22.2
27.6
17.5
Company
Reco
Others
Arvind
Buy
Bata India
Under Review
Castrol India
Buy
Century Ply.
Buy
Coromandel Intl Under Review
Delta Corp
Buy
Dynamatic Tech Buy
Eveready Inds. Buy
Interglobe
Neutral
Indo Count
Buy
Info Edge
Buy
Inox Leisure
Sell
Jain Irrigation Under Review
Just Dial
Under Review
Kaveri Seed
Buy
Kitex Garm.
Buy
Manpasand
Buy
MCX
Buy
Monsanto
Buy
Navneet
Buy
Education
PI Inds.
Buy
Piramal Enterp. Buy
SRF
Buy
S H Kelkar
Buy
Symphony
Sell
TTK Prestige
Neutral
V-Guard
Neutral
Wonderla
Buy
15
33
20
21
12
24
21
-15
3
20
-10
-16
-26
3
4 May 2017
36

MOSL Universe stock performance
Company
Automobiles
Amara Raja
Ashok Ley.
Bajaj Auto
Bharat Forge
Bosch
CEAT
Eicher Mot.
Endurance Tech.
Escorts
Exide Ind
Hero Moto
M&M
Mahindra CIE
Maruti Suzuki
Tata Motors
TVS Motor
Banks - Private
Axis Bank
DCB Bank
Equitas Hold.
Federal Bank
HDFC Bank
ICICI Bank
IDFC Bank
IndusInd
J&K Bank
Kotak Mah. Bk
RBL Bank
South Indian
Yes Bank
Banks - PSU
BOB
BOI
Canara
IDBI Bk
Indian Bk
OBC
PNB
SBI
Union Bk
NBFCs
Bajaj Fin.
Bharat Fin.
Dewan Hsg.
GRUH Fin.
HDFC
Indiabulls Hsg
LIC Hsg Fin
Manappuram
M&M Fin.
Muthoot Fin
PFC
Repco Home
REC
STF
Shriram City Union
1 Day (%)
-1.8
-0.8
0.6
-1.0
1.2
3.9
0.5
-0.7
0.8
-3.6
0.5
0.5
1.0
-0.8
-1.1
0.9
-0.9
-1.5
-0.6
-0.4
0.0
-1.2
0.0
-0.9
1.9
-0.4
0.1
0.2
0.0
0.5
2.0
0.3
2.3
4.9
1.8
2.0
0.4
4.8
0.0
-0.5
-0.7
2.3
-0.8
1.0
0.2
-0.6
-1.3
0.5
-1.6
-1.6
-0.5
0.9
-2.5
1M (%)
-3.9
-1.4
5.0
6.8
3.3
24.1
1.6
3.8
5.8
-3.2
5.1
4.8
6.2
9.5
-5.1
14.7
0.4
13.9
-5.6
23.9
7.6
-4.9
9.1
2.4
7.4
4.5
15.4
18.5
6.0
10.0
32.5
21.0
4.3
19.6
23.0
16.2
-1.3
14.9
7.4
-4.3
18.9
1.1
2.5
8.6
13.1
-4.8
2.7
4.1
8.8
5.4
17.3
-7.7
-8.1
12M (%)
-8.6
-21.1
18.7
44.3
20.3
50.7
29.7
232.6
54.3
16.8
1.6
24.0
74.2
9.1
73.4
6.6
114.7
15.0
138.8
37.9
23.2
38.4
38.3
21.0
29.0
57.5
75.1
24.1
110.3
92.6
16.6
248.1
101.3
110.3
57.1
43.6
82.0
27.5
118.1
59.2
42.9
58.7
55.4
139.4
6.2
101.6
83.4
21.4
143.3
-2.4
29.4
Company
Capital Goods
ABB
Bharat Elec.
BHEL
Blue Star
CG Cons. Elec.
CG Power & Inds Sol.
Cummins
GE T&D
Havells
Inox Wind
K E C Intl
L&T
Pennar Eng.
Siemens
Solar Ind
Suzlon Energy
Thermax
Va Tech Wab.
Voltas
Cement
Ambuja Cem.
ACC
Birla Corp.
Dalmia Bharat
Grasim Inds.
India Cem
J K Cements
JK Lakshmi Ce
Ramco Cem
Orient Cem
Prism Cem
Shree Cem
Ultratech
Consumer
Asian Paints
Britannia
Colgate
Dabur
Emami
Godrej Cons.
GSK Cons.
HUL
ITC
Jyothy Lab
Marico
Nestle
Page Inds
Parag Milk
Pidilite Ind.
P&G Hygiene
United Brew
United Spirits
Healthcare
Alembic Phar
Alkem Lab
Ajanta Pharma
Aurobindo
1 Day (%)
0.7
-2.3
-0.7
0.9
-2.3
-1.7
5.5
1.7
-0.5
-1.3
-0.5
-0.5
1.5
0.6
-1.4
-1.0
0.2
0.5
0.4
0.4
1.2
-0.1
-0.1
0.2
0.3
1.4
0.5
0.0
0.7
-0.6
2.3
2.3
0.0
0.1
0.4
-2.9
2.6
1.6
-0.9
0.6
-0.5
-4.4
-1.3
-0.1
0.1
-0.8
1.4
-0.1
0.9
0.0
-2.1
-0.1
0.8
-2.1
1M (%)
7.6
12.0
4.3
-3.6
-4.1
-3.4
9.6
0.3
1.5
14.4
2.2
3.6
14.4
3.1
0.8
7.0
5.6
-0.3
0.3
2.8
10.2
3.0
11.1
9.8
28.7
4.9
0.9
0.9
19.4
17.8
14.4
6.9
2.3
5.3
2.7
-1.4
1.8
6.6
-1.1
1.7
-1.6
9.8
6.4
1.9
0.9
1.4
3.9
-0.9
1.9
-5.5
-2.2
-7.9
-5.1
-14.2
12M (%)
14.6
52.5
39.8
60.9
35.4
17.8
-9.9
44.7
-29.4
68.0
37.6
-1.0
16.6
16.2
36.5
39.5
16.5
39.9
11.0
13.2
98.0
157.5
39.9
132.0
67.5
34.8
45.0
12.8
42.0
58.0
33.9
28.0
25.5
21.3
-4.9
9.8
32.7
-11.8
9.8
31.2
25.1
23.4
19.6
16.5
22.1
14.4
0.8
-21.0
1.3
61.1
11.2
-27.1
4 May 2017
37

MOSL Universe stock performance
Company
Biocon
Cadila
Cipla
Divis Lab
Dr Reddy’s
Fortis Health
Glenmark
Granules
GSK Pharma
IPCA Labs
Lupin
Sanofi India
Sun Pharma
Syngene Intl
Torrent Pharma
Logistics
Allcargo Logistics
Blue Dart
Concor
Gateway Distriparks
Gati
Transport Corp.
Media
Dish TV
D B Corp
Den Net.
Hind. Media
HT Media
Jagran Prak.
PVR
Siti Net.
Sun TV
Zee Ent.
Metals
Hindalco
Hind. Zinc
JSPL
JSW Steel
Nalco
NMDC
SAIL
Vedanta
Tata Steel
Oil & Gas
BPCL
GAIL
Gujarat Gas
Gujarat St. Pet.
HPCL
IOC
IGL
MRPL
Oil India
ONGC
PLNG
Reliance Ind.
Retail
Jubilant Food
1 Day (%)
-5.0
1.4
0.0
-0.4
0.5
-2.7
-0.8
-4.4
-0.1
-4.3
-3.1
0.7
-0.8
-0.6
-3.5
-1.4
-1.5
-2.3
-4.5
-1.9
3.1
-0.4
-0.9
6.4
-1.7
-0.5
-0.8
-2.4
-1.7
-4.6
-1.1
-1.6
-1.4
-1.4
-1.3
0.4
0.7
3.5
-0.7
-1.0
-0.7
-0.8
-2.4
-0.1
-3.7
-0.4
-0.8
1.8
0.2
-0.6
0.9
0.0
1.5
1M (%)
-8.5
2.2
-6.3
-0.8
-5.5
16.9
3.3
1.9
-11.1
-10.9
-11.9
-11.0
-9.5
-4.7
-10.9
7.4
-9.7
16.1
0.9
-3.6
7.8
-7.8
-1.7
20.5
0.7
-2.5
5.1
8.2
-10.8
10.8
-0.2
1.7
-9.3
-9.0
2.1
-8.7
-3.9
-2.7
-12.0
-9.2
15.1
10.7
8.2
11.8
2.5
15.7
3.7
22.1
-0.2
2.8
3.8
-0.1
-4.2
12M (%)
68.7
41.4
3.4
-40.1
-12.6
26.6
7.8
12.1
-33.2
14.1
-19.9
-4.0
-21.4
28.6
-6.4
19.3
-14.9
6.6
-10.9
14.5
58.3
4.5
12.5
15.1
6.4
-6.6
20.3
84.5
-5.7
141.8
26.4
103.1
53.3
62.5
42.5
46.0
31.9
33.1
118.2
26.5
53.6
56.6
52.1
33.8
91.0
110.5
84.5
92.8
30.5
33.0
58.0
40.4
-8.0
Company
Titan Co.
Technology
Cyient
HCL Tech.
Hexaware
Infosys
KPIT Tech
L&T Infotech
Mindtree
Mphasis
NIIT Tech
Persistent Sys
Tata Elxsi
TCS
Tech Mah
Wipro
Zensar Tech
Telecom
Bharti Airtel
Bharti Infratel
Idea Cellular
Tata Comm
Utiltites
Coal India
CESC
JSW Energy
NTPC
Power Grid
Tata Power
Others
Arvind
Bata India
Castrol India
Century Ply.
Coromandel Intl
Delta Corp
Dynamatic Tech
Eveready Inds.
Interglobe
Indo Count
Info Edge
Inox Leisure
Jain Irrigation
Just Dial
Kaveri Seed
Kitex Garm.
Manpasand
MCX
Monsanto
Navneet Educat.
PI Inds.
Piramal Enterp.
SRF
S H Kelkar
Symphony
TTK Prestige
V-Guard
Wonderla
1 Day (%)
-0.2
-2.4
1.4
3.2
1.6
-0.7
-0.3
0.1
0.6
1.5
-1.8
0.2
2.0
0.4
0.2
2.2
-0.3
2.1
-1.1
-0.8
1.5
-0.7
1.6
0.0
2.3
-1.4
2.5
-1.1
-0.3
-1.1
3.6
1.6
0.3
-0.3
-0.8
0.8
0.2
-0.5
0.6
-0.3
0.3
1.3
-0.7
-2.4
-0.4
1.2
-0.3
0.9
0.4
-5.8
-1.8
-0.1
-0.9
-1.3
1M (%)
5.1
16.7
-3.7
9.2
-7.3
1.2
-1.5
6.3
-1.0
8.3
-2.3
3.0
-3.1
-7.4
-2.2
-2.8
1.4
10.3
-1.4
-3.1
-5.3
10.8
-1.4
-1.6
7.4
-7.9
2.9
2.9
0.5
-1.4
19.8
-23.3
-2.5
11.5
6.9
3.3
3.0
1.6
10.3
-7.1
1.5
-4.7
-1.6
-3.4
0.9
1.2
3.8
33.4
6.8
3.1
-6.5
7.1
7.8
-0.8
12M (%)
33.9
17.7
14.3
0.9
-20.8
-17.5
-27.7
16.5
0.5
-21.6
-18.7
-5.8
-10.1
-8.7
-7.5
-5.6
-5.5
-30.1
66.6
-0.2
77.7
-5.0
18.6
45.4
15.5
49.4
1.5
9.7
35.7
61.7
103.2
25.9
21.6
5.9
-2.7
13.3
41.2
73.0
-39.6
40.8
-9.0
34.3
27.8
41.3
90.4
34.3
118.5
32.3
36.6
19.9
39.9
175.9
0.3
4 May 2017
38

THEMATIC/STRATEGY RESEARCH GALLERY

REPORT GALLERY
RECENT INITIATING COVERAGE REPORTS
Rs

DIFFERENTIATED PRODUCT GALLERY

Disclosures
This document has been prepared by Motilal Oswal Securities Limited (hereinafter referred to as Most) to provide information about the company (ies) and/sector(s), if any, covered in the report and may be distributed by it and/or its
affiliated company(ies). This report is for personal information of the selected recipient/s and does not construe to be any investment, legal or taxation advice to you. This research report does not constitute an offer, invitation or
inducement to invest in securities or other investments and Motilal Oswal Securities Limited (hereinafter referred as MOSt) is not soliciting any action based upon it. This report is not for public distribution and has been furnished to
you solely for your general information and should not be reproduced or redistributed to any other person in any form. This report does not constitute a personal recommendation or take into account the particular investment
objectives, financial situations, or needs of individual clients. Before acting on any advice or recommendation in this material, investors should consider whether it is suitable for their particular circumstances and, if necessary, seek
professional advice. The price and value of the investments referred to in this material and the income from them may go down as well as up, and investors may realize losses on any investments. Past performance is not a guide for
future performance, future returns are not guaranteed and a loss of original capital may occur.
MOSt and its affiliates are a full-service, integrated investment banking, investment management, brokerage and financing group. We and our affiliates have investment banking and other business relationships with a some
companies covered by our Research Department. Our research professionals may provide input into our investment banking and other business selection processes. Investors should assume that MOSt and/or its affiliates are
seeking or will seek investment banking or other business from the company or companies that are the subject of this material and that the research professionals who were involved in preparing this material may educate investors
on investments in such business . The research professionals responsible for the preparation of this document may interact with trading desk personnel, sales personnel and other parties for the purpose of gathering, applying and
interpreting information. Our research professionals are paid on twin parameters of performance & profitability of MOSt.
MOSt generally prohibits its analysts, persons reporting to analysts, and members of their households from maintaining a financial interest in the securities or derivatives of any companies that the analysts cover. Additionally, MOSt
generally prohibits its analysts and persons reporting to analysts from serving as an officer, director, or advisory board member of any companies that the analysts cover. Our salespeople, traders, and other professionals or affiliates
may provide oral or written market commentary or trading strategies to our clients that reflect opinions that are contrary to the opinions expressed herein, and our proprietary trading and investing businesses may make investment
decisions that are inconsistent with the recommendations expressed herein. In reviewing these materials, you should be aware that any or all of the foregoingamong other things, may give rise to real or potential conflicts of interest.
MOSt and its affiliated company(ies), their directors and employees and their relatives may; (a) from time to time, have a long or short position in, act as principal in, and buy or sell the securities or derivatives thereof of companies
mentioned herein. (b) be engaged in any other transaction involving such securities and earn brokerage or other compensation or act as a market maker in the financial instruments of the company(ies) discussed herein or act as an
advisor or lender/borrower to such company(ies) or may have any other potential conflict of interests with respect to any recommendation and other related information and opinions.; however the same shall have no bearing
whatsoever on the specific recommendations made by the analyst(s), as the recommendations made by the analyst(s) are completely independent of the views of the affiliates of MOSt even though there might exist an inherent
conflict of interest in some of the stocks mentioned in the research report Reports based on technical and derivative analysis center on studying charts company's price movement, outstanding positions and trading volume, as
opposed to focusing on a company's fundamentals and, as such, may not match with a report on a company's fundamental analysis. In addition MOST has different business segments / Divisions with independent research
separated by Chinese walls catering to different set of customers having various objectives, risk profiles, investment horizon, etc, and therefore may at times have different contrary views on stocks sectors and markets.
Unauthorized disclosure, use, dissemination or copying (either whole or partial) of this information, is prohibited. The person accessing this information specifically agrees to exempt MOSt or any of its affiliates or employees from,
any and all responsibility/liability arising from such misuse and agrees not to hold MOSt or any of its affiliates or employees responsible for any such misuse and further agrees to hold MOSt or any of its affiliates or employees free
and harmless from all losses, costs, damages, expenses that may be suffered by the person accessing this information due to any errors and delays. The information contained herein is based on publicly available data or other
sources believed to be reliable. Any statements contained in this report attributed to a third party represent MOSt’s interpretation of the data, information and/or opinions provided by that third party either publicly or through a
subscription service, and such use and interpretation have not been reviewed by the third party. This Report is not intended to be a complete statement or summary of the securities, markets or developments referred to in the
document. While we would endeavor to update the information herein on reasonable basis, MOSt and/or its affiliates are under no obligation to update the information. Also there may be regulatory, compliance, or other reasons that
may prevent MOSt and/or its affiliates from doing so. MOSt or any of its affiliates or employees shall not be in any way responsible and liable for any loss or damage that may arise to any person from any inadvertent error in the
information contained in this report. MOSt or any of its affiliates or employees do not provide, at any time, any express or implied warranty of any kind, regarding any matter pertaining to this report, including without limitation the
implied warranties of merchantability, fitness for a particular purpose, and non-infringement. The recipients of this report should rely on their own investigations.
This report is intended for distribution to institutional investors. Recipients who are not institutional investors should seek advice of their independent financial advisor prior to taking any investment decision based on this report or for
any necessary explanation of its contents.
Most and it’s associates may have managed or co-managed public offering of securities, may have received compensation for investment banking or merchant banking or brokerage services, may have received any compensation
for products or services other than investment banking or merchant banking or brokerage services from the subject company in the past 12 months.
Most and it’s associates have not received any compensation or other benefits from the subject company or third party in connection with the research report.
Subject Company may have been a client of Most or its associates during twelve months preceding the date of distribution of the research report
MOSt and/or its affiliates and/or employees may have interests/positions, financial or otherwise of over 1 % at the end of the month immediately preceding the date of publication of the research in the securities mentioned in this
report. To enhance transparency, MOSt has incorporated a Disclosure of Interest Statement in this document. This should, however, not be treated as endorsement of the views expressed in the report.
Motilal Oswal Securities Limited is registered as a Research Analyst under SEBI (Research Analyst) Regulations, 2014. SEBI Reg. No. INH000000412
Pending Regulatory inspections against Motilal Oswal Securities Limited:
SEBI pursuant to a complaint from client Shri C.R. Mohanraj alleging unauthorized trading, issued a letter dated 29th April 2014 to MOSL notifying appointment of an Adjudicating Officer as per SEBI regulations to hold inquiry and
adjudge violation of SEBI Regulations; MOSL replied to the Show Cause Notice whereby SEBI granted us an opportunity of Inspection of Documents. Since all the documents requested by us were not covered we have requested to
SEBI vide our letter dated June 23, 2015 to provide pending list of documents for inspection.
List of associate companies of Motilal Oswal Securities Limited -Click
here to access detailed report
Analyst Certification
The views expressed in this research report accurately reflect the personal views of the analyst(s) about the subject securities or issues, and no part of the compensation of the research analyst(s) was, is, or will be directly or
indirectly related to the specific recommendations and views expressed by research analyst(s) in this report. The research analysts, strategists, or research associates principally responsible for preparation of MOSt research receive
compensation based upon various factors, including quality of research, investor client feedback, stock picking, competitive factors and firm revenues
Disclosure of Interest Statement
Analyst ownership of the stock
Served as an officer, director or employee
Companies where there is interest
No
No
A graph of daily closing prices of securities is available at www.nseindia.com and http://economictimes.indiatimes.com/markets/stocks/stock-quotes
Regional Disclosures (outside India)
This report is not directed or intended for distribution to or use by any person or entity resident in a state, country or any jurisdiction, where such distribution, publication, availability or use would be contrary to law, regulation or which
would subject MOSt& its group companies to registration or licensing requirements within such jurisdictions.
For Hong Kong:
This report is distributed in Hong Kong by Motilal Oswal capital Markets (Hong Kong) Private Limited, a licensed corporation (CE AYY-301) licensed and regulated by the Hong Kong Securities and Futures
Commission (SFC) pursuant to the Securities and Futures Ordinance (Chapter 571 of the Laws of Hong Kong) “SFO”. As per SEBI (Research Analyst Regulations) 2014 Motilal Oswal Securities (SEBI Reg No. INH000000412) has
an agreement with Motilal Oswal capital Markets (Hong Kong) Private Limited for distribution of research report in Kong Kong. This report is intended for distribution only to “Professional Investors” as defined in Part I of Schedule 1 to
SFO. Any investment or investment activity to which this document relates is only available to professional investor and will be engaged only with professional investors.” Nothing here is an offer or solicitation of these securities,
products and services in any jurisdiction where their offer or sale is not qualified or exempt from registration. The Indian Analyst(s) who compile this report is/are not located in Hong Kong & are not conducting Research Analysis in
Hong Kong.
For U.S
Motilal Oswal Securities Limited (MOSL) is not a registered broker - dealer under the U.S. Securities Exchange Act of 1934, as amended (the"1934 act") and under applicable state laws in the United States. In addition MOSL is not a
registered investment adviser under the U.S. Investment Advisers Act of 1940, as amended (the "Advisers Act" and together with the 1934 Act, the "Acts), and under applicable state laws in the United States. Accordingly, in the
absence of specific exemption under the Acts, any brokerage and investment services provided by MOSL, including the products and services described herein are not available to or intended for U.S. persons.
This report is intended for distribution only to "Major Institutional Investors" as defined by Rule 15a-6(b)(4) of the Exchange Act and interpretations thereof by SEC (henceforth referred to as "major institutional investors"). This
document must not be acted on or relied on by persons who are not major institutional investors. Any investment or investment activity to which this document relates is only available to major institutional investors and will be
engaged in only with major institutional investors. In reliance on the exemption from registration provided by Rule 15a-6 of the U.S. Securities Exchange Act of 1934, as amended (the "Exchange Act") and interpretations thereof by
the U.S. Securities and Exchange Commission ("SEC") in order to conduct business with Institutional Investors based in the U.S., MOSL has entered into a chaperoning agreement with a U.S. registered broker-dealer, Motilal Oswal
Securities International Private Limited. ("MOSIPL"). Any business interaction pursuant to this report will have to be executed within the provisions of this chaperoning agreement.
The Research Analysts contributing to the report may not be registered /qualified as research analyst with FINRA. Such research analyst may not be associated persons of the U.S. registered broker-dealer, MOSIPL, and therefore,
may not be subject to NASD rule 2711 and NYSE Rule 472 restrictions on communication with a subject company, public appearances and trading securities held by a research analyst account.
For Singapore
Motilal Oswal Capital Markets Singapore Pte Limited is acting as an exempt financial advisor under section 23(1)(f) of the Financial Advisers Act(FAA) read with regulation 17(1)(d) of the Financial Advisors Regulations and is a
subsidiary of Motilal Oswal Securities Limited in India. This research is distributed in Singapore by Motilal Oswal Capital Markets Singapore Pte Limited and it is only directed in Singapore to accredited investors, as defined in the
Financial Advisers Regulations and the Securities and Futures Act (Chapter 289), as amended from time to time.
In respect of any matter arising from or in connection with the research you could contact the following representatives of Motilal Oswal Capital Markets Singapore Pte Limited:
Varun Kumar
Varun.kumar@motilaloswal.com
Contact : (+65) 68189232
Office Address:21 (Suite 31),16 CollyerQuay,Singapore 04931
13 December 2016
Motilal Oswal Tower, Level 9, Sayani Road, Prabhadevi, Mumbai 400 025
Phone: +91 22 3982 5500 E-mail: reports@motilaloswal.com
Motilal Oswal Securities Ltd
40