BSE SENSEX
30,126
S&P CNX
9,360
Aurobindo Pharma
CMP: INR592
4 May 2017
Update
| Sector:
Healthcare
TP: INR900(+52%)
Buy
Positives outweigh risks – time to accumulate
USFDA inspections not a cause of concern:
Aurobindo Pharma’s (ARBP) Unit 3
(oral solids; ~USD200m sales) and Unit 4 (injectables; ~USD100m of sales)
facilities received six and seven observations, respectively, following the USFDA
inspection in April 2017. Unit 3 observations are already out – there are no
data integrity issues, with all the observations being procedural in nature. Unit
4 was previously inspected in September 2016 and received EIR in February
this year. The inspection was triggered as ARBP added a new block in the
facility. According to the company, all the observations at Unit 4 are procedural
(letter should be out in coming few days).
Lower tax rate in US bodes well; risk mitigation strategy in place for border
tax:
The US government has proposed to lower the corporate tax rate from
35% to 15%. The company’s US subsidiaries generated PBT of INR5b in FY16
and paid tax @32% of PBT. If the tax rate in the US comes down to 15%, then
ARBP will save >INR1b in FY17/18E (EPS of ~INR1.8-2). On the other hand,
border tax adjustment is a key overhang to the generic suppliers. We believe
ARBP can mitigate this risk partially by expanding its Auro Life facility (can go 3x
by doing brownfield expansion).
Pricing risk lowest among peers:
No single product for ARBP contributes more
than 3% of sales (unlike SUNP, LPC and DRRD, where the top three products
account for >20-25% of sales). Also, no single ANDA has any meaningful
disproportionate contribution to margins, as ARBP has a matured product
basket with all ~190 launched ANDAs facing competition from multiple players
(typically 4-5 or more).
R&D expense to remain range bound in near term:
We expect ARBP to file 35-
40 ANDAs in FY18E (including 6-7 controlled substance, 10-15 oncology &
hormones, etc.). Oncology & hormones-related R&D expense will be borne by
the Eugia JV, and will not be part of R&D expense for ARBP. We expect R&D
expense for the company to not inch up beyond 5.5% in FY18E and 7% in
FY19E. Impact of this increase in expense will get offset by ~50% growth in the
high-margin injectables business.
Commissioning of key plants to drive volume growth in FY18/19E:
Over next
6-9 months, three key formulation plants are getting commissioned, including
Vizag (dedicated supply to EU started in March 17), Unit XVI (antibiotic
injectable plant to supply products in the US) and Naidupet (oral solids plant to
supply to the US). Commissioning of the Vizag plant will have a two-pronged
impact: 1) Capacity at Unit VII and Unit III will get released (which are primarily
used for supply to the US, and are running at capacity utilization of ~80%). 2)
European business margin should expand (to ~7-8% in FY18E from ~5%
currently) as the company plans to manufacture 50% of products sold in EU at
this plant. The Naidupet plant will get commissioned by mid-FY18E, and will be
one of the largest formulations plants for ARBP (with capacity of 7-8b tablets).
Stock Info
Bloomberg
Equity Shares (m)
52-Week Range (INR)
1, 6, 12 Rel. Per (%)
M.Cap. (INR b)
M.Cap. (USD b)
Avg Val, INRm
Free float (%)
ARBP IN
586
895 / 582
-14/-29/-47
347.0
5.4
1605
48.1
Financials Snapshot (INR b)
2017E 2018E 2019E
Y/E Mar
Net Sales
151.7 174.9 199.3
EBITDA
35.8
41.8
48.8
PAT
23.3
26.6
31.8
EPS (INR)
39.8
45.4
54.3
Gr. (%)
17.5
14.1
19.7
BV/Sh (INR)
157.9 200.8 252.6
RoE (%)
28.6
25.3
24.0
RoCE (%)
19.5
19.4
19.5
P/E (x)
14.9
13.0
10.9
P/BV (x)
3.7
2.9
2.3
Shareholding pattern (%)
As On
Mar-17 Dec-16 Mar-16
Promoter
51.9
51.9
53.8
DII
12.8
11.0
7.3
FII
21.0
24.1
27.4
Others
14.4
13.0
11.5
FII Includes depository receipts
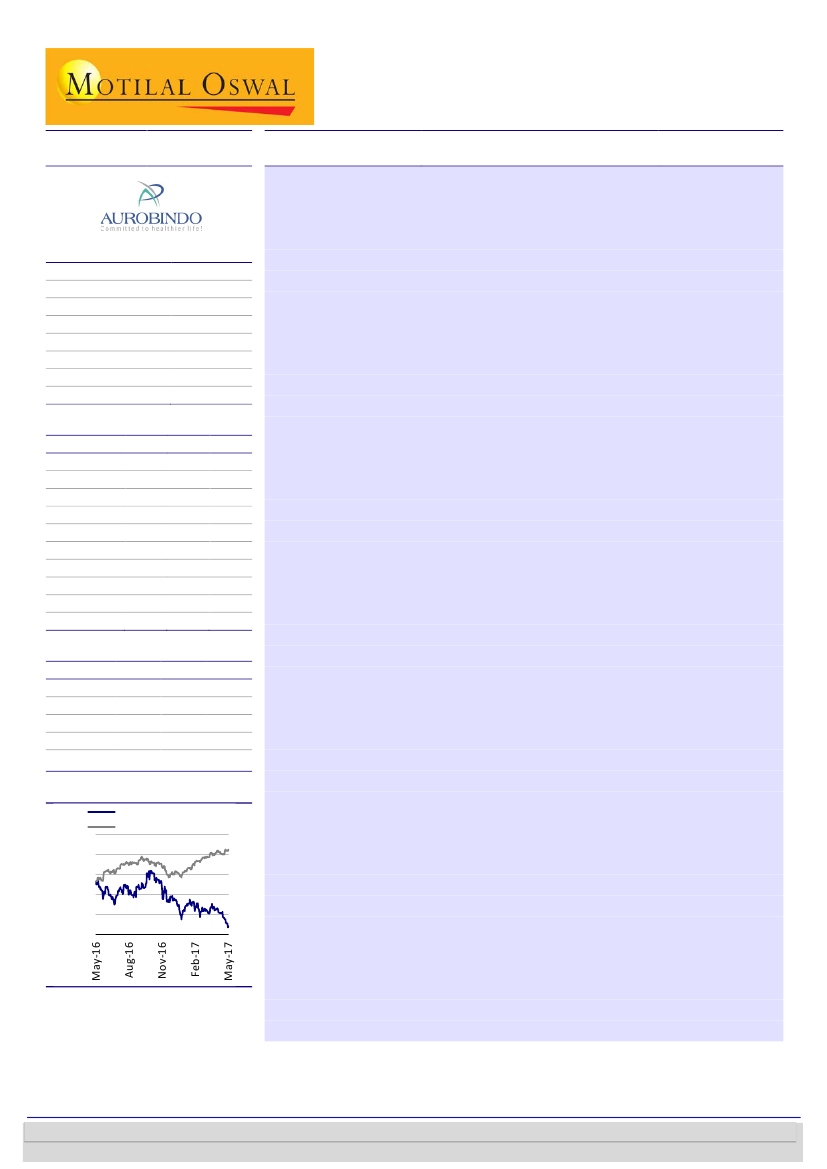
Stock Performance (1-year)
Aurobindo Pharma
Sensex - Rebased
1,050
950
850
750
650
550
Kumar Saurabh
(Kumar.Saurabh@MotilalOswal.com); +91 22 6129 1519
Motilal Oswal research is available on www.motilaloswal.com/Institutional-Equities, Bloomberg, Thomson Reuters, Factset and S&P Capital.
Investors are advised to refer through important disclosures made at the last page of the Research Report.

Aurobindo Pharma
Strong launch pipeline, coupled with volume push, to drive growth:
ARBP
received 49 and 47 ANDA approvals in FY16 and 9MFY17, respectively (highest in
the industry). We expect this strong approval and launch momentum to continue
on the back of ~159 pending ANDAs. We expect ARBP to deliver mid-teens
growth in the US, led by its strong launch pipeline in injectables (~40 pending
ANDAs), steady mid-teens growth in Natrol, and huge capacity expansion in orals
and injectables (which will lead to volume push in existing as well as new
products). We expect a pick-up in US sales over coming quarters, driven by key
launches such as Epzicom, Meropenem, Tenofovir, Toprol XL and Fortamet and
Solu-Medrol. Apart from this, ARBP has an approved pipeline of ~50 products
(~13 OTCs, 5-6 OTCs, 6 injectables, rest orals including Vancomycin), which will
be launched by 2QFY18.
EU and ARV business can surprise positively in FY18E/19E:
Manufacturing of
~60 products has been shifted to India from EU (to Unit VII & III). Given that
supply from Vizag to EU markets has started from March 2017, the company
plans to shift manufacturing of ~114 products from Vizag (sales value of
>USD200m) over next 12-18 months, leading to significant cost savings. We
expect EBITDA margin of this business to expand from ~5% currently to ~7-8% in
FY18E and to low-double-digits in FY19E. ARV business growth in FY19 will be
driven by a pick-up in DTG triple combination approvals (USD500m market).
Strong earnings growth trajectory and improving cash flow to drive valuations:
At its CMP, ARBP trades at <15x FY17E, which is at >25% discount to its peers.
The valuation gap is expected to narrow on account of the company’s increasing
profitability, strong earnings growth trajectory (17% CAGR until FY19E) and
improving free cash flow. ARBP remains one of our top picks in the sector, with a
target price of INR900 @ 18x
1HFY19E
PER (v/s INR915 @ 18x 1HFY19E earlier).
We cut our FY18/19E EPS by 6/5% as we build the impact of pricing pressure in
the US.
4 May 2017
2

Aurobindo Pharma
US business – strong growth to sustain
US business to record mid-teens CAGR
Over FY11-16, ARBP delivered robust >50% CAGR, driven by niche oral launches
(including Cymbalta) and entry into injectables, controlled substances and
government tender business. Despite strong growth over the last five years, we
believe ARBP is well poised to outpace peers in the coming years. We expect ARBP
to deliver mid-teens growth in the US on the back of a strong launch pipeline in
injectables (~40 pending ANDAs), steady mid-teens growth in Natrol and huge
capacity expansion in orals and injectables (which will lead to volume push in
existing and new products). We expect a pick-up in US sales over the coming
quarters led by key launches, including Epzicom, Meropenem, Tenofovir, Toprol XL
and Fortamet, Solu-Medrol. Apart from this, ARBP has an approved pipeline of ~50
products (~13 OTCs, 5-6 OTCs, 6 injectables, rest orals including Vancomycin), which
are expected to be launched in 2QFY18.
Exhibit 1: US business to grow at ~14%YoY
US formulations (INR b)
94.2
YoY growth (%)
48.1
30.4
(0.5)
12
FY11
12
FY12
18
FY13
34
FY14
42.0
27.2
12.0
12.5
77
FY18E
16.0
90
FY19E
48
FY15
61
FY16
69
FY17E
Source: Company, MOSL
Lower tax rate in US bodes well; risk mitigation strategy in place for border tax
The US government has proposed to lower the corporate tax rate from 35% to 15%.
The company’s US subsidiaries generated PBT of INR5b in FY16 and paid tax @32%
of PBT. If the tax rate in the US comes down to 15%, then ARBP will save >INR1b in
FY17/18E (EPS of ~INR1.8-2). On the other hand, border tax adjustment is a key
overhang to the generic suppliers. We believe ARBP can mitigate this risk partially by
expanding its Auro Life facility (can go 3x by doing brownfield expansion).
Exhibit 2: US subsidiaries’ contribution to ARBP
Name of the Subsidiary
Aurobindo Pharma USA Inc
Aurolife Pharma LLC
Auromedics Pharma LLC
Auro Health LLC
Natrol Inc
Total US subsidiaries
Consolidated ARBP
US as % of ARBP
Sales
34,945.50
9,215.80
6,305.00
259.4
7,367.80
58,093.50
138,960.80
41.8%
PBT
1,080.60
2,605.30
406.5
-220.8
1,122.90
4,994.50
27,224.70
18.3%
Tax
350.3
844.6
131.8
-71.6
364
1,619.10
7443.7
21.8%
PAT
730.3
1,760.70
274.7
-149.2
758.8
3,375.30
19,820.10
17.0%
Source:
4 May 2017
3

Aurobindo Pharma
Burst of approvals provides strong visibility of future growth
ARBP received 49 and 47 ANDA approvals in FY16 and 9MFY17, respectively (highest
in the industry). The approvals are a mix of plain vanilla generics, limited
competition injectables and complex oral generics. Out of the pending injectables
portfolio of ~40 ANDAs, most were filed 12-24 months back. We thus expect
multiple injectables approvals to come through over the next two years.
Exhibit 3: Robust ANDA pipeline
ANDA filed
ANDAs pending
336
209
107
239
120
269
171
114
210
183
159
376
398
421
Exhibit 4: Highest number of approvals amongst peers
ANDA approvals
36
16
18
17
49
47
10
1
FY11
FY12
FY13
FY14
FY15
FY16
9MFY17
FY10
FY11
FY12
FY13
FY14
FY15
FY16 9MFY17
Source: Company, MOSL
Exhibit 5: Unit-wise ANDA filings as on 31-Dec-2016
Unit
III
IV
VI B
VII (SEZ)
X
XII
Auro Life USA
Auronext
Total
Details
Oral Formulations
Inj & Ophthalmics
Ceph Oral
Oral Formulations
Oral Formulations
Penicillin Oral & Inj
Oral Formulations
Penem Inj
Final Approval
Tentative Approval
Mar-16
Dec-16
Mar-16
Dec-16
93
99
19
16
28
38
2
2
11
11
54
79
15
23
19
10
215
19
16
262
36
41
Under Review
Mar-16
Dec-16
12
10
37
35
79
56
2
1
10
4
118
Total
Mar-16
124
67
11
148
19
26
3
398
Dec-16
125
75
11
158
2
20
26
4
421
16
3
147
Exhibit 6: Expanding portfolio mix toward high-value products
ANDAs
22.4
3.2
12
2.5
39
80
2.5
16
Addressable Market in USD b
12.3
27.1
69
5.7
27
2
10
124
0.6
4
2.2
10
1
30
Source: Company, MOSL
4 May 2017
4

Aurobindo Pharma
European operations – Commencement of Vizag facility to lead to margin
expansion
ARBP has expanded its Europe business inorganically. Till date, it has acquired 5-6
businesses in Europe (Milopharm in 2006, Pharmacin in 2007, Actavis in 2014,
Generis & Teva businesses in 2016). After these acquisitions, ARBP has become one
of the top 10 players in EU. Supplies from the Vizag plant to Europe will start from
March-17. This will have a two-pronged impact: 1) capacity at Unit VII and Unit III
will get released (which are primarily used for supply to the US and are running at
capacity utilization of ~80%) and 2) European business margins should expand (to
~7-8% in FY18E from ~5% currently) as the company plans to manufacture 50% of
products sold in EU at this plant.
Currently, manufacturing of ~60 products has been shifted to India (to Unit VII & III).
Given that supply from Vizag to EU markets will start from Mar-17, the company
plans to shift manufacturing of ~114 products from Vizag (sales value of >USD200m)
over next 12-18 months. This will lead to significant cost savings. We expect EBITDA
margins of this business to expand from ~5% currently to ~7-8% in FY18 and low-
double-digits in FY19.
Exhibit 7: EU growth bolstered by Actavis acquisition
EU Sales (INR b)
375.3
% YoY growth
18.7
3
FY12
36.2
43.6
-2.0
32
FY15
31
FY16
7.0
33
FY17E
27.0
43
FY18E
12.0
48
FY19E
5
FY13
7
FY14
Source: Company, MOSL
Exhibit 8: Sales split by Channel
Exhibit 9: Sales split by Therapeutic
Profile
CV & Resp
Exhibit 10: Sales split by Dosage Forms
Tablet
1
10
15
13
21
Capsule
Inj & others
58
Cream
liquid
Powder
Gel
Source: Company, MOSL
3
23
8
15
51
Gx
TGx
BGx
Hx
OTC
7
15
5
10
CNS
27
Anti Infective
Digestive
14
22
Antineo plastic
Dermatology
Others
Source: Company, MOSL
4 May 2017
5

Aurobindo Pharma
Exhibit 11: EU: Portfolio mix across channels
Channels
Geographies
# of Products
Gx
All 9 countries
BGx
7 countries
Hx
All 9 countries
343 (predominantly Inj)
Focus on high value areas
including oncology
TGx
Germany, Spain &
Netherlands
765 (Including Gx
products)
Tender based
business
761 (Primarily tablets & capsules) 34
Other Highlights Amongst top 10 in most markets Includes leading brands such as
Neotigason, Floxapen, Bezalip among
others
Portugal acquisition to provide market leadership:
With Generis acquisition
(announced in Jan-17), ARBP gets a well-diversified portfolio (primarily in the area of
Cardio – 26% of sales, CNS – 22% and anti-infectives – 13%), addressing 95% of the
generic retail market by value with 227 products + 51 products awaiting approval.
Post completion of this acquisition, ARBP will become number 1 player in the
Portugal market and among the top 10 generic companies in EU (from no. 13
earlier). Portugal’s pharma market size stands at EUR3.4b, with generic penetration
in volume at ~30%, significantly below EU average of ~53% and US average of ~80%.
Estimated sales of Generis stood at EUR64.8m in CY16 (largely remained flat over
last three years), with EBITDA of EUR12.7m (EBITDA margin of ~19.6% v/s ARBP’s EU
biz margin of mid-single-digits). ARBP expects sales growth of >12% in CY17 with
improved EBITDA margin of 21.7%. Improvement in profitability is expected on the
back of new launches and resolution of temporary supply chain issues from third
party in 2016.
ARBP expects synergy benefits of EUR2m and EUR5m in 2018 and 2019, respectively
(and expected to improve further). This will be primarily driven by new product
portfolio launch, market leadership status and improvement in capacity utilization.
With this acquisition, ARBP will have its first formulations plant in EU (with capacity
of 1.2b tablets/ capsules/ sachets). Existing plant capacity is at ~50%, which provides
ample room for growth. Deeper penetration in Portugal markets and ability to
capture untapped business opportunities in other EU markets will help the company
improve its capacity utilization to ~80% by 2020.
At deal value of EUR135m, this transaction is valued at 10.5x and 8.5x CY16 and
CY17 EV/ EBITDA, respectively. Despite the acquisition of businesses in Portugal and
France, ARBP should end FY17 with net debt of <USD600m (with net debt/equity of
~0.55- 0.6x), at par with FY16.
Dolutegravir (DTG) – the next growth driver
ARBP is the first generic company to sign license with ViiV Healthcare for the
next generation Integrase Inhibitor – DTG.
Filed an ANDA application for DTG 50mg with USFDA under the PEPFAR
program.
WHO announced this drug as a first line reserve drug in its 2015 HIV
treatment guidelines.
Play a collaborative role in upgrading millions of patients to the latest best
in-class ARV drug.
Developing a triple drug combination containing DTG.
Market size is expected to be USD2b in 2017; Triple combination drug
containing DTG expected to garner major share.
6
4 May 2017

Aurobindo Pharma
Valuation and view
ARBP has outperformed most pharma peers over past 12 months, driven by a
significant improvement in its operating performance post clearance of USFDA
import alert and ramp-up in US launches, including high-margin gCymbalta. With the
recent acquisition in EU (Actavis assets) and US (Natrol), the share of high-margin
formulations in total revenues has increased to ~80% (v/s 54% in FY10), positioning
it among large-cap formulation players. Our target price of INR900 discounts ARBP’s
1HFY19E
EPS at 18x P/E multiple, which is:
At par with its 3-year average P/E multiple, which is justified given its stronger
business profile and earnings outlook.
At >20% discount to sector average target P/E multiple, factoring in higher
leverage and potential execution related risks.
Implies a PEG of 1.0x (FY17-19E EPS CAGR of 17%).
We believe that the re-rating of the stock from single-digit P/E multiple to current
levels partly factors in transition to formulations player, improved execution in the
US and moderation in leverage (from 1.2x D/E in FY10 to 06.x in FY17E). However,
current valuations at 13x FY18E are still at ~30-35% discount to the sector average,
which is unjustified, in our view. We argue for P/E re-rating for ARBP due to:
Strong EPS outlook of % CAGR backed
Strong free cash flow generation.
Deleveraging of balance sheet, as we expect D/E to improve to 0.2x by FY19E.
Key catalysts to drive the stock’s performance over medium term:
Improvement in EU profitability (30% of business), led by deeper penetration in
existing markets and site transfer to India.
Launch of high-margin products in the US, including injectables (25+ launches
over next 18 months) and controlled substance.
Focus on high-margin triple combination ARV products in Africa (from FY16E).
Delay in ANDA approvals.
Worsening of pricing environment in EU.
Currency fluctuations both in USD and EUR terms.
Exhibit 13: P/E relative to Sensex
100
29.4
50
0
12.7
-50
-100
-30.7
-32.0
Risks to our investment assumptions:
Exhibit 12: P/E Band (x)
40
30
20
10
0
PE (x)
Median(x)
Peak(x)
Min(x)
Avg(x)
Aurobindo Pharma PE Relative to Sensex PE (%)
LPA (%)
12.4
1.5
11.9
Source: Company, MOSL
4 May 2017
7

Aurobindo Pharma
Story in charts
Exhibit 14: Formulation led sales growth (INR b)
Formulations (INR b)
API (INR b)
35
30.4
(0.5)
96
112
123
144
165
12
12
18
34
48
61
Exhibit 15: US sales to grow at 14% CAGR over FY17-19E
US formulations (INR b)
94.2
YoY growth (%)
27
18
24
21
26
25
34
29
54
29
30
33
48.1
42.0
27.2
12.0
69
12.5
77
16.0
90
Source: Company, MOSL
Exhibit 16: EBITDA growth to improve in FY17-19E
EBITDA (INR b)
165
41
-36
10
6
9
23
26
32
36
42
49
EBITDA growth (%)
Exhibit 17: EBITDA margins improving with product mix
Gross Margins (%)
50.0
45.5
48.9
55.5
54.6
EBITDA Margins (%)
55.7 55.8 56.3 57.0
17
12
25
12
17
17
21.9
13.2
14.7
28.2
21.2
23.1
23.6
23.9
24.5
Source: Company, MOSL
Exhibit 18: EPS growth to sustain at 17%
EPS (INR)
Exhibit 19: Rich ANDA pipeline
ANDA filed
269
120
171
114
210
183
159
ANDAs pending
376
336
398
421
209
107
3.3
5.0
22.7
27.0
33.9
39.8
45.4
54.3
239
9.2
Source: Company, MOSL
4 May 2017
8

Aurobindo Pharma
Exhibit 20: Improving cash flows to reduce debt
5.0
2.3
Total Debt (INR b)
3.7
1.5
1.3
25
1.0
0.9
0.5
34
0.1
8
24
31
34
36
39
41
37
31
13
5
12
9
23
21
Net Debt/EBITDA
Exhibit 21: Return ratios (%)
ROE (%)
42
ROCE (%)
35
32
29
25
24
20
20
19
20
Source: Company, MOSL
Exhibit 22: R&D expense to increase going ahead
R&D expense (INR b)
% of sales
6.9
5.5
4.1
3.4
3.5
4.3
3.1
2.6
3
2.9
Exhibit 23: Asset turnover improving
Gross Block (INR b)
2.0
1.5
1.6
2.3
2.3
Asset turnover (x)
2.1
2.2
2.3
1.7
2
2
2
3
4
7
10
14
24
31
37
41
54
61
74
81
88
Source: Company, MOSL
Exhibit 24: EU business to grow at ~7%
EU Sales (INR b)
375.3
% YoY growth
Exhibit 25: Formulation share getting bigger
Formulations (INR b)
18
43
33
7.0
48
12.0
24
26
34
54
21
25
29
27
29
API (INR b)
30
33
35
18.7
3
36.2
43.6
32
7
31
-2.0
27.0
96
112
123
144
165
5
Source: Company, MOSL
4 May 2017
9

Aurobindo Pharma
Financials and Valuations
Income Statement
Y/E Mar
Net Sales
Change (%)
EBITDA
EBITDA Margin (%)
Depreciation
EBIT
Interest
Other Income
Extraordinary items
PBT
Tax
Tax Rate (%)
Min. Int. & Assoc. Share
Reported PAT
Adjusted PAT
Change (%)
2012
46,274
5.6
6,101
13.2
2,005
4,096
1,028
247
-5,445
-2,129
-888
41.7
-6
-1,235
1,939
-63.9
2013
58,553
26.5
8,610
14.7
2,487
6,122
1,313
285
-1,353
3,741
827
22.1
-25
2,939
2,939
51.6
2014
80,998
38.3
22,828
28.2
3,125
19,703
1,079
232
-2,031
16,825
3,635
21.6
-38
13,228
13,228
350.1
2015
121,205
49.6
25,636
21.2
3,326
22,310
843
808
-596
21,679
5,966
27.5
-45
15,758
15,758
19.1
2016
138,961
14.6
32,056
23.1
3,926
28,130
927
682
-660
27,225
7,444
27.3
-39
19,820
19,820
25.8
2017E
151,750
9.2
35,813
23.6
4,368
31,445
815
550
430
31,610
8,377
26.5
-50
23,283
23,283
17.5
2018E
174,860
15.2
41,792
23.9
4,897
36,895
(INR Million)
2019E
199,258
14.0
48,818
24.5
5,338
43,481
926
600
0
36,569
10,057
27.5
-55
26,568
26,568
14.1
747
750
0
43,484
11,741
27.0
-55
31,798
31,798
19.7
Balance Sheet
Y/E Mar
Share Capital
Reserves
Net Worth
Debt
Deferred Tax
Total Capital Employed
Gross Fixed Assets
Less: Acc Depreciation
Net Fixed Assets
Capital WIP
Investments
Current Assets
Inventory
Debtors
Cash & Bank
Loans & Adv, Others
Curr Liabs & Provns
Curr. Liabilities
Provisions
Net Current Assets
Total Assets
2012
582
22,814
23,397
30,959
-16
54,442
30,863
8,916
21,947
6,454
385
33,536
15,456
12,400
709
4,972
7,880
7,174
706
25,656
54,442
2013
582
25,475
26,058
34,355
680
61,202
37,080
11,246
25,834
2,185
223
43,982
19,236
15,970
2,085
6,692
11,576
10,685
891
32,406
61,202
2014
583
36,919
37,502
36,339
2,054
76,151
41,066
14,613
26,453
3,097
198
64,386
23,675
26,366
1,786
12,559
18,747
17,389
1,358
45,640
76,151
2015
584
50,975
51,559
38,636
2,058
92,511
53,821
17,405
36,416
4,196
198
87,647
36,113
35,392
4,691
11,451
36,587
34,161
2,426
51,060
92,511
2016
585
69,982
70,567
40,762
2,364
114,289
61,224
19,713
41,511
10,238
2
104,356
40,881
41,719
8,344
13,412
42,704
40,641
2,063
61,652
114,289
2017E
585
91,802
92,387
37,030
2,411
132,435
74,224
24,081
50,143
15,000
200
106,618
44,103
45,733
4,882
11,900
40,413
39,488
925
66,206
132,435
2018E
585
116,907
117,492
33,907
2,459
154,478
81,224
28,977
52,246
15,000
200
127,896
50,245
52,698
11,053
13,900
41,751
40,826
925
86,145
154,478
(INR Million)
2019E
585
147,242
147,827
31,259
2,508
182,226
88,224
34,315
53,909
15,000
200
157,283
56,338
60,050
26,994
13,900
45,052
44,127
925
112,231
182,226
4 May 2017
10

Aurobindo Pharma
Financials and Valuations
Ratios
Y/E Mar
Basic (INR)
EPS
Cash EPS
Book Value
DPS
Payout (incl. Div. Tax.)
Valuation(x)
P/E
Price / Book Value
EV/Sales
EV/EBITDA
Dividend Yield (%)
Profitability Ratios (%)
RoE
RoCE
RoIC
Turnover Ratios (%)
Asset Turnover (x)
Debtors (No. of Days)
Inventory (No. of Days)
Creditors (No. of Days)
Leverage Ratios (%)
Net Debt/Equity (x)
2012
3.3
6.8
40.2
0.5
-23.6
0.0
0.0
0.0
0.0
0.1
8.1
4.9
5.4
0.8
96
122
96
1.3
2013
5.0
9.3
44.7
0.8
14.9
0.0
0.0
0.0
0.0
0.1
11.9
8.7
9.2
1.0
97
120
118
1.2
2014
22.7
28.1
64.3
1.5
6.6
29.4
10.4
5.3
18.6
0.2
41.6
23.3
24.2
1.1
116
107
137
0.9
2015
27.0
32.7
88.3
2.3
8.3
24.8
7.6
3.5
16.6
0.3
35.4
20.4
20.9
1.3
105
109
136
0.7
2016
33.9
40.6
120.6
2.0
5.9
19.7
5.5
3.0
13.2
0.3
32.5
20.8
22.8
1.2
107
107
150
0.5
2017E
39.8
47.3
157.9
2.5
6.3
16.8
4.2
2.8
11.8
0.4
28.6
19.5
22.2
1.1
107
106
144
0.3
2018E
45.4
53.8
200.8
2.5
5.5
14.7
3.3
2.4
9.9
0.4
25.3
19.4
22.2
1.1
107
105
138
0.2
2019E
54.3
63.5
252.6
2.5
4.6
12.3
2.6
2.0
8.1
0.4
24.0
19.5
23.7
1.1
107
103
137
0.0
Cash Flow Statement
Y/E Mar
Adjusted EBITDA
Non cash opr. exp (inc)
(Inc)/Dec in Wkg. Cap.
Tax Paid
Other operating activities
CF from Op. Activity
(Inc)/Dec in FA & CWIP
Free cash flows
(Pur)/Sale of Invt
Others
CF from Inv. Activity
Inc/(Dec) in Net Worth
Inc / (Dec) in Debt
Interest Paid
Divd Paid (incl Tax) & Others
CF from Fin. Activity
Inc/(Dec) in Cash
Add: Opening Balance
Closing Balance
2012
6,101
247
-1,288
-327
-5,445
-712
-6,446
-7,157
0
0
-6,446
474
6,828
-1,028
-276
5,998
-1,159
1,867
708
2013
8,610
285
-5,374
-132
-1,353
2,036
-2,106
-70
-163
0
-2,269
159
3,403
-1,313
-641
1,608
1,376
709
2,084
2014
22,828
232
-13,533
-3,635
-2,031
3,863
-4,656
-793
-25
0
-4,681
-910
2,131
-1,079
379
520
-298
2,085
1,786
2015
25,636
808
-2,515
-5,966
-596
17,367
-14,389
2,978
0
0
-14,388
-386
2,298
-843
-1,142
-73
2,905
1,786
4,691
2016
32,056
682
-6,939
-7,444
-660
17,696
-15,062
2,633
-196
0
-15,259
359
2,464
-927
-681
1,215
3,652
4,691
8,343
2017E
35,813
550
-8,016
-8,377
430
20,401
-17,762
2,638
198
0
-17,564
0
-3,721
-815
-1,762
-6,298
-3,461
8,344
4,883
2018E
41,792
600
-13,768
-10,057
0
18,567
-7,000
11,567
0
0
-7,000
0
-3,110
-926
-1,360
-5,396
6,171
4,882
11,053
(INR Million)
2019E
48,818
750
-10,145
-11,741
0
27,683
-7,000
20,683
0
0
-7,000
0
-2,636
-747
-1,359
-4,742
15,941
11,053
26,994
4 May 2017
11

Disclosures
This document has been prepared by Motilal Oswal Securities Limited (hereinafter referred to as Most) to provide information about the company (ies) and/sector(s), if any, covered in the report and may be distributed by it
and/or its affiliated company(ies). This report is for personal information of the selected recipient/s and does not construe to be any investment, legal or taxation advice to you. This research report does not constitute an
offer, invitation or inducement to invest in securities or other investments and Motilal Oswal Securities Limited (hereinafter referred as MOSt) is not soliciting any action based upon it. This report is not for public distribution
and has been furnished to you solely for your general information and should not be reproduced or redistributed to any other person in any form. This report does not constitute a personal recommendation or take into
account the particular investment objectives, financial situations, or needs of individual clients. Before acting on any advice or recommendation in this material, investors should consider whether it is suitable for their
particular circumstances and, if necessary, seek professional advice. The price and value of the investments referred to in this material and the income from them may go down as well as up, and investors may realize losses
on any investments. Past performance is not a guide for future performance, future returns are not guaranteed and a loss of original capital may occur.
MOSt and its affiliates are a full-service, integrated investment banking, investment management, brokerage and financing group. We and our affiliates have investment banking and other business relationships with a some
companies covered by our Research Department. Our research professionals may provide input into our investment banking and other business selection processes. Investors should assume that MOSt and/or its affiliates are
seeking or will seek investment banking or other business from the company or companies that are the subject of this material and that the research professionals who were involved in preparing this material may educate
investors on investments in such business . The research professionals responsible for the preparation of this document may interact with trading desk personnel, sales personnel and other parties for the purpose of
gathering, applying and interpreting information. Our research professionals are paid on twin parameters of performance & profitability of MOSt.
MOSt generally prohibits its analysts, persons reporting to analysts, and members of their households from maintaining a financial interest in the securities or derivatives of any companies that the analysts cover.
Additionally, MOSt generally prohibits its analysts and persons reporting to analysts from serving as an officer, director, or advisory board member of any companies that the analysts cover. Our salespeople, traders, and
other professionals or affiliates may provide oral or written market commentary or trading strategies to our clients that reflect opinions that are contrary to the opinions expressed herein, and our proprietary trading and
investing businesses may make investment decisions that are inconsistent with the recommendations expressed herein. In reviewing these materials, you should be aware that any or all of the foregoing among other things,
may give rise to real or potential conflicts of interest. MOSt and its affiliated company(ies), their directors and employees and their relatives may; (a) from time to time, have a long or short position in, act as principal in, and
buy or sell the securities or derivatives thereof of companies mentioned herein. (b) be engaged in any other transaction involving such securities and earn brokerage or other compensation or act as a market maker in the
financial instruments of the company(ies) discussed herein or act as an advisor or lender/borrower to such company(ies) or may have any other potential conflict of interests with respect to any recommendation and other
related information and opinions.; however the same shall have no bearing whatsoever on the specific recommendations made by the analyst(s), as the recommendations made by the analyst(s) are completely independent
of the views of the affiliates of MOSt even though there might exist an inherent conflict of interest in some of the stocks mentioned in the research report
Reports based on technical and derivative analysis center on studying charts company's price movement, outstanding positions and trading volume, as opposed to focusing on a company's fundamentals and, as such, may not match with a report on a
company's fundamental analysis. In addition MOST has different business segments / Divisions with independent research separated by Chinese walls catering to different set of customers having various objectives, risk profiles, investment horizon,
etc, and therefore may at times have different contrary views on stocks sectors and markets.
Unauthorized disclosure, use, dissemination or copying (either whole or partial) of this information, is prohibited. The person accessing this information specifically agrees to exempt MOSt or any of its affiliates or employees
from, any and all responsibility/liability arising from such misuse and agrees not to hold MOSt or any of its affiliates or employees responsible for any such misuse and further agrees to hold MOSt or any of its affiliates or
employees free and harmless from all losses, costs, damages, expenses that may be suffered by the person accessing this information due to any errors and delays. The information contained herein is based on publicly
available data or other sources believed to be reliable. Any statements contained in this report attributed to a third party represent MOSt’s interpretation of the data, information and/or opinions provided by that third party
either publicly or through a subscription service, and such use and interpretation have not been reviewed by the third party. This Report is not intended to be a complete statement or summary of the securities, markets or
developments referred to in the document. While we would endeavor to update the information herein on reasonable basis, MOSt and/or its affiliates are under no obligation to update the information. Also there may be
regulatory, compliance, or other reasons that may prevent MOSt and/or its affiliates from doing so. MOSt or any of its affiliates or employees shall not be in any way responsible and liable for any loss or damage that may
arise to any person from any inadvertent error in the information contained in this report. MOSt or any of its affiliates or employees do not provide, at any time, any express or implied warranty of any kind, regarding any
matter pertaining to this report, including without limitation the implied warranties of merchantability, fitness for a particular purpose, and non-infringement. The recipients of this report should rely on their own
investigations.
This report is intended for distribution to institutional investors. Recipients who are not institutional investors should seek advice of their independent financial advisor prior to taking any investment decision based on this
report or for any necessary explanation of its contents.
Most and it’s associates may have managed or co-managed public offering of securities, may have received compensation for investment banking or merchant banking or brokerage services, may have received any
compensation for products or services other than investment banking or merchant banking or brokerage services from the subject company in the past 12 months.
Most and it’s associates have not received any compensation or other benefits from the subject company or third party in connection with the research report.
Subject Company may have been a client of Most or its associates during twelve months preceding the date of distribution of the research report
MOSt and/or its affiliates and/or employees may have interests/positions, financial or otherwise of over 1 % at the end of the month immediately preceding the date of publication of the research in the securities mentioned
in this report. To enhance transparency, MOSt has incorporated a Disclosure of Interest Statement in this document. This should, however, not be treated as endorsement of the views expressed in the report.
Motilal Oswal Securities Limited is registered as a Research Analyst under SEBI (Research Analyst) Regulations, 2014. SEBI Reg. No. INH000000412
Pending Regulatory inspections against Motilal Oswal Securities Limited:
SEBI pursuant to a complaint from client Shri C.R. Mohanraj alleging unauthorized trading, issued a letter dated 29th April 2014 to MOSL notifying appointment of an Adjudicating Officer as per SEBI regulations to hold inquiry
and adjudge violation of SEBI Regulations; MOSL replied to the Show Cause Notice whereby SEBI granted us an opportunity of Inspection of Documents. Since all the documents requested by us were not covered we have
requested to SEBI vide our letter dated June 23, 2015 to provide pending list of documents for inspection.
List of associate companies of Motilal Oswal Securities Limited -Click
here to access detailed report
Analyst Certification
The views expressed in this research report accurately reflect the personal views of the analyst(s) about the subject securities or issues, and no part of the compensation of the research analyst(s) was, is, or will be directly or
indirectly related to the specific recommendations and views expressed by research analyst(s) in this report. The research analysts, strategists, or research associates principally responsible for preparation of MOSt research
receive compensation based upon various factors, including quality of research, investor client feedback, stock picking, competitive factors and firm revenues
Aurobindo Pharma
Disclosure of Interest Statement
Analyst ownership of the stock
No
Served as an officer, director or employee -
No
A graph of daily closing prices of securities is available at www.nseindia.com and http://economictimes.indiatimes.com/markets/stocks/stock-quotes
Regional Disclosures (outside India)
This report is not directed or intended for distribution to or use by any person or entity resident in a state, country or any jurisdiction, where such distribution, publication, availability or use would be contrary to law,
regulation or which would subject MOSt & its group companies to registration or licensing requirements within such jurisdictions.
For Hong Kong:
This report is distributed in Hong Kong by Motilal Oswal capital Markets (Hong Kong) Private Limited, a licensed corporation (CE AYY-301) licensed and regulated by the Hong Kong Securities and Futures
Commission (SFC) pursuant to the Securities and Futures Ordinance (Chapter 571 of the Laws of Hong Kong) “SFO”. As per SEBI (Research Analyst Regulations) 2014 Motilal Oswal Securities (SEBI Reg No. INH000000412) has
an agreement with Motilal Oswal capital Markets (Hong Kong) Private Limited for distribution of research report in Kong Kong. This report is intended for distribution only to “Professional Investors” as defined in Part I of
Schedule 1 to SFO. Any investment or investment activity to which this document relates is only available to professional investor and will be engaged only with professional investors.” Nothing here is an offer or solicitation
of these securities, products and services in any jurisdiction where their offer or sale is not qualified or exempt from registration. The Indian Analyst(s) who compile this report is/are not located in Hong Kong & are not
conducting Research Analysis in Hong Kong.
For U.S.
Motilal Oswal Securities Limited (MOSL) is not a registered broker - dealer under the U.S. Securities Exchange Act of 1934, as amended (the"1934 act") and under applicable state laws in the United States. In addition MOSL is
not a registered investment adviser under the U.S. Investment Advisers Act of 1940, as amended (the "Advisers Act" and together with the 1934 Act, the "Acts), and under applicable state laws in the United States.
Accordingly, in the absence of specific exemption under the Acts, any brokerage and investment services provided by MOSL, including the products and services described herein are not available to or intended for U.S.
persons.
This report is intended for distribution only to "Major Institutional Investors" as defined by Rule 15a-6(b)(4) of the Exchange Act and interpretations thereof by SEC (henceforth referred to as "major institutional investors").
This document must not be acted on or relied on by persons who are not major institutional investors. Any investment or investment activity to which this document relates is only available to major institutional investors
and will be engaged in only with major institutional investors. In reliance on the exemption from registration provided by Rule 15a-6 of the U.S. Securities Exchange Act of 1934, as amended (the "Exchange Act") and
interpretations thereof by the U.S. Securities and Exchange Commission ("SEC") in order to conduct business with Institutional Investors based in the U.S., MOSL has entered into a chaperoning agreement with a U.S.
registered broker-dealer, Motilal Oswal Securities International Private Limited. ("MOSIPL"). Any business interaction pursuant to this report will have to be executed within the provisions of this chaperoning agreement.
The Research Analysts contributing to the report may not be registered /qualified as research analyst with FINRA. Such research analyst may not be associated persons of the U.S. registered broker-dealer, MOSIPL, and
therefore, may not be subject to NASD rule 2711 and NYSE Rule 472 restrictions on communication with a subject company, public appearances and trading securities held by a research analyst account.
For Singapore
Motilal Oswal Capital Markets Singapore Pte Limited is acting as an exempt financial advisor under section 23(1)(f) of the Financial Advisers Act(FAA) read with regulation 17(1)(d) of the Financial Advisors Regulations and is a
subsidiary of Motilal Oswal Securities Limited in India. This research is distributed in Singapore by Motilal Oswal Capital Markets Singapore Pte Limited and it is only directed in Singapore to accredited investors, as defined in
the Financial Advisers Regulations and the Securities and Futures Act (Chapter 289), as amended from time to time.
In respect of any matter arising from or in connection with the research you could contact the following representatives of Motilal Oswal Capital Markets Singapore Pte Limited:
Varun Kumar
Varun.kumar@motilaloswal.com
Contact : (+65) 68189232
Office Address:21 (Suite 31),16 Collyer Quay,Singapore 04931
AUROBINDO PHARMA
4 May 2017
Motilal Oswal Tower, Level 9, Sayani Road, Prabhadevi, Mumbai 400 025
Phone: +91 22 3982 5500 E-mail: reports@motilaloswal.com
Motilal Oswal Securities Ltd
12