8 May 2017
Corporate performance
4QFY17: Expectations v/s delivery
Today’s top research idea
Eicher Motors: In-line; RE margin stable, VECV big positive surprise
v
RE's EBITDA margin expanded ~180bp YoY to 31.4% (est. of ~32%), led by
higher other expenses. Further, lower other income restricted adj. PAT growth
to 8.5% YoY (to INR4.1b v/s est. of ~INR5.5b).
v
EBITDA margin expanded 370bp YoY (+130bp QoQ) to 8.2% (est. of 6.4%) led
by positive operating leverage. Adj. PAT was ~INR1.16b (est. of ~INR674m).
v
Waiting period for Classic 350 stable at ~2 months, with order booking in Top-
20 cities growing at over 15%. RE's producible capacity at ~825k for FY18 and
~960k for FY19. Declared a dividend of ~INR100/share for FY17 (flat YoY).
v
We have upgraded consol. EPS for FY18E/19E by 4%/8% to factor in better-
than-estimated VECV performance. Maintain
Buy
with a TP of INR30,402.
(no of
companies)
Sales
EBIDTA
PAT
Growth (YoY, %)
MOSL
Nifty
Sensex
(55)
(17)
(9)
14.7
16.8
17.5
7.5
10.1
4.4
9.7
2.1
7.7
Research covered
Cos/Sector
Financials
Cement
Cyient
Eicher Motors
Dr Reddy's
P&G Hygiene
Sanofi India
Equitas Holdings
Tata Comm
L&T Infotech
Orient Cement
NIIT Tech.
Results Expectation
Key Highlights
Making RBI captain of the ship
ACC-Ambuja: Board exploring merger opportunities
Good traction across core, adjacencies and DLM
In-line; RE margin stable, VECV performance a big positive surprise
Bachupalli 483 observations-no data integrity issue, but approvals
may get delayed
Payout of INR12b cash a huge boost to return ratios
Weak results; margin improvement is key
Risk aversion mars growth; bank transition dragged profits lower
Expect steady EBITDA growth, RoIC improvement
Stable revenue growth and positive outlook
Profitability uptick led by cost efficiencies
Above-estimate excluding one-offs
ABB | Bharti Infratel | Union Bank
Market snapshot
Equities - India
Close
Chg .%
Sensex
29,859
-0.9
Nifty-50
9,285
-0.8
Nifty-M 100
18,049
-1.0
Equities-Global
Close
Chg .%
S&P 500
2,399
0.4
Nasdaq
6,101
0.4
FTSE 100
7,297
0.7
DAX
12,717
0.5
Hang Seng
9,926
-1.6
Nikkei 225
19,446
-0.7
Commodities
Close
Chg .%
Brent (US$/Bbl)
49
2.4
Gold ($/OZ)
1,222
-0.5
Cu (US$/MT)
5,563
0.8
Almn (US$/MT)
1,896
-0.6
Currency
Close
Chg .%
USD/INR
64.4
0.3
USD/EUR
1.1
0.1
USD/JPY
112.7
0.6
YIELD (%)
Close
1MChg
10 Yrs G-Sec
6.9
0.0
10 Yrs AAA Corp
8.2
0.0
Flows (USD b)
5-May
MTD
FIIs
-0.1
-0.1
DIIs
0.0
0.3
Volumes (INRb)
5-May
MTD*
Cash
335
313
F&O
4,013
4,722
Note: YTD is calendar year, *Avg
YTD.%
12.1
13.4
25.8
YTD.%
7.2
13.3
2.2
10.8
5.7
1.7
YTD.%
-11.8
6.0
0.7
11.3
YTD.%
-5.2
4.6
-3.6
YTDchg
0.4
0.6
YTD
6.1
1.9
YTD*
284
4,640
Piping hot news
Royal Enfield revving up to buy Ducati?
v
Royal Enfield is understood to have been approached to acquire Italian superbike
maker Ducati, owned by Germany's embattled Volkswagen group.
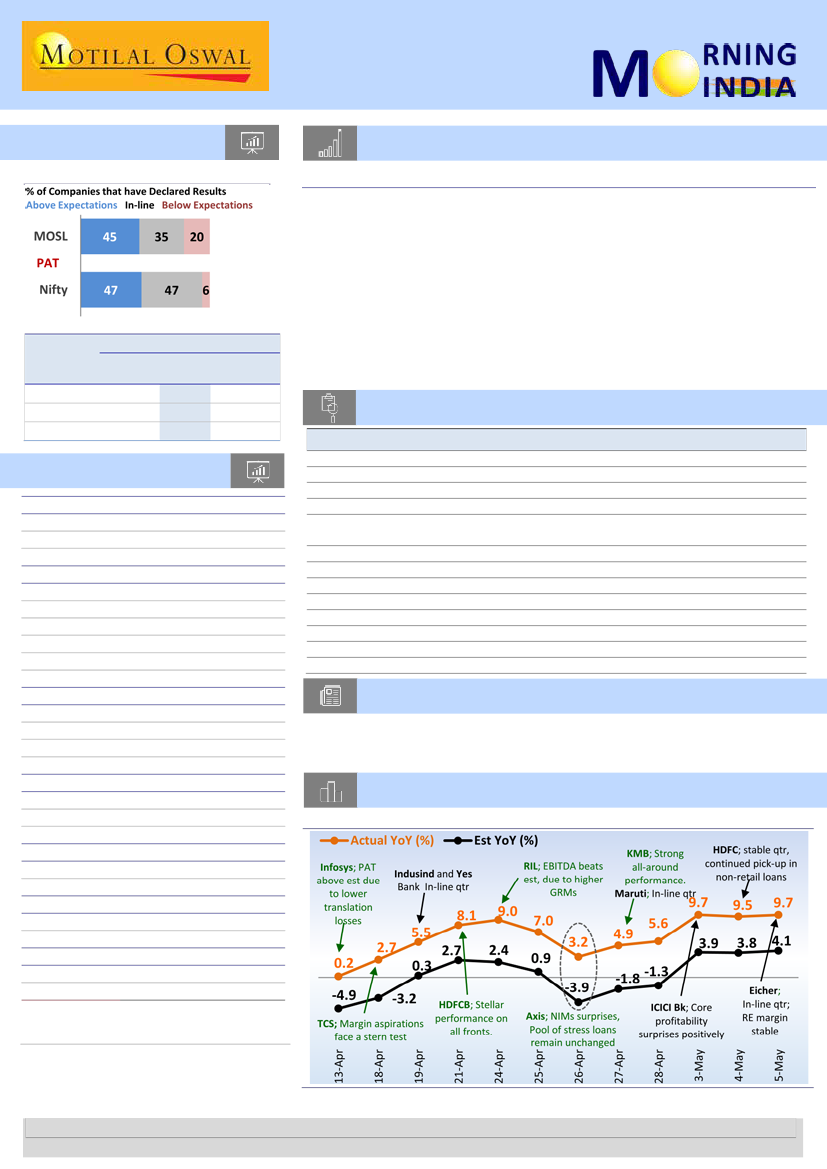
Chart of the Day: Nifty-50: Performance-expectation gap
4QFY17 PAT growth for 17 companies that have declared results
Quote of the day
Keep your eye on the goal, keep moving
toward your target
Research Team (Gautam.Duggad@MotilalOswal.com)
Source: Company, MOSL
Motilal Oswal research is available on www.motilaloswal.com/Institutional-Equities, Bloomberg, Thomson Reuters, Factset and S&P Capital.
Investors are advised to refer through important disclosures made at the last page of the Research Report.

In the news today
Kindly click on numbers for the detailed news link
1
Emmanuel Macron was elected
French president on Sunday with
a business-friendly vision of
European integration, defeating
Marine Le Pen, a far-right
nationalist who threatened to
take France out of the European
Union…
2
By December last year, state-run power distribution companies (discoms)
saved close to Rs 12,000 crore in interest costs, thanks to the Ujwal
Discom Assurance Yojana (UDAY), but they have had a less than creditable
record so far in meeting the crucial efficiency parameters set under the
scheme…
Emmanuel Macron wins
French presidency, to sighs of
relief in Europe
Discoms’ UDAY results: Rs 12,000 cr saved, but fail to meet
operational goals
3
FM Arun Jaitley hints at larger
bank reforms plan even as
NPA crisis resolution starts
The powers given to the Reserve
Bank of India via the amendments
to the Banking Regulation Act,
1949, to help it deal more
effectively with stressed assets,
may not appear as overarching as
some might have expected…
4
Part of LafargeHolcim, ACC,
Ambuja Cements mull merger
ACC and Ambuja Cements are
exploring the possibilities of a
merger and the boards of the two
companies on Friday decided to
constitute a special committee of
directors with a majority of
independent directors to consider
the matter further…
5
PMO, Jaitley push clears path
for big private role in defence
production
A tussle within the bureaucracy
over what rules the SP model
would follow had resulted in a
stalemate within the ministry
since February 2016, frustrating
leading private sector companies
that were…
6
Projects worth about Rs.
90,000 crore being executed in
northeast India: Suresh
Prabhu
7
Companies to face Minimum
alternate tax on dividend
payout, debt recast
Minimum alternate tax, or MAT, a
levy on book profit of companies
that avail of exemptions and
concessions, is now back to haunt
companies – both Indian and
multinationals operating in the
country.…
Union Railway Minister Suresh
Prabhu, on Sunday, kick-started
surveys of seven new broad-
gauge railway lines in Arunachal
Pradesh. The minister said that
currently projects worth about Rs.
90,000 crore are being executed
in the northeast…
8 May 2017
2

Sector Update | 6 May 2017
Financials
Making RBI captain of the ship
NPA resolution – Is it enough?
§
GoI passed an ordinance to empower the RBI to more effectively deal with bad loans.
Under the new policy, RBI is permitted to a) issue directions to banks to initiate
insolvency resolution process for NPAs, b) issue directions for resolution of stressed
assets, and c) appoint authorities to resolve NPAs.
RBI has issued directions regarding resolution of assets under Corrective Action Plan
(CAP) in Joint Lenders Forum. Modification in the guideline is focused on reducing the
timeline for resolution (no need to re-refer to Board and reduction in majority to
60%/50% by value/number of lenders from 75%/60% earlier) under CAP.
Giving more power to RBI is a welcome step considering PSU bankers were not willing
to take bold decisions (for resolutions and haircut) due to fear of regulatory agencies.
This along with other mechanisms like SDR, S4A, 5:25 and Insolvency and Bankruptcy
code should expedite resolution process.
We are seeing moderation in the new stress loan creation for PSU banks. Giving more
power to RBI may expedite the resolution process. In our view initial lag of the
resolution cycle would be led by Steel (20%+ of industry NPA) and roads/construction
segment (10%+ of industry NPA). PSB valuations are already reflecting the
capitalization, growth and core profitability issues. Big ticket resolutions could lead to
re-rating. Our top picks amongst corporate lenders are ICICIBC, SBIN, PNB and BOB.
§
§
§
Empowering the RBI to
expedite resolution process
in key accounts seen as a
big positive
More power to RBI for NPA resolution
Assigning the RBI more power to issue directions for resolutions, while positive, is
unlikely to result in quick resolution. Modifications in existing RBI guidelines would
likely happen (like CAP and JLF related issued on Friday) very soon. However,
considering the complexity (especially determining the haircuts) of the issues, there
could delays in setting up oversee committees, i.e. forming a committee with the
RBI nominated members would speed up the resolution process in our view. All the
concerned parties will have to expedite the resolution process; else, ageing related
provisioning would mar earnings for corporate lenders in 2HFY18 (RBI AQR led to
higher recognition in 2HFY16).
Modification in CAP
guidelines shows intent to
improve the pace of
resolutions
Modification in CAP guideline – Intent on speedy resolutions (Link)
RBI has issued the first modification in the guidelines related to CAP in JLF. JLF
members were required to come out with the decision within 60days of the
reference for CAP however, due to issues (lack of majority, non-seriousness from
bankers due to fear of investigation agencies, board involvement in final decision
making, etc.) it was not successful. The modified guidelines provide for the
following changes: a) reduction in majority lenders requirement for taking decisions
to a minimum of 60% of creditors by value (earlier 75%) and 50% of creditors by
number (earlier 60%) b) Boards shall empower their executives to implement the JLF
decision without requiring further approval, and c) clarification, that all tools
provided by the RBI (SDR, S4A, etc.), would be covered under the guideline.
8 May 2017
3

Power and steel constitute
the largest share of stress
pool in the system
Few sectors constitute bulk of problems
Corporate lenders have witnessed significant stress additions over the last 4 years -
total system GNPLs standing at ~INR7t+ (~10%+ of bank credit). Industrial sector
stressed advances ratio stood at ~22% with bulk of the corporate stress contributed
by ~40-50 large accounts in metal, power, infrastructure (excluding power),
construction and textiles. These sectors together constitute ~50% of the total
system stressed advances (while commanding 23% of the total system credit).
Overleveraging, and insufficient capacity to pay (ICR <1) has led to the build-up of
stress in these large accounts. Infra and metals constitute stressed advances as high
as 18.6% and 42.9% respectively. The steel sector has been dampened by global
commodity prices and constitutes majority of stressed advances within metals.
Likewise, power sector projects have been stalled because of fuel shortages and lack
of power purchase agreements (PPAs).
Incremental stress additions
moderating; positive
developments in stress
sectors encouraging
Incremental stress creation is moderating; awaiting further resolutions
Bulk of stress has been recognized already during AQR and the post AQR period. We
see a moderating trend in slippages in the past few quarters, whereby GNPLs have
reached peak levels. Moreover, recoveries in small value accounts have accelerated.
There have been sector specific positive developments. For instance, the National
Steel Policy that envisages INR10t investments to create higher capacity in the
sector, and recent policy announcements that mandate use of domestic steel for
public sector infrastructure projects, are seen as significant developments. Reforms
in road sector, deleveraging (in some cases pushed by lenders) by corporate India,
and increased asset sales (INR2.44t sold in FY17) are key positive macro triggers.
Valuations of PSBs
attractive, recoveries in key
accounts could lead to
significant upgrades
Pick up in resolution – a key to valuations
Most negatives are priced in terms of low credit growth, margin pressure, lower
trading gains and issues on capitalization. Any positive news on resolutions would
help to bridge gap between BV and ABV. PSBs are available at 0.9x P/B (driven by
SBIN and BOB with most of the banks still available at even lower valuations of
0.5/0.6x P/B valuations). This means that they are trading at ~25% discount to their
mean valuations and almost 55-60% discount from their peak. This is of particular
significance given that all the levers are supportive of positive correction – credit
growth pick up, moderating slippages, recovery in large accounts. Our top picks
among the corporate lenders are
ICICIBC, SBIN, PNB and BOB.
Exhibit 1. NSL lowest for SBIN, AXSB, ICICIBC and YES amongst corporate lenders (%)
NNPA
7.0
0.2
4.7
9.7
OBC
4.9
2.0
4.5
9.1
PNB
OSRL (Ex SEB and AI)
Other stress loans (net of overlap)
Watchlist
5.4
3.9
3.6
6.7
CBK
5.8
3.3
2.1
6.9
UNBK
3.3
2.2
3.6
7.1
BOI
2.3
4.1
2.9
5.4
BOB
3.0
1.7
4.9
4.9
INBK
4.10
1.30
0.92
5.48
ICICIBC
1.2
1.1
2.4
4.2
SBIN
3.0
0.9
1.5
2.3
AXSB
1.1
0.4
0.8
YES
Source: MOSL, Company
8 May 2017
4

Exhibit 2. System stressed advances by sector - September 2016 (as a % of sector loans)
42.9
27.9
23.7
20
18.7
18.6
17.8
17.6
16
15.9
15
12.5
11.7
Source: MOSL, RBI - FSR
Exhibit 3.
System stressed advance by bank group -September 2016 (as a % of loans)
GNPA
OSRL
NNPA
7.4
4.0
11.8
1.6
1.4
3.2
PVBs
5.5
3.2
9.1
Banking System
Source: MOSL, RBI - FSR
PSBs
Exhibit 4. Iron and Steel exposure as a % of gross credit exposure
6.9%
6.7%
5.5%
4.8%
4.3%
3.9%
3.1%
2.9%
2.2%
1.8%
1.5%
Source: MOSL, Company
8 May 2017
5

Exhibit 5. Textile exposure as a % of gross credit exposure
4.8%
3.5%
3.1%
2.6%
2.6%
2.3%
2.2%
1.8%
1.2%
0.9%
0.5%
Source: MOSL, Company
Exhibit 6. Infrastructure exposure as a % of gross credit exposure
17.7%
17.1%
15.6%
13.1%
12.4%
12.0%
11.6%
10.8%
9.6%
8.7%
8.6%
Source: MOSL, Company
Exhibit 7. Power exposure as a % of gross credit exposure
10.9%
8.7%
7.6%
4.8%
4.7%
3.9%
CNBK
SBIN
BOI
INBK
ICICIBC
AXSB
Source: MOSL, Company
8 May 2017
6

Sector Update | 8 May 2017
Cement
ACC-Ambuja: Board exploring merger opportunities
Event: Board of Ambuja and ACC have announced that they are exploring possibility of
merger of ACC-Ambuja. Please find below our analysis on possible synergy benefits,
earnings impact, valuation of merged entity and certain key issues with the execution of
merger. Key conclusion based on our analysis
§
§
§
§
We have done our earnings analysis based on INR4bn of synergy benefits due to ACC-
Ambuja merger as against expected INR9.2bn of synergy benefits announced in 2013.
We believe the cost savings would be primarily towards employee cost reduction and
logistics cost optimization.
The merged entity could see 10% upside in EBITDA and EPS (adjusted for dilution) due
to synergy benefits. The merged entity would be trading at 14x CY18 EV/EBITDA
including the synergy benefits of INR4bn.
We believe the key issues for consideration of merger would be transfer fees of
INR64/t towards mine transfer under the new MMDR act. The mine transfer fees
would partially offset the expected cost savings from merger of ACC - Ambuja Cement.
ACC- Ambuja merger detailed analysis:
Key assumption:
For our analysis we have assumed ACC gets merged into Ambuja at
current swap ratio of 6.71 (as per closing price on 5
th
May 2017)
ACC-Ambuja merger proposal: Potential synergy benefits of INR9.2bn as
stated in 2013.
n
n
ACC Ambuja in a recent announcement has stated that it has set up committee
to explore the benefits of merger of two companies and based on the
recommendation of the committee it would decide on future course of merger
process.
The idea of merger of ACC-Ambuja was first floated in 2013 where synergy
benefits of INR9.2b was expected to be realized due to logistics cost savings,
fixed cost reduction, procurement savings etc.
Stated merger benefits in 2013
Particular
Cement swaps +Logistics savings
Clinker swaps
Procurement savings
Fix cost reduction
Shared services
Total
(USD m)
56
9
47.5
27
0.5
140
(INR m)
3696
594
3135
1782
33
9240
Potential benefits from synergies in form of lower employee cost
n
The merged entity would have combined capacity of ~63mt which is quite
comparable to Ultratech’s pre JPA capacity of 66mt. The combined volume of
7
8 May 2017

merged entity in CY2016 would be 44.2mt as against Ultratech (ex-JPA) volumes
of ~49mt (including white cement volumes). So we in our analysis have tried to
use Ultratech’s employee cost as benchmark as their operations would be
considered efficient. This could give us clarity over the potential savings that
ACC-Ambuja as merged entity can realize by way of savings in form of lower
employee cost.
No of
employees
7833
5347
13180
14400
Employee
cost
7783
5930
13713
14134
n
Particulars
ACC
Ambuja
Merged entity
Ultratech
Volume
23.0
21.2
44.2
49.5
Employee/t
ratio
341
252
298
291
No of
plants
17
13
30
34
Employee/
plant
461
411
439
424
Employee
cost/t
339
280
310
285
n
As suggested in our working there is a potential employee cost reduction of
INR25/t for ACC-Ambuja merged entity which translates into cost savings of
INR1.1bn. This cost savings of INR1.1 bn corresponds against stated fixed cost
reduction of INR1.78 bn in 2013.
We believe additionally savings from logistic cost and procurement could
potentially result in total cost savings of INR4bn in total due to merger this time
around.
1. Valuations
n
n
n
As highlighted in above section we believe there could be possible cost savings
of INR4bn due to merger of operations.
Incorporating for the synergy benefit of INR4bn due to fixed cost reduction and
logistics cost the implied EV/EBITDA of Ambuja cement would be at 14x on CY18
EBITDA.
Please find below working of valuation of merged entity
INR m
1,655
246
6.7
188
1985
1263
632
2617
246.3
644578
45000
599578
37,781
4000
41,781
14
Share price as of 5th May 2017
ACC share price (INR/share)
Ambuja share price (INR/Share)
Implied swap ratio (x)
ACC present no of shares ( mn)
Ambuja no of shares (mn)
No of shares issued to ACC's shareholders due to merger (mn)
Share cancellation on consolidation for Ambuja's 50% stake in ACC (mn)
Ambuja new no of shares (mn)
Share price of Ambuja (INR/Share)
Market cap
Net cash of combined entity in CY18
EV of merged entity
Combined EBITDA of merged entity w/o synergy -CY18
Expected synergies from merger
Combined EBITDA post synergies
Implied EV/EBITDA on CY18 earnings post merger (x)
8 May 2017
8

2. Earnings Impact due to merger: Earnings upside of 9% post merger of
ACC with Ambuja Cement
n
n
n
We have also analyzed the impact of merger and dilution on Ambuja’s
consolidated earnings
Ambuja cement earnings post merger could see upside of 9% due to
incorporation of merger benefits of INR4bn.
Please find below working for earnings impact of merger on consolidated
earnings of Ambuja cement
INR m
14298
11946
5973
20271
1985
10.21
3000
29244
11.2
9.4%
Calculation on earnings impact of Ambuja Cement
Ambuja standalone CY18 PAT
ACC's CY18 PAT
ACC's proportionate PAT to Ambuja for 50% stake
Ambuja's consolidated PAT (adjusted for 50% stake in ACC)
Ambuja no of shares (mn)
Ambuja consolidated EPS pre merger-CY18
Post tax synergy benefits from merger
Ambuja consolidated PAT (post merger with ACC)-CY18
Ambuja's consolidated EPS (post merger)-CY18
% change in Ambuja's EPS
3. Key issues for consideration of merger benefits
We believe there could be two primary issues which could be considered by the
board for merger of ACC-Ambuja.
a) Transfer charges:
In a scenario of proposed merger of ACC-Ambuja, limestone mines of the entity
getting merged will be required to be transferred to the entity which will be in
existence. Under the new MMDR act this could attract a charge of INR64/t on
limestone extracted resulting into extra cost of INR1.3-1.4 bn which is significant
given that we expect synergy benefits to be in the range of INR4bn.
b) Stamp duty registration charges:
Additionally one time charges related to stamp duty registration would also be
considered for the transaction.
4. Capacity expansion at risk
n
There is a possibility that management focus may be towards realizing synergy
benefits from merger of ACC-Ambuja and execution of issues related to the
same over the next 2-3 years. This could result in delay in capacity expansion
plans which has been the case with the group for the last 3-4 years resulting in
market share loss for them.
Overall view
The proposed merger would be beneficiary for the ACC-Ambuja and could
potentially see earnings upgrade by ~10% for the combined entity depending on
Synergy benefits. However multiple re-rating of the stocks would be function of risk
associated with realization of synergy benefits and clarity over expansion plans of
the group over the next 2-3 years in order to maintain market share.
8 May 2017
9

ACC: Financials and valuations
Income Statement
Y/E December
Net Sales
Change (%)
Total Expenditure
EBITDA
Change (%)
Margin (%)
Depreciation
Int. and Fin. Charges
Other Income - Rec.
PBT Before EO Item
EO Income/(Expense)
PBT After EO Item
Tax
Tax Rate (%)
Reported PAT
Adjusted PAT
Change (%)
Margin (%)
Balance Sheet
Y/E December
Share Capital
Reserves
Net Worth
Loans
Deferred Tax Liability
Capital Employed
Gross Block
Less: Accum. Depn.
Net Fixed Assets
Capital WIP
Investments
Curr. Assets, Loans&Adv.
Inventory
Account Receivables
Cash and Bank Balance
Others
Curr. Liab. and Prov.
Account Payables
Other Liabilities
Provisions
Net Current Assets
Application of Funds
E: MOSL Estimates
CY13
109,084
-2.0
95,402
13,683
-30.5
12.5
-5,740
-517
4,573
12,000
2,437
14,437
3,479
24.1
10,958
9,108
-29.5
8.3
CY14
114,811
5.2
102,310
12,501
-8.6
10.9
-5,576
-828
4,561
10,658
3,786
14,444
2,761
19.1
11,683
8,621
-5.3
7.5
CY15
114,328
-0.4
102,597
11,731
-6.2
10.3
-6,521
-673
4,834
9,371
-1,532
7,840
1,924
24.5
5,916
7,071
-18.0
6.2
CY16
109,364
-4.3
97,413
11,951
1.9
10.9
-6,052
-729
3,346
8,517
-428
8,089
2,065
25.5
6,024
6,343
-10.3
5.8
CY17E
123,275
12.7
107,860
15,415
29.0
12.5
-6,608
-700
3,750
11,857
0
11,857
2,609
22.0
9,248
9,248
45.8
7.5
(INR Million)
CY17E
1,880
81,970
83,849
355
4,869
89,074
143,603
72,703
70,900
4,000
9,717
40,932
12,141
4,547
5,742
18,503
36,476
25,330
4,391
6,755
4,456
89,074
(INR Million)
CY18E
137,492
11.5
118,049
19,443
26.1
14.1
-7,025
-700
4,000
15,718
0
15,718
3,772
24.0
11,946
11,946
29.2
8.7
(INR Million)
CY18E
1,880
82,591
84,471
355
5,105
89,931
149,103
79,728
69,375
6,000
11,338
43,524
13,164
4,695
6,404
19,262
40,306
27,875
4,897
7,534
3,218
89,931
CY13
1,880
76,369
78,248
0
5,073
83,321
103,996
48,956
55,040
8,196
21,940
35,760
11,215
3,972
5,034
15,539
37,615
21,849
4,068
11,698
-1,855
83,321
CY14
1,880
80,477
82,356
0
5,356
87,712
109,507
53,523
55,984
19,146
15,730
35,853
12,556
4,107
3,043
16,147
39,002
24,469
4,000
10,532
-3,148
87,712
CY15
1,880
82,551
84,430
355
4,692
89,477
123,603
60,044
63,559
13,000
14,757
37,092
11,886
4,844
916
19,446
38,931
31,339
0
7,592
-1,839
89,477
CY16
1,880
82,913
84,792
355
4,692
89,839
140,603
66,096
74,508
3,000
9,382
38,006
11,070
4,334
5,094
17,508
35,056
23,970
3,895
7,191
2,950
89,839
8 May 2017
10

ACC: Financials and valuations
Ratios
Y/E December
Basic (INR)
EPS
Consolidated EPS
Cash EPS
BV/Share
DPS
Payout (%)
Valuation (x)
P/E
Cash P/E
EV/Sales
EV/EBITDA
P/BV
Dividend Yield
EV/ton (USD-Cap)
Return Ratios (%)
RoE
RoCE
RoIC
Working Capital Ratios
Debtor (Days)
Asset Turnover (x)
Leverage Ratio
Debt/Equity (x)
* EPS numbers are annualized.
Cash Flow Statement
Y/E December
OP/(Loss) before Tax
Interest/Dividends Recd.
Direct Taxes Paid
(Inc)/Dec in WC
CF from Operations
EO Income/(Expense)
CF from Op. incl EO Exp.
(inc)/dec in FA
Free Cash Flow
(Pur)/Sale of Investments
CF from Investments
Issue of Shares
(Inc)/Dec in Debt
Interest Paid
Dividend Paid
CF from Fin. Activity
Inc/Dec of Cash
Add: Beginning Balance
Closing Balance
E: MOSL Estimates
CY13
48.5
48.6
79.0
416.4
30.0
60.2
CY14
45.9
45.9
75.5
438.2
34.0
63.6
CY15
37.6
37.6
72.3
449.3
17.0
65.1
CY16
33.7
33.7
65.9
451.2
25.0
94.0
CY17E
49.2
49.2
84.4
446.2
45.0
110.2
CY18E
63.6
63.6
100.9
449.5
50.0
94.8
34.2
21.0
2.5
20.2
4.0
1.8
135
36.1
21.9
2.4
21.8
3.8
2.1
133
44.0
22.9
2.5
24.1
3.7
1.0
138
49.0
25.1
2.7
24.6
3.7
1.5
133
33.6
19.6
2.4
18.9
3.7
2.7
132
26.0
16.4
2.1
14.8
3.7
3.0
126
12.0
11.6
13.0
13
1
10.7
10.9
11.4
13
1
8.5
8.6
7.1
15
0.8
7.5
7.7
6.6
14
0.8
11.0
10.9
9.7
13
0.7
14.2
13.9
13.9
12
0.7
0.0
0.0
0.0
0.0
0.0
0.0
(INR Million)
CY18E
19,443
4,000
-3,537
1,900
21,806
0
21,806
-7,500
14,306
-1,620
-9,120
0
0
-700
-11,324
-12,024
662
5,742
6,404
CY13
13,683
4,573
-3,576
-7,335
7,345
2,437
9,782
-7,224
121
3,595
-3,628
60
-850
-517
-6,597
-7,904
-1,750
6,784
5,034
CY14
12,501
4,561
-2,478
-697
13,886
3,786
17,672
-17,470
-3,584
6,210
-11,260
-148
0
-828
-7,427
-8,403
-1,991
5,034
3,043
CY15
11,731
4,834
-2,588
-3,436
10,541
-1,532
9,010
-7,950
2,592
973
-6,977
9
355
-673
-3,850
-4,160
-2,127
3,043
916
CY16
11,951
3,346
-2,065
-611
12,621
-428
12,193
-7,000
5,621
5,375
-1,625
0
0
-729
-5,662
-6,391
4,178
916
5,094
CY17E
15,415
3,750
-2,431
-859
15,875
0
15,875
-4,000
11,875
-336
-4,336
0
0
-700
-10,192
-10,892
648
5,094
5,742
8 May 2017
11

Ambuja Cement: Financials and valuations
Income Statement
Y/E December
Net Sales
Change (%)
Total Expenditure
% of Sales
EBITDA
Change (%)
Margin (%)
Depreciation
EBIT
Interest
Other Income - Rec.
PBT before EO Exp.
EO Exp/(Inc)
PBT after EO Exp.
Current Tax
Deferred Tax
Tax Rate (%)
Reported PAT
PAT Adj for EO Items
Change (%)
Balance Sheet
Y/E December
Equity Share Capital
Total Reserves
Net Worth
Def. Liabilities
Total Loans
Capital Employed
Gross Block
Less: Accum. Depn.
Net Fixed Assets
Capital WIP
Investments
Curr. Assets
Inventory
Debtors
Cash & Bank Bal
Others
Curr. Liability & Prov.
Creditors
Provisions
Net Current Assets
Appl. of Funds
E: MOSL Estimates
2013
90,868
-6.1
75,386
83.0
15,482
-37.3
17.0
4,901
10,581
651
4,349
14,280
-3,269
17,549
4,603
0
26.2
12,946
10,464
-32.2
2013
3,092
91,764
94,855
5,643
292
100,790
108,262
47,637
60,625
6,949
17,885
44,187
9,339
2,315
23,411
9,122
28,856
17,845
11,011
15,332
100,790
2014
99,107
9.1
80,497
81.2
18,610
20.2
18.8
5,095
13,515
645
4,964
17,834
-1,757
19,591
4,627
0
23.6
14,964
13,207
26.2
2014
3,100
97,934
101,033
5,890
191
107,115
118,711
52,732
64,173
5,000
21,727
48,108
8,884
2,280
24,581
12,364
31,894
19,806
12,088
16,215
107,115
2015
93,683
-5.5
79,321
84.7
14,362
-22.8
15.3
6,257
8,105
918
4,535
11,722
557
11,165
3,090
0
27.7
8,076
8,478
-35.8
2015
3,104
99,965
103,069
5,649
227
108,945
118,050
58,989
59,062
6,000
22,261
54,297
8,955
2,864
28,484
13,995
32,675
21,477
11,197
21,622
108,945
2016E
91,604
-2.2
75,849
82.8
15,755
9.7
17.2
8,501
7,254
715
6,837
13,376
0
13,376
3,672
0
27.5
9,703
9,703
14.4
2016E
3,971
188,704
192,675
5,649
500
198,824
121,550
67,490
54,060
7,500
120,106
47,154
8,784
2,133
25,696
10,541
29,996
18,702
11,294
17,158
198,824
2017E
100,364
9.6
84,008
83.7
16,356
3.8
16.3
5,894
10,462
800
7,000
16,662
0
16,662
3,499
0
21.0
13,163
13,163
35.7
2017E
3,971
194,897
198,867
5,649
500
205,016
124,050
73,384
50,666
10,000
120,106
57,332
8,249
2,337
34,922
11,824
33,088
20,714
12,374
24,244
205,016
(INR Million)
2018E
112,273
11.9
93,934
83.7
18,338
12.1
16.3
6,224
12,114
850
7,800
19,064
0
19,064
4,385
381
25.0
14,298
14,298
8.6
(INR Million)
2018E
3,971
198,961
202,931
6,030
500
209,462
135,300
79,609
55,691
10,000
120,106
60,668
9,228
2,615
35,599
13,227
37,004
23,162
13,842
23,664
209,462
8 May 2017
12

Ambuja Cement: Financials and valuations
Ratios
Y/E December
Basic (INR)
EPS
Cash EPS
BV/Share
DPS
Payout (%)
Valuation (x)
P/E
Cash P/E
P/BV
EV/Sales
EV/EBITDA
EV/Ton (Cap) - US$
Dividend Yield (%)
Return Ratios (%)
RoE
RoCE
RoIC
Working Capital Ratios
Asset Turnover (x)
Debtor (Days)
Inventory (Days)
Work Cap (Days)
Leverage Ratio (x)
Current Ratio
Debt/Equity
Cash Flow Statement
Y/E December
Op. Profit before Tax
Interest/Div. Recd.
Direct Taxes Paid
(Inc)/Dec in WC
CF from Operations
EO Income
CF from Op. incl EO Exp
(inc)/dec in FA
Free Cash Flow
(Pur)/Sale of Invest.
CF from Investments
Issue of Shares
(Inc)/Dec in Debt
Interest Paid
Dividend Paid
CF from Fin. Activity
Inc/Dec of Cash
Add: Beginning Bal.
Closing Balance
E: MOSL Estimates
2013
6.8
9.9
61.8
3.6
49.9
2014
8.5
11.8
65.6
5.0
61.8
2015
5.5
9.5
66.9
2.8
44.9
2016E
4.9
9.2
97.4
2.2
29.6
2017E
6.6
9.6
100.5
4.7
53.0
2018E
7.2
10.3
102.6
6.2
71.6
36.3
24.8
4.0
3.7
21.5
173
1.5
28.9
20.8
3.7
3.3
17.7
167
2.0
45.0
25.9
3.7
3.5
22.6
165
1.1
37.3
19.9
1.9
3.6
20.9
166
0.9
27.5
19.0
1.8
3.2
19.4
161
1.9
25.3
17.6
1.8
2.8
17.3
152
2.5
11.4
11.9
15.3
0.9
9
38
62
13.4
14.3
19.1
0.9
8
33
60
8.3
8.9
10.9
0.9
11.2
35
84.2
5.0
6.9
10.8
0.5
8.5
35
68.4
6.7
7.0
19.3
0.5
8.5
30
88.2
7.1
7.4
21.7
0.5
8.5
30
76.9
1.5
0.0
2013
15,482
4,349
-4,603
-913
14,316
3,269
17,585
-8,650
8,935
-1,326
-9,976
322
57
-651
-6,462
-6,735
874
22,537
23,411
1.5
0.0
2014
18,610
4,964
-4,627
287
19,234
1,757
20,991
-6,694
14,297
-3,843
-10,537
455
147
-645
-9,241
-9,284
1,170
23,411
24,581
1.7
0.0
2015
14,362
4,535
-3,090
-1,505
14,303
-557
13,746
-2,145
11,600
-534
-2,679
-2,412
-206
-918
-3,629
-7,164
3,903
24,581
28,484
1.6
0.0
2016E
15,755
6,837
-3,672
1,676
20,595
0
20,595
-5,000
15,595
-97,845
-102,845
82,779
273
-715
-2,877
79,461
-2,788
28,484
25,696
1.7
0.0
2017E
16,356
7,000
-3,499
2,140
21,997
0
21,997
-5,000
16,997
0
-5,000
0
0
-800
-6,970
-7,770
9,227
25,696
34,922
1.6
0.0
(INR Million)
2018E
18,338
7,800
-4,766
1,257
22,629
0
22,629
-11,250
11,379
0
-11,250
0
381
-850
-10,234
-10,702
677
34,922
35,599
8 May 2017
13

8 May 2017
Update
| Sector:
Technology
Cyient
Buy
BSE SENSEX
29,859
S&P CNX
9,285
CMP: INR513
TP: INR620 (+21%)
Good traction across core, adjacencies and DLM
Visible steps towards long-term aspirations
Stock Info
Bloomberg
Equity Shares (m)
52-Week Range (INR)
1, 6, 12 Rel. Per (%)
M.Cap. (INR b)
M.Cap. (USD b)
Avg Val, INRm
Free float (%)
CYL IN
113
564/416
10/1/-8
61.1
0.9
55.0
77.8
Financials Snapshot (INR b)
2017 2018E 2019E
Y/E Mar
36.1
40.2
46.2
Net Sales
4.9
5.5
6.5
EBITDA
3.7
4.2
4.9
PAT
30.6
37.8
44.1
EPS (INR)
-0.2
23.4
16.6
Gr. (%)
188.9 215.4 246.2
BV/Sh (INR)
16.2
17.6
17.9
RoE (%)
15.9
16.2
16.4
RoCE (%)
16.4
13.3
11.4
P/E (x)
2.7
2.3
2.0
P/BV (x)
Shareholding pattern (%)
Mar-17 Dec-16 Sep-16
As On
Promoter
22.18 22.18 22.19
Public
77.82 77.82 77.81
Others
-
-
-
Stock Performance (1-year)
Cyient
Sensex - Rebased
600
560
520
480
440
We attended the analyst meet hosted by Cyient (CYL). Our key takeaways:
n
Tier-I supplier aspirations…:
CYL has laid out a long term strategy to become a
Tier-I supplier to OEMs in its chosen focus verticals. S3 (Services, Systems,
Solutions) would enable it to participate in the Design, Build and Maintain
budgets of its customers. While executing this, it intends to invest in newer
technologies like IoT, analytics, Additive manufacturing and Mobility in order to
further boost growth.
n
…Well under execution:
While the strategy was laid out in 2015, the next two
years saw initial execution. One of the key pillars of implementation was the
change in the organization structure to the eight business units. This resulted in
higher accountability, better execution of strategy and the seepage of DLM
across the organization. A key execution proof-point was that in FY17 CYL
addressed opportunities worth USD1,065b, compared to USD733m in FY16..
n
M&A key to growth:
Over the last two years, several acquisitions have been
made that fill capability gaps and aid building of end-to-end solutions
(including Blom Aerofilms and Certon in FY17). The M&A pipeline continues to
be strong, with a focus on medical, wireless communication, IoT, M2M and
advanced avionics. CYL’s focus on inorganic activity is likely to continue, with it
being a key pillar for driving growth and strategy.
n
Laid out capital allocation strategy:
The company broadly laid out a capital
allocation strategy that would be followed over the next 5-6 years. With an
assumption of USD800m in cash, based on current balance, FCF generated and
leverage; it would return USD150m to shareholders (30% payout ratio), incur
capital expenditure of USD150m (2.5-3% of revenue) and use USD500m for
investments (USD300-350m organic and USD150-200m inorganic).
n
Potential for higher growth than current levels:
Given the strategy execution
and addressable market, CYL sees an opportunity for growth that is much
higher compared to current levels. The rough aspiration is for core services to
grow by 10pp. This would be topped-up by incremental revenue from Strategy
(10pp), New initiatives (5pp), DLM (5pp) and M&A (10pp). That said, near-term
visibility of achieving double-digit growth remains given the continued traction
in key clients, improved outlook for most industry verticals and fructification of
investments made over the last two years
n
Industry leading growth coupled with long-term opportunities:
While CYL has
been delivering industry-leading growth, it has also been positioning itself to
address long-term opportunities in Engineering and Defense. A material
improvement in client metrics and order book instill confidence in delivery.
Given these factors, the stock trading at 13.3/11.4x FY18/19E earnings makes it
attractive in the current scheme of things. Our price target of INR620 discounts
FY19E earnings by 14x.
Buy.
14
8 May 2017

5 May 2017
4QFY17 Results Update | Sector: Automobiles
Eicher Motors
Buy
BSE SENSEX
29,859
Bloomberg
Equity Shares (m)
M.Cap.(INRb)/(USDb)
52-Week Range (INR)
1, 6, 12 Rel. Per (%)
Avg Val, INRm
Free float (%)
S&P CNX
9,285
EIM IN
In-line; RE margin stable, VECV performance a big positive surprise
27
n
EIM reported in-line 4QFY17 results. Consol. PAT grew by ~34% YoY to
701.7 / 10.5
~INR4.59b (est. of ~INR4.63b) in 4Q and by 56% YoY to ~INR16.7b in FY17.
26700 / 18006
The company declared a dividend of ~INR100/share for FY17 (similar to
2/-2/13
1257
FY16, which, however, was a 15-month period).
49.4
n
Royal Enfield (RE) EBITDA margin at 31.8%:
Net realization increased 1.5%
CMP: INR25,837
TP: INR30,402(+18%)
Financials & Valuations (INR b)
Y/E Mar
2017
2018E
Net Sales
70.0
91.1
EBITDA
21.7
29.7
PAT
18.0
24.2
EPS (INR)
661.3
892.0
Gr. (%)
34.2
34.9
BV/Sh (INR)
1,816.5 2,532.0
RoE (%)
42.8
41.0
RoCE (%)
29.1
30.7
P/E (x)
39.1
29.0
P/BV (x)
14.2
10.2
2019E
109.0
36.4
30.8
1,135.1
27.3
3,463.8
37.9
30.1
22.8
7.5
n
n
Estimate change
TP change
Rating change
n
Quarterly Performance (Consolidated)
Y/E March
Net Operating income
Growth (%)
EBITDA
Recurring PAT
Growth (%)
Standalone (RE)
Royal Enfield (units)
Growth (%)
Net Realn (INR/unit)
Change - YoY (%)
EBITDA Margins (%)
Recurring PAT
Growth (%)
VECV
Total CV Volumes
Growth (%)
Net Realn (INR '000/unit)
Change - YoY (%)
EBITDA Margins (%)
Recurring PAT
Growth (%)
1Q
25,680
33.5
3,660
1,953
40.3
YoY (flat QoQ) to ~INR105.7k (est. of ~INR106.1k). EBITDA margin expanded
~180bp YoY (-40bp QoQ) to 31.4% (est. of ~32%), led by higher other
expenses. Further, lower other income restricted adj. PAT growth to 8.5%
YoY (to INR4.1b v/s est. of ~INR5.5b). FY17 PAT grew 49% YoY to INR15.6b.
VECV’s margin expands on positive operating leverage:
Realization
increased ~11% YoY to ~INR1.48m (est. of ~INR1.5m) due to price hikes and
an improved product mix. EBITDA margin expanded 370bp YoY (+130bp
QoQ) to 8.2% (est. of 6.4%) led by positive operating leverage. Adj. PAT was
~INR1.16b (est. of ~INR674m). FY17 PAT grew ~12% YoY to ~INR3.4b.
Earnings call highlights:
a) Waiting period stable at ~2 months for Classic
350. b) Order booking in Top-20 cities (~50% of volumes) growing at over
15%. c) Added ~150 dealerships in FY17 to ~675; would be adding ~150
dealers/year in next two years; d) Producible capacity at ~825k for FY18 and
~960k for FY19, can further expand at third plant; e) Price increase of ~3% in
RE in 4QFY17; f) MDEP volumes at 7,217 units (+21% YoY, +23% QoQ).
Valuation and view:
We upgrade consol. EPS for FY18E/19E by 4%/8% to
factor in better-than-estimated VECV performance. EIM trades at 29x/22.8x
FY18E/19E EPS. Maintain
Buy
with a TP of INR30,402 (FY19 SOTP-based).
FY16 (15m)
FY17
FY16
FY17 FY17E
2Q
3Q
4Q
5Q
1Q
2Q
3Q
4Q (15m)
4QE VAR (%)
10,959 12,997 12,843 15,322 15,557 17,549 18,348 18,881 61,735 70,334 18,992
-1
-51.2
-42.9
-44.0
-40.3
42.0
35.0
42.9
23.2
NA
42.4
24.0
2,857 3,507 3,577 4,468 4,700 5,422 5,770 5,848 16,891 21,740 6,312
-7
2,372 2,846 2,787 3,431 3,763 4,132 4,182 4,594 13,380 16,671 4,638
-0.9
50.7
72.4
81.3
75.7
58.6
45.2
50.0
33.9
74.0
55.7
28.9
92,021 106,613 127,611 125,744 148,186 147,483 166,941 173,838 178,228 600,175 666,490 178,228
44.4
43.8
55.7
52.9
61.0
38.3
30.8
38.2
20.3
58.7
38.8
20.3
104,450 102,791 101,852 102,139 104,140 105,603 105,576 105,477 105,731 103,073 105,598 106,100
4.7
2.1
1.7
1.4
-0.3
2.7
3.7
3.3
1.5
2.9
2.4
1.8
26.1
26.1
27.2
28.3
29.6
30.8
31.3
31.8
31.4
27.6
31.3
32.0
2,135 1,988 2,569 2,524 3,792 3,371 3,962 4,152 4,116 13,100 15,600 5,467
32.9
49.2
82.2 103.4
77.7
69.6
54.2
64.5
8.5 288.7
48.9
37.5
11,020 12,128 11,657 12,687 15,553 16,071 13,408 11,784 17,230 63,045 58,493 17,230
10.4
6.3
20.8
30.1
41.1
32.5
15.0
-7.1
10.8
23.7
16.0
10.8
1,458.1 1,472.0 1,529.1 1,569.3 1,333.5 1,331.3 1,470.5 1,599.6 1,482.3 1,526.5 1,461.5 1,497.8
13.0
12.0
1.5
4.4
-8.5
-9.6
-3.8
1.9
11.2
8.1
-4.3
4.9
7.1
8.2
8.0
8.5
4.5
9.1
7.2
6.9
8.2
7.9
7.9
6.4
436
768
677
890
60 1,082
698
570 1,160 3,817 3,428
674
20.0
69.5
50.3
56.4
-86.1
40.9
3.1
-36.0 1,820.6
-40.6
12.3
-18.7
0
-14
-70bp
-24.7
0.0
-1.0
180bp
72.0
8 May 2017
15

Dr Reddy’s
BSE SENSEX
29,859
S&P CNX
9,285
4 May 2017
Update
| Sector:
Healthcare
CMP: INR2,602
n
TP: INR2,625(+1%)
Neutral
Bachupalli 483 observations – no data integrity issue, but approvals may
get delayed
Stock Info
Bloomberg
Equity Shares (m)
52-Week Range (INR)
1, 6, 12 Rel. Per (%)
M.Cap. (INR b)
M.Cap. (USD b)
Avg Val, INRm
Free float (%)
DRRD IN
170.4
3689 / 2560
-5/-25/-29
443.4
6.8
1219
73.2
n
Financials Snapshot (INR b)
Y/E Mar
2017E 2018E 2019E
Net Sales
142.3 163.6 190.4
EBITDA
26.3
34.3
44.9
PAT
13.0
18.9
24.8
EPS (INR)
76.1 110.9 145.5
Gr. (%)
-42.5
45.7
31.2
BV/Sh (INR)
808
905 1,031
RoE (%)
9.8
12.9
15.0
RoCE (%)
7.2
10.1
12.6
P/E (x)
35.9
24.7
18.8
P/BV (x)
3.4
3.0
2.7
Shareholding pattern (%)
As On
Mar-17 Dec-16 Mar-16
Promoter
32.0
26.8
25.6
DII
12.6
8.2
6.0
FII
38.8
36.3
36.0
Others
16.6
28.8
32.4
FII Includes depository receipts
Stock Performance (1-year)
Dr Reddy's Labs
Sensex - Rebased
3,750
3,500
3,250
3,000
2,750
2,500
n
n
n
n
The USFDA inspected Dr. Reddy’s (DRRD) Bachupalli plant in April 2017, issuing
11 observations. The observation letter reveals no data integrity issues, with
most observations being related to lab control, QC, assurance of back-up data,
etc. Notably, there were two repeat observations.
Revamp in quality control & compliance system may delay approvals:
Bachupalli is the company’s largest formulations facility supplying to the US,
and accounts for 60-65% of US revenue. Although the warning letter does not
pose any major risk, we believe the changes required in the quality control &
compliance system can delay product approvals by six months from this
facility.
Srikakulam clearance provides visibility of Copaxone launch:
The company’s
Srikakulam facility was re-inspected in March 2017 and issued two 483
observations. As the observations were routine in nature, we believe the
facility should soon come back on track. Copaxone API has been filed from this
facility (formulations are filed from Gland Pharma), and resolution of the
warning letter will open doors for approval of this product. Copaxone 20mg
and 40mg sales in the US stand at ~USD3.5b (~84% coming from 40mg, rest
from 20mg). Six generic players (Synthon, DRRD, Mylan, Amneal,
Biocon/Apotex and Sandoz) have filed for this product, with Sandoz already
launching the 20mg generic. We believe DRRD could be the third/fourth player
to launch generic Copaxone 20mg/40mg by 2HFY18.
Will fate of one plant impact another?
Although the Miryalaguda and
Srikakulam inspections concluded with no material 483s, the issues raised at
Duvvada appear concerning, in our view. These facilities contribute ~10-12% of
total US sales (~USD250m), including ~2% from Miryalaguda and ~9-10% from
Srikakulam/Duvvada. Notably, these three plants received the warning letter
simultaneously, and the USFDA has suggested WL global corrective actions. It is
unclear as of now whether all three plants can come back on track together or
each plant will be looked at separately.
High third-party consultant cost not expected to be incurred again:
DRRD has
incurred ~USD40m as third-party consultant cost to take remediation action at
these three plants up till now. However, third-party consultant cost has come
down significantly as remediation is now over. It is necessary for DRRD to not
incur such high cost again to fix observations.
USFDA remediation is key; maintain Neutral:
Although long-term
fundamentals remain intact, the stock will remain range bound in the near
term due to regulatory concerns. We value the company at 18x FY19E PER, at a
10-15% discount to peers due to added regulatory uncertainty related to
Duvvada and Bachupalli. We maintain
Neutral
with a TP of INR2,625 @ 18x
FY19E PER (v/s TP of INR3050 earlier). The cut in target price is largely
attributed to lower target multiple.
16
8 May 2017

P&G Hygiene and
Healthcare
BSE SENSEX
29,859
Bloomberg
Equity Shares (m)
M.Cap.(INRb)/(USDb)
52-Week Range (INR)
1, 6, 12 Rel. Per (%)
Avg Val, INRm/ Vol m
Free float (%)
S&P CNX
9,285
PG IN
32.5
239.3/3.7
7611 / 6025
-1/-4/-3
49
29.4
5 May 2017
3QFY17 Results Update | Sector: Consumer
CMP: INR 7,373
n
TP: INR 8,760 (+19%)
Buy
Payout of INR12b cash a huge boost to return ratios
Net sales rose 5.5% YoY (est. of +9%) to INR5.73b.
Sales growth, albeit lower
than estimated, is still better than that reported by peers so far. Gross sales
were up by a healthy 7% YoY. The company has not shared segmental data;
however, in our view, close to double-digit sales in Feminine Hygiene was
offset by flat growth and higher excise in Healthcare, leading to moderate net
sales growth. EBITDA margin expanded 230bp YoY to 26.8% v/s estimate of
210bp contraction due to fear of a high base. EBITDA increased by 15.3% YoY
(est. of +0.1%) to INR1.54b and PAT by 2.6% YoY (est. of -2.4%) to INR996m.
EBITDA margin surprises positively:
Gross margin shrunk 60bp YoY to 58.6% in
the quarter. Staff costs rose 100bp YoY to 5.8% of sales, ad spend was down
20bp YoY to 9.4% of sales (far lower decline than that reported by all other
consumer peers so far), and other expenses declined 360bp YoY to 16.6% of
sales (a key factor driving margin expansion).
Dividend payout a huge positive:
The company declared a significant interim
dividend of INR362 per share (5% yield), utilizing entire cash balance built up
over two years via a sharp reduction in inter-group lending, good operating
performance and a low payout. We believe that this portends further decline in
inter-group lending as well as significantly elevated dividend payout.
Valuation and view:
PGHH’s has distinct advantages over FMCG peers: (1) It is
in a much faster-growing category and (2) It enjoys far superior barriers to
entry in its key Feminine Hygiene segment (69% of sales). While there will be
some weakness in earnings over next few years due to low other income, we
note that payout of cash potentially takes RoCE closer to 80% from ~30%,
adding to the attractiveness of the stock. We maintain
Buy
with a target price
of INR8,760 (50x March 2019E EPS, a 10% premium to three-year average due
to far superior return ratios compared to previous levels).
FY17
2Q
3Q
6,432
5,739
-2.4
5.5
4,146
4,201
2,286
1,538
5.7
15.3
35.5
26.8
132
142
43
13
208
232
2,320
1,614
2,320
1,614
814
618
35.1
38.3
1,506
996
1,506
996
2.8
2.6
23.4
17.4
FY16
4QE
5,739
7.6
4,108
1,632
2.8
28.4
156
-5
62
1,543
1,543
380
24.7
1,162
1,162
6.4
20.3
22,754
-2.5
16,701
6,053
26.6
517
60
876
6,353
6,353
2,129
33.5
4,223
4,223
22.0
18.6
FY17
23,915
5.1
16,948
6,967
29.1
556
55
726
7,082
7,082
2,372
33.5
4,709
4,709
11.5
19.7
(INR Million)
FY17
Var.
3QE
(%)
5,927
-3.2%
9.0
4,592
1,335
15.2%
0
22.5
142
4
236
1,425
1,425
13.3%
477
33.5
947
5.2%
947
5.2%
-2.4
16.0
Financials & Valuations (INR b)
FY16 FY17E FY18E
Y/E June
Net Sales
22.8
23.9
27.4
EBITDA
6.1
7.0
7.8
NP
4.2
4.7
5.1
EPS (INR)
129.9 144.9 155.8
EPS Gr. (%)
22.0
11.5
7.5
BV/Sh. (INR)
465.6 175.3 219.9
RoE (%)
30.8
45.3
78.9
RoCE (%)
31.3
46.0
80.5
P/E (x)
56.7
50.9
47.3
P/BV (x)
15.8
42.1
33.5
n
n
Estimate change
TP change
Rating change
n
Standalone - Quarterly Earning Model
Y/E June
Net Sales
YoY Cha nge (%)
Tota l Expendi ture
EBITDA
Growth
Ma rgi ns (%)
Depreci a ti on
Interes t
Other Income
PBT before EO expense
PBT
Ta x
Ra te (%)
Reported PAT
Adj PAT
YoY Cha nge (%)
Ma rgi ns (%)
E: MOSL Es ti ma tes
1Q
5,387
4,418
970
18.0
127
17
212
1,038
1,038
343
33.0
696
696
12.9
FY16
2Q
3Q
6,593
5,438
4,431
2,162
32.8
142
28
206
2,199
2,199
733
33.4
1,465
1,465
61.6
22.2
4,104
1,334
24.5
124
7
236
1,439
1,439
468
32.5
971
971
11.7
17.8
4Q
5,336
3,748
1,588
29.8
124
8
222
1,677
1,677
585
34.9
1,092
1,092
2.0
20.5
1Q
6,004
11.5
4,493
1,512
55.9
25.2
127
4
225
1,605
1,605
561
34.9
1,044
1,044
50.1
17.4
8 May 2017
17

5 May 2017
1QCY17 Results Update | Sector: Healthcare
Sanofi India
Buy
BSE SENSEX
29,859
Bloomberg
Equity Shares (m)
M.Cap.(INRb)/(USDb)
52-Week Range (INR)
1, 6, 12 Rel. Per (%)
Avg Val, INRm
Free float (%)
S&P CNX
9,285
SANL IN
Weak results; margin improvement is key
23
n
Sanofi India (SANL) reported weak 1QCY17 results. Revenue declined 9.1%
96.3 / 1.5
YoY to INR5.5b (~8% below est.). EBITDA fell ~21% YoY to INR1b (24% below
4930 / 4005
est.), with the margin contracting to 18.4% from 23.7% in 1QCY16. PAT of
-12/-12/-23
48
INR600m (-25.6% YoY) too missed our estimate by ~25% due to lower export
39.6
volumes and an adverse impact of INR appreciation v/s euro.
CMP: INR4,181
TP: INR4,850(+16%)
Financials & Valuations (INR b)
2016
2017E
Y/E Dec
Net Sales
23.7
26.3
EBITDA
5.3
5.5
PAT
3.0
3.0
EPS (INR)
129.1
131.0
Gr. (%)
24.9
1.5
BV/Sh (INR)
754.5
804.3
RoE (%)
17.1
16.3
RoCE (%)
16.5
16.0
P/E (x)
32.4
31.9
P/BV (x)
5.5
5.2
n
2018E
29.7
6.9
4.0
173.4
32.4
896.5
19.3
19.5
24.1
4.7
n
n
Estimate change
TP change
Rating change
n
High-growth brands/new launches to drive revenues:
Sales declined 9%
YoY in 1QCY17. According to AIOCD, secondary sales growth for SANL stood
at ~10% YoY. We expect the company’s revenue growth to sustain at 12%
over CY16-18, in line with industry growth, led by high growth in brands like
Lantus, Combiflam, Allegra
and
Amaryl M,
and new product launches.
Lower margin attributed to high other expenses:
EBITDA margin of ~18.4%
was lower than our estimate of 22%, mainly due to high other expenses
(+44% YoY). We expect EBITDA margin to normalize at 22-23% over CY16-
18E (22.3% in CY16).
Growth impacted by regulatory actions and demonetization:
According to
AIOCD, average industry growth was ~10.5% YoY in 1QCY17, and regulatory
actions (ex-demonetization) will have a negative one-time impact of ~2% on
SANL.
Margin improvement is key:
We model growth of 12% in sales, 14% in
EBITDA and 16% in earnings over CY16-18E. We maintain our
Buy
rating with
a TP of INR4,850 @ 28x CY18E (v/s INR5,000 @ 28x 1HCY18E). We cut
CY17E/CY18E EPS by 17/8.6% on the back of impact of price control and
demonetization.
CY16
2Q
6,080
10.6
1,458
24.0
300
7
164
1,315
0
1,315
462
35.1
853
853
32.9
14.0
CY17E
2Q
7,001
12.2
1,521
21.7
325
4
200
1,392
0
1,392
500
35.9
892
892
10.6
12.7
CY17E
3Q
7,027
18.7
1,544
22.0
325
4
200
1,415
0
1,415
520
36.7
895
895
77.3
12.7
4QE
6,762
14.2
1,439
21.3
569
3
46
912
0
912
286
31.3
626
626
24.1
9.3
26,320
11.1
5,519
21.0
1,472
15
605
4,636
0
4,636
1,623
35.0
3,014
3,014
1.5
11.4
CY18E
29,738
13.0
6,898
23.2
1,577
15
738
6,044
0
6,044
2,055
34.0
3,989
3,989
0.0
13.4
Quarterly Performance
Y/E December
Net Sales
YoY Change (%)
EBITDA
Margins (%)
Depreciation
Interest
Other Income
PBT before EO Items
Extra-Ord Expense
PBT after EO Items
Tax
Effective tax Rate (%)
Reported PAT
Adj PAT
YoY Change (%)
Margins (%)
E: MOSL Estimates
1Q
5,444
11.4
1,291
23.7
301
1
256
1,245
0
1,245
439
35.3
806
806
66.5
14.8
3Q
6,242
6.6
1,447
23.2
300
3
148
1,292
0
1,292
486
37.6
806
806
11.2
12.9
4Q
5,920
4.1
1,073
18.1
412
4
152
809
0
809
304
37.6
505
505
-28.3
8.5
1Q
5,529
-9.1
1,015
18.4
253
4
159
917
0
917
317
34.6
600
600
-25.6
10.9
8 May 2017
18

RESULTS
FLASH
Equitas Holdings
8 May 2017
Results Flash | Sector: Financials
BSE SENSEX
29,859
S&P CNX
9,285
CMP: INR160
Risk aversion mars growth; bank transition dragged profits lower
n
We will revisit our estimates
post earnings call/management
interaction.
Conference Call Details
Date:
8 May 2017
Time:
04:30pm IST
Dial-in details:
+91-22-3938 1003
th
Financials & Valuations (INR b)
Y/E March
2017 2018E
NII
8.6
11.1
OP
3.5
4.5
NP
1.6
2.1
EPS (INR)
4.7
6.3
EPS Gr. (%)
-23.8
33.8
BV/Sh. (INR)
66
72
RoE (%)
8.9
9.2
RoA (%)
2.0
1.9
P/E(X)
33.9
25.3
P/BV (X)
2.4
2.2
2019E
13.2
5.3
2.5
7.3
15.7
79
9.7
1.7
21.9
2.0
In a quarter marred by uncertainty over MFI portfolio, Equitas PAT declined
85% YoY/QoQ to INR69m (~82% miss). Flat AUM QoQ, interest reversal on MFI
loans (INR38m) decline in high yielding loans led to net interest income miss of
7% (down 4% QoQ but grew +30% YoY). NIMs contracted -70/-140bp QoQ/YoY
to 9.8% and high yielding MFI AUM (~50% of AUM as of 3Q) declined 7% QoQ.
n
Continued investments in branches (284 as of 4Q vs 112 in 3Q) led to Opex
growth of 85% YoY (+17% QoQ) to INR1.95b (in line). The bank also on boarded
600+ (+23% QoQ) branch banking employees in 4QFY17.
n
GNPA in MFI portfolio including RBI dispensation (INR620m) stands at INR100m
however bank has proactively classified INR580m worth of accounts as NPA;
Taking NPA in MFI portfolio at INR680m (2% of MFI AUM). Total at PAR stress
on the AUM stands at INR1.9b (INR1.45b on books) and the bank is confident
of recovering 50% leading to total loss of ~INR1b. The bank already has
INR540m of provisions (INR350m specific+INR190m floating) on this portfolio.
n
Overall GNPA stood at 3.5% however, excluding
the
proactive impaired account
recognition it stood at 2.5%. MFI PAR at >90 DPD was at 2.7% v/s 8%for the
industry. Collection efficiency deteriorated to 95.4% v/s 98.4% in 3Q, owing to
drop in collection efficiency in MH (77% v/s 93% in 3Q).
n
FY17 highlights:
a)
AUM growth was moderate at 17% YoY, as the bank chose
to be cautious in MF lending (Flat YoY). UCV/Micro LAP grew 28% and 50% YoY
respectively,
b)
Garnered deposits of INR18.9b; CASA deposits were INR3.3b.
Valuation and view:
Equitas targets to reduce share of MFI in overall loans to ~30%
by FY18. This would be partially offset by high growth in secured products like
micro LAP and VF and newly launched products like housing, business, gold and
agri loans. We expect near-term recalibration of the growth strategy to yield
positive results over medium-to-long term. Fast paced liability branch set up, a
strong BC reach and a large captive MFI customer base will enable EQUITAS to
recalibrate the liability side, lowering CoF, increasing cross-sell and fee income. We
would be revisiting our estimates and TP both the earnings call on 8th May.
FY16
2Q
3Q
1,489
1,560
114
1,602
854
749
138
611
218
393
7.1
53.3
18.4
35.7
208
1,768
948
820
143
677
243
434
11.8
53.6
17.4
35.9
4Q
1,704
221
1,925
1,050
875
146
729
261
468
11.5
54.5
16.7
35.8
1Q
2,043
62.7
230
2,273
1,134
1,139
52.3
176
963
352
612
62.6
10.1
49.9
15.4
36.5
FY17
2Q
2,006
34.8
287
2,293
1,408
885
18.2
149
736
273
463
17.8
12.5
61.4
16.8
37.1
FY16
3Q
2,291
46.8
418
2,709
1,663
1,046
27.5
340
706
256
449
3.5
15.4
61.4
32.5
36.3
4Q
2,214
29.9
205
2,419
1,945
474
-45.8
365
109
40
69
-85.3
8.5
80.4
77.0
37.0
6,008
780
6,788
3,597
3,192
591
2,600
930
1,671
11.5
53.0
18.5
35.8
FY17
8,554
42.4
1,140
9,694
6,150
3,544
11.0
1,029
2,515
922
1,593
-4.7
11.8
63.4
29.0
36.7
Quarterly Performance (INR m)
Net Interest Income
% Change (Y-o-Y)
Other Income
Net Income
Operating Expenses
Operating Profit
% Change (Y-o-Y)
Other Provisions
Profit before Tax
Tax Provisions
Net Profit
% Change (Y-o-Y)
Other Income/Net Income (%)
Cost/Income Ratio (%)
Provisions/PPoP (%)
Tax Rate (%)
E: MOSL Estimates
1Q
1,256
237
1,493
745
748
165
583
207
376
15.9
49.9
22.0
35.5
8 May 2017
19

Tata Communications
BSE SENSEX
30,126
Bloomberg
Equity Shares (m)
M.Cap.(INRb)/(USDb)
52-Week Range (INR)
1, 6, 12 Rel. Per (%)
Avg Val, INRm
Free float (%)
S&P CNX
9,360
TCOM IN
Expect steady EBITDA growth, RoIC improvement
285
Normalized data EBITDA up 5% QoQ
200.0 / 3.0
784/418
Ex data center and one-offs, core EBITDA up 9% QoQ
-4/3/46
n
During the quarter, four factors impacted the data segment: (1) sale of data
530
center business, (2) one-off expenditure of INR1b, (3) unfavorable ruling of
25.0
the High Court on TRAI’s AFC (access facilitation charges) regulations, and (4)
5 May 2017
4QFY17 Results Update | Sector: Telecom
CMP: INR705
TP: INR811 (+15%)
Buy
Financials & Valuations (INR b)
2017 2018E
Y/E Mar
Sales
176.2 180.9
EBITDA
24.1
29.3
NP
7.4
5.6
EPS (Rs)
26.0
19.5
EPS Gr. (%)
1,573.9
-24.8
BV/Sh (INR)
55.9
75.4
RoE (%)
126.2
29.8
RoCE (%)
9.7
6.3
P/E (x)
27.0
35.9
P/BV (x)
12.6
9.3
2019E
194.8
37.3
11.2
39.4
101.3
114.8
41.4
10.6
17.8
6.1
n
n
Leaner balance sheet; 24% data EBITDA CAGR over FY17-19E
impact of demonetization on the ATM business.
Normalized core revenue declined 2% QoQ to INR43.2b (our estimate was
INR44.5b) due to sluggish voice revenue. Normalized data revenue grew
2.3% to INR28.2b (in-line), led by 6% and 12% jump in transformation and
growth segment.
Normalized core EBITDA grew 9% QoQ to INR7b (our estimate was
INR6.25b). Voice EBITDA grew 30% QoQ to INR1.1b. Normalized data EBITDA
grew 4.7% to INR5.85b. Data EBITDA margin jumped 50bp QoQ to 20.8%.
The sale of capital intensive data center and Neotel has reduced debt by 28% in
FY17 to INR77b, and FY18E capex by ~40% from FY16 levels driving FCF. We
expect data EBITDA to grow at 24% CAGR over FY17-19E, led by a.) 13% EBITDA
CAGR in traditional biz, as it recovers from the one-off charges, b.) 50%+ EBITDA
CAGR in the Transformation segment with healthy pipeline, c.) Growth segment
to garner INR1.45b EBITDA in FY19 from an EBITDA loss of INR1.7b in FY17.
Maintain Buy with target price of INR811
We have marginally reduced our data EBITDA estimates for FY18/19 by 2.5-3%,
which constitutes ~85% of the core EBITDA. We maintain our target price of
INR811 (excluding land bank). Given the healthy EBITDA growth potential and
FCF generation driving RoIC of 14% by FY19E, the stock appears attractive at an
EV of 6x FY19E EBITDA (including land bank value) – conventional telcos with
single-digit RoCE are trading at 6-7x EV/EBITDA.
Cons. Quarterly Earning Model
Y/E March
Net Sales
YoY Change (%)
Total Expenditure
EBITDA
Margins (%)
Depreciation
Interest
Other Income
PBT before EO expense
Extra-Ord expense
PBT
Tax
Rate (%)
MI& Profit/Loss of Asso. Cos.
Reported PAT
Adj PAT
YoY Change (%)
Margins (%)
1Q
51,796
1.3
44,505
7,291
14.1
4,888
1,966
930
1,367
0
1,367
931
68.1
3
433
433
-302.5
0.8
FY16
2Q
3Q
51,301 50,995
1.2
3.8
43,580 43,397
7,720
7,598
15.0
14.9
5,694
5,908
1,756
1,730
791
108
1,061
69
0
0
1,061
69
998
-154
94.1 -224.1
3
3
60
219
60
219
-93.5
-79.8
0.1
0.4
FY17
2Q
3Q
4QE
45,091 43,601 42,937
-12.1
-14.5
-16.5
38,466 37,910 37,914
6,625 5,691
5,024
14.7
13.1
11.7
4,644 4,677
4,677
960
999
780
728
909
1,012
1,750
924
578
0
0 10,633
1,750
924 -10,055
899
923
-192
51.4
99.9
1.9
6
-7
-40
845
7 -9,824
845
7
607
1,303.7
-96.6
132.4
1.9
0.0
1.4
(INR Million)
FY16
FY17E
205,539
3.2
174,562
30,978
15.1
22,166
7,191
2,958
4,578
1,928
2,650
2,386
90.0
14
250
443
1,986.6
0.2
176,197
-14.3
152,138
24,059
13.7
18,658
3,672
3,603
5,332
11,553
-6,221
2,364
-38.0
-51
-8,534
7,409
1,573.9
4.2
4Q
51,452
6.9
43,343
8,109
15.8
7,259
1,689
1,028
190
1,928
-1,738
695
-40.0
5
-2,438
261
-78.8
0.5
1Q
50,317
-2.9
41,690
8,627
17.1
5,378
1,721
608
2,136
920
1,216
793
65.2
6
418
738
70.5
1.5
8 May 2017
20

5 May 2017
4QFY17 Results Update | Sector: Technology
L&T Infotech
Buy
BSE SENSEX
29,859
Bloomberg
Equity Shares (m)
M.Cap.(INRb)/(USDb)
52-Week Range (INR)
1, 6, 12 Rel. Per (%)
Avg Val, INRm
Free float (%)
Financials & Valuations (INR b)
2017
2018E
Y/E Mar
Net Sales
65.0
70.8
EBITDA
12.3
13.0
PAT
9.7
10.4
EPS (INR)
55.5
59.7
Gr. (%)
5.9
7.6
BV / Sh (INR)
159.5
204.8
ROE (%)
40.4
32.8
ROCE (%)
42.7
33.5
P /E (x)
13.2
12.3
P / BV (x)
4.6
3.6
S&P CNX
9,285
LTI IN
Broad-based momentum helps shun seasonality
171
n
4QFY17 revenue beat on broad-based momentum:
LTI’s 4QFY17 revenue
120.9 / 1.9
grew 2.4% QoQ in constant currency (CC) terms, against our expectation of
729 / 595
1.3%. Revenue growth was broad-based across verticals and geographies.
-/-/-
For FY17, CC growth of 10% was at the higher end of the industry. The year
128
was marked by stabilization of the Energy vertical and 8.4% growth in BFS
15.7
CMP: INR733
TP: INR850(+16%)
n
2019E
78.7
14.2
11.4
65.0
8.8
254.2
28.3
30.2
11.3
2.9
n
Estimate change
TP change
Rating change
n
despite this being a pressure-point for the industry.
Healthy momentum drives sanguine FY18 outlook:
Heading into FY18, this
momentum is expected to continue, led by: [1] Visibility from ramp-up in
deals, [2] Broad-based traction with no segment expected to decline, [3]
continued momentum in Digital, which is 28% of revenue.
Margin beat in part from one-time expenses:
Despite seasonality, higher
SGA (+60bp to 16.8%) and INR appreciation, LTI’s EBITDA margin expanded
by 90bp QoQ to 19% against our expectation of 20bp expansion to 18.3%.
Margin expansion was partly led by some accrual accounting at the year-end
around employee leaves encashment. However, with confidence of revenue
growth and multiple traditional levers in hand, there appears limited risk to
our assumption of a cumulative 80bp decline in margins over FY18-19.
4QFY17 PAT at INR2.5b (+2.7% QoQ) was higher than our estimate, led by
operational beat and higher other income.
Valuation view:
LTI is trading at 12.3/11.3x FY18/19E earnings. Our target
price of INR850 (+16%) discounts FY19E earnings by 13x - in the range of as
PSYS and MTCL which have demonstrated potential in newer services, but at
a premium to peers such as MPHL, KPIT and NITEC. This, we believe is
justified given strong positioning, superior cash generation, return ratios and
track record. Maintain Buy.
FY17
FY16
FY17
2Q
3Q
4Q
240
245
254
887
970
3.7
2.3
3.7
9.5
9.3
16,020 16,667 16,772 58,471 65,009
9.1
12.1
7.7
17.5
11.2
35.4
34.3
35.8
33.5
35.2
16.4
16.2
16.8
15.8
16.3
3,044 3,020 3,190 10,359 12,303
19.0
18.1
19.0
17.7
18.9
16.1
15.3
16.5
14.7
16.2
365
597
503 2,802 1,837
21.0
21.2
22.3
19.7
21.4
2,326 2,481 2,547 9,171 9,711
-1.4
6.7
2.7
21.3
10.5
11.4
21.5
5.9
13.3
14.2
14.6
52.4
55.5
21,074 20,605 21,023 20,072 21,023
78.7
78.1
78.3
73.8 7807.5
18.5
18.1
51.2
52.3
51.3
49.7
48.3
(INR Million)
Est. Var. (% /
4QFY17
bp)
249
1.9
1.7
195
16,605
1.0
4.2
348
34.3
153
16.0
79
3,035
5.1
18.3
74
15.3
119
261
92.5
21.0
2,219
14.8
-10.5
1,320
-16.1
2,751
12.7
22,246
(5.5)
76.0
230
52.7
(139)
Quarterly Performance
Y/E March
Revenue (USD m)
QoQ (%)
Revenue (INR m)
YoY (%)
GPM (%)
SGA (%)
EBITDA
EBITDA Margin (%)
EBIT Margin (%)
Other income
ETR (%)
PAT
QoQ (%)
YoY (%)
EPS (INR)
Headcount
Util incl. trainees (%)
Attrition (%)
Offshore rev. (%)
1Q
209
0.0
13,332
14.5
34.0
18.5
2,068
15.5
12.2
512
18.2
1,746
-21.2
7.5
10.0
20,331
73.8
20.1
51.9
FY16
2Q
3Q
4Q
224
225
230
7.3
0.5
2.1
14,682 14,870 15,579
18.7
12.4
17.8
34.5
36.4
33.5
17.9
16.8
15.4
2,431 2,914 2,820
16.6
19.6
18.1
13.6
16.7
15.3
532
285
526
24.4
18.8
21.6
1,917 2,245 2,286
9.8
17.1
1.8
7.2
12.5
3.2
11.0
12.8
13.1
22,689 22,477 20,072
72.8
74.0
75.9
19.7
18.5
18.4
51.7
51.3
52.4
1Q
231
0.6
15,550
16.6
35.3
15.7
3,050
19.6
16.9
372
21.2
2,359
3.2
35.1
13.5
19,292
77.4
19.5
51.9
8 May 2017
21

5 May 2017
4QFY17 Results Update | Sector: Cement
Orient Cement
Buy
BSE SENSEX
29,859
Bloomberg
Equity Shares (m)
M.Cap.(INRb)/(USDb)
52-Week Range (INR)
1, 6, 12 Rel. Per (%)
Avg Val, INRm
Free float (%)
S&P CNX
9,285
ORCMNT IN
Profitability uptick led by cost efficiencies
204.9
n
Strong volume growth:
4Q revenue grew 37% YoY (+31% QoQ) to INR5.97b
32.9/0.5
(est. of INR5.44b), as volumes rose 25% YoY to 1.73mt (est. of 1.5mt) due to
241 / 115
ramp-up of the new unit at Chitapur and higher sales from the old unit.
15/-15/-10
Realizations declined 6% QoQ (+10% YoY) to INR3,443/t (est. of INR3,700/t)
52
due to a sharp price decline in AP/Telangana. However, prices increased
62.5
CMP: INR160
TP: INR185 (+15%)
Financials & Valuations (INR b)
2017 2019E
Y/E Mar
Net Sales
18.8
23.5
EBITDA
1.8
3.5
NP
-0.3
0.9
EPS (INR)
-1.6
4.5
EPS Gr. (%)
-151.5
NA
BV/Sh. (INR)
48.2
52.1
RoE (%)
-3.2
9.0
RoCE (%)
1.4
7.7
EV/EBITDA (x)
24.8
12.3
EV/Ton (USD)
83
81
2019E
26.4
4.3
1.4
6.8
51.2
58.3
12.3
8.8
9.8
79
n
n
Estimate change
TP change
Rating change
n
sharply in AP/Telangana and Maharashtra in April/May 2017, which should
result in higher profitability for ORCMNT in 1QFY18.
Cost efficiency leads to margin improvement:
Cost/ton fell 8% QoQ (+12%
YoY) to INR3,007 (est. of INR3,146), led by (a) lower RM cost as there was no
sourcing of clinker from third parties in 4QFY17, (b) decline of 2% QoQ in
power/fuel cost on improved power consumption at the Chitapur unit and
higher proportion of petcoke used, (c) fall of 3% QoQ in freight cost/t due to
freight optimization measures. EBITDA thus rose 22% YoY (+66% QoQ) to
INR755m (est. of INR813m), with the margin at 12.7% (14.2% in 4QFY16).
EBITDA/ton grew INR72 QoQ (-INR10 YoY) to INR436 (est. of INR553).
Other key highlights:
(1) PPC sales at 76%/44% at old/new operations. (2)
Petcoke usage at ~53% on calorific value. 3) Lead distance maintained under
300km. (4) Market mix tilted toward west at 47%, with south at 40% and
others at 13%. (5) With sharp price hikes in AP/Telangana and Maharashtra
in April/May, EBITDA/t is likely to see meaningful increase QoQ in 1QFY18.
Valuation view:
Proposed acquisition of JPA’s assets would help ORCMNT to
raise capacity by 38% at reasonable valuation and significantly reduce lead
time to only 3-6 months. While the move would be dilutive to earnings and
return ratios over near term, it will help the company to become a pan-India
player by diversifying into the newer markets of central/east India. We like
the quality of asset and thus believe combined valuation of USD84/t (i.e.
Orient’s current + proposed asset valuations) is attractive. The stock trades
at EV of 9.8x FY19E EBITDA and USD79 per ton on standalone operations.
We value ORCMNT at EV/ton of USD88 on FY19E, at a 20% discount to
replacement cost, and accordingly assign a TP of INR185. Maintain
Buy.
8 May 2017
22

NIIT Technologies
BSE SENSEX
29,859
Bloomberg
Equity Shares (m)
M.Cap.(INRb)/(USDb)
52-Week Range (INR)
1, 6, 12 Rel. Per (%)
Avg Val, INRm
Free float (%)
S&P CNX
9,285
NITEC IN
61
Outlook for BFSI-led acceleration in FY18 growth
28.9 / 0.5
588 / 370
n
BFS traction compounds GIS seasonality:
NIIT Technologies’ (NITEC) 4QFY17
8/7/-16
revenues (excl. one-time settlement gains) grew 3.4% QoQ (+4.6% YoY) to
113
INR7.16b, above our estimate of INR6.98b. EBITDA grew by 1.8% YoY to
69.3
5 May 2017
4QFY17 Results Update | Sector: Technology
CMP: INR471
TP: INR470 (-0.2%)
Above-estimate excluding one-offs
Neutral
Financials & Valuations (INR b)
2016
2017E
Y/E Mar
26.8
27.7
Net Sales
4.7
4.6
EBITDA
2.8
2.7
PAT
45.7
38.2
EPS (INR)
143.7
-16.4
Gr. (%)
259.8
280.1
BV/Sh (INR)
19.0
14.2
RoE (%)
18.6
15.8
RoCE (%)
9.1
10.8
P/E (x)
1.6
1.5
P/BV (x)
2018E
30.6
5.1
3.0
49.3
28.9
316.2
16.5
15.3
8.4
1.3
n
n
Estimate change
TP change
Rating change
n
INR1.28b and PATF by 2.5% YoY to INR810m (excl. one-offs). ~4% QoQ
growth in BFSI helped drive revenue beat for the quarter.
For full-year FY17,
revenues grew by 4% YoY to INR27.7b, EBITDA by 2.3% YoY to INR4.7b,
while PAT declined by 0.7% YoY to INR2.62b.
Profit beat on better margins, lower tax:
EBITDA margin expanded 100bp
QoQ to 17.9%, above our estimate of 17.5%. PAT excluding one-offs grew
12.5% QoQ to INR810m, well above our estimate of INR667m, as operating
beat was compounded by a lower tax rate of 16% (est. of 24%).
Outlook for growth acceleration and margin expansion in FY18:
NITEC
expects revenue growth in FY18 to be higher than FY17, led by: [1] broad-
based traction in BFSI, [2] opportunity in GIS from Smart Cities and [3]
continued momentum in Digital. Also, SGA efficiencies and a number of
ongoing programs, combined with soft wage hikes, should help drive margin
expansion (from 16.6% in FY17) despite a stronger INR.
Attractive valuations; momentum yet lagging:
We expect USD revenue
CAGR of 6.5% and earnings CAGR of 9.4% over FY17-19E. NITEC trades at
11.1/10.2x FY18/19E. Our TP of INR470 discounts FY19E EPS by 10x – the
multiple being a function of missing consistency in deal wins, ongoing
lumpiness in revenue growth and consequent below-industry growth rate.
Maintain
Neutral.
8 May 2017
23

March 2017 Results Preview | Engineering
ABB
Bloomberg
Equity Shares (m)
M. Cap. (INR b)/(USD b)
52-Week Range (INR)
1,6,12 Rel Perf. (%)
ABB IN
211.9
280 / 4
1433 / 950
4 / 7 / -17
n
Financial Snapshot (INR b)
Y/E Dec
2016 2017E 2018E 2019E
Net Sales
EBITDA
Adj PAT
Adj EPS (INR)
EPS Gr (%)
BV/Sh (INR)
RoE (%)
RoCE (%)
Payout (%)
Valuations
P/E (x)
P/BV (x)
EV/EBITDA (x)
Div. Yield (%)
71.8
8.5
29.4
0.3
50.7
7.3
22.6
0.5
40.6
6.5
17.2
0.6
34.6
5.7
12.8
0.7
86.5
7.6
3.8
18.4
16.9
154.9
11.9
17.4
22.7
100.3
10.9
5.5
26.1
41.6
181.0
14.4
22.6
23.5
114.2
13.1
6.9
32.6
25.0
204.7
15.9
24.6
23.5
124.6
15.0
8.1
38.3
17.3
232.5
16.5
25.5
23.5
n
n
CMP: INR1,323 TP: INR1,190 (-10%)
n
Neutral
ABB has received an order of INR43.5b from PGCIL to set up a
transmission link between Raigarh and Pugular with 800KV HVDC
systems.
ABB continues to focus on increased localization and cost
optimization. Its direct RM costs have declined to 64.5% of revenue
from a peak of 81% in 4QCY10, well below its internal target of
65%. This has aided margins, despite negative operating leverage.
We expect revenue to grow 10% YoY led by execution ramp-up in
the project segment. Operating margin is likely to decline 180bp
YoY to 9.7%. Net profit should grow 28% YoY to INR1.01b.
Maintain
Neutral.
Key issues to watch
Ø
Management commentary suggests cautious optimism.
Continued focus on exports and services to be an important driver
of projected strong double-digit revenue and profit growth.
Ø
Continued preference for cash generation vis-à-vis profits.
Quarterly Performance
Y/E December
Sales
Change (%)
EBITDA
Change (%)
As % of Sales
Depreciation
Interest
Other Income
PBT
Tax
Effective Tax Rate (%)
Repoted PAT
Adj. PAT
Change (%)
1Q
20,003
10.2
1,571
9.4
7.9
359
206
148
1,154
364
31.5
710
790
45.5
CY16
2Q
3Q
21,015
20,550
8.8
4.4
1,701
1,516
5.6
-2.7
8.1
7.4
357
406
180
178
44
44
1,208
976
434
427
35.9
43.8
774
811
774
871
13.1
48.2
4QE
24,915
2.7
2,819
7.1
11.3
389
285
366
2,511
773
30.8
1,468
1,468
13.4
1Q
22,068
10.3
2,130
35.6
9.7
394
242
653
2,147
520
24.2
1,014
1,014
28.4
CY17
2Q
24,425
16.2
2,775
63.2
11.4
394
268
39
2,153
731
34.0
1,426
1,426
84.2
3Q
25,077
22.0
2,670
76.1
10.6
394
275
43
2,045
694
33.9
1,353
1,353
55.4
4QE
28,738
15.3
3,277
16.3
11.4
394
315
45
2,613
885
33.9
1,735
1,735
18.2
(INR Million)
CY16
85,156
6.2
7,607
1.9
8.9
1510
849
653
5,901
1,998
33.9
3,763
3,903
16.9
CY17E
99,078
16.3
10,853
42.7
11.0
1574
1,099
178
8,357
2,830
33.9
5,528
5,528
41.6
8 May 2017
24

March 2017 Results Preview | Sector: Telecom
Bharti Infratel
Bloomberg
Equity Shares (m)
M. Cap. (INR b)/(USD b)
52-Week Range (INR)
1,6,12 Rel Perf. (%)
BHIN IN
1896.7
641 / 10
413 / 283
6 / -16 / -30
CMP: INR338
n
n
TP: INR435 (+29%)
Buy
Financial Snapshot (INR Billion)
Y/E March
2016
2017 2018E
Net Sales
EBITDA
NP
EPS (INR)
EPS Gr. (%)
BV/Sh. (INR)
RoE (%)
RoCE (%)
Payout (%)
Valuations
P/E (x)
P/BV (x)
EV/EBITDA
Div. Yld (%)
26.3
3.2
10.6
1.3
20.1
3.2
9.6
1.2
18.6
2.9
8.2
1.2
123.3
54.1
22.5
11.8
48.1
96.7
12.7
11.2
39.0
134.1
58.5
28.7
15.5
47.9
96.8
15.7
12.7
29.9
149.7
64.9
31.0
16.7
41.3
108.6
15.9
13.0
27.7
2019E
163.6
71.1
36.8
19.9
28.1
123.5
16.7
12.9
23.3
15.7
2.5
7.0
1.2
n
n
n
We expect consolidated revenue to grow 10.1% YoY (and 3%
QoQ) to INR35b.
Consolidated rental revenue is likely to be INR21.8b, up 2.8% QoQ
and 7.1% YoY. We expect energy and other reimbursements to
grow 3.4% QoQ.
We expect consolidated EBITDA to improve 3% QoQ to INR15.2b.
EBITDA margin is likely to remain flat at 43.5% despite the healthy
tenancy addition owing to pressure on rental rates from revised
agreements.
We expect PAT to grow 16.5% QoQ to INR7.2b.
Bharti Infratel trades at an attractive EV/EBITDA of 9.6x FY17E
and 8.2x FY18E. Maintain Buy.
Key monitorables
Ø
Consolidated co-location additions (we expect a steady ~6,100 in
line with the high tenancy addition in 3QFY17).
Ø
Consolidated revenue per sharing operator (expected to decline
0.2% QoQ due to tenancy renewal risks).
Consol. Quarterly Performance
Y/E March
(Consolidated)
Revenue from operations
YoY Change (%)
Total Expenditure
EBITDA
Margins (%)
Depreciation
Interest
Other Income
PBT
Tax
Rate (%)
Reported PAT
Adj PAT
YoY Change (%)
Margins (%)
1Q
30,031
5.6
17,135
12,896
42.9
5,450
566
564
7,444
3,020
40.6
4,424
4,424
-4.4
14.7
FY16
2Q
3Q
30,410 31,056
3.8
5.3
17,315 17,433
13,095 13,623
43.1
43.9
5,562
5,526
-1,675
292
564
487
9,772
8,292
3,855
3,342
39.4
40.3
5,917
4,950
5,917
4,950
27.2
-2.3
19.5
15.9
4Q
31,817
8.0
17,322
14,495
45.6
5,697
-1,029
433
10,260
3,076
30.0
7,184
7,184
28.9
22.6
1Q
32,106
6.9
18,159
13,947
43.4
5,648
-1,281
352
9,932
2,369
23.9
7,563
7,563
71.0
23.6
FY17
2Q
3Q
32,919 34,007
8.3
9.5
18,421 19,206
14,498 14,801
44.0
43.5
5,629
5,664
-2,472
-947
333
357
11,674 10,441
3,936
4,237
33.7
40.6
7,738
6,204
7,738
6,204
30.8
25.3
23.5
18.2
4QE
35,043
10.1
19,797
15,246
43.5
5,654
-1,363
0
10,955
3,725
34.0
7,230
7,230
0.6
20.6
(INR Million)
FY16
FY17E
123,314
5.7
69,205
54,109
43.9
22,235
-1,847
2,048
35,769
13,293
37.2
22,476
22,476
12.8
18.2
134,075
8.7
75,583
58,492
43.6
22,595
-6,063
1,042
43,002
14,267
33.2
28,735
28,735
27.8
21.4
8 May 2017
25

March 2017 Results Preview | Sector: Financials-Banks
Union Bank of India
Bloomberg
Equity Shares (m)
M. Cap. (INR b)/(USD b)
52-Week Range (INR)
1,6,12 Rel Perf. (%)
Financial Snapshot (INR b)
Y/E March
2016 2017E
NII
83.1
88.6
OP
56.4
72.0
NP
13.5
5.8
NIM (%)
2.3
2.3
EPS (INR)
19.7
8.5
EPS Gr. (%)
-29.6 -57.0
BV/Sh. (INR)
293.9 301.3
ABV/Sh. (INR) 151.1 104.6
RoE (%)
7.0
2.8
RoA (%)
0.3
0.1
Div. Payout (%) 11.5
11.6
Valuations
P/E(X)
8.0
18.7
P/BV (X)
0.54
0.52
P/ABV (X)
1.0
1.5
Div. Yield (%)
1.2
0.5
UNBK IN
687.4
109 / 2
173 / 105
5 / -2 / 2
n
2018E
99.6
78.2
21.0
2.3
30.5
261.3
328.3
114.3
9.7
0.4
11.6
5.2
0.48
1.4
1.9
2019E
113
90.1
31.2
2.3
45.3
48.5
368
165
13.0
0.6
11.6
3.5
0.43
0.96
2.9
CMP: INR158
n
TP: INR174 (+10%)
Neutral
n
n
n
Muted growth environment, capital constraint and low risk
appetite would lead to moderate, yet in line with system loan
growth of 6% YoY/QoQ. Deposit growth is expected to be healthy
at ~10% YoY.
NIM is expected to improve by 18bp QoQ on account of lower
interest income reversals as well as benefit of lower cost of funds.
Hence, NII growth is expected to be healthy at ~12% YoY.
Other income is likely to grow ~40% YoY, although trading gains
would be lower than in 3QFY17. Opex growth of 9% would trail
total income growth of 21%, driving strong PPoP growth of 35%.
Slippages are expected to moderate, but remain at elevated
levels at 4.6%. Muted recoveries would keep net slippages high.
As a result, credit costs are expected to remain elevated at 2.4%
(similar to previous quarter).
Overall, we expect PAT growth of ~40% YoY. The stock trades at
0.4x FY19E BV and 3.5x FY19E EPS. Maintain Neutral .
Key issues to watch for
Ø
Performance on asset quality—slippage from restructured loans,
going forward.
Ø
Quantum of loans rescheduled under the 5:25 scheme.
Ø
Trends and efforts to improve CASA ratio and NIM.
Ø
Update and trends on balance sheet growth.
FY17
2Q
22,774
8.4
11,394
34,169
15,972
18,197
29.0
16,203
1,994
227
1,767
-73.2
2.3
9.3
7.7
73.4
31.5
56.4
2.0
298.6
10.7
FY16
3Q
21,366
7.0
13,397
34,763
16,250
18,513
38.8
16,701
1,811
771
1,040
32.4
2.0
16.0
3.5
69.2
36.8
55.2
2.0
324.0
11.7
4QE
23,388
12.2
13,898
37,286
18,223
19,063
35.2
17,167
1,896
554
1,342
39.6
Quarterly Performance
Net Interest Income
% Change (YoY)
Other Income
Net Income
Operating Expenses
Operating Profit
% Change (YoY)
Other Provisions
Profit before Tax
Tax Provisions
Net Profit
% Change (YoY)
Operating Parameters
NIM (Reported,%)
Deposit Growth (%)
Loan Growth (%)
CD Ratio (%)
CASA Ratio (%)
Asset Quality
OSRL (INR b)
OSRL (%)
Gross NPA (INR b)
Gross NPA (%)
E: MOSL Estimates
1Q
21,302
0.6
7,832
29,134
14,252
14,882
8.5
6,424
8,458
3,270
5,188
-21.9
2.4
10.0
6.0
75.8
28.3
141.3
5.5
141.4
5.5
FY16
2Q
21,017
0.8
9,595
30,612
16,505
14,107
5.8
4,325
9,782
3,200
6,582
77.3
2.3
10.2
3.3
74.5
(INR Million)
FY17E
88,551
6.5
49,088
137,639
65,616
72,023
27.6
63,601
8,423
2,611
5,812
-57.0
3Q
19,965
-5.9
8,927
28,892
15,551
13,342
-9.0
12,377
965
180
785
-74.0
2.2
4.6
5.0
77.5
4Q
20,847
-1.7
9,964
30,811
16,715
14,096
-14.7
15,647
-1,551
-2,512
961
-78.3
2.3
8.2
4.6
78.0
1Q
21,023
-1.3
10,399
31,421
15,171
16,251
9.2
13,530
2,721
1,058
1,663
-67.9
2.3
3.5
3.5
75.8
31.5
72.5
2.7
272.8
10.2
83,131
-1.5
36,317
119,448
63,022
56,426
-3.1
38,772
17,654
4,138
13,516
-24.1
2.3
8.2
4.6
78.0
10.0
4.0
73.8
10.0
4.0
73.8
139.1
5.5
155.4
6.1
136.2
5.2
185.0
7.1
85.7
3.1
241.7
8.7
347.0
11.8
85.7
3.1
241.7
8.7
0.0
0.0
347.0
11.8
8 May 2017
26

In conversation
1. Emami: Rural markets seeing recovery; volume growth to
improve in FY18; NH Bhansali, CEO
n
n
n
n
The de-growth in international business was by more than 30% because of
corrected inventories and lower demand in countries like Russia and Middle-
East.
The volume growth for domestic was around 3.1% for the quarter, expecting
good monsoon and GST rollout to aid growth going forward. The volume growth
for FY18 would improve.
Not worried much about competition from Patanjali, infact, it will help grow the
overall industry. The increased competition will be good for customers and
would benefit all.
The company has increased market share across the board. Rural market is
showing signs of green shoots but the trade channel distributions is yet to reach
the pre-demonetisation levels.
2. L&T Infotech: See robust growth in q3, q4 fy18 on back of new
deals; Sanjay Jalona, CEO and MD
n
n
n
n
Had announced three large deal with total contract value (TCV) of USD 100
million in the third quarter of FY17, and the revenues from that will come
through from Q2 FY18, so Q3 and Q4 of FY18 will see robust growth.
Talking about the visa cost, the costs will be lesser on the company than other IT
companies, plan to increase local hiring in the US. Have an overall strength of
20000 employees of which 24% are onshore.
Will remain watchful of immigration environment in the US. The forex impact
was flat in Q4 because of operational efficiencies.
Retain the margin guidance of 14-15% despite visa concerns in the US. Expecting
80% of the work to be digital by 2025.
3. Niti aayog: We will reassess the npa situation in 4-6 months;
Arvind Panagariya, VC
n
n
n
n
This is a huge beginning and this may not be the end but let us see where this
leads us in the next four to six months and then we can reassess.
Now with the legislative backing, which at least draws some firewalls, the ability
of the finance ministry as well as the banks to move is greatly enhanced.
As long as the banks actually take the necessary decisions on their own, the
directive will not have to be issued. RBI will step in only in cases where actually
even based on commercial considerations, a decision is not being made.
The government has the possibility of revoking the power eventually, once the
cleanup has actually happened. So it is not necessary that these powers are left
forever with the RBI.
8 May 2017
27

From the think tank
1. Container shipping’s mega crisis. by Jose Paul
n
April 26, 1956 is widely regarded as a key date in the history of container
shipping. That day, standardised containers were first used to transport cargo by
sea. The converted tanker — Ideal X — sailed from New York to Houston in the
US, carrying 58 containers on its decks along with petroleum in its hold. The idea
of putting cargo into containers, which were 35-feet long at that time, was the
brain child of trucking magnate Malcom Mclean who calculated that loading a
medium-sized ship in the conventional way would cost $5.83 a tonne, compared
with less than $0.16 a tonne on Ideal X.
2. A new economics for a better world. by Simon Sweeney
n
The discipline of economics has long been obsessed with gross domestic
product as the base measure of development. Contemporary economic
globalisation and its dominant neoliberal ideology see other considerations as
not worth more than a passing glance. Neoliberalism, which used to be referred
to as the Washington Consensus, was promoted by Chicago School economists,
led by Milton Friedman. It was adopted by the Reagan administration, the World
Bank and the IMF in the 1980s, and ruthlessly imposed on client states and
developing economies worldwide.
3. Petrocoin: Oil-backed bilur launch may effect a paradigm shift
for crypto-currencies. by The Financial Express
n
In 2012, the European Central Bank had remarked that the theoretical roots of
Bitcoin can be found in the Austrian school of economics. Hayek had written
papers on denationalisation of money, arguing how governments should not
have a monopoly over issuance of currency. While little has changed since then,
Bitcoin is certainly attracting more users now after eight years of its
introduction. The currency is at an all-time high—it touched $1,400 on
Tuesday—and more monetary systems are evolving around it.
4. Advice and dissent on india’s fiscal path. by Indira Rajaraman
n
The report of the Fiscal Responsibility and Budget Management (FRBM) review
committee (chaired by N.K. Singh) was made public in mid-April 2017, three
months after submission to the government at the Centre. The report prescribes
a fiscal path over a six-year period of fairly severe fiscal tightening going up to
the year 2023. What it prescribes for the period beyond is a bit unclear, and is
one of the issues raised in a detailed note of dissent by a key member of the
committee, the chief economic adviser (CEA).
8 May 2017
28

5. Kashmir politics - not a stone's throw away. by Mohan Sahay
n
Stone pelters in the Valley have assumed the size and shape of Frankenstein's
monster that is aiming to destroy the very process of democracy in Kashmir.
They are working under a wellthought-out long-term plan of Pakistan to create a
situation where people would not participate in any election in the future. If this
happens, Pakistan would have a weapon to attack India politically at
international forums saying that Kashmiris have Rsrejected Indian democracy'. If
the legitimacy of elections is gone, it will attract adverse publicity even from
countries that are with India in its fight against terror.
International
6. The implosion of the venezuelan thugocracy. by The Financial
Times
n
When Hugo Chávez rewrote the Venezuelan constitution 18 years ago, he
predicted it would last for “centuries”. This week his successor, Nicolás Maduro,
said he wanted a new one. More ominously, the president called for the
creation of a “popular assembly”. This new “supreme” organ of power would
neither require political parties nor popular elections. In theory, it could rule
forever. The proposal provoked outrage. It gave further impetus to month-long
street protests, where more than 30 people have died.
8 May 2017
29

Click excel icon
for detailed
valuation guide
CMP
(INR)
874
83
2,890
1,098
23,265
1,664
25,837
794
592
241
3,363
1,321
243
6,648
420
493
TP
% Upside
EPS (INR)
(INR) Downside FY17E FY18E FY19E
1,084
98
3,282
1,266
22,924
1,741
28,811
841
608
274
3,390
1,573
-
7,319
609
581
24
18
14
15
-1
5
12
6
3
14
1
19
10
45
18
29.3
4.2
133.7
25.3
472.3
93.3
615.4
22.3
23.2
8.2
172.2
61.7
5.4
248.6
11.5
11.7
37.3
43.4
5.2
6.6
154.8 174.0
37.2
50.6
667.8 764.1
104.9 133.9
854.5 1,047.6
29.4
34.1
9.5
185.1
75.4
9.9
300.0
29.4
16.7
37.4
43.4
11.8
188.3
89.5
11.8
370.9
62.0
26.7
Valuation snapshot
P/E (x)
P/B (x)
ROE (%)
FY17E FY18E FY17E FY18E FY17E FY18E FY19E
29.8
19.7
21.6
43.5
49.3
17.8
42.0
35.7
25.5
29.6
19.5
21.4
45.4
26.7
36.4
41.9
28.9
32.9
27.3
28.1
24.2
27.0
17.7
21.6
28.1
NM
33.8
47.2
9.2
22.0
26.7
24.9
NM
15.7
51.1
11.5
695.9
33.1
34.1
22.1
32.0
37.0
37.6
14.6
51.7
33.0
16.0
18.9
11.1
46.3
23.4
16.1
18.7
29.5
34.8
15.9
30.2
27.0
17.4
25.5
18.2
17.5
24.7
22.2
14.3
29.5
20.6
21.5
21.7
25.8
20.2
22.8
17.7
19.6
23.7
6.3
28.1
31.8
8.2
17.4
21.6
9.9
12.7
11.0
12.1
10.1
8.3
14.0
17.5
6.1
13.8
26.8
24.4
11.2
40.9
30.5
13.4
16.2
8.2
25.4
5.9
3.8
6.0
6.5
9.4
2.8
14.8
6.4
3.0
4.1
7.1
3.2
2.8
5.6
1.7
9.7
4.1
2.2
2.9
2.4
2.3
4.6
2.0
1.5
4.2
0.8
4.4
4.9
0.9
4.1
3.1
1.2
0.8
0.8
0.7
1.1
0.4
1.0
1.3
0.6
1.0
7.7
4.5
1.7
13.8
6.1
3.8
3.4
2.5
2.9
4.9
3.4
5.3
5.6
7.8
2.4
10.6
5.3
2.6
3.7
6.1
3.0
2.5
4.8
1.5
7.7
3.6
2.1
2.6
2.2
2.1
4.0
1.9
1.4
3.7
0.7
3.8
4.4
0.8
3.4
2.8
1.1
0.7
0.8
0.7
1.0
0.4
0.9
1.2
0.6
1.0
6.2
3.8
1.5
11.5
5.5
3.4
2.9
2.2
2.7
21.7
20.6
29.5
15.7
18.2
16.9
40.7
19.6
12.1
14.0
39.5
14.5
6.4
20.3
4.7
25.6
14.3
6.9
10.9
10.7
9.9
17.9
10.1
7.2
16.0
-21.1
13.8
12.3
9.7
18.6
11.6
5.0
-2.5
5.2
1.4
10.1
0.1
3.0
3.9
2.8
3.2
22.7
15.1
14.4
30.4
19.3
25.5
19.4
23.9
6.4
22.9
22.3
30.2
20.5
24.5
16.3
40.9
21.6
15.9
14.5
36.2
13.9
10.8
21.2
11.0
29.2
17.5
9.9
12.4
8.9
10.9
18.2
9.1
7.4
16.5
11.6
14.5
14.6
10.0
18.0
13.0
11.9
6.0
7.0
5.8
10.6
5.2
6.7
7.3
9.7
7.1
25.5
16.7
14.5
30.6
18.3
27.0
19.3
29.0
10.9
22.0
24.9
30.0
23.7
23.4
17.9
36.7
22.9
17.5
15.8
31.9
14.7
11.5
22.3
20.4
35.9
21.1
15.7
14.0
9.6
12.5
19.0
9.8
9.0
17.3
12.5
15.7
17.3
11.3
19.7
14.6
14.8
9.2
10.5
7.3
11.1
6.1
8.3
9.3
13.0
9.2
27.3
19.5
15.2
30.9
17.4
29.6
19.0
32.2
12.9
Company
Automobiles
Amara Raja
Ashok Ley.
Bajaj Auto
Bharat Forge
Bosch
CEAT
Eicher Mot.
Endurance
Tech.
Escorts
Exide Ind
Hero Moto
M&M
Mahindra CIE
Maruti Suzuki
Tata Motors
TVS Motor
Aggregate
Banks - Private
Axis Bank
DCB Bank
Equitas Hold.
Federal Bank
HDFC Bank
ICICI Bank
IDFC Bank
IndusInd
J&K Bank
Kotak Mah. Bk
RBL Bank
South Indian
Yes Bank
Aggregate
Banks - PSU
BOB
BOI
Canara
IDBI Bk
Indian Bk
OBC
PNB
SBI
Union Bk
Aggregate
NBFCs
Bajaj Fin.
Bharat Fin.
Dewan Hsg.
GRUH Fin.
HDFC
Indiabulls Hsg
LIC Hsg Fin
Manappuram
M&M Fin.
Reco
Buy
Buy
Buy
Buy
Neutral
Buy
Buy
Buy
Buy
Buy
Neutral
Buy
Not Rated
Buy
Buy
Buy
Neutral
Neutral
Buy
Buy
Buy
Buy
Neutral
Buy
Neutral
Buy
Under Review
Neutral
Buy
505
191
160
116
1,532
299
65
1,408
82
907
561
25
1,609
525
170
220
125
1,790
365
62
1,700
75
1,050
-
21
2,110
4
-11
37
7
17
22
-4
21
-9
16
-17
31
15.4
7.0
5.7
4.8
56.8
16.8
3.0
50.1
-25.2
26.8
11.9
2.8
73.2
23.4
8.8
6.2
5.8
67.1
16.8
3.3
59.4
13.0
32.3
17.6
3.1
92.2
41.2
11.2
7.4
7.3
79.4
19.2
4.3
72.0
15.4
40.5
23.8
3.8
116.2
Buy
Neutral
Neutral
Neutral
Buy
Neutral
Buy
Buy
Neutral
187
184
395
78
337
175
175
296
187
224
129
310
49
360
138
186
340
174
20
-30
-21
-37
7
-21
6
15
-7
7.5
-5.7
25.2
1.5
29.3
0.3
5.3
8.7
8.5
19.0
14.5
35.9
6.4
33.3
21.0
12.4
16.9
30.5
26.1
23.7
57.6
8.6
38.1
26.0
16.6
23.3
45.3
Buy
Neutral
Buy
Neutral
Buy
Buy
Neutral
Not Rated
Buy
1,274
790
432
421
1,547
1,103
721
91
328
1,448
769
559
421
1,797
1,227
723
-
400
14
-3
29
0
16
11
0
22
34.4
21.0
29.6
8.1
46.8
69.0
38.2
8.2
7.1
47.5
32.4
38.6
10.3
50.7
82.2
44.6
11.1
12.9
64.0
45.3
45.5
12.5
55.9
101.6
51.2
14.0
16.4
8 May 2017
30

Click excel icon
for detailed
valuation guide
CMP
(INR)
391
162
741
213
2,135
1,001
TP
% Upside
EPS (INR)
(INR) Downside FY17E FY18E FY19E
465
19
29.7
34.5
40.0
117
-28
25.7
27.2
30.2
831
12
28.6
34.0
40.2
134
-37
31.4
35.0
40.4
2,689
1,269
26
27
84.3
55.6
130.4
77.4
164.7
98.6
Valuation snapshot
P/E (x)
P/B (x)
ROE (%)
FY17E FY18E FY17E FY18E FY17E FY18E
13.2
11.3
2.4
2.2
19.7
20.2
6.3
5.9
1.1
1.0
17.9
17.0
25.9
21.8
4.1
3.5
17.3
17.5
6.8
6.1
1.3
1.1
19.9
19.1
25.3
18.0
18.5
76.7
27.7
31.1
48.2
49.8
21.3
38.7
55.6
54.3
11.3
20.1
32.2
24.8
79.7
40.9
32.0
42.9
25.5
30.8
36.3
50.4
49.0
35.7
74.0
17.3
40.6
30.6
82.2
24.4
NM
NM
53.1
45.0
38.4
55.9
48.8
46.7
37.6
41.0
47.5
33.6
49.5
33.1
47.3
16.4
12.9
15.9
54.1
24.6
30.2
33.5
41.6
20.0
33.8
30.3
40.2
11.9
17.3
27.1
19.2
52.7
34.9
23.0
35.5
19.5
28.0
30.6
37.1
33.6
18.7
47.7
13.7
23.8
26.8
39.8
22.5
50.7
44.3
40.1
35.6
28.9
50.7
42.3
39.3
35.3
36.4
41.1
29.8
44.3
29.6
42.0
2.8
2.0
3.2
9.1
5.3
1.2
9.1
37.7
1.1
8.2
6.6
11.0
2.0
3.1
3.4
2.1
7.3
7.0
-1.9
4.8
3.5
5.1
4.1
2.5
3.7
2.1
4.9
1.9
1.7
3.9
4.2
4.4
3.4
6.1
9.6
5.1
3.8
17.2
18.7
24.4
9.9
13.1
10.0
7.7
34.1
8.8
7.5
2.5
1.8
2.8
7.8
4.6
1.2
7.9
25.6
1.1
7.5
5.9
9.9
1.7
2.7
3.1
1.9
6.3
6.0
-2.0
4.4
3.1
4.5
3.7
2.5
3.7
2.0
4.5
1.7
1.6
3.5
4.1
3.8
3.2
5.5
7.9
4.6
3.4
15.2
14.8
22.9
8.5
11.1
8.5
6.7
35.5
7.7
6.9
11.8
11.7
17.3
11.9
20.4
4.0
20.2
94.3
5.4
22.6
11.7
20.3
19.2
16.6
10.9
8.6
9.2
18.4
NM
11.6
8.9
17.6
11.2
5.0
7.5
6.0
6.8
11.7
4.0
13.3
5.2
19.6
-3.7
-3.1
19.2
12.0
9.8
32.8
43.1
54.9
28.4
36.6
22.5
24.6
67.6
28.4
16.4
16.2
14.5
17.8
14.4
18.8
4.0
25.3
73.3
5.5
23.2
20.7
24.6
15.7
16.8
11.9
10.0
11.9
18.6
-8.8
12.9
16.7
17.1
12.1
6.7
11.0
10.9
9.8
13.2
6.2
13.6
10.5
18.0
6.6
13.1
21.7
13.6
11.9
31.8
39.2
60.1
26.0
33.0
22.2
24.0
78.4
27.6
17.1
FY19E
20.6
16.8
17.6
19.1
17.8
16.3
17.9
15.9
19.1
4.0
31.2
66.1
6.0
25.3
19.2
25.1
14.6
16.2
12.7
11.8
14.2
19.0
-11.0
13.2
17.3
17.1
12.8
7.1
14.2
13.2
12.9
14.8
7.7
16.0
14.7
18.5
11.3
20.8
23.5
15.7
13.7
32.4
38.0
68.5
26.3
33.2
21.9
23.1
92.5
28.7
18.1
Company
Reco
Muthoot Fin
Buy
PFC
Neutral
Repco Home Buy
REC
Neutral
Shriram
City
Buy
Union
STF
Buy
Aggregate
Capital Goods
ABB
Neutral
Bharat Elec.
Buy
BHEL
Sell
Blue Star
Neutral
CG Cons. Elec. Buy
CG Power &
Sell
Indu.
Cummins
Neutral
GE T&D
Neutral
Havells
Neutral
Inox Wind
Neutral
K E C Intl
Buy
L&T
Buy
Pennar Eng.
Not Rated
Siemens
Neutral
Solar Ind
Neutral
Suzlon Energy Not Rated
Thermax
Sell
Va Tech Wab. Buy
Voltas
Sell
Aggregate
Cement
Ambuja Cem. Buy
ACC
Neutral
Birla Corp.
Buy
Dalmia Bharat Buy
Grasim Inds.
Neutral
India Cem
Neutral
J K Cements
Buy
JK Lakshmi Ce Buy
Ramco Cem
Buy
Orient Cem
Buy
Prism Cem
Buy
Shree Cem
Buy
Ultratech
Buy
Aggregate
Consumer
Asian Paints
Neutral
Britannia
Buy
Colgate
Buy
Dabur
Neutral
Emami
Buy
Godrej Cons. Neutral
GSK Cons.
Neutral
HUL
Neutral
ITC
Buy
Jyothy Lab
Neutral
1,412
180
173
680
227
78
1,031
334
485
197
212
1,725
144
1,355
779
20
1,009
675
418
1,190
180
115
680
221
45
990
340
425
175
175
1,750
-
1,340
800
-
781
760
370
-16
0
-33
0
-3
-42
-4
2
-12
-11
-17
1
-1
3
-23
13
-11
18.4
6.5
5.5
14.1
4.6
3.6
26.6
6.0
8.9
17.5
10.5
53.6
5.8
17.0
19.0
0.6
23.5
26.5
13.6
26.1
7.3
5.7
20.3
5.5
3.9
30.5
11.0
12.1
16.6
12.3
63.6
7.5
25.7
22.3
0.9
28.4
34.5
14.9
32.6
8.5
5.8
29.5
6.7
4.5
36.5
11.4
14.1
17.7
13.5
74.4
10.0
33.5
26.5
1.0
31.5
40.3
16.9
246
1,655
770
2,267
1,190
207
999
487
678
160
116
19,268
4,323
283
1,521
869
2,392
1,067
152
1,103
526
815
167
118
20,072
4,928
15
-8
13
6
-10
-27
10
8
20
4
1
4
14
4.9
33.7
21.5
30.7
68.7
5.1
32.6
5.9
27.8
-1.8
-0.6
363.2
96.1
6.6
49.2
41.2
47.5
86.6
8.7
37.2
12.2
30.1
3.2
2.6
480.6
121.4
7.2
63.6
54.4
70.1
111.1
11.9
49.3
17.8
36.2
5.8
4.8
642.3
159.1
1,146
3,523
1,013
273
1,085
1,766
5,164
954
277
377
1,145
4,065
1,200
295
1,295
1,740
5,410
945
320
380
0
15
19
8
19
-1
5
-1
16
1
20.5
72.2
21.7
7.2
26.5
37.1
153.9
19.3
8.4
8.0
22.6
83.3
25.8
7.7
29.8
42.9
173.1
21.5
9.3
9.0
26.7
101.7
31.6
9.1
36.0
49.8
190.8
24.8
11.0
10.5
8 May 2017
31

Click excel icon
for detailed
valuation guide
CMP
(INR)
305
6,722
14,206
240
735
7,373
777
1,896
TP
% Upside
(INR) Downside
335
10
6,665
-1
17,480
23
250
4
740
1
8,790
19
1,030
33
2,025
7
EPS (INR)
FY18E FY19E
6.9
8.4
139.2 163.3
305.1 388.4
6.9
12.5
18.3
20.5
167.7 198.8
14.3
18.4
42.2
58.7
Valuation snapshot
P/E (x)
P/B (x)
ROE (%)
FY17E FY18E FY17E FY18E FY17E FY18E
48.6
43.9
16.9
14.4
36.7
35.5
57.0
48.3
21.5
18.7
39.0
41.4
60.3
46.6
24.9
19.6
41.3
42.2
295.4 34.5
3.0
2.7
1.3
8.2
44.3
40.2
11.4
9.3
27.9
25.4
50.6
44.0
13.7
11.8
29.0
28.8
72.8
54.2
8.7
7.7
12.6
15.0
66.2
45.0
12.5
9.9
20.8
22.1
43.4
38.3
12.9
11.3
29.8
29.6
27.5
24.3
28.0
14.8
33.9
38.8
30.7
14.6
34.2
89.8
20.8
20.4
70.8
34.0
20.4
32.4
23.3
36.2
22.9
25.2
19.9
46.8
40.1
30.2
16.2
14.7
34.1
66.6
18.4
NM
11.3
10.2
18.0
73.3
NM
33.9
44.6
39.5
11.0
12.7
NM
22.8
22.5
24.7
13.0
31.4
26.4
25.0
19.1
23.5
71.5
17.2
18.0
44.0
19.3
15.9
26.5
19.4
29.2
17.0
20.7
16.5
36.9
29.8
16.0
8.5
11.8
25.0
36.1
16.3
44.7
10.4
10.1
15.8
42.6
NM
28.7
29.3
28.7
8.2
11.6
NM
5.9
5.4
9.2
3.7
4.6
7.8
3.4
3.5
3.2
2.4
4.2
3.2
15.9
2.8
4.2
5.3
4.4
7.3
5.5
4.4
2.6
20.7
3.5
2.1
2.2
2.3
3.8
19.2
4.6
1.1
1.9
0.8
3.5
7.4
3.8
8.5
9.9
6.4
1.6
3.5
0.3
4.9
4.6
7.0
2.9
4.2
6.4
3.0
3.2
2.9
2.0
3.3
2.4
18.9
2.5
3.4
4.8
3.7
6.0
4.5
3.8
2.3
15.8
3.2
2.0
2.0
1.9
3.4
12.5
4.0
1.1
1.6
0.7
3.0
6.5
3.2
7.8
8.1
5.6
1.3
2.9
0.3
23.1
24.4
37.7
28.6
13.6
21.4
11.0
25.4
9.8
2.7
20.1
18.8
22.4
8.4
22.8
16.2
19.8
22.2
25.9
17.6
11.5
50.5
8.8
7.2
12.4
16.7
11.0
33.6
26.2
-4.1
18.5
7.7
20.7
10.6
-21.7
25.1
29.1
16.3
15.4
24.4
-7.5
23.6
22.0
32.3
25.3
13.3
26.5
12.2
17.7
12.9
3.1
19.0
15.8
43.0
13.5
23.8
18.1
20.9
22.5
29.3
18.3
14.8
48.6
11.2
12.9
19.4
17.8
13.7
42.0
26.2
2.5
16.8
7.1
20.6
16.3
0.0
27.3
30.3
19.6
17.5
27.2
-4.5
FY19E
38.1
41.9
43.2
13.2
23.4
29.5
16.8
23.8
30.5
24.1
21.7
30.0
24.0
16.1
27.9
13.8
18.8
15.2
6.1
19.1
18.3
56.9
15.9
22.1
19.4
21.0
20.7
29.6
18.9
14.8
46.8
11.8
15.3
25.4
18.6
14.9
43.9
26.8
8.8
15.8
7.0
20.4
22.0
11.1
29.0
29.4
21.6
16.8
25.4
-0.6
Company
Reco
Marico
Neutral
Nestle
Neutral
Page Inds
Buy
Parag Milk
Neutral
Pidilite Ind.
Neutral
P&G Hygiene Buy
United Brew
Buy
United Spirits Neutral
Aggregate
Healthcare
Alembic Phar Neutral
Alkem Lab
Neutral
Ajanta Pharma Buy
Aurobindo
Buy
Biocon
Sell
Cadila
Buy
Cipla
Neutral
Divis Lab
Neutral
Dr Reddy’s
Neutral
Fortis Health Buy
Glenmark
Neutral
Granules
Buy
GSK Pharma
Neutral
IPCA Labs
Neutral
Lupin
Buy
Sanofi India
Buy
Sun Pharma
Buy
Syngene Intl
Not Rated
Torrent Pharma Buy
Aggregate
Logistics
Allcargo
Buy
Logistics
Blue Dart
Not Rated
Concor
Neutral
Gateway
Buy
Distriparks
Gati
Not Rated
Transport Corp. Not Rated
Aggregate
Media
Dish TV
Buy
D B Corp
Buy
Den Net.
Neutral
Hind. Media
Buy
HT Media
Neutral
Jagran Prak.
Buy
PVR
Buy
Siti Net.
Neutral
Sun TV
Neutral
Zee Ent.
Buy
Aggregate
Metals
Hindalco
Buy
Hind. Zinc
Sell
JSPL
Buy
FY17E
6.3
118.0
235.6
0.8
16.6
145.7
10.7
28.6
593
1,931
1,636
590
1,038
466
549
626
2,602
211
846
139
2,445
538
1,251
4,181
631
472
1,294
640
1,850
2,028
900
900
510
550
600
3,050
250
990
160
2,700
540
1,850
5,000
850
-
1,700
8
-4
24
53
-13
9
0
-4
17
19
17
15
10
0
48
20
35
31
21.6
79.3
58.4
39.8
30.6
12.0
17.9
43.0
76.1
2.3
40.6
6.8
34.5
15.8
61.4
129.0
27.1
13.0
56.6
26.0
85.7
66.4
45.4
33.1
17.7
22.0
32.9
110.9
2.9
49.2
7.7
55.5
27.9
78.6
157.8
32.5
16.1
76.3
32.1
100.0
79.9
54.3
44.9
23.0
28.5
38.6
147.2
6.5
60.5
11.3
64.4
37.3
88.8
189.9
38.7
18.0
93.4
180
4,796
1,190
251
135
249
203
-
1,042
314
-
-
13
-12
25
9.0
102.5
29.7
8.3
8.4
16.9
10.9
129.9
39.9
15.7
15.9
21.0
12.3
163.2
44.9
20.1
23.9
25.9
96
376
98
285
82
193
1,522
32
852
507
115
450
90
360
90
225
1,667
40
860
610
20
20
-8
26
9
16
10
24
1
20
1.4
20.4
-3.6
25.2
8.0
10.8
20.8
-1.8
25.1
11.4
2.7
23.0
2.2
27.4
8.2
12.2
35.7
0.0
29.7
17.3
4.3
26.5
8.5
30.3
8.7
13.9
56.8
1.2
34.5
20.6
186
251
108
235
235
181
27
-6
67
16.9
19.7
-22.3
22.6
21.5
-17.5
25.4
23.7
-2.2
8 May 2017
32

Click excel icon
for detailed
valuation guide
CMP
(INR)
190
66
124
60
223
433
TP
% Upside
EPS (INR)
(INR) Downside FY17E FY18E FY19E
222
17
13.6
18.3
20.5
83
27
3.9
5.3
5.8
178
43
12.1
12.3
13.0
30
-50
-7.4
-12.6
0.4
250
12
17.7
24.7
27.7
440
2
18.9
39.4
45.7
Valuation snapshot
P/E (x)
P/B (x)
ROE (%)
FY17E FY18E FY17E FY18E FY17E FY18E
14.0
10.4
2.1
1.8
16.2
18.7
16.8
12.3
1.2
1.1
7.5
9.6
10.3
10.1
1.6
1.5
13.4
15.5
NM
NM
0.7
0.8
-8.1
-15.4
12.6
9.0
1.4
1.3
11.4
15.0
23.0
11.0
3.5
2.8
13.6
28.2
17.9
14.0
1.4
1.3
7.9
9.6
13.0
19.3
45.3
20.6
9.8
9.9
24.0
10.4
11.3
12.0
19.3
12.5
12.8
83.5
52.3
55.1
16.7
14.5
17.4
14.8
10.8
13.2
19.9
13.1
13.0
15.5
26.0
17.4
12.7
14.7
16.1
15.8
31.2
23.6
NM
24.6
36.9
16.7
18.7
16.6
13.5
13.7
14.4
13.5
14.5
19.8
16.6
11.7
11.0
23.7
11.1
9.8
9.2
16.2
10.9
11.7
47.3
47.2
47.2
13.6
12.9
15.5
14.4
9.6
12.3
16.3
13.0
10.1
13.2
21.4
16.6
11.6
14.4
13.1
15.2
67.6
21.9
NM
32.8
#####
13.9
12.6
30.4
11.2
11.8
12.3
3.3
2.1
4.7
2.4
2.6
2.4
5.0
2.8
1.1
1.2
4.3
1.4
1.8
8.4
10.5
10.1
2.7
3.6
4.2
3.1
1.6
4.6
3.2
2.0
1.7
2.4
10.0
5.5
2.4
2.4
2.5
3.7
2.0
3.8
1.2
11.5
2.3
6.8
2.1
1.0
1.4
2.2
1.4
2.9
1.9
3.9
2.1
2.3
2.1
4.3
2.3
1.0
1.2
3.6
1.2
1.6
9.2
9.1
9.1
2.4
3.5
3.7
2.8
1.4
3.6
2.9
1.9
1.5
2.3
7.9
5.6
2.1
2.1
2.2
3.5
2.0
3.4
1.5
8.5
2.3
6.8
1.9
1.0
1.3
1.9
1.3
27.1
13.0
10.7
12.0
27.8
26.0
22.3
29.6
9.8
10.4
23.9
11.9
13.8
10.1
21.5
18.4
16.2
27.0
26.5
23.3
14.3
40.4
16.8
14.1
13.5
17.0
42.5
33.5
20.1
16.9
16.3
23.5
6.5
15.7
-4.2
126.2
6.1
40.6
11.1
6.7
10.6
17.3
10.8
22.7
14.0
21.5
13.5
20.7
20.4
19.7
22.7
10.8
13.0
24.0
11.8
13.8
19.5
20.6
19.3
17.6
27.8
25.3
21.4
15.6
32.6
18.9
14.9
15.9
18.1
41.3
32.4
19.5
15.5
17.7
23.0
2.9
15.9
-25.3
29.8
0.1
48.8
15.8
3.3
11.9
17.5
11.1
FY19E
17.9
9.9
15.1
0.5
15.6
26.5
12.0
21.4
14.4
22.0
14.5
18.6
18.8
19.2
21.4
11.6
14.1
27.2
11.2
13.6
24.9
20.3
19.7
17.9
28.1
23.5
21.2
15.2
28.2
20.5
14.7
16.0
20.3
40.8
32.3
19.2
15.7
17.8
22.3
5.2
16.7
-37.1
41.4
2.2
53.5
15.2
2.8
13.3
17.7
10.6
Company
JSW Steel
Nalco
NMDC
SAIL
Vedanta
Tata Steel
Aggregate
Oil & Gas
BPCL
GAIL
Gujarat Gas
Gujarat St. Pet.
HPCL
IOC
IGL
MRPL
Oil India
ONGC
PLNG
Reliance Ind.
Aggregate
Retail
Jubilant Food
Titan Co.
Aggregate
Technology
Cyient
HCL Tech.
Hexaware
Infosys
KPIT Tech
L&T Infotech
Mindtree
Mphasis
NIIT Tech
Persistent Sys
Tata Elxsi
TCS
Tech Mah
Wipro
Zensar Tech
Aggregate
Telecom
Bharti Airtel
Bharti Infratel
Idea Cellular
Tata Comm
Aggregate
Utiltites
Coal India
CESC
JSW Energy
NTPC
Power Grid
Tata Power
Reco
Buy
Buy
Buy
Sell
Neutral
Sell
Buy
Neutral
Sell
Neutral
Buy
Buy
Neutral
Neutral
Buy
Buy
Buy
Neutral
726
419
792
183
525
433
1,036
127
323
183
430
1,329
763
349
735
162
604
441
1,023
114
382
233
454
1,264
5
-17
-7
-11
15
2
-1
-10
18
27
6
-5
55.9
21.7
17.5
8.9
53.5
43.7
43.3
12.2
28.6
15.3
22.2
106.6
53.7
28.9
40.0
11.0
44.9
39.4
43.8
11.4
33.1
20.0
26.5
121.7
58.4
32.5
49.0
13.2
45.8
41.0
49.4
12.8
37.8
22.9
36.2
127.8
Neutral
Neutral
1,029
492
1,110
485
8
-1
12.3
9.4
21.7
10.4
29.1
11.8
Buy
Buy
Neutral
Buy
Neutral
Buy
Neutral
Neutral
Neutral
Buy
Buy
Neutral
Buy
Neutral
Buy
513
828
239
932
128
733
496
561
471
582
1,543
2,320
413
498
883
620
1,000
235
1,200
150
800
475
550
470
700
1,780
2,400
550
500
1,020
21
21
-2
29
17
9
-4
-2
0
20
15
3
33
0
15
30.6
57.2
13.7
62.9
11.9
55.5
24.9
42.7
36.2
37.7
59.3
133.4
32.5
33.8
54.9
37.8
64.3
15.4
64.7
13.4
59.4
30.5
43.0
46.8
43.9
72.1
139.7
35.7
34.6
67.6
44.1
70.3
16.7
71.1
15.2
64.6
36.5
44.9
52.9
51.4
89.0
149.6
40.2
38.2
78.4
Buy
Buy
Buy
Buy
345
366
82
641
410
435
120
811
19
19
47
27
11.0
15.5
-3.0
26.0
5.1
16.7
-15.4
19.5
9.4
19.9
-16.9
39.4
Buy
Buy
Buy
Buy
Buy
Sell
279
942
64
160
209
83
335
970
88
199
243
69
20
3
37
24
16
-17
16.7
50.4
3.9
11.9
15.3
5.8
20.1
74.7
2.1
14.3
17.7
6.7
22.1
82.2
1.8
17.3
20.7
7.0
8 May 2017
33

Click excel icon
for detailed
valuation guide
CMP
(INR)
TP
% Upside
EPS (INR)
(INR) Downside FY17E FY18E FY19E
Valuation snapshot
P/E (x)
P/B (x)
ROE (%)
FY17E FY18E FY17E FY18E FY17E FY18E FY19E
15.0
12.6
2.4
2.2
15.8
17.3
18.2
30.2
52.6
31.9
32.9
24.7
49.0
39.5
26.7
28.6
14.7
49.6
83.3
18.3
28.7
24.0
15.7
45.8
45.1
35.3
25.2
27.9
33.6
21.3
40.4
52.6
60.8
55.2
54.8
18.7
40.3
29.3
29.5
21.5
23.3
23.7
22.0
17.3
11.5
46.7
34.6
13.4
26.7
19.7
13.2
29.6
36.7
28.8
19.5
24.3
19.7
17.5
30.2
40.4
47.2
44.7
32.1
2.8
5.7
33.6
8.6
4.3
4.2
5.5
8.2
19.6
4.2
5.3
4.8
1.6
4.4
4.0
4.2
3.3
4.2
10.7
6.4
7.6
3.3
3.3
5.4
28.6
9.6
14.6
5.0
2.5
5.1
30.2
7.1
3.9
3.2
4.4
6.5
16.6
3.0
4.9
4.3
1.5
3.9
3.8
3.4
3.1
4.0
10.0
5.4
6.1
2.9
2.9
4.8
24.4
8.7
11.7
4.5
10.4
11.3
110.9
28.9
18.2
9.0
15.1
34.7
72.2
33.8
11.1
5.9
8.6
16.5
17.3
29.9
8.6
9.9
30.4
26.0
30.9
10.0
16.5
13.9
56.8
16.5
29.4
9.5
14.0
13.4
108.6
26.5
18.9
15.7
20.7
33.0
104.1
30.8
10.9
12.5
11.7
15.5
19.8
28.7
9.6
11.1
35.9
30.0
27.9
15.7
17.4
16.8
65.0
19.4
29.1
14.8
16.3
15.0
100.4
28.6
21.7
17.0
24.3
32.4
106.3
27.3
11.9
16.2
14.8
16.2
22.9
27.7
16.3
14.6
39.6
30.9
27.8
18.2
19.1
19.1
66.3
22.2
27.6
17.5
Company
Reco
Aggregate
Others
Arvind
Buy
Bata India
Under Review
Castrol India
Buy
Century Ply.
Buy
Coromandel Intl Under Review
Delta Corp
Buy
Dynamatic Tech Buy
Eveready Inds. Buy
Interglobe
Neutral
Indo Count
Buy
Info Edge
Buy
Inox Leisure
Sell
Jain Irrigation Under Review
Just Dial
Under Review
Kaveri Seed
Buy
Kitex Garm.
Buy
Manpasand
Buy
MCX
Buy
Monsanto
Buy
Navneet
Buy
Education
PI Inds.
Buy
Piramal Enterp. Buy
SRF
Buy
S H Kelkar
Buy
Symphony
Sell
TTK Prestige
Neutral
V-Guard
Neutral
Wonderla
Buy
408
572
436
254
394
160
2,674
305
1,116
201
837
278
102
493
563
407
684
1,120
2,575
168
846
2,505
1,752
311
1,420
6,500
204
383
430
-
532
274
-
229
3,334
287
1,092
232
1,000
240
-
-
649
551
843
1,325
2,841
210
1,046
2,200
1,825
371
1,288
5,281
140
393
5
22
8
44
25
-6
-2
15
19
-14
15
35
23
18
10
25
24
-12
4
19
-9
-19
-32
3
13.5
10.9
13.6
7.7
16.0
3.3
67.6
11.4
39.0
13.7
16.9
3.3
5.5
17.2
23.4
26.0
14.9
24.8
72.9
6.6
30.4
74.5
82.4
7.7
27.0
106.9
3.7
7.0
21.8
14.2
14.9
8.6
18.3
6.9
112.9
13.9
64.7
17.5
17.9
8.0
7.6
18.5
28.6
31.0
23.1
30.5
89.3
8.6
34.8
127.1
99.9
10.3
35.1
137.7
4.6
11.9
28.6
17.7
15.2
11.4
23.6
7.6
166.7
16.9
78.0
21.1
21.0
12.0
10.0
22.1
36.1
36.7
38.3
42.9
109.3
10.5
43.6
164.7
125.1
13.3
42.9
176.0
5.4
16.0
8 May 2017
34

MOSL Universe stock performance
Company
Automobiles
Amara Raja
Ashok Ley.
Bajaj Auto
Bharat Forge
Bosch
CEAT
Eicher Mot.
Endurance Tech.
Escorts
Exide Ind
Hero Moto
M&M
Mahindra CIE
Maruti Suzuki
Tata Motors
TVS Motor
Banks - Private
Axis Bank
DCB Bank
Equitas Hold.
Federal Bank
HDFC Bank
ICICI Bank
IDFC Bank
IndusInd
J&K Bank
Kotak Mah. Bk
RBL Bank
South Indian
Yes Bank
Banks - PSU
BOB
BOI
Canara
IDBI Bk
Indian Bk
OBC
PNB
SBI
Union Bk
NBFCs
Bajaj Fin.
Bharat Fin.
Dewan Hsg.
GRUH Fin.
HDFC
Indiabulls Hsg
LIC Hsg Fin
Manappuram
M&M Fin.
Muthoot Fin
PFC
Repco Home
REC
STF
Shriram City Union
1 Day (%)
-1.0
-0.4
-1.5
-1.9
0.3
2.4
0.3
-1.5
4.2
2.1
-0.9
-1.1
-3.8
0.2
-3.8
-0.9
-2.7
-1.1
-2.1
3.6
-0.1
0.2
-1.5
-1.1
-0.7
0.3
-1.9
-1.7
-1.2
-4.3
-4.4
1.4
-3.6
-3.0
-3.9
-2.7
-1.0
-1.7
-1.7
1.4
-1.3
1.3
-1.1
2.6
0.6
-2.3
-0.6
-2.3
-1.4
-1.0
0.4
-1.8
-0.2
1M (%)
-2.5
-2.1
4.7
2.3
1.6
24.2
0.6
2.1
10.1
5.6
5.2
2.4
10.0
4.9
-11.4
9.4
-0.3
11.5
-6.0
28.0
6.9
4.8
7.1
0.5
5.7
2.2
4.9
18.1
2.7
7.5
28.5
27.0
1.4
19.0
20.2
15.5
-0.3
18.4
8.6
-0.9
12.2
6.9
3.8
11.9
15.5
-7.3
2.2
-1.2
5.1
3.3
15.5
-9.7
-6.4
12M (%)
-6.2
-19.2
17.8
40.5
21.5
57.8
31.2
259.5
70.1
16.2
0.0
27.9
73.1
7.3
66.9
9.4
115.0
10.1
137.6
35.2
39.0
39.0
35.7
29.9
27.9
58.0
76.3
25.9
113.9
114.1
17.9
265.6
107.1
114.0
64.0
60.1
78.0
31.2
115.0
66.8
32.9
64.9
60.2
128.1
8.3
106.1
92.3
20.0
153.3
-2.8
29.6
Company
Capital Goods
ABB
Bharat Elec.
BHEL
Blue Star
CG Cons. Elec.
CG Power & Inds Sol.
Cummins
GE T&D
Havells
Inox Wind
K E C Intl
L&T
Pennar Eng.
Siemens
Solar Ind
Suzlon Energy
Thermax
Va Tech Wab.
Voltas
Cement
Ambuja Cem.
ACC
Birla Corp.
Dalmia Bharat
Grasim Inds.
India Cem
J K Cements
JK Lakshmi Ce
Ramco Cem
Orient Cem
Prism Cem
Shree Cem
Ultratech
Consumer
Asian Paints
Britannia
Colgate
Dabur
Emami
Godrej Cons.
GSK Cons.
HUL
ITC
Jyothy Lab
Marico
Nestle
Page Inds
Parag Milk
Pidilite Ind.
P&G Hygiene
United Brew
United Spirits
Healthcare
Alembic Phar
Alkem Lab
Ajanta Pharma
Aurobindo
1 Day (%)
-0.7
-1.2
-1.0
0.0
1.5
0.3
-2.7
-1.5
-0.5
-1.1
-2.1
-0.4
0.0
-1.1
-0.6
-1.7
-2.6
0.2
-1.7
0.9
1.9
0.7
1.3
-0.9
-2.8
1.0
-0.6
0.2
-3.4
-1.4
-0.9
0.1
1.4
-1.7
-3.0
-1.5
-2.2
-2.4
0.8
-0.2
-1.4
-1.0
-1.5
-0.1
-1.5
1.1
-0.1
0.0
-1.2
-1.5
-1.1
-1.6
-0.2
-0.4
1M (%)
6.7
11.2
0.8
-2.2
3.2
-3.1
6.5
-0.1
3.5
7.8
-3.6
1.7
4.6
3.6
-4.3
5.2
2.2
-2.9
0.6
3.2
12.9
3.0
9.9
11.5
27.3
6.8
6.4
1.2
10.5
12.5
11.2
6.2
6.1
4.5
1.2
-3.8
4.5
3.8
-0.3
2.0
-0.7
10.5
2.4
1.5
-2.7
-1.0
2.9
-0.2
2.0
-6.5
-5.1
-12.5
-5.0
-13.0
12M (%)
14.1
56.5
40.5
64.3
31.3
21.4
-4.7
44.4
-32.2
66.0
35.4
-1.3
18.0
16.7
38.8
35.9
16.7
44.3
13.9
18.6
104.4
178.2
44.7
131.7
72.2
43.9
41.6
8.3
40.4
56.4
38.6
32.0
24.9
19.7
-3.5
10.9
33.2
-11.4
12.1
31.6
24.1
23.7
21.5
13.1
24.5
15.1
2.6
-27.0
-1.2
55.8
7.8
-26.8
8 May 2017
35

MOSL Universe stock performance
Company
Biocon
Cadila
Cipla
Divis Lab
Dr Reddy’s
Fortis Health
Glenmark
Granules
GSK Pharma
IPCA Labs
Lupin
Sanofi India
Sun Pharma
Syngene Intl
Torrent Pharma
Logistics
Allcargo Logistics
Blue Dart
Concor
Gateway Distriparks
Gati
Transport Corp.
Media
Dish TV
D B Corp
Den Net.
Hind. Media
HT Media
Jagran Prak.
PVR
Siti Net.
Sun TV
Zee Ent.
Metals
Hindalco
Hind. Zinc
JSPL
JSW Steel
Nalco
NMDC
SAIL
Vedanta
Tata Steel
Oil & Gas
BPCL
GAIL
Gujarat Gas
Gujarat St. Pet.
HPCL
IOC
IGL
MRPL
Oil India
ONGC
PLNG
Reliance Ind.
Retail
Jubilant Food
1 Day (%)
-1.6
2.1
-0.2
-0.1
-0.2
-2.9
-1.9
-1.4
-0.6
-1.5
-1.0
-1.2
-0.2
-3.2
-2.5
-0.5
-0.1
-0.1
-1.9
-1.4
-4.7
1.1
1.5
-2.4
-0.9
-0.7
0.1
-1.1
-3.2
-4.3
-2.8
-3.5
-3.9
-4.1
-2.2
-3.2
-2.8
-2.8
-3.9
-2.2
-0.7
-2.1
-1.4
0.2
-1.1
-0.7
-1.2
-2.5
-2.8
-2.8
-1.3
-2.2
-0.9
1M (%)
-7.6
3.9
-7.4
-1.0
-4.9
10.7
-3.5
-2.0
-10.7
-16.9
-13.9
-12.1
-8.7
-14.2
-12.4
0.9
-8.2
17.6
-1.5
-5.5
4.0
-6.9
-3.8
7.3
-0.9
-3.6
4.7
0.1
-14.2
7.0
-6.6
-6.3
-14.0
-13.0
-2.8
-13.6
-8.5
-8.5
-18.1
-12.2
13.8
9.5
2.2
14.0
0.5
13.6
2.2
15.7
-2.7
-1.5
5.2
-6.1
-6.0
12M (%)
67.5
44.4
1.4
-40.0
-11.2
23.7
3.8
11.2
-32.0
10.6
-22.1
-5.0
-22.2
27.8
-7.5
18.8
-12.5
10.3
-9.6
17.7
54.6
7.4
13.5
14.7
7.5
-4.5
16.5
82.3
-10.3
140.0
26.1
105.1
63.3
63.7
43.7
52.9
33.5
41.9
113.2
30.4
58.4
52.6
47.4
32.4
92.1
111.3
84.1
88.1
33.6
30.5
53.9
36.3
-11.1
Company
Titan Co.
Technology
Cyient
HCL Tech.
Hexaware
Infosys
KPIT Tech
L&T Infotech
Mindtree
Mphasis
NIIT Tech
Persistent Sys
Tata Elxsi
TCS
Tech Mah
Wipro
Zensar Tech
Telecom
Bharti Airtel
Bharti Infratel
Idea Cellular
Tata Comm
Utiltites
Coal India
CESC
JSW Energy
NTPC
Power Grid
Tata Power
Others
Arvind
Bata India
Castrol India
Century Ply.
Coromandel Intl
Delta Corp
Dynamatic Tech
Eveready Inds.
Interglobe
Indo Count
Info Edge
Inox Leisure
Jain Irrigation
Just Dial
Kaveri Seed
Kitex Garm.
Manpasand
MCX
Monsanto
Navneet Educat.
PI Inds.
Piramal Enterp.
SRF
S H Kelkar
Symphony
TTK Prestige
V-Guard
Wonderla
1 Day (%)
0.0
-2.6
0.8
0.3
-0.5
-1.6
3.4
2.2
0.4
-1.5
-0.8
-0.5
-0.3
-1.3
-0.1
-0.4
-0.4
1.1
-1.9
-9.1
-0.3
-1.0
2.1
-1.4
-0.7
0.4
-2.4
-2.1
0.5
-0.7
-1.0
-1.3
-0.3
1.1
0.8
-2.6
-0.8
-2.8
-5.4
-2.5
1.7
0.4
-0.7
-2.9
0.3
-0.4
-1.7
-2.1
-0.1
-2.8
-2.7
-0.9
0.7
0.3
1M (%)
0.1
5.2
-3.0
11.1
-6.4
-1.9
2.4
9.0
-1.4
8.9
0.2
2.4
-3.5
-7.5
-2.4
-4.6
0.0
8.3
-6.8
-11.8
-3.8
11.0
-3.6
-3.8
7.3
-5.6
0.2
1.1
1.7
-1.8
25.3
-21.2
-6.0
10.1
6.9
1.0
0.0
-5.5
-0.7
-11.2
1.6
-6.9
-4.6
-5.5
2.7
0.0
1.7
27.8
5.9
4.5
-6.6
7.2
15.6
-2.5
12M (%)
36.8
10.3
12.8
5.1
-21.9
-19.0
-25.3
16.2
2.0
-20.4
-16.1
-6.2
-12.7
-8.2
-9.0
-3.0
-1.0
-28.1
50.5
-1.0
79.5
-3.5
14.9
45.9
18.3
48.6
-0.1
6.4
33.6
76.2
104.2
30.5
27.6
2.8
2.4
14.6
40.4
62.2
-38.8
41.8
-10.0
28.1
22.2
44.4
91.4
38.9
109.7
26.8
38.6
18.3
46.6
141.1
-1.6
8 May 2017
36

THEMATIC/STRATEGY RESEARCH GALLERY

REPORT GALLERY
RECENT INITIATING COVERAGE REPORTS
Rs

DIFFERENTIATED PRODUCT GALLERY

Disclosures
This document has been prepared by Motilal Oswal Securities Limited (hereinafter referred to as Most) to provide information about the company (ies) and/sector(s), if any, covered in the report and may be distributed by it and/or its
affiliated company(ies). This report is for personal information of the selected recipient/s and does not construe to be any investment, legal or taxation advice to you. This research report does not constitute an offer, invitation or
inducement to invest in securities or other investments and Motilal Oswal Securities Limited (hereinafter referred as MOSt) is not soliciting any action based upon it. This report is not for public distribution and has been furnished to
you solely for your general information and should not be reproduced or redistributed to any other person in any form. This report does not constitute a personal recommendation or take into account the particular investment
objectives, financial situations, or needs of individual clients. Before acting on any advice or recommendation in this material, investors should consider whether it is suitable for their particular circumstances and, if necessary, seek
professional advice. The price and value of the investments referred to in this material and the income from them may go down as well as up, and investors may realize losses on any investments. Past performance is not a guide for
future performance, future returns are not guaranteed and a loss of original capital may occur.
MOSt and its affiliates are a full-service, integrated investment banking, investment management, brokerage and financing group. We and our affiliates have investment banking and other business relationships with a some
companies covered by our Research Department. Our research professionals may provide input into our investment banking and other business selection processes. Investors should assume that MOSt and/or its affiliates are
seeking or will seek investment banking or other business from the company or companies that are the subject of this material and that the research professionals who were involved in preparing this material may educate investors
on investments in such business . The research professionals responsible for the preparation of this document may interact with trading desk personnel, sales personnel and other parties for the purpose of gathering, applying and
interpreting information. Our research professionals are paid on twin parameters of performance & profitability of MOSt.
MOSt generally prohibits its analysts, persons reporting to analysts, and members of their households from maintaining a financial interest in the securities or derivatives of any companies that the analysts cover. Additionally, MOSt
generally prohibits its analysts and persons reporting to analysts from serving as an officer, director, or advisory board member of any companies that the analysts cover. Our salespeople, traders, and other professionals or affiliates
may provide oral or written market commentary or trading strategies to our clients that reflect opinions that are contrary to the opinions expressed herein, and our proprietary trading and investing businesses may make investment
decisions that are inconsistent with the recommendations expressed herein. In reviewing these materials, you should be aware that any or all of the foregoingamong other things, may give rise to real or potential conflicts of interest.
MOSt and its affiliated company(ies), their directors and employees and their relatives may; (a) from time to time, have a long or short position in, act as principal in, and buy or sell the securities or derivatives thereof of companies
mentioned herein. (b) be engaged in any other transaction involving such securities and earn brokerage or other compensation or act as a market maker in the financial instruments of the company(ies) discussed herein or act as an
advisor or lender/borrower to such company(ies) or may have any other potential conflict of interests with respect to any recommendation and other related information and opinions.; however the same shall have no bearing
whatsoever on the specific recommendations made by the analyst(s), as the recommendations made by the analyst(s) are completely independent of the views of the affiliates of MOSt even though there might exist an inherent
conflict of interest in some of the stocks mentioned in the research report Reports based on technical and derivative analysis center on studying charts company's price movement, outstanding positions and trading volume, as
opposed to focusing on a company's fundamentals and, as such, may not match with a report on a company's fundamental analysis. In addition MOST has different business segments / Divisions with independent research
separated by Chinese walls catering to different set of customers having various objectives, risk profiles, investment horizon, etc, and therefore may at times have different contrary views on stocks sectors and markets.
Unauthorized disclosure, use, dissemination or copying (either whole or partial) of this information, is prohibited. The person accessing this information specifically agrees to exempt MOSt or any of its affiliates or employees from,
any and all responsibility/liability arising from such misuse and agrees not to hold MOSt or any of its affiliates or employees responsible for any such misuse and further agrees to hold MOSt or any of its affiliates or employees free
and harmless from all losses, costs, damages, expenses that may be suffered by the person accessing this information due to any errors and delays. The information contained herein is based on publicly available data or other
sources believed to be reliable. Any statements contained in this report attributed to a third party represent MOSt’s interpretation of the data, information and/or opinions provided by that third party either publicly or through a
subscription service, and such use and interpretation have not been reviewed by the third party. This Report is not intended to be a complete statement or summary of the securities, markets or developments referred to in the
document. While we would endeavor to update the information herein on reasonable basis, MOSt and/or its affiliates are under no obligation to update the information. Also there may be regulatory, compliance, or other reasons that
may prevent MOSt and/or its affiliates from doing so. MOSt or any of its affiliates or employees shall not be in any way responsible and liable for any loss or damage that may arise to any person from any inadvertent error in the
information contained in this report. MOSt or any of its affiliates or employees do not provide, at any time, any express or implied warranty of any kind, regarding any matter pertaining to this report, including without limitation the
implied warranties of merchantability, fitness for a particular purpose, and non-infringement. The recipients of this report should rely on their own investigations.
This report is intended for distribution to institutional investors. Recipients who are not institutional investors should seek advice of their independent financial advisor prior to taking any investment decision based on this report or for
any necessary explanation of its contents.
Most and it’s associates may have managed or co-managed public offering of securities, may have received compensation for investment banking or merchant banking or brokerage services, may have received any compensation
for products or services other than investment banking or merchant banking or brokerage services from the subject company in the past 12 months.
Most and it’s associates have not received any compensation or other benefits from the subject company or third party in connection with the research report.
Subject Company may have been a client of Most or its associates during twelve months preceding the date of distribution of the research report
MOSt and/or its affiliates and/or employees may have interests/positions, financial or otherwise of over 1 % at the end of the month immediately preceding the date of publication of the research in the securities mentioned in this
report. To enhance transparency, MOSt has incorporated a Disclosure of Interest Statement in this document. This should, however, not be treated as endorsement of the views expressed in the report.
Motilal Oswal Securities Limited is registered as a Research Analyst under SEBI (Research Analyst) Regulations, 2014. SEBI Reg. No. INH000000412
Pending Regulatory inspections against Motilal Oswal Securities Limited:
SEBI pursuant to a complaint from client Shri C.R. Mohanraj alleging unauthorized trading, issued a letter dated 29th April 2014 to MOSL notifying appointment of an Adjudicating Officer as per SEBI regulations to hold inquiry and
adjudge violation of SEBI Regulations; MOSL replied to the Show Cause Notice whereby SEBI granted us an opportunity of Inspection of Documents. Since all the documents requested by us were not covered we have requested to
SEBI vide our letter dated June 23, 2015 to provide pending list of documents for inspection.
List of associate companies of Motilal Oswal Securities Limited -Click
here to access detailed report
Analyst Certification
The views expressed in this research report accurately reflect the personal views of the analyst(s) about the subject securities or issues, and no part of the compensation of the research analyst(s) was, is, or will be directly or
indirectly related to the specific recommendations and views expressed by research analyst(s) in this report. The research analysts, strategists, or research associates principally responsible for preparation of MOSt research receive
compensation based upon various factors, including quality of research, investor client feedback, stock picking, competitive factors and firm revenues
Disclosure of Interest Statement
Analyst ownership of the stock
Served as an officer, director or employee
Companies where there is interest
No
No
A graph of daily closing prices of securities is available at www.nseindia.com and http://economictimes.indiatimes.com/markets/stocks/stock-quotes
Regional Disclosures (outside India)
This report is not directed or intended for distribution to or use by any person or entity resident in a state, country or any jurisdiction, where such distribution, publication, availability or use would be contrary to law, regulation or which
would subject MOSt& its group companies to registration or licensing requirements within such jurisdictions.
For Hong Kong:
This report is distributed in Hong Kong by Motilal Oswal capital Markets (Hong Kong) Private Limited, a licensed corporation (CE AYY-301) licensed and regulated by the Hong Kong Securities and Futures
Commission (SFC) pursuant to the Securities and Futures Ordinance (Chapter 571 of the Laws of Hong Kong) “SFO”. As per SEBI (Research Analyst Regulations) 2014 Motilal Oswal Securities (SEBI Reg No. INH000000412) has
an agreement with Motilal Oswal capital Markets (Hong Kong) Private Limited for distribution of research report in Kong Kong. This report is intended for distribution only to “Professional Investors” as defined in Part I of Schedule 1 to
SFO. Any investment or investment activity to which this document relates is only available to professional investor and will be engaged only with professional investors.” Nothing here is an offer or solicitation of these securities,
products and services in any jurisdiction where their offer or sale is not qualified or exempt from registration. The Indian Analyst(s) who compile this report is/are not located in Hong Kong & are not conducting Research Analysis in
Hong Kong.
Motilal Oswal Securities Limited (MOSL) is not a registered broker - dealer under the U.S. Securities Exchange Act of 1934, as amended (the"1934 act") and under applicable state laws in the United States. In addition MOSL is not a
registered investment adviser under the U.S. Investment Advisers Act of 1940, as amended (the "Advisers Act" and together with the 1934 Act, the "Acts), and under applicable state laws in the United States. Accordingly, in the
absence of specific exemption under the Acts, any brokerage and investment services provided by MOSL, including the products and services described herein are not available to or intended for U.S. persons.
This report is intended for distribution only to "Major Institutional Investors" as defined by Rule 15a-6(b)(4) of the Exchange Act and interpretations thereof by SEC (henceforth referred to as "major institutional investors"). This
document must not be acted on or relied on by persons who are not major institutional investors. Any investment or investment activity to which this document relates is only available to major institutional investors and will be
engaged in only with major institutional investors. In reliance on the exemption from registration provided by Rule 15a-6 of the U.S. Securities Exchange Act of 1934, as amended (the "Exchange Act") and interpretations thereof by
the U.S. Securities and Exchange Commission ("SEC") in order to conduct business with Institutional Investors based in the U.S., MOSL has entered into a chaperoning agreement with a U.S. registered broker-dealer, Motilal Oswal
Securities International Private Limited. ("MOSIPL"). Any business interaction pursuant to this report will have to be executed within the provisions of this chaperoning agreement.
The Research Analysts contributing to the report may not be registered /qualified as research analyst with FINRA. Such research analyst may not be associated persons of the U.S. registered broker-dealer, MOSIPL, and therefore,
may not be subject to NASD rule 2711 and NYSE Rule 472 restrictions on communication with a subject company, public appearances and trading securities held by a research analyst account.
For Singapore
Motilal Oswal Capital Markets Singapore Pte Limited is acting as an exempt financial advisor under section 23(1)(f) of the Financial Advisers Act(FAA) read with regulation 17(1)(d) of the Financial Advisors Regulations and is a
subsidiary of Motilal Oswal Securities Limited in India. This research is distributed in Singapore by Motilal Oswal Capital Markets Singapore Pte Limited and it is only directed in Singapore to accredited investors, as defined in the
Financial Advisers Regulations and the Securities and Futures Act (Chapter 289), as amended from time to time.
In respect of any matter arising from or in connection with the research you could contact the following representatives of Motilal Oswal Capital Markets Singapore Pte Limited:
Varun Kumar
Varun.kumar@motilaloswal.com
Contact : (+65) 68189232
Office Address:21 (Suite 31),16 CollyerQuay,Singapore 04931
For U.S
13 December 2016
Motilal Oswal Tower, Level 9, Sayani Road, Prabhadevi, Mumbai 400 025
Phone: +91 22 3982 5500 E-mail: reports@motilaloswal.com
Motilal Oswal Securities Ltd
20