8 May 2017
4QFY17 Results Update | Sector: Financials
Canara Bank
Neutral
BSE SENSEX
27,035
Bloomberg
Equity Shares (m)
M.Cap.(INRb)/(USDb)
52-Week Range (INR)
1, 6, 12 Rel. Per (%)
Avg Val, INRm
Free float (%)
S&P CNX
8,349
CBK IN
543.0
215.0/3.2
415 / 171
29/29/97
1092
33.7
CMP: INR396
n
TP: INR380 (-4%)
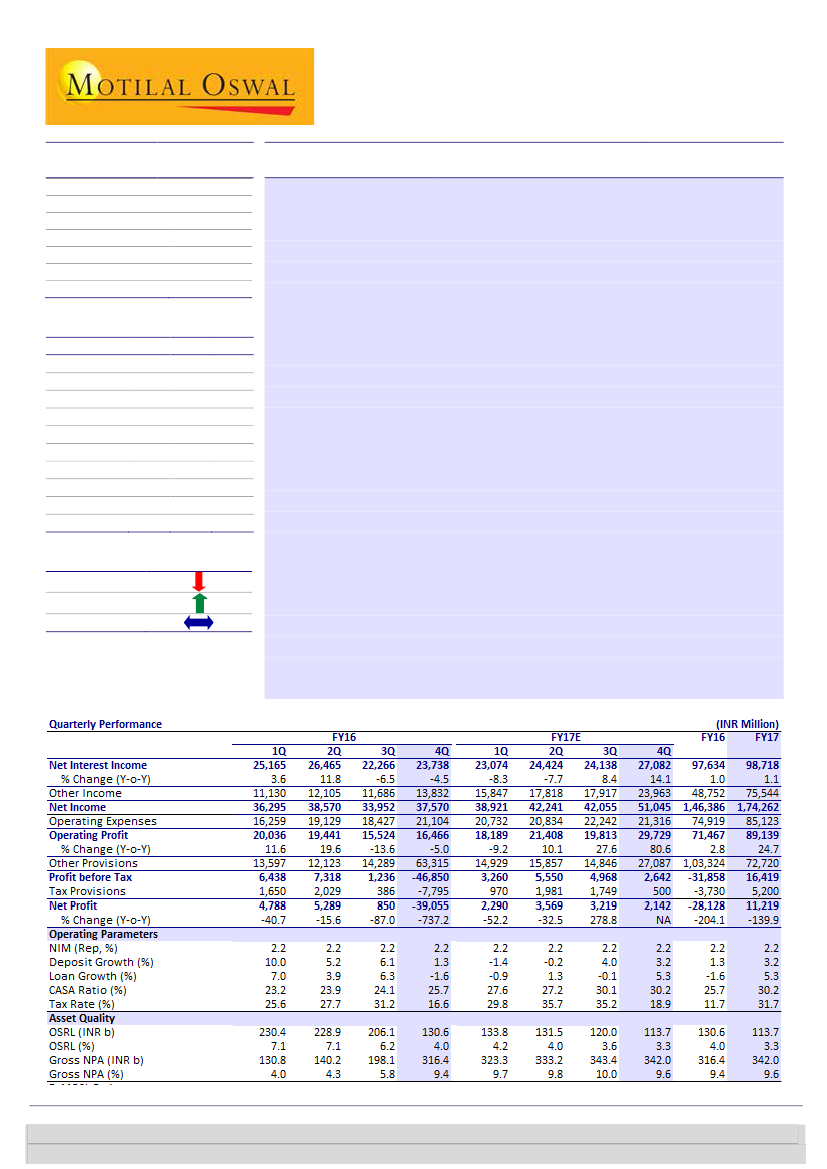
Gross slippages jump QoQ; elevated provisions led to PAT miss
Canara Bank’s (CBK) earnings (INR2.1b; -105% YoY) missed our estimate by
~53% due to elevated provisions of INR27.1b (27% miss). Loan growth for FY17
stood at 5% YoY, with infra loans (15% of advances) declining 8% YoY, but retail
loans growing 7% YoY.
Reported NIM expanded 8bp QoQ to 2.27% (domestic NIM at 2.39%, global
NIM at 2.23%). However, 3QFY17 NII had interest reversal of INR2b for
SDR/S4A accounts, adjusting for which calculated NIM expanded 3bp QoQ.
4QFY17 NII also had an interest on IT refund component of INR1.25b.
Gross slippages of INR31b (+25% QoQ) had INR9b contribution from the
standard restructured book. Absolute GNPA was flat QoQ at INR342b, while
GNPA/NNPA stood at 9.63%/6.33% (-34bp/-39bp QoQ). Write-offs were high
during the quarter at INR24.7b. Total stressed book stood at 12% of loans.
Other highlights:
(a) Non-interest income grew 34% QoQ, aided by a gain of
INR7.04b on Canfin Homes stake sale and INR850m of PSLC sales income. (b) As
of 4QFY17, the bank held additional provisions of INR5b for NPAs over and
above RBI norms. c) Tier 1 ratio/CAR stood at 8.92%/12.86%. During the
quarter, the bank raised INR11.24B via rights issue.
Valuation and view:
Net stress addition has been coming down over past two
quarters, which is a positive, and management expects this trend to continue.
However, given the weak operating environment, we would wait and watch
developments in asset quality. Contribution of trading profits to PPoP was high
at 47%, and with an expected decline in trading gains, we expect overall PPoP
growth to be muted at -4.5% for FY18. Our SOTP-based target price is INR380
(0.6x FY19 BV+INR73 for other investments). Maintain
Neutral.
n
Financials & Valuations (INR b)
Y/E March
2017 2018E 2019E
NII
98.7 107.5 122.9
OP
89.1
85.1
97.4
NP
11.2
19.7
29.2
EPS (INR)
18.8
33.0
48.9
EPS Gr. (%)
NM
75.5
48.4
BV/Sh. (INR)
468
497
540
RoE (%)
4.2
6.8
9.4
RoA (%)
0.2
0.3
0.4
P/E (x)
21.1
12.0
8.1
P/BV (x)
0.8
0.8
0.7
n
n
n
Estimate change
TP change
Rating change
Investors are advised to refer through important disclosures made at the last page of the Research Report.
Motilal Oswal research is available on www.motilaloswal.com/Institutional-Equities, Bloomberg, Thomson Reuters, Factset and S&P Capital.
Alpesh Mehta
(Alpesh.Mehta@MotilalOswal.com); +91 22 6129 1526
Subham Banka
(Subham.Banka@MotilalOswal.com); +91 022 6129 1567

Canara Bank
Exhibit 1: Quarterly performance vs expectation (INR B)
Y/E March
Net Interest Income
% Change (YoY)
Other Income
Net Income
Operating Expenses
Operating Profit
% Change (YoY)
Other Provisions
Profit before Tax
Tax Provisions
Net Profit
% Change (YoY)
4QFY17A
27,082
14
23,963
51,045
21,316
29,729
81
27,087
2,642
500
2,142
NA
4QFY17E
26,676
12
26,046
52,722
24,505
28,217
71
21,295
6,922
2,338
4,584
NA
Var. (%)
2
-8
-3
-13
5
27
-62
-79
-53
Elevated stress additions led to higher provisioning
Opex beat estimates due to employee expenses declining 10%
QoQ
Comments
NII in line, includes INR1.25b in interest on IT refund
Core income largely inline; Lower than expected trading gains
drags profitability
Source: MOSL, Company
Asset quality deteriorates further; total stressed loans at 12% of advances
Asset quality issues persist
with total stressed book at
12%
GNPA/NNPA at 9.63%/6.33% declined 34bps/39bps QoQ. SDR/S4A/5:25/OSRL
stood at 2%/1.2%/1.8%/3.3%. PCR stood at 55.62% (+310bps QoQ). Total
stressed loans stood at 12% of advances compared to 11.2% in 3QFY17
Gross slippages of INR31bn (+39%/-79% QoQ/YoY, INR 8.99b from restructured
book) were mostly from the steel sector. Net slippages of INR23.3b stood at
2.9% (annualized) of advances. The management expects FY18 slippages to be
within 1.5%.
Loan book growth sluggish, yet moving in the right direction
Loan book mix turning
favourable gradually with
move to retail loans and
slowdown in loans to
problematic sectors
Total loan book growth was muted at 3%/5% QOQ/YoY owing to slowdown in
infrastructure book (-1%/-8% QOQ/YoY) even as retail loan book grew 7%/9%
QoQ/YoY
Infrastructure loan de-growth of 8% YoY was led by 15%/30% de-growth in
power and airports.
Total retail loan book grew 7%/9% QoQ/YoY led by housing/vehicle loan growth
of 19%/19% YoY.
CASA and retail term deposits together constitute 71% of total deposits, leading
to comfort on cost of funds.
CASA deposits growth was strong at 21% YoY (-3% QoQ). SA deposits grew -
4%/23% QoQ/YoY. Reported CASA ratio improved 73bps to 32.9% vs 32.1% a
quarter ago.
Other highlights
Other income had a significant contribution from trading profits (47% mainly
due to gains on stake sale in Canfin Homes)
Total branch count stood at 6075 at the end of 4QFY17 (+111 branches QoQ)
8 May 2017
2

Canara Bank
4QFY17 conference call highlights
Balance Sheet Related
The bank wants to increase the share of retail, SME and agricultural loans going
forward
The bank has stopped taking bulk deposits leading to improvement in share of
retail deposits
Aim to improve CASA ratio by ~200bp YoY to 35% by Mar 2018
35-40% of loans are priced at MCLR
P/L Related
Sold more than INR110b PSLCs which added INR2.25b to fee income in FY17
(INR850m in 4QFY17).
The management expects NIM to improve slightly in FY18.
The bank expects ~ 50% CI ratio in FY18
Asset Quality
INR31b slippages, INR7.71b upgrades and recoveries and INR24.56b write-offs in
4QFY17. Slippages happened primarily in the steel sector. Divergence was
INR5.07b as of FY16, all of which has been recognized now.
FY18 slippages expected to be capped at 1.5% of advances.
The bank will attempt resolution in key big NPL accounts in FY18.
4QFY17 SMA2 loans stood at INR80.34b (INR180b in 3QFY17 and INR88b in
4QFY16).
INR8.99b worth of loans slipped from the restructured book
The bank has INR70b/40b under SDR/S4A respectively. All SDR accounts are
standard.
There was no sale to ARCs in the quarter.
Credit costs in FY18 should be lower than that in FY17, according to
management.
Power sector exposure details: INR150b power generation exposure is in private
sector, GoI: INR30b and PSU INR60b. The bank has 7.8% GNPA in power sector.
71% of their steel exposure is classified as NPLs (INR158b is total exposure of
which INR108b is NPL)
INR24b international loan book NPL
Outstanding 5/25 accounts is INR63b
Valuation and view
Maintain Neutral rating
with target price of INR380
Over last six years, CBK’s profitability has declined significantly led by
compression in core revenues and higher provisioning costs. However, over the
last 2-3 quarters the bank has displayed better/stable trend in net stress
addition. Improvement in economic environment remains the key.
4QFY17 PPOP had a high contribution (47%) from trading gains which are
unlikely to persist, indicating sustained pressure on PPOP growth.
Sensitivity of earnings to risk-adjusted NIMs has increased significantly. With
every (1) 10bp NIM expansion, earnings could see an upgrade of ~20%, and (2)
10bp decline in credit cost, earnings could see an upside of ~15%.
8 May 2017
3

Canara Bank
RBI has allowed various tools apart from normal restructuring (5:25, SDR, S4A,
sale to ARC-leading to security receipts etc.) to tackle the stress loans. Hence,
actual overall stress loans have been significantly higher than reported NNPAs.
Difference between reported BV and ABV (NNPA at 70%) is high at ~50%.Until
the improvement in economic growth and resolution of key sectors problems
(Infra and Iron and Steel) comes through markets would focus on adjusted P/BV.
We maintain Neutral with an SOTP based TP of INR380:
We have cut PAT
estimates by ~6-7% for FY19. Despite attractive valuations, given challenging
operating environment, we would wait and watch developments on asset
quality. Our key assumptions are a) Risk free rate of 7% b) Risk premium of 5%
c) Beta of 1.6x d) average growth of ~15% over FY16-36E and e) terminal growth
rate of 5%. In view of resolutions in key accounts providing marginally improved
outlook, we have increased the target multiple slightly from 0.5x Fy19 BV to
0.6x. Subsidaries add INR 73 (19%) to our SOTP.
Exhibit 2: Our SOTP is INR380
Stake
Banking Business (A)
Total Value of Key ventures
Canfin Homes
Canara HSBC
Canara Robecco
CARE
Less: Holdco discount
Value of Key Ventures (B)
SOTP (A+B)
CMP
Upside
Total Value Value per share
307
91
76,510
43
40,000
38
3
45,650
7
18
73
380
396
-4
% of Total
81
24
11
10
1
2
5
19
100
Rationale
0.6x March 2019 BV; Based on RI
Latest MCAP
Based on peer valuation
Valued at 4% of AUM
Latest MCAP
31
51
51
9
Source: MOSL, Company
Exhibit 3: Largely maintain estimates for FY18/19
INR b
Net Interest Income
Other Income
Total Income
Operating Expenses
Operating Profits
Provisions
PBT
Tax
PAT
Loans
Deposits
Margins (%)
Credit Cost (%)
RoA (%)
RoE (%)
FY17
98.3
77.6
175.9
88.3
87.6
66.9
20.7
7.0
13.7
3,410
5,158
1.88
1.95
0.24
5.2
Old Est
FY18
107.2
80.4
187.5
95.4
92.1
62.6
29.5
10.0
19.5
3,819
5,880
1.86
1.65
0.31
7.0
FY19
122.7
90.8
213.5
103.0
110.5
63.2
47.4
16.1
31.3
4,391
6,821
1.87
1.45
0.43
10.5
FY17
98.7
75.5
174.3
85.1
89.1
72.7
16.4
5.2
11.2
3,420
4,953
1.91
2.23
0.20
4.2
Revised Est
FY18
107.5
71.4
178.9
93.8
85.1
56.6
28.5
8.8
19.7
3,762
5,547
1.92
1.50
0.32
6.8
FY19
122.9
77.8
200.8
103.4
97.3
55.0
42.3
13.1
29.2
4,214
6,324
1.96
1.30
0.42
9.4
FY17
0.4
-2.7
-1.0
-3.6
1.7
8.7
-20.7
-26.1
-17.9
0.3
-4.0
Change (%)
FY18
0.3
-11.2
-4.6
-1.7
-7.6
-9.6
-3.4
-12.0
1.0
-1.5
-5.7
FY19
0.2
-14.3
-6.0
0.4
-11.9
-12.9
-10.6
-18.5
-6.5
-4.1
-7.3
Source: MOSL, Company
8 May 2017
4

Canara Bank
Exhibit 4: One year forward P/BV
1.7
1.2
0.8
0.7
0.2
0.8
0.3
0.7
PB (x)
Median(x)
Peak(x)
Min(x)
Avg(x)
1.6
Exhibit 5: One year forward P/E
21
17
13
9
5
1
6.3
6.1
Negative
Earnings
Cycle
PE (x)
Median(x)
Peak(x)
Min(x)
Avg(x)
18.8
9.4
2.2
Source: MOSL, Company
Exhibit 6: Expect return ratios to improve gradually (%)
Y/E MARCH
Net Interest Income
Fee income
Fee to core Income (%)
Core Income
Operating Expenses
Cost to Core Income
Employee cost
Other operating expenses
Core operating Profits
Trading and others
Operating Profits
Provisions
NPA provisions
Other Provisions
PBT
Tax
Tax Rate
RoA
Leverage (x)
RoE
FY12
2.17
0.51
19.0
2.67
1.32
49.2
0.84
0.48
1.36
0.32
1.67
0.52
0.36
0.16
1.15
0.23
19.6
0.92
18.5
17.1
FY13
2.00
0.44
17.8
2.44
1.31
53.6
0.83
0.48
1.13
0.37
1.50
0.56
0.47
0.09
0.93
0.20
21.8
0.73
18.2
13.3
FY14
1.98
0.48
19.6
2.46
1.34
54.7
0.81
0.53
1.11
0.39
1.50
0.83
0.47
0.35
0.68
0.14
20.4
0.54
19.4
10.5
FY15
1.86
0.43
18.8
2.29
1.40
61.0
0.82
0.57
0.89
0.44
1.34
0.66
0.73
-0.06
0.67
0.15
22.7
0.52
20.7
10.8
FY16
1.77
0.47
21.1
2.25
1.36
60.6
0.81
0.55
0.89
0.41
1.30
1.88
1.75
0.13
-0.58
-0.07
11.7
-0.51
21.1
-10.8
FY17
1.74
0.55
24.0
2.28
1.50
65.6
0.86
0.63
0.79
0.78
1.57
1.28
1.31
-0.03
0.29
0.09
31.7
0.20
21.1
4.2
FY18E
1.74
0.59
25.3
2.34
1.52
65.2
0.85
0.67
0.81
0.57
1.38
0.92
0.87
0.04
0.46
0.14
31.0
0.32
21.4
6.8
FY19E
1.78
0.61
25.4
2.38
1.50
62.8
0.81
0.69
0.89
0.52
1.41
0.80
0.75
0.05
0.61
0.19
31.0
0.42
22.3
9.4
FY20E
1.80
0.61
25.4
2.41
1.45
60.2
0.76
0.70
0.96
0.47
1.43
0.74
0.69
0.05
0.69
0.22
31.0
0.48
23.1
11.1
Source: MOSL, Company
8 May 2017
5

Canara Bank
Story in charts
Exhibit 7: Loan growth remained muted YoY (%)
Loans (INR b)
30 32
4
11
24 21
11
9 10 7
4
6
(2) (1) 1 (0)
5
8
YoY gr. (%)
13 14
Exhibit 8: CASA grew 21% YoY – benefit of demon in 3Q
CASA Ratio (calc,%)
16
20
11 9 11 10 12 12 12
9
CASA YoY gr. (%)
17
21
14
24 23 24 23 25 23 23 23 24 23 24 24 26 28 27 30 30
Source: Company, MOSL
Exhibit 9: Reported global NIMs (cumulative basis) increased
7bp QoQ
Exhibit 10: Credit costs spiked up this quarter (%)
Source: Company, MOSL
Exhibit 11: Absolute GNPA up stable QoQ;
Gross NPA (%)
Net NPA (%)
Exhibit 12: NSL decreased ~70bp QoQ to 9.6% (%)
NNPA (%)
OSRL (%)
Source: Company, MOSL
8 May 2017
6

Canara Bank
Exhibit 13: Quarterly snapshot
FY16
INR m
Profit and Loss
Net Interest Income
Other Income
Trading profits
Forex Income
Recoveries
Core Fees
Total Income
Operating Expenses
Employee
Others
Operating Profits
Provisions
NPA provisions
Provisions on Invst.
Others
PBT
Taxes
PAT
Asset Quality
GNPA
NNPA
GNPA (%)
NNPA (%)
PCR (Reported, %)
Slippages
Slippage Ratio (%)
Credit Cost (%)
Restructured loans*
Ratios (%)
Fees to Total Income
Cost to Core Income
Tax Rate
CASA (cal)
Loan/Deposit
CAR
Tier I
Margins - Cumulative (%)
Yield on loans
Yield On Investments
Cost of Deposits
Margins
Balance sheet (INR b)
Loans
Retail Loans
Deposits
CASA Deposits
Savings Deposits
Current Deposits
1Q
25,165
11,130
1,980
1,020
2,100
6,030
36,295
16,259
10,588
5,672
20,036
13,597
13,140
1,330
-873
6,438
1,650
4,788
1,30,806
88,881
4.0
2.7
59.0
25,190
3.3
1.6
2,30,370
16.6
52.1
25.6
23.2
68.7
10.8
8.3
10.2
8.0
7.1
2.2
3,241
420
4,719
1,097
921
175
2Q
26,465
12,105
2,950
1,650
1,610
5,895
38,570
19,129
11,078
8,050
19,441
12,123
9,790
640
1,693
7,318
2,029
5,289
1,40,213
93,825
4.3
2.9
59.8
22,010
2.8
1.2
2,28,910
15.3
59.1
27.7
23.9
66.6
11.0
8.6
10.2
8.0
7.1
2.2
3,231
445
4,852
1,160
967
193
3Q
22,266
11,686
1,610
2,090
1,410
6,576
33,952
18,427
10,398
8,030
15,524
14,289
14,320
1,550
-1,582
1,236
386
850
1,98,134
1,29,401
5.8
3.9
54.0
54,020
6.9
1.7
2,06,080
19.4
63.9
31.2
24.1
67.7
11.5
8.7
9.9
7.9
7.0
2.2
3,319
484
4,906
1,181
989
192
4Q
23,738
13,832
3,360
1,930
960
7,582
37,570
21,104
12,395
8,709
16,466
63,315
58,830
-850
5,335
-46,850
-7,795
-39,055
3,16,378
2,08,329
9.4
6.4
50.1
1,46,020
17.7
7.2
1,30,633
20.2
67.4
16.6
25.7
67.7
11.1
8.8
9.7
7.9
6.9
2.2
3,247
541
4,798
1,235
1,037
198
1Q
23,074
15,847
6,070
2,760
500
6,517
38,921
20,732
12,082
8,650
18,189
14,929
14,690
170
69
3,260
970
2,290
3,23,341
2,14,939
9.7
6.7
50.8
38,780
4.8
1.8
1,33,801
16.7
70.1
29.8
27.6
69.0
12.1
8.8
9.2
7.9
6.5
2.2
3,213
562
4,653
1,283
1,078
204
2Q
24,424
17,818
5,030
3,170
1,610
8,008
42,241
20,834
12,169
8,664
21,408
15,857
15,580
150
127
5,550
1,981
3,569
3,33,154
2,18,871
9.8
6.7
51.8
24,490
3.0
1.9
1,31,470
19.0
64.2
35.7
27.2
67.5
12.2
8.9
9.2
7.9
6.4
2.2
3,271
545
4,843
1,317
1,111
207
FY17
3Q
24,138
17,917
7,470
2,640
910
6,897
42,055
22,242
13,057
9,184
19,813
14,846
14,870
850
-874
4,968
1,749
3,219
3,43,387
2,22,958
10.0
6.7
52.5
22,250
2.7
1.8
1,20,001
16.4
71.7
35.2
30.1
65.0
12.3
9.0
9.1
7.8
6.3
2.2
3,316
550
5,103
1,537
1,321
216
4Q
27,082
23,963
11,250
1,140
1,870
9,703
51,045
21,316
11,842
9,473
29,729
27,087
29,240
450
-2,603
2,642
500
2,142
3,42,020
2,16,490
9.6
6.3
55.6
31,000
3.8
3.5
1,13,650
19.0
57.9
18.9
30.2
69.1
12.9
9.8
9.0
7.8
6.3
2.2
3,420
589
4,953
1,497
1,272
226
-10
-7
-6
4
3
7
-3
-3
-4
4
-72
-17
-69
4
5
9
3
21
23
14
Variation (%)
QoQ
YoY
12
34
51
-57
105
41
21
-4
-9
3
50
82
97
-47
NA
-47
NA
NA
0
-3
-34
-39
310
39
114
167
-5
14
73
235
-41
95
28
36
1
-4
9
81
-57
-50
-153
NA
NA
NA
NA
8
4
23
-9
551
-79
-1388
-370
-13
Source: MOSL, Company
8 May 2017
7

Canara Bank
Financials and Valuations
Income Statement
Y/E March
Net Interest Income
Change (%)
Non Interest Income
Net Income
Change (%)
Operating Expenses
Pre Provision Profits
Change (%)
Provisions (excl tax)
PBT
Tax
Tax Rate (%)
PAT
Change (%)
Pref. Dividend (Incl tax)
Profits for Equity SH
Change (%)
Equity Dividend (Incl tax)
Core PPP*
Change (%)
*Core PPP is (NII+Fee income-Opex)
Balance Sheet
Y/E March
Equity Share Capital
Reserves & Surplus
Net Worth
Deposits
Change (%)
of which CASA Dep
Change (%)
Borrowings
Other Liabilities & Prov.
Total Liabilities
Current Assets
Investments
Change (%)
Loans
Change (%)
Fixed Assets
Other Assets
Total Assets
Asset Quality
GNPA (INR M)
NNPA (INR M)
GNPA Ratio
NNPA Ratio
PCR (Excl Tech. write off)
PCR (Incl Tech. Write off)
E: MOSL Estimates
2012
76,893
-0.1
29,276
1,06,169
1.0
46,737
59,432
-2.4
18,605
40,827
8,000
19.6
32,827
-18.5
-
32,827
-18.5
5,673
48,166
-2.1
2013
78,790
2.5
31,530
1,10,320
3.9
51,420
58,900
-0.9
22,179
36,721
8,000
21.8
28,721
-12.5
-
28,721
-12.5
6,740
44,488
-7.6
2014
89,442
13.5
39,328
1,28,770
16.7
60,810
67,960
15.4
37,330
30,630
6,250
20.4
24,380
-15.1
-
24,380
-15.1
5,936
50,376
13.2
2015
96,637
8.0
45,503
1,42,139
10.4
72,636
69,504
2.3
34,527
34,976
7,950
22.7
27,026
10.9
-
27,026
10.9
6,517
46,392
-7.9
2016
97,634
1.0
48,752
1,46,386
3.0
74,919
71,467
2.8
1,03,324
-31,858
-3,730
11.7
-28,128
-204.1
-
-28,128
-204.1
0
48,797
5.2
2017
98,718
1.1
75,544
1,74,262
19.0
85,123
89,139
24.7
72,720
16,419
5,200
31.7
11,219
-139.9
-
11,219
-139.9
719
44,719
-8.4
2018E
1,07,541
8.9
71,385
1,78,927
2.7
93,802
85,125
-4.5
56,584
28,540
8,847
31.0
19,693
75.5
-
19,693
75.5
2,294
50,128
12.1
(INR Million)
2019E
2020E
1,22,944 1,41,440
14.3
15.0
77,843
85,120
2,00,787 2,26,560
12.2
12.8
1,03,434 1,14,155
97,353 1,12,405
14.4
15.5
54,997
57,812
42,355
54,593
13,130
16,924
31.0
31.0
29,225
37,670
48.4
28.9
-
-
29,225
37,670
48.4
28.9
3,405
4,388
61,356
75,408
22.4
22.9
2012
4,430
2,22,470
2,26,900
32,70,537
11.5
7,96,107
-4.2
1,55,254
88,911
37,41,602
2,81,794
10,20,574
22.0
23,24,898
10.0
28,575
85,760
37,41,602
2013
4,430
2,44,348
2,48,778
35,58,560
8.8
8,60,613
8.1
2,02,834
1,13,255
41,23,426
3,47,147
12,11,328
18.7
24,21,766
4.2
28,627
1,14,557
41,23,426
2014
4,613
2,91,589
2,96,201
42,07,228
18.2
10,32,794
20.0
2,72,306
1,43,483
49,19,219
4,48,287
12,68,283
4.7
30,10,675
24.3
66,416
1,25,558
49,19,219
2015
4,752
3,13,840
3,18,592
47,38,401
12.6
11,35,322
9.9
2,56,716
1,66,297
54,80,006
4,86,411
14,20,614
12.0
33,00,355
9.6
69,494
2,03,131
54,80,006
2016
5,430
3,10,602
3,16,032
47,97,916
1.3
12,35,422
8.8
2,68,733
1,46,927
55,29,608
5,67,337
14,23,093
0.2
32,47,148
-1.6
71,981
2,20,049
55,29,608
2017
5,973
3,30,883
3,36,855
49,52,760
3.2
14,97,490
21.2
3,95,036
1,50,551
58,35,202
5,88,255
15,02,659
5.6
34,20,088
5.3
71,683
2,52,510
58,35,194
2018E
5,973
3,48,669
3,54,642
55,47,091
12.0
17,22,114
15.0
4,21,729
1,65,536
64,88,998
6,49,099
17,28,058
15.0
37,62,096
10.0
71,983
2,77,761
64,88,998
(INR Million)
2019E
2020E
5,973
5,973
3,74,878 4,08,547
3,80,850 4,14,520
63,23,684 72,72,237
14.0
15.0
19,80,431 22,77,495
15.0
15.0
4,51,142 4,83,554
1,82,321 2,01,157
73,37,997 83,71,467
7,59,361 8,73,990
19,87,266 22,85,356
15.0
15.0
42,13,548 48,03,445
12.0
14.0
72,284
72,584
3,05,537 3,36,091
73,37,997 83,71,467
(%)
2,98,978
1,62,788
6.05
3.39
45.6
68.6
40,318
33,862
1.73
1.46
16.0
67.6
62,602
52,780
2.58
2.18
15.7
61.4
75,702
59,654
2.50
1.98
21.2
60.1
1,30,399
87,862
3.90
2.66
32.6
57.3
3,16,380
2,08,928
9.43
6.43
34.0
50.1
3,42,020
2,15,641
9.64
6.31
37.0
55.6
3,33,060
2,02,814
8.56
5.39
39.1
59.6
3,12,536
1,80,449
7.19
4.28
42.3
64.4
8 May 2017
8

Canara Bank
Financials and Valuations
Ratios
Y/E March
Spreads Analysis (%)
Avg. Yield-Earning Assets
Avg. Yield on loans
Avg. Yield on Investments
Avg. Cost-Int. Bear. Liab.
Avg. Cost of Deposits
Interest Spread
Net Interest Margin
Profitability Ratios (%)
RoE
RoA
Int. Expense/Int.Income
Fee Income/Net Income
Non Int. Inc./Net Income
Efficiency Ratios (%)
Cost/Income*
Empl. Cost/Op. Exps.
Busi. per Empl. (INR m)
NP per Empl. (INR lac)
* ex treasury
Asset-Liability Profile (%)
Loans/Deposit Ratio
CASA Ratio
Investment/Deposit Ratio
G-Sec/Investment Ratio
CAR
Tier 1
Valuation
Book Value (INR)
Change (%)
Price-BV (x)
Adjusted BV (INR)
Price-ABV (x)
EPS (INR)
Change (%)
Price-Earnings (x)
Dividend Per Share (INR)
Dividend Yield (%)
E: MOSL Estimates
2012
9.5
10.6
7.6
7.1
7.1
2.4
2.4
2013
9.4
10.3
8.2
7.3
7.4
2.1
2.2
2014
9.5
10.5
8.3
7.4
7.4
2.1
2.1
2015
9.2
10.2
7.9
7.2
7.2
2.0
2.0
2016
8.8
9.6
8.0
6.8
6.8
2.0
1.9
2017
8.0
8.9
7.3
6.1
6.1
2.0
1.9
2018E
7.8
8.7
6.8
5.8
5.8
2.0
1.9
2019E
7.6
8.4
6.8
5.5
5.5
2.0
2.0
2020E
7.6
8.5
6.8
5.6
5.5
2.1
2.0
17.1
0.9
75.1
15.4
27.6
13.3
0.73
76.9
16.3
28.6
10.5
0.54
77.4
13.3
30.5
10.8
0.52
77.9
15.3
32.0
-10.8
-0.51
77.8
15.3
33.3
4.2
0.20
76.1
15.0
43.4
6.8
0.3
75.3
17.4
39.9
9.4
0.4
74.2
18.1
38.8
11.1
0.5
74.1
18.5
37.6
45.4
63.6
125.9
7.8
49.7
63.3
135.6
6.7
49.8
60.4
136.1
5.0
55.6
58.8
141.3
5.0
54.9
59.3
144.7
-5.1
58.9
57.7
139.4
1.9
58.8
55.9
142.1
3.2
57.0
54.0
151.4
4.5
55.1
52.1
164.2
5.5
71.1
24.3
31.2
87.0
13.8
10.4
68.1
24.2
34.0
84.2
12.4
9.8
71.6
24.5
30.1
84.8
10.6
7.7
69.7
24.0
30.0
88.4
10.2
7.6
67.7
25.7
29.7
89.2
11.1
8.8
69.1
30.2
30.3
82.4
11.6
9.4
67.8
31.0
31.2
80.3
10.2
8.4
66.6
31.3
31.4
79.6
9.6
8.0
66.1
31.3
31.4
79.6
9.1
7.7
463.8
14.6
0.9
414.1
1.0
74.1
-18.5
5.3
11.0
2.8
513.4
10.7
0.8
436.0
0.9
64.8
-12.5
6.1
13.0
3.3
518.1
0.9
0.8
434.1
0.9
52.9
-18.5
7.5
11.0
2.8
552.5
6.6
0.7
432.4
0.9
56.9
7.6
7.0
10.5
2.7
477.2
-13.6
0.8
227.1
1.7
-51.8
-191.1
-7.6
0.0
0.0
468.0
-1.9
0.8
233.4
1.7
18.8
-136.3
21.1
1.0
0.3
497.2
6.2
0.8
276.4
1.4
33.0
75.5
12.0
3.3
0.8
540.4
8.7
0.7
344.0
1.2
48.9
48.4
8.1
4.9
1.2
596.1
10.3
0.7
419.0
0.9
63.1
28.9
6.3
6.3
1.6
8 May 2017
9

Canara Bank
Corporate profile
Set up in 1906, Canara Bank (CBK) it one of the oldest
banks in the India. The government nationalized the
bank in 1969. Over the years bank has made several
acquisitions, major one being Lakshmi Commercial
Bank which gave significant presence in northern
India. As of September 2016, the bank had a network
of 5,868 branches and 10,026 ATMs spread across
India. The bank also has several overseas branches
and subsidiaries / joint ventures (Can Fin Homes
Limited, Canara Robeco AMC, Canara HSBC Oriental
Life Insurance Company amongst others).
Company description
Exhibit 1: Sensex rebased
Source: MOSL/Bloomberg
Exhibit 2: Shareholding pattern (%)
Mar-17
Promoter
DII
FII
Others
66.3
21.2
5.3
7.2
Dec-16
66.3
20.5
5.9
7.3
Mar-16
66.3
18.6
7.1
8.0
Source: Capitaline
Exhibit 3: Top holders
Holder Name
LIC OF INDIA
HDFC TRUSTEE COMPANY LIMITED
RELIANCE CAPITAL TRUSTEE CO LTD
% Holding
13.6
4.6
1.5
Note: FII Includes depository receipts
Source: Capitaline
Exhibit 4: Top management
Name
Thothala Narayanasamy
Manoharan
Rakesh Sharma
Dina Bandhu Mohapatra
Harideesh Kumar B
Pradyuman Singh Rawat
B Nagesh Babu
Designation
Chairman (Non-Executive)
Managing Director & CEO
Executive Director
Executive Director
Executive Director
Company Secretary
Exhibit 5: Directors
Name
G V Manimaran
Sairam Mocherla
Rajinder Kumar Goel
Uma Shankar
Name
Sanjay Jain
Sunil Hukumchand Kocheta
Pankaj Jain
Source: Capitaline
*Independent
Exhibit 6: Auditors
Name
J L Sengupta & Co
J Singh & Associates
Ram Raj & Co
S C Vasudeva & Co
V K Niranjan & Co
Type
Statutory
Statutory
Statutory
Statutory
Statutory
Source: Capitaline
Exhibit 7: MOSL forecast v/s consensus
EPS
(INR)
FY17
FY18
FY19
MOSL
forecast
33.0
48.9
63.1
Consensus
forecast
21.2
37.6
50.9
Variation
(%)
55.8
30.0
24.0
Source: Bloomberg
8 May 2017
10

Canara Bank
NOTES
8 May 2017
11

Disclosures
Canara
by it and/or
This document has been prepared by Motilal Oswal Securities Limited (hereinafter referred to as Most) to provide information about the company (ies) and/sector(s), if any, covered in the report and may be distributed
Bank
its
affiliated company(ies). This report is for personal information of the selected recipient/s and does not construe to be any investment, legal or taxation advice to you. This research report does not constitute an offer, invitation or
inducement to invest in securities or other investments and Motilal Oswal Securities Limited (hereinafter referred as MOSt) is not soliciting any action based upon it. This report is not for public distribution and has been furnished to
you solely for your general information and should not be reproduced or redistributed to any other person in any form. This report does not constitute a personal recommendation or take into account the particular investment
objectives, financial situations, or needs of individual clients. Before acting on any advice or recommendation in this material, investors should consider whether it is suitable for their particular circumstances and, if necessary, seek
professional advice. The price and value of the investments referred to in this material and the income from them may go down as well as up, and investors may realize losses on any investments. Past performance is not a guide for
future performance, future returns are not guaranteed and a loss of original capital may occur.
MOSt and its affiliates are a full-service, integrated investment banking, investment management, brokerage and financing group. We and our affiliates have investment banking and other business relationships with a some
companies covered by our Research Department. Our research professionals may provide input into our investment banking and other business selection processes. Investors should assume that MOSt and/or its affiliates are
seeking or will seek investment banking or other business from the company or companies that are the subject of this material and that the research professionals who were involved in preparing this material may educate investors
on investments in such business . The research professionals responsible for the preparation of this document may interact with trading desk personnel, sales personnel and other parties for the purpose of gathering, applying and
interpreting information. Our research professionals are paid on twin parameters of performance & profitability of MOSt.
MOSt generally prohibits its analysts, persons reporting to analysts, and members of their households from maintaining a financial interest in the securities or derivatives of any companies that the analysts cover. Additionally, MOSt
generally prohibits its analysts and persons reporting to analysts from serving as an officer, director, or advisory board member of any companies that the analysts cover. Our salespeople, traders, and other professionals or affiliates
may provide oral or written market commentary or trading strategies to our clients that reflect opinions that are contrary to the opinions expressed herein, and our proprietary trading and investing businesses may make investment
decisions that are inconsistent with the recommendations expressed herein. In reviewing these materials, you should be aware that any or all of the foregoing among other things, may give rise to real or potential conflicts of interest.
MOSt and its affiliated company(ies), their directors and employees and their relatives may; (a) from time to time, have a long or short position in, act as principal in, and buy or sell the securities or derivatives thereof of companies
mentioned herein. (b) be engaged in any other transaction involving such securities and earn brokerage or other compensation or act as a market maker in the financial instruments of the company(ies) discussed herein or act as an
advisor or lender/borrower to such company(ies) or may have any other potential conflict of interests with respect to any recommendation and other related information and opinions.; however the same shall have no bearing
whatsoever on the specific recommendations made by the analyst(s), as the recommendations made by the analyst(s) are completely independent of the views of the affiliates of MOSt even though there might exist an inherent
conflict of interest in some of the stocks mentioned in the research report Reports based on technical and derivative analysis center on studying charts company's price movement, outstanding positions and trading volume, as
opposed to focusing on a company's fundamentals and, as such, may not match with a report on a company's fundamental analysis. In addition MOST has different business segments / Divisions with independent research
separated by Chinese walls catering to different set of customers having various objectives, risk profiles, investment horizon, etc, and therefore may at times have different contrary views on stocks sectors and markets.
Unauthorized disclosure, use, dissemination or copying (either whole or partial) of this information, is prohibited. The person accessing this information specifically agrees to exempt MOSt or any of its affiliates or employees from,
any and all responsibility/liability arising from such misuse and agrees not to hold MOSt or any of its affiliates or employees responsible for any such misuse and further agrees to hold MOSt or any of its affiliates or employees free
and harmless from all losses, costs, damages, expenses that may be suffered by the person accessing this information due to any errors and delays. The information contained herein is based on publicly available data or other
sources believed to be reliable. Any statements contained in this report attributed to a third party represent MOSt’s interpretation of the data, information and/or opinions provided by that third party either publicly or through a
subscription service, and such use and interpretation have not been reviewed by the third party. This Report is not intended to be a complete statement or summary of the securities, markets or developments referred to in the
document. While we would endeavor to update the information herein on reasonable basis, MOSt and/or its affiliates are under no obligation to update the information. Also there may be regulatory, compliance, or other reasons that
may prevent MOSt and/or its affiliates from doing so. MOSt or any of its affiliates or employees shall not be in any way responsible and liable for any loss or damage that may arise to any person from any inadvertent error in the
information contained in this report. MOSt or any of its affiliates or employees do not provide, at any time, any express or implied warranty of any kind, regarding any matter pertaining to this report, including without limitation the
implied warranties of merchantability, fitness for a particular purpose, and non-infringement. The recipients of this report should rely on their own investigations.
This report is intended for distribution to institutional investors. Recipients who are not institutional investors should seek advice of their independent financial advisor prior to taking any investment decision based on this report or for
any necessary explanation of its contents.
Most and it’s associates may have managed or co-managed public offering of securities, may have received compensation for investment banking or merchant banking or brokerage services, may have received any compensation
for products or services other than investment banking or merchant banking or brokerage services from the subject company in the past 12 months.
Most and it’s associates have not received any compensation or other benefits from the subject company or third party in connection with the research report.
Subject Company may have been a client of Most or its associates during twelve months preceding the date of distribution of the research report
MOSt and/or its affiliates and/or employees may have interests/positions, financial or otherwise of over 1 % at the end of the month immediately preceding the date of publication of the research in the securities mentioned in this
report. To enhance transparency, MOSt has incorporated a Disclosure of Interest Statement in this document. This should, however, not be treated as endorsement of the views expressed in the report.
Motilal Oswal Securities Limited is registered as a Research Analyst under SEBI (Research Analyst) Regulations, 2014. SEBI Reg. No. INH000000412
Pending Regulatory inspections against Motilal Oswal Securities Limited:
SEBI pursuant to a complaint from client Shri C.R. Mohanraj alleging unauthorized trading, issued a letter dated 29th April 2014 to MOSL notifying appointment of an Adjudicating Officer as per SEBI regulations to hold inquiry and
adjudge violation of SEBI Regulations; MOSL replied to the Show Cause Notice whereby SEBI granted us an opportunity of Inspection of Documents. Since all the documents requested by us were not covered we have requested to
SEBI vide our letter dated June 23, 2015 to provide pending list of documents for inspection.
List of associate companies of Motilal Oswal Securities Limited -Click
here to access detailed report
NOTES
Analyst Certification
The views expressed in this research report accurately reflect the personal views of the analyst(s) about the subject securities or issues, and no part of the compensation of the research analyst(s) was, is, or will be directly or
indirectly related to the specific recommendations and views expressed by research analyst(s) in this report. The research analysts, strategists, or research associates principally responsible for preparation of MOSt research receive
compensation based upon various factors, including quality of research, investor client feedback, stock picking, competitive factors and firm revenues
Disclosure of Interest Statement
Analyst ownership of the stock
Served as an officer, director or employee
CANARA BANAK
No
No
A graph of daily closing prices of securities is available at www.nseindia.com and http://economictimes.indiatimes.com/markets/stocks/stock-quotes
Regional Disclosures (outside India)
This report is not directed or intended for distribution to or use by any person or entity resident in a state, country or any jurisdiction, where such distribution, publication, availability or use would be contrary to law, regulation or which
would subject MOSt & its group companies to registration or licensing requirements within such jurisdictions.
For Hong Kong:
This report is distributed in Hong Kong by Motilal Oswal capital Markets (Hong Kong) Private Limited, a licensed corporation (CE AYY-301) licensed and regulated by the Hong Kong Securities and Futures
Commission (SFC) pursuant to the Securities and Futures Ordinance (Chapter 571 of the Laws of Hong Kong) “SFO”. As per SEBI (Research Analyst Regulations) 2014 Motilal Oswal Securities (SEBI Reg No. INH000000412) has
an agreement with Motilal Oswal capital Markets (Hong Kong) Private Limited for distribution of research report in Kong Kong. This report is intended for distribution only to “Professional Investors” as defined in Part I of Schedule 1 to
SFO. Any investment or investment activity to which this document relates is only available to professional investor and will be engaged only with professional investors.” Nothing here is an offer or solicitation of these securities,
products and services in any jurisdiction where their offer or sale is not qualified or exempt from registration. The Indian Analyst(s) who compile this report is/are not located in Hong Kong & are not conducting Research Analysis in
Hong Kong.
Motilal Oswal Securities Limited (MOSL) is not a registered broker - dealer under the U.S. Securities Exchange Act of 1934, as amended (the"1934 act") and under applicable state laws in the United States. In addition MOSL is not a
registered investment adviser under the U.S. Investment Advisers Act of 1940, as amended (the "Advisers Act" and together with the 1934 Act, the "Acts), and under applicable state laws in the United States. Accordingly, in the
absence of specific exemption under the Acts, any brokerage and investment services provided by MOSL, including the products and services described herein are not available to or intended for U.S. persons.
This report is intended for distribution only to "Major Institutional Investors" as defined by Rule 15a-6(b)(4) of the Exchange Act and interpretations thereof by SEC (henceforth referred to as "major institutional investors"). This
document must not be acted on or relied on by persons who are not major institutional investors. Any investment or investment activity to which this document relates is only available to major institutional investors and will be
engaged in only with major institutional investors. In reliance on the exemption from registration provided by Rule 15a-6 of the U.S. Securities Exchange Act of 1934, as amended (the "Exchange Act") and interpretations thereof by
the U.S. Securities and Exchange Commission ("SEC") in order to conduct business with Institutional Investors based in the U.S., MOSL has entered into a chaperoning agreement with a U.S. registered broker-dealer, Motilal Oswal
Securities International Private Limited. ("MOSIPL"). Any business interaction pursuant to this report will have to be executed within the provisions of this chaperoning agreement.
The Research Analysts contributing to the report may not be registered /qualified as research analyst with FINRA. Such research analyst may not be associated persons of the U.S. registered broker-dealer, MOSIPL, and therefore,
may not be subject to NASD rule 2711 and NYSE Rule 472 restrictions on communication with a subject company, public appearances and trading securities held by a research analyst account.
For Singapore
Motilal Oswal Capital Markets Singapore Pte Limited is acting as an exempt financial advisor under section 23(1)(f) of the Financial Advisers Act(FAA) read with regulation 17(1)(d) of the Financial Advisors Regulations and is a
subsidiary of Motilal Oswal Securities Limited in India. This research is distributed in Singapore by Motilal Oswal Capital Markets Singapore Pte Limited and it is only directed in Singapore to accredited investors, as defined in the
Financial Advisers Regulations and the Securities and Futures Act (Chapter 289), as amended from time to time.
In respect of any matter arising from or in connection with the research you could contact the following representatives of Motilal Oswal Capital Markets Singapore Pte Limited:
Varun Kumar
Varun.kumar@motilaloswal.com
Contact : (+65) 68189232
Office Address:21 (Suite 31),16 Collyer Quay,Singapore 04931
For U.S
8 May 2017
Motilal Oswal Tower, Level 9, Sayani Road, Prabhadevi, Mumbai 400 025
Phone: +91 22 3982 5500 E-mail: reports@motilaloswal.com
Motilal Oswal Securities Ltd
12