Godrej Consumer
BSE SENSEX
29,933
Bloomberg
Equity Shares (m)
M.Cap.(INRb)/(USDb)
52-Week Range (INR)
1, 6, 12 Rel. Per (%)
Avg Val, INRm/ Vol ‘000
Free float (%)
S&P CNX
9,317
GCPL IN
340.6
656.8 / 9.9
1956 / 1286
13/20/27
354
36.7
9 May 2017
Q4FY17 Results Update | Sector: Consumer
CMP: INR1,929
TP:INR1,950(+1%)
Neutral
Domestic branded volumes grow 5% led by Hair color portfolio
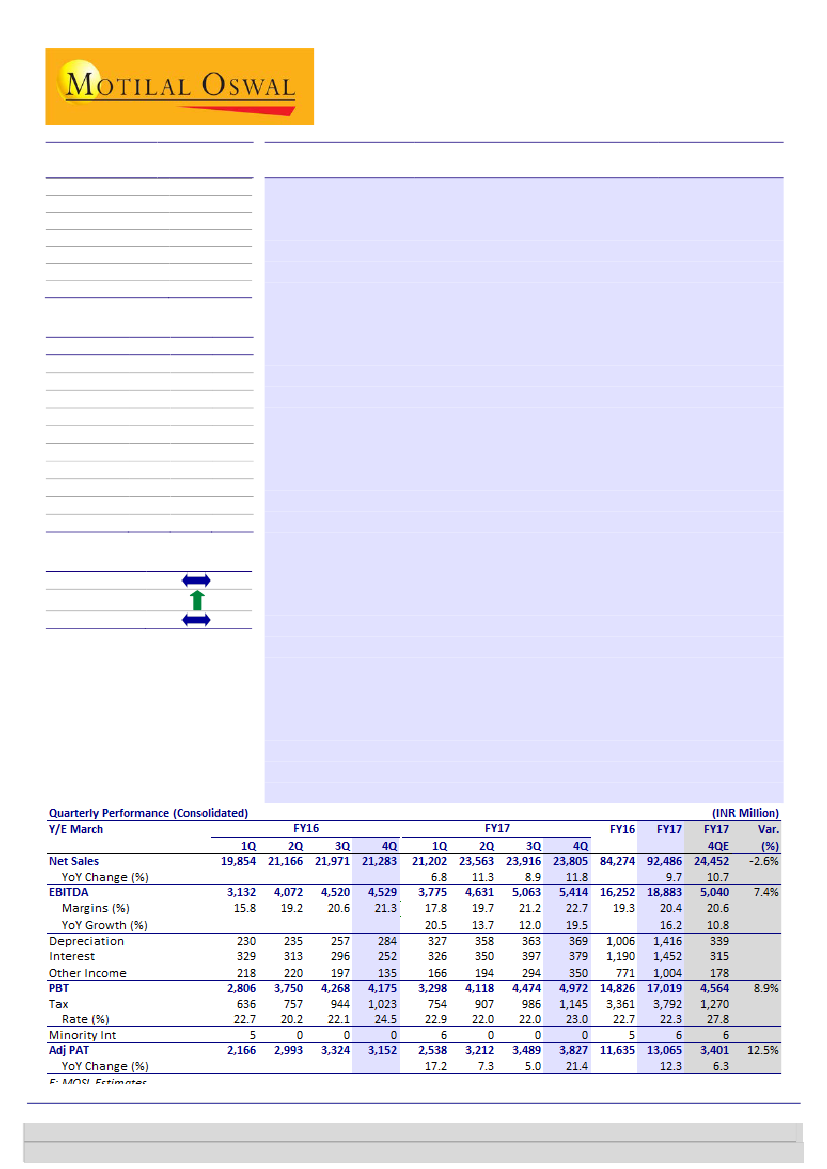
Godrej Consumer’s (GCPL) 4QFY17 consol. net sales grew 11.8% YoY
to
INR23.8b (est. of INR24.5b). Consol. EBITDA growth of 19.5% YoY to INR5.4b
(est. of INR5.04b) and adj. PAT growth of 21.4% YoY to INR3.83b (est. of
INR3.4b) were both better than expectations. Organic consol. CC sales grew 6%
YoY, while India business sales were up strongly by 10% YoY in 4QFY17.
Gross margin expanded 260bp YoY to 56.6%.
Ad spend to sales declined 70bp
YoY to 6.5%, but the fall was not as steep as witnessed by peers for the
quarter. EBITDA margin expanded 150bp YoY to 22.7% in 4QFY17. Consol.
EBITDA grew 19.5% YoY to INR5.4b (est. of INR5.04b). Thus, despite consol.
sales being 2.6% below expectations, EBITDA was 7.4% ahead of forecasts.
Higher-than-expected other income and a lower-than-forecast tax rate led to
PAT beat of 12.5%. Adj. PAT grew 21.4% YoY to INR3.83b (est. of INR3.4b).
India branded business volume growth stood at 5% YoY.
Household
Insecticides business reported 4% YoY sales growth, Soaps grew 9% YoY, while
Hair color sales were up 13% YoY (double-digit revenue growth in Hair colors
after five quarters).
International:
CC sales grew 22% YoY (with 1% organic sales growth). On CC
basis, Indonesia sales were flat, Africa/LatAM grew 61%/19%, while Europe
sales declined 5%.
FY17 performance:
Consol. sales, EBITDA and adj. PAT growth stood at 9.7%,
16.2% and 12.3%, respectively.
Valuation and view:
At 38.6x March 2019E EPS, the stock appears fairly valued.
While earnings growth has been more consistent than FMCG peers (FY17
reported eighth consecutive year of double-digit EBITDA and PAT growth), we
believe that due to its exposure to various geographies, attendant currency
risks and relatively low RoE (mid-20s), the stock does not warrant a higher
multiple. Maintain
Neutral
with TP of INR1,950 (39x March-19E EPS, a 10%
premium to 3-year average owing to higher earnings consistency relative to
peers).
Financials & Valuation (INR b)
Y/E Mar
2017 2018E 2019E
Net Sales
92.4 107.3 122.4
EBITDA
18.9
22.1
24.9
PAT
12.9
14.8
17.0
EPS (INR)
37.8
43.6
50.0
Gr. (%)
12.4
15.4
14.6
BV/Sh (INR)
155.7 200.6 233.5
RoE (%)
24.6
24.5
23.0
RoCE (%)
16.8
16.6
16.5
P/E (x)
51.0
44.2
38.6
P/BV (x)
12.4
9.6
8.3
Estimate change
TP change
Rating change
Investors are advised to refer through important disclosures made at the last page of the Research Report.
Motilal Oswal research is available on www.motilaloswal.com/Institutional-Equities, Bloomberg, Thomson Reuters, Factset and S&P Capital.
Krishnan Sambamoorthy
(Krishnan.Sambamoorthy@motilaloswal.com); +91 22 3027 8029
Vishal Punmiya
(Vishal.Punmiya@motilaloswal.com); +91 22 3980 4261

Godrej Consumer
Key quarterly charts
Exhibit 1: Snapshot of 4Q17 performance
Growth (%)
Net Sales
Net Sales Constant Currency
Net Sales Organic*
Net Sales Organic Constant Currency*
EBITDA
EBITDA Constant Currency
Net Profit
Net profit without exceptional & one offs
Consolidated
13.0
15.0
6.0
8.0
21.0
22.0
212.0
22.0
India
10.0
10.0
10.0
10.0
19.0
19.0
21.0
21.0
International
16.0
22.0
1.0
6.0
22.0
28.0
**NA
10.0
* Excludes Strength of Nature (USA) and Canon Chemicals (Kenya) inorganic sales of INR 1.53b
**NA due to 4QFY16 having reported net loss of INR0.77b on account of Ind-AS related adjustments
Source: Company, MOSL
Exhibit 2: Exceptional and One-off items
INR m
Reported
Exceptional Post Tax
Add: Restructuring cost in Latam
Less: Others
Add: Call/Put option liability, dividend paid to non-
controlling shareholders and acquisition related expenses
Net profit without exc & one offs
4QFY16
Consolidated
India
3,900
2,530
30
(130)
3,800
2,530
0
4QFY17
International Consolidated
India
1,320
3,900
2,530
30
(130)
1,220
30
(130)
3,800
2,530
0
International
1,320
30
(130)
1,220
Source: Company, MOSL
Exhibit 3: Snapshot of India business
Sales (INR m)
Household Insectisides
Soaps
Hair Colours
Other brands
Unbranded and Exports
Total
Sales and trade promotions netted off from Sales as
per Ind AS
Gross sales
Total Branded Volume
4QFY16
6,394
3,284
1,513
887
712
12,771
(710)
12,055
4QFY17
6,650
3,580
1,710
1,180
790
13,920
(660)
13,260
5.0
YoY (%)
4.0
9.0
13.0
33.0
11.0
9.0
(7.0)
10.0
4.0
Source: Company, MOSL
Exhibit 4: Snapshot of International business
International Business
Indonesia
Africa (incl. SON)*
Latin America
Europe
Others**
Total Net Sales
Sales (INR m)
3,890
4,820
1,660
970
390
11,730
4QFY17
Growth (%)
1.0
47.0
17.0
(18.0)
(4.0)
16.0
CC growth (%)
0.0
61.0
19.0
(5.0)
(2.0)
22.0
Source: Company, MOSL
27 January 2016
2

Godrej Consumer
Exhibit 5: HI posted 4% revenue growth in 4QFY17
Home Insecticide revenue growth (%)
17
16
2
18
4
(2)
(11)
9
11
15
13
15
10
Source: Company, MOSL
Exhibit 6: Soaps posted 9% revenue growth in 4QFY17
Soaps revenue growth (%)
13
1
2
15
13
3
2
(6)
1
(6)
11
9
(10)
Source: Company, MOSL
Exhibit 7: Hair Colors revenues grew 13% in 4QFY17
Hair Colors revenue growth (%)
19
9
10
12
12
7
4
16
14
13
0
(2)
(1)
Source: Company, MOSL
27 January 2016
3

Godrej Consumer
Earnings Call takeaways
Strategy and addressable pie
India INR 9000 billion (USD 140 trillion) FMCG market of which half is
unorganized. Room for everyone to grow. Innovation will be the key.
Management does not expect very large ticket acquisitions. Focusing on
improving ROCEs in existing acquisition. Management believes that they can
have medium size ticket acquisitions and still have over 50% Dividend Payout,
admittedly still a lower number compared to peers.
Management aim to sustain Consolidated EBITDA margins at current high levels.
International business margins can improve further.
Africa addressable market size in current categories- Dry hair and wet hair are
both USD 1bn markets each in Africa while Household Insecticides is an
addressable USD 500m opportunity.
Dry hair all manufacturing is localized. Wet hair will be completely localized this
year. Household insecticides are a newer category and products are imported
into Africa.
India business- Segmental highlights
Insecticides soft sales at 4% was because of hotter March across India. Market
shares are up YoY.
Soaps- Mid single volume growth (5%) enabled 9% sales growth. Trade offers
have been scaled back. Excess stock in consumer homes has due to promotions
earlier has come off.
In Soaps, Patanjali has only had a minor impact in a couple of Northern States.
In Air Fresheners GCPL is now No.1 in the market. Sales of INR 5b now.
International business highlights
Indonesia sales were flat but sales growth excluding insecticides business was
decent at 9% given Macroeconomic challenges. Heavy rainfall affected
household insecticides sales. Indonesia flat volumes overall for both 4Q and
FY17.
Africa- SoN localization on track. Will see Darling re-launch this year.
Lat AM- There will be a re-launch of the ‘Issue’ brand.
Project Pi will be a good source of spend on new product development in
Indonesia going forward.
FY17- Organic volume growth in Africa was in early double digit growth.
Financials
Reduction in receivables in FY17 is sustainable. Could perhaps even reduce
further in FY18.
Around two-third of adspend is usually on core while one third is on new
products.
GST
Current indirect tax rates at 23-24%. Because of HP and North East effective rate
is 16-17%.
Any benefits will be passed on to consumers in order to boost sales.
27 January 2016
4

Godrej Consumer
Valuation and view
There is no material change to our EPS forecasts. At 38.6x March 2019 EPS, the
stock is by no means undervalued. While earnings growth has been more
consistent than FMCG peers (FY17 reported the eighth consecutive year of
double digit EBITDA and PAT growth), its exposure to various geographies,
attendant currency risks and relatively lower RoE (mid-20’s), we believe the
stock does not warrant a higher multiple.
Maintain Neutral with a target price of INR1,950 (39x December 2018 EPS, 10%
premium to 3yr average).
Exhibit 8: Revise estimates marginally for FY18/FY19
INR Mn
Sales
EBITDA
PAT
FY18E
105,113
20,976
14,566
Old
FY19E
120,703
23,843
16,890
FY18E
107,339
22,060
14,842
New
FY19E
122,413
24,902
17,001
FY18E
2.1%
5.2%
1.9%
Change
FY19E
1.4%
4.4%
0.7%
Source: Company, MOSL
Exhibit 9: GCPL consumer P/E (x)
PE (x)
38.0
28.0
18.0
8.0
27.4
Peak(x)
Avg(x)
Min(x)
Exhibit 10: GCPL consumer P/E premium vs. Sensex
180
120
60
59.8
Godrej Consumer PE Relative to Sensex PE (%)
122.8
10.8
0
-60
Source: Company, MOSL
Exhibit 11: Valuation Matrix of coverage universe
Company Reco
Price
Mkt Cap EPS Growth YoY (%)
(INR)
(USD M) FY17 FY18E FY19E
Consumer
Asian Paints
Britannia
Colgate
Dabur
Emami
Godrej
GSK
HUL
ITC
Jyothy Labs
Marico
Nestle
PGHH
Page
Parag Milk
Pidilite Inds.
United Bre.
United Spir.
Neutral
Buy
Buy
Neutral
Buy
Neutral
Neutral
Neutral
Buy
Neutral
Neutral
Neutral
Buy
Buy
Neutral
Neutral
Buy
Neutral
1,165
3,584
1,006
273
1,077
1,929
5,175
952
272
371
303
6,703
7,974
14,419
256
743
793
1,898
17.3
6.5
4.2
7.4
3.8
9.3
3.4
32.0
51.0
1.0
6.0
10.0
3.9
2.5
0.3
5.9
3.2
4.3
9.5
3.0
-4.4
1.9
4.5
12.4
-1.7
1.1
8.6
94.5
12.1
-1.6
11.5
12.9
-87.9
12.5
-5.4
71.2
10.2
15.5
18.9
6.7
10.2
15.4
12.5
11.7
11.6
12.8
10.5
18.0
7.5
29.5
756.4
10.1
34.3
47.2
18.0
22.0
22.7
18.3
18.6
14.6
10.3
15.4
18.1
16.5
21.1
17.3
16.6
27.3
79.4
12.3
28.2
39.1
P/E (x)
FY17 FY18E FY19E
56.8
49.7
46.4
37.7
40.6
51.0
33.6
49.4
32.4
46.6
48.2
56.8
55.0
61.2
315.4
44.8
74.3
66.3
51.6
43.0
39.0
35.4
36.8
44.2
29.9
44.3
29.1
41.3
43.6
48.2
51.2
47.3
36.8
40.7
55.4
45.0
43.7
35.2
31.8
29.9
31.1
38.6
27.1
38.4
24.6
35.4
36.0
41.0
43.9
37.1
20.5
36.2
43.2
32.3
EV/EBITDA (x)
RoE (%) Div.
FY17 FY18E FY19E FY17
FY17
36.3
36.0
27.6
30.2
32.4
35.9
22.3
34.4
22.0
26.1
33.9
34.8
36.2
39.1
28.3
30.1
30.3
32.3
33.6
30.8
23.0
28.7
28.3
30.9
19.4
31.2
19.5
23.8
30.7
29.1
31.8
30.1
15.5
26.6
26.8
25.8
28.5
24.4
18.9
24.1
23.8
27.2
17.3
27.1
16.2
21.2
25.6
24.7
26.8
23.8
10.6
23.3
21.2
20.0
32.8
43.1
54.9
28.4
35.8
24.6
24.6
67.6
28.4
16.4
36.7
39.0
45.3
41.3
1.3
27.9
12.6
20.8
1.0
0.7
1.5
0.9
0.6
0.6
1.0
2.0
2.0
1.1
1.0
0.9
4.6
0.7
0.0
0.7
0.1
0.0
Note: For Nestle FY16 means CY15
Source: Company, MOSL
27 January 2016
5

Godrej Consumer
Income Statement
Y/E March
Net Sales
Change (%)
Cost of Goods Sold
Gross Profit
Margin (%)
Total Expenditure
EBITDA
Change (%)
Margin (%)
Depreciation
Int. and Fin. Charges
Interest Income
Other Income-rec.
PBT
Change (%)
Margin (%)
Tax
Tax Rate (%)
PAT
Change (%)
Margin (%)
Minority interest
Reported PAT
2014
76,024
18.5
35,547
40,477
53.2
64,457
11,568
17.7
15.2
819
1,074
285
342
10,302
15.0
13.6
2,167
20.4
8,199
14.4
10.8
596
7,597
2015
82,764
8.9
38,415
44,348
53.6
69,111
13,653
18.0
16.5
908
1,002
284
632
12,659
22.9
15.3
2,861
21.5
9,936
21.2
12.0
693
9,071
2016
84,132
1.7
38,672
45,460
54.0
67,881
16,252
19.0
19.3
1,006
1,190
664
282
15,001
18.5
17.8
3,361
22.4
11,640
17.2
13.8
29
8,276
2017
92,428
9.9
41,325
51,103
55.3
73,545
18,883
16.2
20.4
1,416
1,452
753
94
16,862
12.4
18.2
3,792
22.5
13,071
12.3
14.1
31
13,041
2018E
107,339
16.1
47,705
59,634
55.6
85,279
22,060
16.8
20.6
1,908
1,350
767
113
19,683
16.7
18.3
4,488
23.6
15,045
15.1
14.0
39
15,006
(INR Million)
2019E
122,413
14.0
54,871
67,543
55.2
97,511
24,902
12.9
20.3
2,020
1,350
835
136
22,502
14.3
18.4
5,131
23.5
17,204
14.4
14.1
39
17,166
Balance Sheet
Y/E March
Share Capital
Reserves
Minority Int
Networth
Loans
Deferred Liability
Capital Employed
Gross Block
Less: Accum. Depn.
Net Fixed Assets
Capital WIP
Goodwill
Non Curr Investments
Current Investments
Currents Assets
Inventory
Account Receivables
Cash and Bank Balance
Loans and Advances
Other Current Assets
Curr. Liab. & Prov.
Account Payables
Other Liabilities
Provisions
Net Current Assets
Net Assets
E: MOSL Estimates
2014
340
37,414
2,251
40,005
23,734
-203
63,536
22,511
6,821
15,689
1,671
35,525
343
1,020
28,751
10,821
7,321
7,048
3,536
25
19,462
12,344
6,731
387
9,289
63,536
2015
340
42,767
1,620
44,727
27,172
-312
71,587
22,890
7,821
15,069
2,246
40,441
343
1,514
31,464
10,717
8,046
8,942
3,682
76
19,489
10,869
7,886
734
11,974
71,587
2016
341
50,636
842
51,819
28,911
-413
80,317
26,383
9,020
17,363
437
45,741
344
1,529
35,684
13,070
11,180
7,459
3,857
118
20,780
10,372
10,064
345
14,904
80,317
2017
341
52,679
0
53,020
33,408
1,898
88,326
44,662
10,435
34,227
1,012
46,626
2,518
6,818
38,151
14,125
10,287
9,127
3,126
1,487
41,025
17,239
23,388
398
-2,874
88,326
2018E
340
67,928
0
68,269
37,511
-563
105,217
48,912
12,343
36,569
1,012
46,626
2,014
5,454
44,360
15,880
11,763
9,946
4,987
1,784
30,818
11,763
18,710
345
13,542
105,217
2019E
340
79,122
0
79,462
37,511
-730
116,243
53,162
14,363
38,799
1,012
46,626
1,611
4,363
54,237
18,110
13,080
15,230
5,676
2,141
30,405
15,092
14,968
345
23,832
116,243
27 January 2016
6

Godrej Consumer
Ratios
Y/E March
Basic (INR)
EPS
Cash EPS
BV/Share
DPS
Payout (%)
Valuation (x)
P/E
Cash P/E
EV/Sales
EV/EBITDA
P/BV
Dividend Yield
Return Ratios (%)
RoE
RoCE
RoIC
Working Capital Ratios
Debtor (Days)
Asset Turnover (x)
Leverage Ratio
Debt/Equity (x)
2014
21.9
24.3
117.5
5.3
24.0
88.3
79.5
8.9
58.2
16.4
0.3
19.8
14.7
16.6
35
4.4
2015
26.7
29.3
131.4
7.1
26.7
72.3
65.8
8.1
49.4
14.7
0.4
21.4
15.9
17.9
35
4.8
2016
33.6
36.6
152.2
9.7
28.9
57.4
52.7
8.1
41.7
12.7
0.5
23.7
16.5
18.3
49
4.7
2017
37.8
42.0
155.7
11.8
31.2
51.0
46.0
7.3
35.9
12.4
0.6
24.6
16.8
19.4
41
2.6
2018E
43.6
49.2
200.6
15.0
34.4
44.2
39.2
6.4
30.9
9.6
0.8
24.5
16.6
19.8
40
2.9
2019E
50.0
55.9
233.5
15.0
30.0
38.6
34.5
5.5
27.2
8.3
0.8
23.0
16.5
19.4
39
3.1
0.6
0.6
0.6
0.6
0.5
0.5
Cash Flow Statement
Y/E March
OP/(Loss) before Tax
Net interest
Direct Taxes Paid
(Inc)/Dec in WC
CF from Operations
Extraordinary Items
Inc in FA
Free Cash Flow
Pur of Investments
Goodwill
CF from Investments
Issue of Shares
Inc in Debt
Dividend Paid
Other Income
Interest Paid
Other Item
CF from Fin. Activity
Inc/Dec of Cash
Add: Beginning Balance
Closing Balance
E: MOSL Estimates
2014
11,121
732
-2,167
2,351
12,036
-6
-1,197
10,839
-343
-6,440
-7,986
0
-829
-2,091
627
-1,074
-1,112
-4,478
-428
7,476
7,048
2015
13,567
370
-2,861
-791
10,285
-172
-955
9,330
0
-4,916
-6,043
0
3,437
-2,835
915
-1,002
-2,863
-2,347
1,894
7,048
8,942
2016
16,007
909
-3,361
-4,413
9,142
-3,335
-1,683
7,460
-1
-5,300
-10,319
0
1,740
-3,870
946
-1,190
2,068
-307
-1,483
8,942
7,459
2017
18,278
1,358
-3,792
19,445
35,289
1
-18,854
16,435
-2,173
-885
-21,912
0
4,497
-4,698
847
-1,452
-10,903
-11,709
1,668
7,459
9,127
2018E
21,590
1,237
-4,488
-15,596
2,744
0
-4,250
-1,506
504
0
-3,747
0
4,103
-5,972
880
-1,350
4,162
1,823
820
9,127
9,946
(INR Million)
2019E
24,523
1,215
-5,131
-5,006
15,601
0
-4,250
11,351
403
0
-3,847
0
0
-5,972
971
-1,350
-118
-6,470
5,284
9,946
15,230
27 January 2016
7

Godrej Consumer
Corporate profile
Company description
GCPL is the second largest player in the INR90b
Toilet Soaps category, with a market share of
~10%. Company is the market leader in INR10b
hair dye/color segment, with a market share of
~35%. Its international business now constitutes
36% of consolidated revenue.
Exhibit 1: Sensex rebased
Source: MOSL/Bloomberg
Exhibit 2: Shareholding pattern (%)
Promoter
DII
FII
Others
Mar-17
63.3
2.2
28.4
6.1
Dec-16
63.3
2.1
28.4
6.2
Mar-16
63.3
1.9
28.6
6.3
Exhibit 3: Top holders
Holder Name
National Westminster Bank PLC as
Depositary of First State Asia Pacific Leaders
Fund a Sub Fund of F
Baytree Investments (Mauritius) Pte Limited
Arisaig Partners (Asia) Pte Limited A/c Arisaig
India Fund Limited
Aberdeen Global Indian Equity Limited
LIC of India
% Holding
2.6
2.5
2.0
1.4
1.4
Source: Capitaline
Note: FII Includes depository receipts
Source: Capitaline
Exhibit 4: Top management
Name
Adi Godrej
VIVEK GAMBHIR
V Srinivasan
Nisaba Godrej
Designation
Chairman
&
Wholetime
Director
Managing Director
CFO & Company Secretary
Executive Director
Exhibit 5: Directors
Name
Aman Mehta
D Shivakumar
Nadir Godrej
Omkar Goswami
Ireena Vittal
Name
Bharat Doshi
Jamshyd N Godrej
Narendra Ambwani
Tanya Arvind Dubash
Source: Capitaline
*Independent
Exhibit 6: Auditors
Name
Kalyaniwalla & Mistry
Type
Statutory
Exhibit 7: MOSL forecast v/s consensus
EPS
(INR)
FY17
FY18
FY19
MOSL
forecast
37.8
43.6
50.0
Consensus
forecast
37.9
44.6
52.1
Variation (%)
-0.4
-2.3
-4.1
Source: Bloomberg
Source: Capitaline
27 January 2016
8

Godrej Consumer
NOTES
27 January 2016
9

Disclosures
This document has been prepared by Motilal Oswal Securities Limited (hereinafter referred to as Most) to provide information about the company (ies) and/sector(s), if any, covered in the report and may be distributed by it
and/or its affiliated company(ies). This report is for personal information of the selected recipient/s and does not construe to be any investment, legal or taxation advice to you. This research report does not constitute an
offer, invitation or inducement to invest in securities or other investments and Motilal Oswal Securities Limited (hereinafter referred as MOSt) is not soliciting any action based upon it. This report is not for public distribution
and has been furnished to you solely for your general information and should not be reproduced or redistributed to any other person in any form. This report does not constitute a personal recommendation or take into
account the particular investment objectives, financial situations, or needs of individual clients. Before acting on any advice or recommendation in this material, investors should consider whether it is suitable for their
particular circumstances and, if necessary, seek professional advice. The price and value of the investments referred to in this material and the income from them may go down as well as up, and investors may realize losses
on any investments. Past performance is not a guide for future performance, future returns are not guaranteed and a loss of original capital may occur.
MOSt and its affiliates are a full-service, integrated investment banking, investment management, brokerage and financing group. We and our affiliates have investment banking and other business relationships with a some
companies covered by our Research Department. Our research professionals may provide input into our investment banking and other business selection processes. Investors should assume that MOSt and/or its affiliates are
seeking or will seek investment banking or other business from the company or companies that are the subject of this material and that the research professionals who were involved in preparing this material may educate
investors on investments in such business . The research professionals responsible for the preparation of this document may interact with trading desk personnel, sales personnel and other parties for the purpose of
gathering, applying and interpreting information. Our research professionals are paid on twin parameters of performance & profitability of MOSt.
MOSt generally prohibits its analysts, persons reporting to analysts, and members of their households from maintaining a financial interest in the securities or derivatives of any companies that the analysts cover.
Additionally, MOSt generally prohibits its analysts and persons reporting to analysts from serving as an officer, director, or advisory board member of any companies that the analysts cover. Our salespeople, traders, and
other professionals or affiliates may provide oral or written market commentary or trading strategies to our clients that reflect opinions that are contrary to the opinions expressed herein, and our proprietary trading and
investing businesses may make investment decisions that are inconsistent with the recommendations expressed herein. In reviewing these materials, you should be aware that any or all of the foregoing among other things,
may give rise to real or potential conflicts of interest. MOSt and its affiliated company(ies), their directors and employees and their relatives may; (a) from time to time, have a long or short position in, act as principal in, and
buy or sell the securities or derivatives thereof of companies mentioned herein. (b) be engaged in any other transaction involving such securities and earn brokerage or other compensation or act as a market maker in the
financial instruments of the company(ies) discussed herein or act as an advisor or lender/borrower to such company(ies) or may have any other potential conflict of interests with respect to any recommendation and other
related information and opinions.; however the same shall have no bearing whatsoever on the specific recommendations made by the analyst(s), as the recommendations made by the analyst(s) are completely independent
of the views of the affiliates of MOSt even though there might exist an inherent conflict of interest in some of the stocks mentioned in the research report
Reports based on technical and derivative analysis center on studying charts company's price movement, outstanding positions and trading volume, as opposed to focusing on a company's fundamentals and, as such, may not match with a report on a
company's fundamental analysis. In addition MOST has different business segments / Divisions with independent research separated by Chinese walls catering to different set of customers having various objectives, risk profiles, investment horizon,
etc, and therefore may at times have different contrary views on stocks sectors and markets.
Unauthorized disclosure, use, dissemination or copying (either whole or partial) of this information, is prohibited. The person accessing this information specifically agrees to exempt MOSt or any of its affiliates or employees
from, any and all responsibility/liability arising from such misuse and agrees not to hold MOSt or any of its affiliates or employees responsible for any such misuse and further agrees to hold MOSt or any of its affiliates or
employees free and harmless from all losses, costs, damages, expenses that may be suffered by the person accessing this information due to any errors and delays. The information contained herein is based on publicly
available data or other sources believed to be reliable. Any statements contained in this report attributed to a third party represent MOSt’s interpretation of the data, information and/or opinions provided by that third party
either publicly or through a subscription service, and such use and interpretation have not been reviewed by the third party. This Report is not intended to be a complete statement or summary of the securities, markets or
developments referred to in the document. While we would endeavor to update the information herein on reasonable basis, MOSt and/or its affiliates are under no obligation to update the information. Also there may be
regulatory, compliance, or other reasons that may prevent MOSt and/or its affiliates from doing so. MOSt or any of its affiliates or employees shall not be in any way responsible and liable for any loss or damage that may
arise to any person from any inadvertent error in the information contained in this report. MOSt or any of its affiliates or employees do not provide, at any time, any express or implied warranty of any kind, regarding any
matter pertaining to this report, including without limitation the implied warranties of merchantability, fitness for a particular purpose, and non-infringement. The recipients of this report should rely on their own
investigations.
This report is intended for distribution to institutional investors. Recipients who are not institutional investors should seek advice of their independent financial advisor prior to taking any investment decision based on this
report or for any necessary explanation of its contents.
Most and it’s associates may have managed or co-managed public offering of securities, may have received compensation for investment banking or merchant banking or brokerage services, may have received any
compensation for products or services other than investment banking or merchant banking or brokerage services from the subject company in the past 12 months.
Most and it’s associates have not received any compensation or other benefits from the subject company or third party in connection with the research report.
Subject Company may have been a client of Most or its associates during twelve months preceding the date of distribution of the research report
MOSt and/or its affiliates and/or employees may have interests/positions, financial or otherwise of over 1 % at the end of the month immediately preceding the date of publication of the research in the securities mentioned
in this report. To enhance transparency, MOSt has incorporated a Disclosure of Interest Statement in this document. This should, however, not be treated as endorsement of the views expressed in the report.
Motilal Oswal Securities Limited is registered as a Research Analyst under SEBI (Research Analyst) Regulations, 2014. SEBI Reg. No. INH000000412
Pending Regulatory inspections against Motilal Oswal Securities Limited:
SEBI pursuant to a complaint from client Shri C.R. Mohanraj alleging unauthorized trading, issued a letter dated 29th April 2014 to MOSL notifying appointment of an Adjudicating Officer as per SEBI regulations to hold inquiry
and adjudge violation of SEBI Regulations; MOSL replied to the Show Cause Notice whereby SEBI granted us an opportunity of Inspection of Documents. Since all the documents requested by us were not covered we have
requested to SEBI vide our letter dated June 23, 2015 to provide pending list of documents for inspection.
List of associate companies of Motilal Oswal Securities Limited -Click
here to access detailed report
Analyst Certification
The views expressed in this research report accurately reflect the personal views of the analyst(s) about the subject securities or issues, and no part of the compensation of the research analyst(s) was, is, or will be directly or
indirectly related to the specific recommendations and views expressed by research analyst(s) in this report. The research analysts, strategists, or research associates principally responsible for preparation of MOSt research
receive compensation based upon various factors, including quality of research, investor client feedback, stock picking, competitive factors and firm revenues
Disclosure of Interest Statement
GODREJ CONSUMER PRODUCTS
Analyst ownership of the stock
No
Served as an officer, director or employee -
No
A graph of daily closing prices of securities is available at www.nseindia.com and http://economictimes.indiatimes.com/markets/stocks/stock-quotes
Regional Disclosures (outside India)
This report is not directed or intended for distribution to or use by any person or entity resident in a state, country or any jurisdiction, where such distribution, publication, availability or use would be contrary to law,
regulation or which would subject MOSt & its group companies to registration or licensing requirements within such jurisdictions.
For Hong Kong:
This report is distributed in Hong Kong by Motilal Oswal capital Markets (Hong Kong) Private Limited, a licensed corporation (CE AYY-301) licensed and regulated by the Hong Kong Securities and Futures
Commission (SFC) pursuant to the Securities and Futures Ordinance (Chapter 571 of the Laws of Hong Kong) “SFO”. As per SEBI (Research Analyst Regulations) 2014 Motilal Oswal Securities (SEBI Reg No. INH000000412) has
an agreement with Motilal Oswal capital Markets (Hong Kong) Private Limited for distribution of research report in Kong Kong. This report is intended for distribution only to “Professional Investors” as defined in Part I of
Schedule 1 to SFO. Any investment or investment activity to which this document relates is only available to professional investor and will be engaged only with professional investors.” Nothing here is an offer or solicitation
of these securities, products and services in any jurisdiction where their offer or sale is not qualified or exempt from registration. The Indian Analyst(s) who compile this report is/are not located in Hong Kong & are not
conducting Research Analysis in Hong Kong.
For U.S.
Motilal Oswal Securities Limited (MOSL) is not a registered broker - dealer under the U.S. Securities Exchange Act of 1934, as amended (the"1934 act") and under applicable state laws in the United States. In addition MOSL is
not a registered investment adviser under the U.S. Investment Advisers Act of 1940, as amended (the "Advisers Act" and together with the 1934 Act, the "Acts), and under applicable state laws in the United States.
Accordingly, in the absence of specific exemption under the Acts, any brokerage and investment services provided by MOSL, including the products and services described herein are not available to or intended for U.S.
persons.
This report is intended for distribution only to "Major Institutional Investors" as defined by Rule 15a-6(b)(4) of the Exchange Act and interpretations thereof by SEC (henceforth referred to as "major institutional investors").
This document must not be acted on or relied on by persons who are not major institutional investors. Any investment or investment activity to which this document relates is only available to major institutional investors
and will be engaged in only with major institutional investors. In reliance on the exemption from registration provided by Rule 15a-6 of the U.S. Securities Exchange Act of 1934, as amended (the "Exchange Act") and
interpretations thereof by the U.S. Securities and Exchange Commission ("SEC") in order to conduct business with Institutional Investors based in the U.S., MOSL has entered into a chaperoning agreement with a U.S.
registered broker-dealer, Motilal Oswal Securities International Private Limited. ("MOSIPL"). Any business interaction pursuant to this report will have to be executed within the provisions of this chaperoning agreement.
The Research Analysts contributing to the report may not be registered /qualified as research analyst with FINRA. Such research analyst may not be associated persons of the U.S. registered broker-dealer, MOSIPL, and
therefore, may not be subject to NASD rule 2711 and NYSE Rule 472 restrictions on communication with a subject company, public appearances and trading securities held by a research analyst account.
For Singapore
Motilal Oswal Capital Markets Singapore Pte Limited is acting as an exempt financial advisor under section 23(1)(f) of the Financial Advisers Act(FAA) read with regulation 17(1)(d) of the Financial Advisors Regulations and is a
subsidiary of Motilal Oswal Securities Limited in India. This research is distributed in Singapore by Motilal Oswal Capital Markets Singapore Pte Limited and it is only directed in Singapore to accredited investors, as defined in
the Financial Advisers Regulations and the Securities and Futures Act (Chapter 289), as amended from time to time.
In respect of any matter arising from or in connection with the research you could contact the following representatives of Motilal Oswal Capital Markets Singapore Pte Limited:
Varun Kumar
Varun.kumar@motilaloswal.com
Contact : (+65) 68189232
Office Address:21 (Suite 31),16 Collyer Quay,Singapore 04931
Godrej Consumer
27 January 2016
Motilal Oswal Tower, Level 9, Sayani Road, Prabhadevi, Mumbai 400 025
Phone: +91 22 3982 5500 E-mail: reports@motilaloswal.com
Motilal Oswal Securities Ltd
10