11 May 2017
4QFY17 Results Update | Sector: Healthcare
Granules India
Buy
BSE SENSEX
30,251
Bloomberg
Equity Shares (m)
M.Cap.(INRb)/(USDb)
52-Week Range (INR)
1, 6, 12 Rel. Per (%)
Avg Val, INRm
Free float (%)
S&P CNX
9,422
GRAN IN
Margin expansion continues; Strong FY18 guidance
216.7
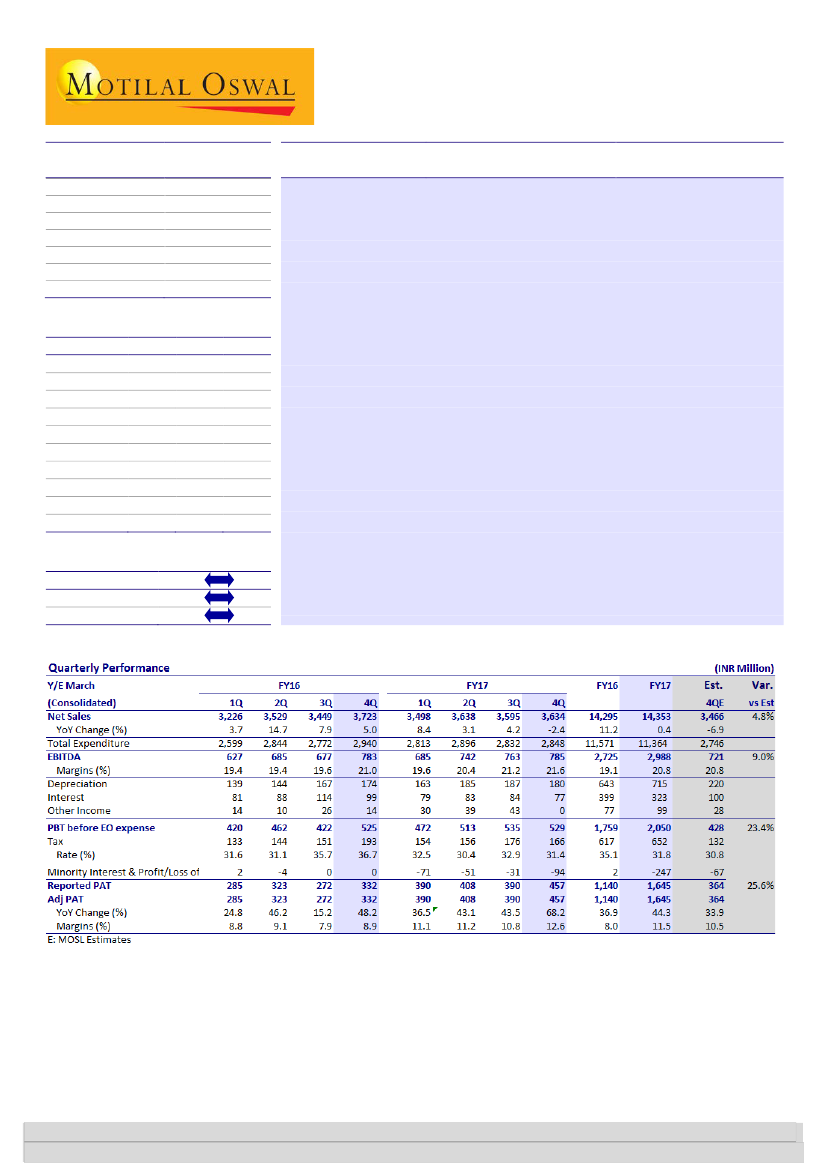
Sales declined 2.4% YoY to INR3.6b (5% above est.) in 4QFY17. EBITDA came
27.1 / 0.4
in at INR785m (9% above est.), with the margin expanding 60bp YoY (+40bp
154 / 91
QoQ) to 21.6% (est. of 20.8%). Notably, EBITDA margin has improved from a
3/21/-6
197
low of ~11% in FY13 to current levels, led by a change in product mix and
46.5
capacity expansion. PAT rose 68.2% YoY (+17% QoQ) to INR457m (25.6%
CMP: INR146
TP: INR200(+37%)
Financials & Valuations (INR b)
2017 2018E
Y/E Mar
Net Sales
14.4
17.4
EBITDA
3.0
3.7
PAT
1.7
2.1
EPS (INR)
7.3
8.1
Gr. (%)
32.7
12.0
BV/Sh (INR)
43.5
60.4
RoE (%)
20.0
16.3
RoCE (%)
11.6
9.8
P/E (x)
20.1
18.0
P/BV (x)
2.6
1.9
2019E
23.9
5.2
2.8
11.1
37.0
68.9
17.2
11.0
13.1
1.7
above est.). Associate income posted profit of INR94m v/s loss of INR25.2m
in 4QFY16, mainly due to higher contribution from Omnichem JV.
Strong FY18 guidance; US business commercialization expected from FY19
:
GRAN guided for strong revenue growth of ~20% and >20% PAT growth on
ramp-up of new capacity, strong growth in formulations and Omnichem JV.
Two complex filings were done from its Virginia facility (mkt. size of
USD660m; 3-4 player market at the time of launch). Monetization of these
products is expected in FY19 (target action date of Jan-18 for one product).
Concall takeaways:
1) To file 12 ANDAs in FY18 (incl. six complex filings from
Virginia); 2) To spend INR6b as capex in FY18 (~USD40m in US, rest in India);
3) sales from Auctus at INR1.6b in FY17; 4) USD1.2b incurred in US in FY17.
Earnings acceleration to drive valuation
:
GRAN trades at ~13x FY19E EPS
(despite assuming equity dilution of >10%). We raise target multiple for GRAN to
18x from 16x (~5-10% premium to peers) on strong EPS CAGR of ~30% till FY20E.
Our TP of INR200 is based on 18x FY19E PER (v/s INR160 @16x 1HFY19E PER).
Estimate change
TP change
Rating change
Kumar Saurabh
(Kumar.Saurabh@MotilalOswal.com); +91 22 6129 1519
Investors are advised to refer through important disclosures made at the last page of the Research Report.
Motilal Oswal research is available on www.motilaloswal.com/Institutional-Equities, Bloomberg, Thomson Reuters, Factset and S&P Capital.

Granules India
At a strategic inflection point
US Business- Plans niche foray into Rx business
Granules is planning to file ~25-30 ANDAs in US till FY19E. Out of this ~10-15
complex ANDAs will be filed from its US based Virginia facility and rest of them
will be filled from India facility located in Gagilapur. We expect couple of niche
approvals to come in FY19E.
Granules has also acquired marketing rights from US Pharma for its 4 ANDAs
(scheduled to be launched from late FY18E to FY19E). Mkt size of these
products are >USD5b and revenue potential for the company could be of
USD30-35m in FY19E.
GRAN intends to expand API capacities of Paracetamol, Metfomin and
Guaifenecin by 25-30%, 3.5x and 2.7x, respectively, which will support both its
base and emerging businesses.
In FY18, GRAN will further increase its PFI capacity by ~20% to ~22,400MTPA.
This debottlenecking is likely to support +15% PFI revenue CAGR over the next
two years.
The company is coming up with a Greenfield multi-product API capacity at Vizag
to support the growing need of internal consumption and new filings.
GRAN has invested heavily in R&D. With the acquisition of the Virginia facility in
the US, it now has two R&D centers - one in Vizag for developing normal ANDAs
and one in Virginia for developing complex ANDAs.
With Omnichem CRAMs JV, GRAN would be entering into manufacturing of high
value APIs for innovators and other big MNCs. We project revenue of INR1.3b in
FY18E and INR1.7b in FY19E. At its peak, the facility can generate revenue of
INR2.25b for Granules. Revenue is likely to grow rapidly beyond FY17 post site
approvals for the customers.
With US OTC, Rx products and Omnichem JV, the revenue contribution from
high margin businesses is likely to increase to ~75% of sales by FY20 from the
current ~55-60%.
This will also be driven by higher operating leverage in the formulations
business, as capacity utilization increases from 55% presently to 100% by FY19,
with ramp-up in US business.
Driven by changing business mix and higher operating leverage, overall EBITDA
margin is likely to expand from 19.4% in FY16 to >23% in FY20E; EBITDA would
grow at a CAGR of >30% over FY17-20E.
Augmented capacities to support base as well as emerging business
Omnichem CRAMs JV - entry into high value APIs
Not only growth, but profitability as well
11 May 2017
2

Granules India
Story in Charts
Exhibit 1: Revenues exhibited -2%YoY decline in 4QFY17
Revenue (INR m)
16
13
12
4
15
8
5
8
3
4 3,634
-2
% YoY growth
17% 17%
Exhibit 2: EBITDA margins expanded 100bps YoY
EBITDA (INR m)
EBITDA M (%)
21% 22%
19% 19% 20% 21% 20% 20%
14%
3,076 3,197 3,546 3,226 3,529 3,449 3,723 3,498 3,638 3,595
524 545 490 627 685 677 783 685 742 763 785
Exhibit 3: Revenues to exhibit 27% CAGR over FY17-20E
Revenues (INR b)
Exhibit 4: Formulation contribution to increase
FD (%)
PFI (%)
39
29
32
API (%)
0
46
33
40
31
29
44
29
27
44
24
32
36
29
35
6
38
24
38
Omnichem (%)
6
38
23
38
7
32
19
32
7
29
17
29
4.8
6.5
7.6
11.0 12.9 14.3 14.4 17.1 23.4 29.6
21
Exhibit 5: EBITDA margins to expand to 23% by FY20E
EBITDA (INR b)
EBITDA margin (%)
19.4
22.4 23.3
20.8 21.6
Exhibit 6: FCF to scale up from FY18E
Free Cashflows (INR m)
236 -294 -251
41.9
-1,570
-20
(0.9)
103
-3,611
-3,661
3.7
(120.8)
(99.4)
(27.0)
FCF/EBITDA (%)
-1,417 299
4.3
11.8 12.1 11.1
14.4
16.1
1
1
1
2
2
3
3
4
5
7
(37.0) (29.5)
(99.2)
Exhibit 7: Capex needs to continue with growth
Capex (INR m)
5,518
3,739
2,649
250
550
1,163
1,473 1,335
3,380 3,376
Exhibit 8: Earnings to exhibit 29% CAGR over FY17-20E
EPS (INR/share)
15.6
7.3
8.1
11.1
1.0
1.5
1.6
3.7
4.5
5.5
Source: Company, MOSL
11 May 2017
Source: Company, MOSL
3

Granules India
Valuation and view
Over the last six years, GRAN reported 39% earnings CAGR on improved
profitability, higher operating leverage and superior business mix. It expanded its
finished dosages business at a CAGR of 36% over FY11-16, leading to higher
profitability and improved utilization of the existing capacity of 18b tablets.
Profitability of the PFI business has also improved substantially, with the
implementation of 6MT order capacity. As a result, GRAN has expanded its EBITDA
margins from 11.8% in FY11 to ~21% in FY17.
Going ahead, we expect ~35% PAT CAGR to continue till FY20E, supported by 27%
revenue CAGR and ~300bp margin expansion. Our target price of INR200 discounts
GRAN’s FY19E EPS at 18x, which (a) is at 5-10% premium to peers, and (b) implies a
PEG of 0.5x (FY17-20E EPS CAGR of ~30%).
GRAN is currently trading at ~13x FY19E EPS. We argue for a P/E re-rating for GRAN,
given (a) strong EPS outlook – ~30% CAGR over FY17-20E, backed by 27% revenue
CAGR (b) RoCE improvement from 14.0% to 11% by FY19E, and 13.4% by FY20E (c)
deleveraging – we expect net D/E to improve to 0.4x by FY20E (v/s 0.7x in FY17).
Exhibit 9: Peer comparison
CMP
146
52
695
308
560
197
1,350
Mkt CAP
(USD m)
522
334
869
775
1,104
392
187
P/E
FY18E
18.0
26.8
31.8
19.2
22.2
21.7
24.0
FY19E
13.1
18.7
22.1
15.2
16.7
18.9
17.0
EV/EBITDA
FY18E
FY19E
8.9
6.6
15.0
11.2
21.7
16.2
11.4
9.8
12.4
10.0
14.2
12.3
11.1
8.6
RoE (%)
FY18E
16.3
16.0
19.2
14.1
12.4
16.2
23.3
FY19E
17.2
19.8
23.0
15.9
14.4
16.5
26.1
Granules India
Marksans Pharma
Shilpa Medicare
Dishman Pharma
IPCA
Suven
Neuland
Key catalysts to drive stock’s performance over the medium term
Finished dosages product approvals from regulated markets.
Commercialization of new capacity.
Higher than expected realizations from Omnichem JV.
Pricing pressure on existing products.
Regulatory risks related to already approved manufacturing facilities.
Exhibit 2: P/E relative to Sensex
150
100
50
12.0
17.4
0
-50
-100
-35.4
-5.3
Granules India PE Relative to Sensex PE (%)
LPA (%)
Avg(x)
45.9
Min(x)
Risks to our investment thesis
Exhibit 1: P/E band Significant re-rating over past 30 months
50
40
30
20
10
0
2.6
PE (x)
Peak(x)
Source: MOSL, Company
11 May 2017
4

Granules India
Financials and Valuations
Income Statement
Y/E Mar
Net Sales
Change (%)
EBITDA
EBITDA Margin (%)
Depreciation
EBIT
Interest
Other Income
Extraordinary items
PBT
Tax
Tax Rate (%)
Min. Int. & Assoc. Share
Reported PAT
Adjusted PAT
Change (%)
2012
6,540
37.6
793
12.1
207
586
170
14
0
430
130
30.3
0
300
300
43.3
2012
201
2,250
2,451
2,036
230
4,717
3,545
1,041
2,504
293
2
2,914
1,099
950
320
545
996
934
62
1,918
4,717
2013
7,644
16.9
851
11.1
231
620
177
21
0
464
138
29.7
0
326
326
8.8
2013
201
2,547
2,749
2,705
245
5,698
3,874
1,240
2,635
1,088
97
3,007
1,365
710
417
515
1,128
1,061
68
1,879
5,698
2014
10,959
43.4
1,583
14.4
298
1,285
204
43
0
1,124
371
33.0
0
753
753
130.8
2014
203
3,357
3,560
4,417
303
8,280
6,539
1,714
4,825
1,246
2
3,848
1,742
1,109
418
580
1,640
1,517
123
2,208
8,280
2015
12,929
18.0
2,086
16.1
527
1,560
323
43
0
1,280
371
29.0
0
909
909
20.8
2015
204
4,107
4,312
4,872
493
9,676
8,438
2,272
6,166
620
2
5,184
2,245
1,326
653
959
2,295
2,120
175
2,888
9,676
2016
14,295
10.6
2,767
19.4
643
2,124
399
77
0
1,802
617
34.2
0
1,185
1,185
30.3
2016
217
6,444
6,660
4,767
580
12,008
9,622
2,941
6,681
766
2
7,080
3,071
1,526
1,419
1,065
2,521
2,399
122
4,559
12,008
2017
14,353
0.4
2,988
20.8
715
2,273
323
99
0
2,050
643
31.4
-247
1,654
1,654
39.6
2017
228
9,683
9,911
6,767
580
17,258
13,122
3,656
9,466
1,005
2
9,240
2,802
3,932
1,437
1,069
2,455
2,167
288
6,785
17,258
(INR Million)
2018E
17,051
18.8
3,683
21.6
1,000
2,683
351
140
0
2,472
791
32.0
-375
2,056
2,056
24.3
2018E
253
15,031
15,284
7,267
580
23,132
18,622
4,656
13,966
1,023
2
10,995
3,296
4,671
1,757
1,270
2,854
2,373
481
8,140
23,132
2019E
23,390
37.2
5,239
22.4
1,509
3,730
611
140
0
3,259
1,043
32.0
-600
2,816
2,816
37.0
2019E
253
17,170
17,423
8,017
580
26,020
21,622
6,165
15,457
1,403
2
12,847
4,475
6,088
542
1,742
3,689
2,984
706
9,158
26,020
Balance Sheet
Y/E Mar
Share Capital
Reserves
Net Worth
Debt
Deferred Tax
Total Capital Employed
Gross Fixed Assets
Less: Acc Depreciation
Net Fixed Assets
Capital WIP
Investments
Current Assets
Inventory
Debtors
Cash & Bank
Loans & Adv, Others
Curr Liabs & Provns
Curr. Liabilities
Provisions
Net Current Assets
Total Assets
(INR Million)
11 May 2017
5

Granules India
Financials and Valuations
Ratios
Y/E Mar
Basic (INR)
EPS
Cash EPS
Book Value
DPS
Payout (incl. Div. Tax.)
Valuation(x)
P/E
Price / Book Value
EV/Sales
EV/EBITDA
Dividend Yield (%)
Profitability Ratios (%)
RoE
RoCE
RoIC
Turnover Ratios (%)
Asset Turnover (x)
Debtors (No. of Days)
Inventory (No. of Days)
Creditors (No. of Days)
Leverage Ratios (%)
Net Debt/Equity (x)
2012
1.5
2.5
12.2
0.2
15.6
2013
1.6
2.8
13.7
0.2
14.4
2014
3.7
5.2
17.6
0.4
11.0
2015
4.5
7.0
21.1
0.5
13.6
32.8
6.9
2.4
15.0
0.3
12.9
10.6
10.8
1.4
52
61
67
0.7
2012
793
7
-436
-115
7
256
-550
-294
2
3
-545
0
691
-168
-35
489
200
120
320
12.5
9.1
10.6
1.3
33
65
72
0.8
2013
851
8
146
-112
19
912
-1,163
-251
-95
-20
-1,278
6
682
-178
-47
463
97
320
417
23.9
13.2
15.9
1.3
36
58
77
1.1
2014
1,583
29
-310
-238
16
1,080
-2,649
-1,570
95
8
-2,546
11
1,709
-205
-47
1,467
0
417
417
23.1
13.3
14.6
1.3
36
63
92
1.0
2015
2,086
29
-363
-317
18
1,453
-1,473
-20
0
17
-1,456
11
628
-319
-83
238
236
417
653
2016
5.5
8.4
30.7
0.6
13.9
26.7
4.8
2.1
11.0
0.4
21.6
14.0
15.2
1.2
38
78
86
0.5
2016
2,767
25
-915
-490
51
1,438
-1,335
103
0
53
-1,281
1,059
191
-406
-234
609
766
653
1,419
2017
7.3
10.4
43.5
1.0
16.2
20.1
2.6
2.3
10.8
0.8
20.0
11.6
12.6
0.8
98
71
84
0.5
2017
2,988
0
-2,208
-652
0
128
-3,739
-3,611
0
99
-3,640
1,873
2,000
-323
-21
3,530
18
1,419
1,437
2018E
8.1
12.1
60.4
1.5
22.3
18.0
1.9
1.9
8.9
1.0
16.3
9.8
10.3
0.7
98
71
75
0.4
2018E
3,683
0
-872
-791
-163
1,857
-5,518
-3,661
0
140
-5,378
3,775
500
-351
-83
3,842
320
1,437
1,757
2019E
11.1
17.1
68.9
2.2
24.1
13.1
1.7
1.5
6.6
1.5
17.2
11.0
11.4
0.9
93
70
67
0.4
2019E
5,239
0
-2,030
-1,043
-203
1,964
-3,380
-1,417
0
140
-3,240
0
750
-611
-77
61
-1,215
1,757
542
Cash Flow Statement
Y/E Mar
Adjusted EBITDA
Non cash opr. exp (inc)
(Inc)/Dec in Wkg. Cap.
Tax Paid
Other operating activities
CF from Op. Activity
(Inc)/Dec in FA & CWIP
Free cash flows
(Pur)/Sale of Invt
Others
CF from Inv. Activity
Inc/(Dec) in Net Worth
Inc / (Dec) in Debt
Interest Paid
Divd Paid (incl Tax) & Others
CF from Fin. Activity
Inc/(Dec) in Cash
Add: Opening Balance
Closing Balance
(INR Million)
11 May 2017
6

Granules India
Corporate profile
Company description
Incorporated in 1991, the Hyderabad-based
Granules India (GRAN) is a vertically integrated
manufacturer of pharmaceutical products. It is
among the largest manufacturers of Paracetamol
and Iboprofen in the world. It derives 63% of its
business from Europe and the US. GRAN also has a
formulations plant, with a capacity to produce 18b
tablets per annum. It has its own Abbreviated New
Drug Applications (ANDAs) and dossiers. GRAN
services more than 300 customers across 60 nations
(exports are ~87% of revenues).
Exhibit 2: Shareholding pattern (%)
Mar-17
Promoter
DII
FII
Others
53.5
1.6
10.0
35.0
Dec-16
51.9
1.2
6.0
40.9
Mar-16
51.1
1.2
6.4
41.3
Source: Capitaline
Exhibit 1: Sensex rebased
Source: MOSL/Bloomberg
Exhibit 3: Top holders
Holder Name
BASAVA SANKARA RAO KOLLI
GOVERNMENT PENSION FUND GLOBAL
SWISS FINANCE CORPORATION (MAURITIUS)
LIMITED
NA
NA
% Holding
1.6
1.5
1.4
0.0
0.0
Source: Capitaline
Note: FII Includes depository receipts
Exhibit 4: Top management
Name
C Krishna Prasad
Uma Devi Chigurupati
V V N K V Prasada Raju
Chaitanya Tummala
Designation
Chairman & Managing
Director
Executive Director
Executive Director
Company Secretary
Exhibit 5: Directors
Name
K B Sankara Rao
A P Kurian
Krishna M Ella
Harsha Chigurupati
Name
A Arun Rao Akinepally
C Parthasarathy
L S Sarma
Source: Capitaline
*Independent
Exhibit 6: Auditors
Name
Dhanunjaya & Haranath
Kumar & Giri
Saurabh Poddar & Associates
Internal
Statutory
Secretarial Audit
Type
Exhibit 7: MOSL forecast v/s consensus
EPS
(INR)
FY17
FY18
FY19
MOSL
forecast
7.3
8.1
11.1
Consensus
forecast
7.0
8.2
11.6
Variation (%)
3.3
-1.2
-3.9
Source: Bloomberg
Source: Capitaline
11 May 2017
7

Disclosures
This document has been prepared by Motilal Oswal Securities Limited (hereinafter referred to as Most) to provide information about the company (ies) and/sector(s), if any, covered in the report and may be distributed by it
and/or its affiliated company(ies). This report is for personal information of the selected recipient/s and does not construe to be any investment, legal or taxation advice to you. This research report does not constitute an
offer, invitation or inducement to invest in securities or other investments and Motilal Oswal Securities Limited (hereinafter referred as MOSt) is not soliciting any action based upon it. This report is not for public distribution
and has been furnished to you solely for your general information and should not be reproduced or redistributed to any other person in any form. This report does not constitute a personal recommendation or take into
account the particular investment objectives, financial situations, or needs of individual clients. Before acting on any advice or recommendation in this material, investors should consider whether it is suitable for their
particular circumstances and, if necessary, seek professional advice. The price and value of the investments referred to in this material and the income from them may go down as well as up, and investors may realize losses
on any investments. Past performance is not a guide for future performance, future returns are not guaranteed and a loss of original capital may occur.
MOSt and its affiliates are a full-service, integrated investment banking, investment management, brokerage and financing group. We and our affiliates have investment banking and other business relationships with a some
companies covered by our Research Department. Our research professionals may provide input into our investment banking and other business selection processes. Investors should assume that MOSt and/or its affiliates are
seeking or will seek investment banking or other business from the company or companies that are the subject of this material and that the research professionals who were involved in preparing this material may educate
investors on investments in such business . The research professionals responsible for the preparation of this document may interact with trading desk personnel, sales personnel and other parties for the purpose of
gathering, applying and interpreting information. Our research professionals are paid on twin parameters of performance & profitability of MOSt.
MOSt generally prohibits its analysts, persons reporting to analysts, and members of their households from maintaining a financial interest in the securities or derivatives of any companies that the analysts cover.
Additionally, MOSt generally prohibits its analysts and persons reporting to analysts from serving as an officer, director, or advisory board member of any companies that the analysts cover. Our salespeople, traders, and
other professionals or affiliates may provide oral or written market commentary or trading strategies to our clients that reflect opinions that are contrary to the opinions expressed herein, and our proprietary trading and
investing businesses may make investment decisions that are inconsistent with the recommendations expressed herein. In reviewing these materials, you should be aware that any or all of the foregoing among other things,
may give rise to real or potential conflicts of interest. MOSt and its affiliated company(ies), their directors and employees and their relatives may; (a) from time to time, have a long or short position in, act as principal in, and
buy or sell the securities or derivatives thereof of companies mentioned herein. (b) be engaged in any other transaction involving such securities and earn brokerage or other compensation or act as a market maker in the
financial instruments of the company(ies) discussed herein or act as an advisor or lender/borrower to such company(ies) or may have any other potential conflict of interests with respect to any recommendation and other
related information and opinions.; however the same shall have no bearing whatsoever on the specific recommendations made by the analyst(s), as the recommendations made by the analyst(s) are completely independent
of the views of the affiliates of MOSt even though there might exist an inherent conflict of interest in some of the stocks mentioned in the research report
Reports based on technical and derivative analysis center on studying charts company's price movement, outstanding positions and trading volume, as opposed to focusing on a company's fundamentals and, as such, may not match with a report on a
company's fundamental analysis. In addition MOST has different business segments / Divisions with independent research separated by Chinese walls catering to different set of customers having various objectives, risk profiles, investment horizon,
etc, and therefore may at times have different contrary views on stocks sectors and markets.
Unauthorized disclosure, use, dissemination or copying (either whole or partial) of this information, is prohibited. The person accessing this information specifically agrees to exempt MOSt or any of its affiliates or employees
from, any and all responsibility/liability arising from such misuse and agrees not to hold MOSt or any of its affiliates or employees responsible for any such misuse and further agrees to hold MOSt or any of its affiliates or
employees free and harmless from all losses, costs, damages, expenses that may be suffered by the person accessing this information due to any errors and delays. The information contained herein is based on publicly
available data or other sources believed to be reliable. Any statements contained in this report attributed to a third party represent MOSt’s interpretation of the data, information and/or opinions provided by that third party
either publicly or through a subscription service, and such use and interpretation have not been reviewed by the third party. This Report is not intended to be a complete statement or summary of the securities, markets or
developments referred to in the document. While we would endeavor to update the information herein on reasonable basis, MOSt and/or its affiliates are under no obligation to update the information. Also there may be
regulatory, compliance, or other reasons that may prevent MOSt and/or its affiliates from doing so. MOSt or any of its affiliates or employees shall not be in any way responsible and liable for any loss or damage that may
arise to any person from any inadvertent error in the information contained in this report. MOSt or any of its affiliates or employees do not provide, at any time, any express or implied warranty of any kind, regarding any
matter pertaining to this report, including without limitation the implied warranties of merchantability, fitness for a particular purpose, and non-infringement. The recipients of this report should rely on their own
investigations.
This report is intended for distribution to institutional investors. Recipients who are not institutional investors should seek advice of their independent financial advisor prior to taking any investment decision based on this
report or for any necessary explanation of its contents.
Most and it’s associates may have managed or co-managed public offering of securities, may have received compensation for investment banking or merchant banking or brokerage services, may have received any
compensation for products or services other than investment banking or merchant banking or brokerage services from the subject company in the past 12 months.
Most and it’s associates have not received any compensation or other benefits from the subject company or third party in connection with the research report.
Subject Company may have been a client of Most or its associates during twelve months preceding the date of distribution of the research report
MOSt and/or its affiliates and/or employees may have interests/positions, financial or otherwise of over 1 % at the end of the month immediately preceding the date of publication of the research in the securities mentioned
in this report. To enhance transparency, MOSt has incorporated a Disclosure of Interest Statement in this document. This should, however, not be treated as endorsement of the views expressed in the report.
Motilal Oswal Securities Limited is registered as a Research Analyst under SEBI (Research Analyst) Regulations, 2014. SEBI Reg. No. INH000000412
Pending Regulatory inspections against Motilal Oswal Securities Limited:
SEBI pursuant to a complaint from client Shri C.R. Mohanraj alleging unauthorized trading, issued a letter dated 29th April 2014 to MOSL notifying appointment of an Adjudicating Officer as per SEBI regulations to hold inquiry
and adjudge violation of SEBI Regulations; MOSL replied to the Show Cause Notice whereby SEBI granted us an opportunity of Inspection of Documents. Since all the documents requested by us were not covered we have
requested to SEBI vide our letter dated June 23, 2015 to provide pending list of documents for inspection.
List of associate companies of Motilal Oswal Securities Limited -Click
here to access detailed report
Analyst Certification
The views expressed in this research report accurately reflect the personal views of the analyst(s) about the subject securities or issues, and no part of the compensation of the research analyst(s) was, is, or will be directly or
indirectly related to the specific recommendations and views expressed by research analyst(s) in this report. The research analysts, strategists, or research associates principally responsible for preparation of MOSt research
receive compensation based upon various factors, including quality of research, investor client feedback, stock picking, competitive factors and firm revenues
Granules India
Disclosure of Interest Statement
Analyst ownership of the stock
No
Served as an officer, director or employee -
No
A graph of daily closing prices of securities is available at www.nseindia.com and http://economictimes.indiatimes.com/markets/stocks/stock-quotes
Regional Disclosures (outside India)
This report is not directed or intended for distribution to or use by any person or entity resident in a state, country or any jurisdiction, where such distribution, publication, availability or use would be contrary to law,
regulation or which would subject MOSt & its group companies to registration or licensing requirements within such jurisdictions.
For Hong Kong:
This report is distributed in Hong Kong by Motilal Oswal capital Markets (Hong Kong) Private Limited, a licensed corporation (CE AYY-301) licensed and regulated by the Hong Kong Securities and Futures
Commission (SFC) pursuant to the Securities and Futures Ordinance (Chapter 571 of the Laws of Hong Kong) “SFO”. As per SEBI (Research Analyst Regulations) 2014 Motilal Oswal Securities (SEBI Reg No. INH000000412) has
an agreement with Motilal Oswal capital Markets (Hong Kong) Private Limited for distribution of research report in Kong Kong. This report is intended for distribution only to “Professional Investors” as defined in Part I of
Schedule 1 to SFO. Any investment or investment activity to which this document relates is only available to professional investor and will be engaged only with professional investors.” Nothing here is an offer or solicitation
of these securities, products and services in any jurisdiction where their offer or sale is not qualified or exempt from registration. The Indian Analyst(s) who compile this report is/are not located in Hong Kong & are not
conducting Research Analysis in Hong Kong.
For U.S.
Motilal Oswal Securities Limited (MOSL) is not a registered broker - dealer under the U.S. Securities Exchange Act of 1934, as amended (the"1934 act") and under applicable state laws in the United States. In addition MOSL is
not a registered investment adviser under the U.S. Investment Advisers Act of 1940, as amended (the "Advisers Act" and together with the 1934 Act, the "Acts), and under applicable state laws in the United States.
Accordingly, in the absence of specific exemption under the Acts, any brokerage and investment services provided by MOSL, including the products and services described herein are not available to or intended for U.S.
persons.
This report is intended for distribution only to "Major Institutional Investors" as defined by Rule 15a-6(b)(4) of the Exchange Act and interpretations thereof by SEC (henceforth referred to as "major institutional investors").
This document must not be acted on or relied on by persons who are not major institutional investors. Any investment or investment activity to which this document relates is only available to major institutional investors
and will be engaged in only with major institutional investors. In reliance on the exemption from registration provided by Rule 15a-6 of the U.S. Securities Exchange Act of 1934, as amended (the "Exchange Act") and
interpretations thereof by the U.S. Securities and Exchange Commission ("SEC") in order to conduct business with Institutional Investors based in the U.S., MOSL has entered into a chaperoning agreement with a U.S.
registered broker-dealer, Motilal Oswal Securities International Private Limited. ("MOSIPL"). Any business interaction pursuant to this report will have to be executed within the provisions of this chaperoning agreement.
The Research Analysts contributing to the report may not be registered /qualified as research analyst with FINRA. Such research analyst may not be associated persons of the U.S. registered broker-dealer, MOSIPL, and
therefore, may not be subject to NASD rule 2711 and NYSE Rule 472 restrictions on communication with a subject company, public appearances and trading securities held by a research analyst account.
For Singapore
Motilal Oswal Capital Markets Singapore Pte Limited is acting as an exempt financial advisor under section 23(1)(f) of the Financial Advisers Act(FAA) read with regulation 17(1)(d) of the Financial Advisors Regulations and is a
subsidiary of Motilal Oswal Securities Limited in India. This research is distributed in Singapore by Motilal Oswal Capital Markets Singapore Pte Limited and it is only directed in Singapore to accredited investors, as defined in
the Financial Advisers Regulations and the Securities and Futures Act (Chapter 289), as amended from time to time.
In respect of any matter arising from or in connection with the research you could contact the following representatives of Motilal Oswal Capital Markets Singapore Pte Limited:
Varun Kumar
Varun.kumar@motilaloswal.com
Contact : (+65) 68189232
Office Address:21 (Suite 31),16 Collyer Quay,Singapore 04931
GRANULES INDIA
Motilal Oswal Securities Ltd
11 May 2017
Motilal Oswal Tower, Level 9, Sayani Road, Prabhadevi, Mumbai 400 025
Phone: +91 22 3982 5500 E-mail: reports@motilaloswal.com
8