Oriental Bank of Commerce
BSE SENSEX
30,188
Bloomberg
Equity Shares (m)
M.Cap.(INRb)/(USDb)
52-Week Range (INR)
1, 6, 12 Rel. Per (%)
Avg Val, INRm
Free float (%)
Financials & Valuations (INR b)
Y/E March
2017 2018E
NII
49.1
52.9
OP
41.7
37.6
NP
NM
5.9
EPS (INR)
-31.6
17.1
EPS Growth (%)
NM
NM
BV/Sh. (INR)
365.3
382.3
RoE (%)
-8.4
4.6
RoA (%)
-0.4
0.2
P/E (x)
-5.2
9.6
P/BV (x)
0.45
0.43
S&P CNX
9,401
OBC IN
Another weak quarter; Stress addition increases to AQR levels
346.2
OBC reported loss of INR12.2b (~2x of FY15 and FY16 PAT combined) v/s est.
43.3 / 0.6
loss of INR1.1b, primarily due to elevated credit costs of INR30.5b (8.2%
138 / 75
annualized, highest in the history of the bank). Asset quality remains under
7/4/4
469
pressure, led by elevated stress additions (INR39b v/s INR27b in 3Q) and
41.6
muted recoveries/upgrades.
12 May 2017
4QFY17 Results Update | Sector: Financials
CMP: INR163
TP: INR150 (-8%)
Neutral
2019E
58.2
41.4
7.4
21.4
25.3
403.7
5.4
0.3
7.6
0.40
Overall pool of NSL (NNPA+ OSRL+ all other forms of stress) was stable QoQ
at ~14.5%; large relapse into NPA from restructured portfolio (INR9.4b) and
SDR/S4A accounts (8 accounts amounting to INR16.9b). Steel accounted for
28% of overall slippages. This sector already has 68% NPA, and management
does not expect incremental large slippages from this book. Absolute GNPAs
increased 12% QoQ, but remained stable in % terms at 13.7% due to strong
sequential loan growth (11%) and large write-offs (INR11b).
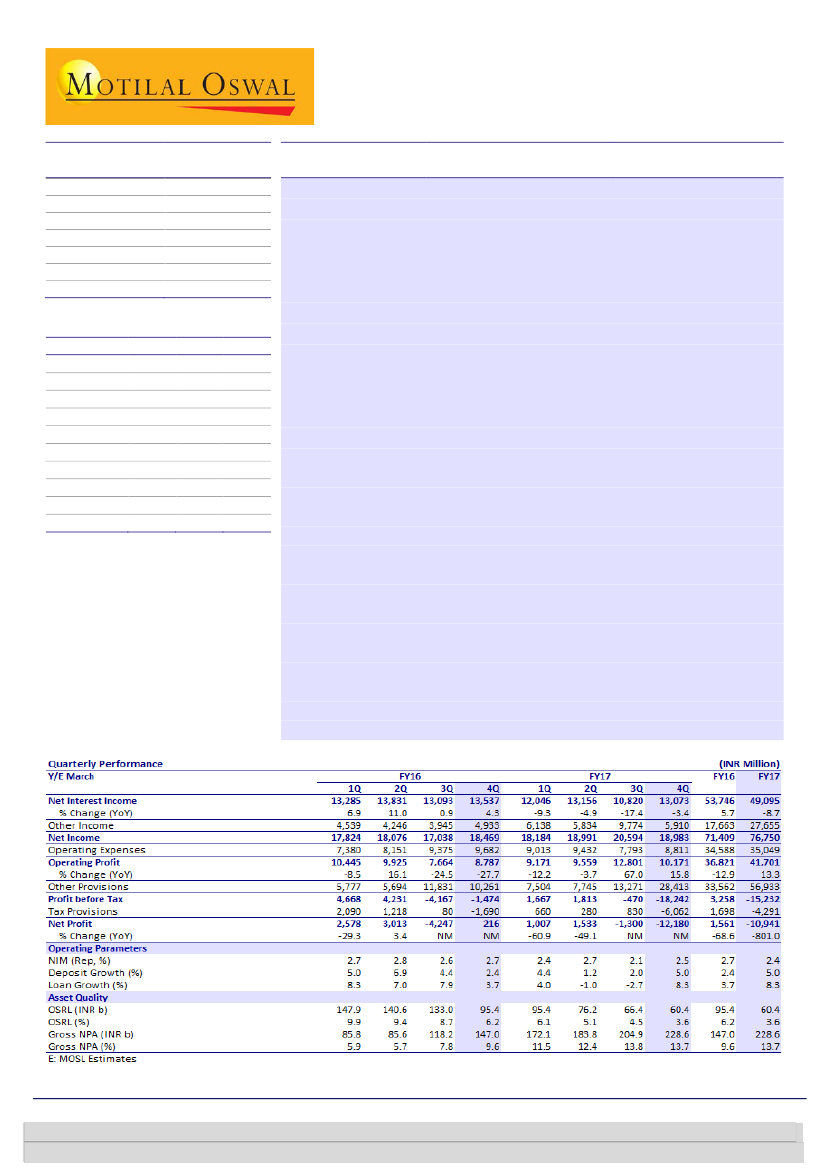
NII grew 21% QoQ to INR13b (in-line), led by NIM improvement of ~40bp
QoQ to 2.5%. NIM was aided by a sharp fall in CoF of ~38bp QoQ.
FY17 highlights:
(1) Operating profit for FY17 grew 13% YoY; however, high
NPL provisions of ~57b led to pre-tax loss. (2) Overall gross advances grew
8.3%, with strong growth in retail loans of ~37.2%.
Other highlights:
(1) Trading gains declined 70% QoQ, driving 15% miss in
other income. (2) CASA ratio declined 180bp QoQ to 30.5% owing to
redemption of temporary SA deposits (-6% QoQ) built up post demon. (3)
CET1 declined 113bp, led by large quantum of losses during the quarter.
Valuation and view:
Sharp rise in slippages continues to remain a concern
for the bank. NPL ageing will result in high expected credit costs in FY18/19.
Return ratios are likely to be sub-optimal at 0.2/5% RoA/RoE, and hence, we
downgrade our earnings by 19% for FY18. Resolutions in key stress sectors
like steel remain a key trigger for the bank. Maintain
Neutral
with a TP of
INR150 (0.4x FY19BV).
Alpesh Mehta
(Alpesh.Mehta@MotilalOswal.com); +91 22 6129 1526
Subham Banka
(Subham.Banka@MotilalOswal.com); +91 022 6129 1567
Investors are advised to refer through important disclosures made at the last page of the Research Report.
Motilal Oswal research is available on www.motilaloswal.com/Institutional-Equities, Bloomberg, Thomson Reuters, Factset and S&P Capital.

Oriental Bank of Commerce
Exhibit 1: Weak core income; higher provisions dent profitability (INR m)
Y/E MARCH
Net Interest Income
% Change (Y-o-Y)
Other Income
Net Income
Operating Expenses
Operating Profit
% Change (Y-o-Y)
Other Provisions
Profit before Tax
Tax Provisions
Net Profit
% Change (Y-o-Y)
4QFY17A
13,073
-3
5,910
18,983
8,811
10,171
16
28,413
-18,242
-6,062
-12,180
NM
4QFY17E
12,720
-6
6,945
19,665
8,536
11,128
27
13,965
-2,836
-1,684
-1,153
NM
Var (%)
3
-15
-3
3
-9
103
NM
NM
NM
Comments
Sharp improvement in NIM and loan growth
Significantly lower trading gains
inline
PPoP miss led by lower than expected trading gains
Elevated stress additions
PBT miss led by elevated credit costs
Weak asset quality continues to drag earnings
Source: MOSL, Company
Overall NSL was stable
QoQ at 14.5%
Asset quality issues persist, PCR improves
GNPA/NNPA stood at 13.7%/8.96% (stable/-72bps QoQ). Steep provisions
helped take up PCR to 53.6% (+245/417bp QoQ)
Slippages of INR39b (-3%/+45% QoQ/YoY, annualized slippages of 10.5%) had a
contribution of INR16.9b from SDR/S4A book.
SDR/S4A/5:25/OSRL (standard) stood at INR16b/5.1b/7.8b/6b, representing a
total of 5.7% of loans. Total net stressed loans were stable QOQ at 14.5%.
Management expects FY18 slippages/credit costs to be lower than in FY17.
Gross loans grew 8.3% YoY
led by robust growth in
retail loans of 37%
Loan growth was muted, but in the right direction; decline in cost of funds
helped NIM grow QoQ
Net loans grew 6% QoQ was driven by healthy growth in retail loan book of
+37% QoQ. MSME book was stable QoQ while agricultural book de-grew 7%
QoQ. The management targets 10% advances growth in FY18 and plans to take
RAM (retail, agri and MSME) to >50% of advances.
CA grew +13%/+40% QoQ/YoY as the bank set up a dedicated marketing team
for institutional customers. CASA ratio declined 175bp QoQ to 30.5% led by
sharp redemption of temporary SA deposits accumulated post demon.
Provisioning at INR30.5b for
the quarter, was the highest
ever in the bank’s history
Other highlights: Elevated provisions continue to drag down earnings
NII grew 21%/-3% QoQ/YoY as NIM declined 11bps YoY to 2.54% even as loan
book grew +11%/+6% QoQ/YoY. NIM increase of 40bps QoQ was driven by
38bps drop in cost of funds and a 28bps increase in yields (from shift in loan mix
to retail).
4QFY17 NII had an interest reversal of INR2.4b from SDR/S4A accounts.
Other income grew -40%/+20% QoQ/YoY (3QFY17 had one-off gains from bond
sales). Trading profits contributed 35% to other income, which may be difficult
to sustain.
Opex growth of +13%/-9% QoQ/YoY was a combined effect of a sharp decline in
employee expenses (-26% /-30bps QoQ/YoY) and a sharp increase in other opex
(+125bps/+25bps QoQ/YoY).
Total provisions at INR28.4bn (NPL provision INR30.6b, annualized credit cost of
8.2%) resulted in loss before tax of INR18.4b even as PPOP grew 16% YoY.
12 May 2017
2

Oriental Bank of Commerce
Valuation and View
Bank’s focus on recalibration of balance sheet (higher share of retail loans) and
prudent utilization of non-core income to clean up the balance sheet is
comforting. The bank is highly levered to economic recovery given the large
stock of stressed loans. Recent development in sectors like steel (~7% of overall
loans) would lead to significant earnings upgrades and reduce the gap between
BV and ABV.
Asset quality continues to disappoint with continued high stress additions,
adversely impacting NIMs (higher interest income reversals) and leading to
elevated credit costs. High slippages from OSR/SDR/S4A remain a major concern
for the bank.
Ageing of NPL provisions will put core earnings under pressure in FY18. As a
result Return ratios are likely to be sub-optimal at 0.2/5% RoA/RoE. We have
cut our estimates FY18/19 EPS estimates by 18-19%.
Valuations at 0.4x PBV FY19 remains attractive, however; gap between BV and
ABV remains meaningful. While ageing of NPLs will continue to mar profitability,
recoveries will be a key trigger and could lead to significant earnings and rating
upgrade. We maintain Neutral on the stock with a RI based target Price of
INR150 (~0.4x 19 BV).
Exhibit 2: We cut estimates for FY18/19 to factor higher provisions
INR B
Net Interest Income
Other Income
Total Income
Operating Expenses
Operating Profits
Provisions
PBT
Tax
PAT
Loans
Deposits
Margins (%)
Credit Cost (%)
RoA (%)
RoE (%)
Old Estimates
FY17
FY18
FY19
48.7
51.9
56.4
28.7
23.6
24.9
77.4
75.6
81.3
34.8
37.4
40.9
42.7
38.2
40.4
42.5
27.2
26.8
0.2
11.0
13.6
0.1
3.7
4.6
0.1
7.3
9.0
1,429 1,601 1,841
2,162 2,400 2,760
2.23
2.22
2.15
3.00
1.75
1.50
0.00
0.28
0.31
0.06
5.18
6.14
Revised Est
FY17
FY18
FY19
49.1
52.9
58.2
27.7
22.9
24.3
76.8
75.7
82.5
35.0
38.2
41.1
41.7
37.6
41.4
56.9
28.6
30.2
-15.2
8.9
11.2
-4.3
3.0
3.8
-10.9
5.9
7.4
1,577 1,703 1,874
2,193 2,413 2,702
2.23
2.27
2.28
4.12
2.05
1.80
-0.44
0.22
0.26
-8.39
4.56
5.44
Change (%)
FY17 FY18
FY19
0.7
1.7
3.2
-3.6
-3.1
-2.6
-0.9
0.2
1.4
0.8
2.1
0.4
-2.2
-1.6
2.5
34.0
5.2
12.8
NM
-18.6 -17.7
NM
-18.6 -17.7
NM
-18.6 -17.7
10.3
6.4
1.8
1.4
0.5
-2.1
Source: Company, MOSL
12 May 2017
3

Oriental Bank of Commerce
Exhibit 3: Return ratios to remain sub-optimal (% of average assets)
Y/E MARCH
Net Interest Income
Fee income
Fee to core Income
Core Income
Operating Expenses
Cost to Core Income
Employee cost
Employee to total exp
Other operating expenses
Core Operating Profit
Trading and others
Operating Profit
Provisions
NPA
Others
PBT
Tax
Tax Rate
RoA
Leverage (x)
RoE
FY10
2.33
0.49
17.31
2.81
1.35
47.95
0.78
57.61
0.57
1.46
0.47
1.94
0.65
0.43
0.23
1.28
0.38
29.3
0.91
18.2
16.5
FY11
2.80
0.44
13.54
3.23
1.27
39.17
0.70
55.40
0.56
1.97
0.20
2.17
0.81
0.63
0.18
1.36
0.36
26.3
1.01
17.0
17.1
FY12
2.49
0.45
15.35
2.94
1.37
46.49
0.80
58.60
0.57
1.57
0.28
1.85
1.01
0.64
0.38
0.84
0.17
19.9
0.67
15.9
10.7
FY13
2.49
0.42
14.41
2.90
1.41
48.52
0.83
59.14
0.58
1.50
0.46
1.95
1.14
0.84
0.30
0.81
0.11
13.5
0.70
16.3
11.5
FY14
2.44
0.43
15.09
2.87
1.39
48.31
0.80
57.48
0.59
1.48
0.49
1.97
1.22
0.80
0.42
0.75
0.21
27.9
0.54
16.9
9.2
FY15
2.26
0.42
15.83
2.68
1.32
49.31
0.73
54.98
0.59
1.36
0.52
1.88
1.59
0.88
0.71
0.28
0.06
21.7
0.22
17.4
3.8
FY16
2.29
0.40
14.77
2.68
1.47
54.85
0.86
58.74
0.61
1.21
0.36
1.57
1.43
1.53
-0.11
0.14
0.07
52.1
0.07
17.7
1.2
FY17
1.99
0.40
16.75
2.39
1.42
59.43
0.85
59.90
0.57
0.97
0.72
1.69
2.31
2.56
-0.25
-0.62
-0.17
28.2
-0.44
18.9
-8.4
FY18E
2.00
0.40
16.52
2.40
1.44
60.28
0.89
61.33
0.56
0.95
0.47
1.42
1.08
1.27
-0.19
0.34
0.12
34.0
0.22
20.4
4.6
FY19E
2.01
0.40
16.56
2.41
1.42
58.90
0.88
62.30
0.53
0.99
0.44
1.43
1.04
1.11
-0.07
0.39
0.13
34.0
0.26
21.3
5.4
Source: Company, MOSL
Exhibit 4: GNPL and NNPL in absolute terms up 12% and 3%
GNPA
NNPA
PCR (incl, tech w/off)
Exhibit 5: Slippages increased 45% sequentially (%)
12.0
10.0
8.0
6.0
4.0
2.0
0.0
Slippage Ratio
Net Slippage Ratio
Source: Company, MOSL
Exhibit 6: Slippages in restructured pool led to the decline
O/s Restructured Loans (INR b)
9.5 9.9 9.4
8.8
8.7
7.6 8.0 7.3 7.2 7.6 7.8 7.7
% of loans
Exhibit 7: Net stress loans declines, yet remain elevated
Net Stressed Loans (%)
6.2 6.1
5.1
4.5
3.6
Source: Company, MOSL
12 May 2017
4

Oriental Bank of Commerce
Exhibit 9: CASA ratio declined 180bp led by redemption of
SA deposits (%)
Exhibit 8: Loan growth picked up in 4Q (+11% QoQ)
15
Deposit YoY Gr. (%)
12
9
7
8
8
8
10
8
6
8
6
8
7
7
Loans YoY Gr. (%)
8
8
4
2
4
(1)
4
4
(3)
5
2
1
13 11
6
8
5
5
5
Source: Company, MOSL
Exhibit 10: NIMs increase 40b QoQ (%)
NIM (%)
2.9 2.8
2.8
2.7 2.7
2.7
2.6 2.7
2.6 2.6
2.8
2.6
2.7
2.4
2.1
2.7
Exhibit 11: Fee income growth improved to 8% YoY
Fee Income (INR m)
3
12 15 12
24
14 9
2
-18
YoY Gr. (%)
4
-11
6
8
2.5
-2
0
-8 -5
Source: Company, MOSL
Exhibit 12: Cost to core income drops QoQ (%)
49 49 50 48
52 52
61 59 60 62 59
45 46
50
55
Exhibit 13: High NPL provisions dampens earnings (INRm)
41
45
Source: Company, MOSL
12 May 2017
5

Oriental Bank of Commerce
Exhibit 14: Quarterly Snapshot
FY16
INR m
Profit and Loss
Net Interest Income
Other Income
Trading profits
Recoveries
Fee income (incl forex)
Total Income
Operating Expenses
Employee
Others
Operating Profits
Provisions
PBT
Taxes
PAT
Asset Quality
GNPA
NNPA
GNPA (%)
NNPA (%)
PCR (Calculated, %)
PCR (Reported, %)
Slippages
Slippage Ratio
Prov. for NPA in qtr
Credit Cost
Restructured loans (INR b)
% to Loans
Ratios (%)
Fees to Total Income
Cost to Core Income
Tax Rate
CASA Reported
Loan/Deposit
Margins Reported (%)
Yield on loans
Yield On Investments
Cost of Deposits
Spreads
NIMs
Balance sheet (INR b)
Deposits
of which CASA Deposits
Current Deposits
Savings Deposits
Gross Advances
1Q
13,285
4,539
1,013
605
2,922
17,824
7,380
4,020
3,359
10,445
5,777
4,668
2,090
2,578
85,770
53,578
5.9
3.8
38
60
16,020
4.7
5,958
1.6
148
9.9
16.4
45.5
44.8
24.2
76.4
11.6
7.6
7.5
2.4
2.7
1,960
475
113
362
1,498
2Q
13,831
4,246
1,283
509
2,454
18,076
8,151
4,508
3,643
9,925
5,694
4,231
1,218
3,013
85,580
51,891
5.7
3.6
39
62
7,699
2.2
4,761
1.3
141
9.4
13.6
50.1
28.8
25.0
75.4
11.4
7.6
7.3
2.5
2.8
1,992
497
128
369
1,501
3Q
13,093
3,945
1,182
457
2,307
17,038
9,375
5,765
3,610
7,664
11,831
-4,167
80
-4,247
118,249
73,594
7.8
5.0
38
56
39,804
11.3
14,504
3.9
133
8.7
13.5
60.9
-1.9
24.7
73.9
11.0
7.6
7.1
2.3
2.6
2,065
510
131
379
1,525
4Q
13,537
4,933
1,372
766
2,795
18,469
9,682
6,023
3,659
8,787
10,261
-1,474
(1,690)
216
147,018
99,322
9.6
6.7
32
51
40,192
11.1
10,865
2.9
95
6.2
15.1
59.3
114.7
25.2
73.5
10.8
7.5
6.9
2.3
2.7
2,089
527
128
399
1,536
1Q
12,046
6,138
1,626
1,465
3,047
18,184
9,013
5,383
3,630
9,171
7,504
1,667
660
1,007
172,089
117,343
11.5
8.1
32
49
34,638
9.5
9,609
2.6
95
6.1
16.8
59.7
39.6
25.9
76.2
10.6
7.5
6.7
2.0
2.4
2,045
530
127
403
1,558
2Q
13,156
5,834
3,339
320
2,175
18,991
9,432
5,617
3,815
9,559
7,745
1,813
280
1,533
183,825
127,482
12.4
8.9
31
48
21,423
5.8
6,875
1.9
76
5.1
11.5
61.5
15.5
26.5
73.8
10.6
7.5
6.5
2.3
2.7
2,015
533
126
407
1,487
FY17
3Q
10,820
9,774
7,025
310
2,439
20,594
7,793
5,759
2,034
12,801
13,271
-470
830
-1,300
204,922
136,881
13.8
9.7
33
49
27,033
7.3
14,296
4.0
66
4.5
11.8
58.8
-176.6
32.3
70.5
9.8
7.3
6.2
1.8
2.1
2,107
679
159
520
1,485
4Q
13,073
5,910
2,081
815
3,014
18,983
8,811
4,234
4,577
10,171
28,413
-18,242
(6,062)
-12,180
228,593
141,178
13.7
9.0
38
54
39,129
10.5
30,506
8.2
60
3.6
15.9
54.8
33.2
30.5
75.9
10.0
7.1
5.9
2.1
2.5
2,193
669
180
489
1,664
28
-21
-30
32
40
4
-2
13
-6
12
-74
-46
-96
-21
-11
5
27
40
23
8
Variation (%)
QoQ
YoY
21
-40
-70
163
24
-8
13
-26
125
-21
114
NM
NM
NM
12
3
-7
-72
504
417
45
321
113
413
-9
-85
-3
20
52
6
8
3
-9
-30
25
16
177
NM
NM
-5,734
55
42
416
226
580
245
-3
-55
181
522
-37
-258
Source: Company, MOSL
12 May 2017
6

Oriental Bank of Commerce
Financials and Valuations
Income Statement
Y/E March
Net Interest Income
Change (%)
Non Interest Income
Net Income
Change (%)
Operating Expenses
Pre Provision Profits
Change (%)
Provisions (excl tax)
PBT
Tax
Tax Rate (%)
PAT
Change (%)
Equity Dividend (Incl tax)
Core PPP*
Change (%)
*Core PPP is (NII+Fee income-Opex)
2011
41,775
43.7
9,601
51,376
25.1
18,925
32,451
34.0
12,065
20,386
5,357
26.3
15,029
32.4
3,527
29,391
60.6
2012
42,158
0.9
12,402
54,560
6.2
23,155
31,406
-3.2
17,148
14,258
2,842
19.9
11,416
-24.0
2,679
26,650
-9.3
2013
47,012
11.5
16,547
63,559
16.5
26,652
36,907
17.5
21,546
15,361
2,081
13.5
13,279
16.3
3,140
28,277
6.1
2014
51,271
9.1
19,453
70,724
11.3
29,169
41,555
12.6
25,751
15,804
4,410
27.9
11,394
-14.2
2,666
31,212
10.4
2015
50,842
-0.8
21,214
72,056
1.9
29,785
42,271
1.7
35,923
6,348
1,377
21.7
4,971
-56.4
1,191
30,622
-1.9
2016
53,746
5.7
17,663
71,409
-0.9
34,588
36,821
-12.9
33,562
3,258
1,698
52.1
1,561
NM
271
28,472
-7.0
2017
49,095
-8.7
27,655
76,750
7.5
35,049
41,701
13.3
56,933
-15,232
-4,291
28.2
-10,941
NM
0
23,927
-16.0
(INR Million)
2018E
52,851
7.6
22,882
75,732
-1.3
38,162
37,571
-9.9
28,623
8,948
3,042
34.0
5,906
-154.0
0
25,146
5.1
2019E
58,235
10.2
24,268
82,503
8.9
41,104
41,399
10.2
30,191
11,208
3,811
34.0
7,397
25.3
0
28,687
14.1
Balance Sheet
Y/E March
Share Capital
Reserves & Surplus
Net Worth
Deposits
Change (%)
of which CASA Dep
Change (%)
Borrowings
Other Liabilities & Prov.
Total Liabilities
Current Assets
Investments
Change (%)
Loans
Change (%)
Fixed Assets
Other Assets
Total Assets
2011
2,918
108,054
110,971
1,390,543
15.6
341,480
13.7
56,392
55,528
1,613,434
116,181
495,454
38.5
959,082
14.9
13,978
28,739
1,613,434
2012
2,918
116,507
119,425
1,559,649
12.2
376,285
10.2
52,590
43,681
1,775,346
87,270
521,013
5.2
1,119,777
16.8
14,207
33,080
1,775,346
2013
2,918
124,838
127,755
1,758,975
12.8
431,845
14.8
76,793
43,448
2,006,972
85,896
585,547
12.4
1,289,551
15.2
12,274
33,705
2,006,972
2014
2,998
131,308
134,307
1,934,890
10.0
470,425
8.9
78,636
55,193
2,203,025
142,689
614,722
5.0
1,390,798
7.9
12,556
42,259
2,203,025
2015
2,998
134,795
137,793
2,040,097
5.4
493,651
4.9
65,450
61,795
2,305,136
107,758
620,387
0.9
1,452,613
4.4
13,525
110,852
2,305,136
2016
3,214
146,197
149,411
2,089,148
2.4
526,902
6.7
101,239
57,882
2,397,680
116,124
662,343
6.8
1,488,800
2.5
22,719
107,694
2,397,680
2017
3,462
137,752
141,214
2,193,394
5.0
668,900
26.9
145,922
50,118
2,530,647
174,262
592,293
-10.6
1,577,060
5.9
23,585
163,448
2,530,647
(INR Million)
2018E
3,462
143,356
146,818
2,412,733
10.0
726,807
8.7
138,626
54,070
2,752,247
194,625
651,522
10.0
1,703,225
8.0
23,083
179,792
2,752,247
2019E
3,462
150,452
153,914
2,702,261
12.0
800,818
10.2
131,695
58,417
3,046,287
222,682
729,705
12.0
1,873,547
10.0
22,581
197,772
3,046,287
Asset Quality
GNPA (INR m)
NNPA (INR m)
GNPA Ratio
NNPA Ratio
PCR (Excl Tech. write off)
PCR (Incl Tech. Write off)
E: MOSL Estimates
19,205
9,382
1.98
0.98
51.2
76.8
35,805
24,590
3.17
2.20
31.3
61.5
41,840
29,027
3.21
2.25
30.6
63.0
56,179
39,044
3.99
2.81
30.5
60.2
76,662
48,162
5.18
3.32
37.2
60.6
147,018
99,322
9.57
6.67
32.4
51.2
228,593
141,178
13.73
8.95
38.2
53.6
238,216
145,262
13.26
8.53
39.0
56.1
(%)
230,383
138,321
11.72
7.38
40.0
59.7
12 May 2017
7

Oriental Bank of Commerce
Financials and Valuations
Ratios
Y/E March
Spreads Analysis (%)
Avg. Yield-Earning Assets
Avg. Yield on loans
Avg. Yield on Investments
Avg. Cost-Int. Bear. Liab.
Avg. Cost of Deposits
Interest Spread
Net Interest Margin
Profitability Ratios (%)
RoE
RoA
Int. Expense/Int.Income
Fee Income/Net Income
Non Int. Inc./Net Income
Efficiency Ratios (%)
Cost/Income*
Empl. Cost/Op. Exps.
Busi. per Empl. (INR m)
NP per Empl. (INR lac)
* ex treasury
Asset-Liability Profile (%)
Loans/Deposit Ratio
CASA Ratio
Investment/Deposit Ratio
G-Sec/Investment Ratio
CAR
Tier 1
2011
8.8
10.0
7.3
5.9
5.8
3.0
3.1
2012
10.1
11.6
7.2
7.6
7.6
2.6
2.7
2013
10.1
11.4
7.0
7.5
7.6
2.5
2.7
2014
9.7
10.9
7.2
7.2
7.2
2.5
2.6
2015
9.7
10.7
7.6
7.2
7.2
2.4
2.5
2016
9.5
10.1
7.6
6.9
6.8
2.6
2.5
2017
8.4
8.4
8.0
6.0
6.0
2.4
2.2
2018E
8.2
8.6
7.1
5.7
5.7
2.5
2.3
2019E
8.0
8.4
6.8
5.5
5.4
2.6
2.3
17.1
1.0
65.4
17.2
18.7
10.7
0.7
73.3
19.6
22.7
11.5
0.7
73.4
23.4
26.0
9.2
0.5
73.0
24.0
27.5
3.8
0.2
74.5
20.9
29.4
1.2
0.1
73.4
17.9
24.7
-8.4
-0.4
73.4
17.7
36.0
4.6
0.2
72.4
19.1
30.2
5.4
0.3
71.6
19.2
29.4
37.4
55.4
132.0
0.9
43.8
58.6
136.9
0.6
43.1
59.1
151.6
0.7
42.7
57.5
163.0
0.6
45.2
55.0
168.8
0.2
52.0
58.7
164.7
0.1
55.9
59.9
181.9
-0.5
56.7
61.3
187.4
0.3
55.5
62.3
198.5
0.3
69.0
24.6
35.6
74.1
14.2
11.2
71.8
24.1
33.4
75.7
12.7
10.1
73.3
24.6
33.3
75.4
12.0
9.2
71.9
24.3
31.8
75.3
11.0
8.9
71.2
24.2
30.4
83.5
11.4
8.7
71.3
25.2
31.7
76.0
11.8
9.1
71.9
30.5
27.0
88.9
11.1
8.5
70.6
30.1
27.0
88.9
10.6
8.1
69.3
29.6
27.0
88.9
10.0
7.7
Valuation
Book Value (INR)
Change (%)
Price-BV (x)
Adjusted BV (INR)
Price-ABV (x)
EPS (INR)
Change (%)
Price-Earnings (x)
Dividend Per Share (INR)
Dividend Yield (%)
E: MOSL Estimates
350.0
19.8
327.5
51.5
13.7
10.4
379.9
8.6
320.9
39.1
-24.0
7.9
414.7
9.1
345.0
45.5
16.3
9.2
426.2
2.8
335.0
38.0
-16.5
7.6
438.8
3.0
0.4
326.4
0.5
16.6
-56.4
9.8
3.3
2.0
418.0
-4.7
0.4
201.7
0.8
4.9
365.3
-12.6
0.4
79.8
2.0
-31.6
-5.2
0.0
0.0
382.3
4.7
0.43
88.6
1.8
17.1
-154.0
9.6
0.0
0.0
403.7
5.6
0.4
124.0
1.3
21.4
25.3
7.6
0.0
0.0
12 May 2017
8

Oriental Bank of Commerce
Corporate profile
Company description
Oriental Bank of Commerce (OBC) was incorporated in
1943 in Lahore. As of December 2016, it had loan book
size of ~INR1.5t and deposits of ~INR2t. It has a wide
distribution network having pan-India presence with a
total of 2,351 branches and 2,585 ATMs. Government
holds 58.3% stake in the bank.
Exhibit 19: Sensex rebased
Exhibit 20:
Shareholding pattern (%)
Mar-17
Promoter
DII
FII
Others
58.4
24.9
6.0
10.8
Dec-16
58.4
21.8
6.5
13.3
Mar-16
55.2
23.9
8.8
12.1
Exhibit 21:
Top holders
Holder Name
Life Insurance Corporation Of India
Hdfc Trustee Company Limited (Hdfc Equity Fund &
National Westminster Bank Plc As Trustee Of The
Jupiter India Fund
% Holding
13.1
4.2
1.2
Note: FII Includes depository receipts
Exhibit 22:
Top management
Name
Chandra Kant Birla
Desh Deepak Khetrapal
Designation
Chairman
Managing Director & CEO
Exhibit 23:
Directors
Name
Amita Birla
Janat Shah
R Jhawar
Rabindranath Jhunjhunwala
Name
Swapan Dasgupta
Vinod Kumar Dhall
*Independent
Exhibit 24:
Auditors
Name
S R Batliboi & Co LLP
Ranjeet Pandey & Associates
Somnath Mukherjee
Type
Statutory
Secretarial Audit
Cost Auditor
Exhibit 25:
MOSL forecast v/s consensus
EPS
(INR)
FY17
FY18
FY19
MOSL
forecast
-31.6
17.1
21.4
Consensus
forecast
2.2
8.4
22.8
Variation
(%)
-1558.2
102.8
-6.1
12 May 2017
9

This document has been prepared by Motilal Oswal Securities Limited (hereinafter referred to as Most) to provide information about the company (ies) and/sector(s), if any, covered in the report and may be distributed by it and/or
Oriental Bank of Commerce
its affiliated company(ies). This report is for personal information of the selected recipient/s and does not construe to be any investment, legal or taxation advice to you. This research report does not constitute an offer, invitation or
inducement to invest in securities or other investments and Motilal Oswal Securities Limited (hereinafter referred as MOSt) is not soliciting any action based upon it. This report is not for public distribution and has been furnished to
you solely for your general information and should not be reproduced or redistributed to any other person in any form. This report does not constitute a personal recommendation or take into account the particular investment
objectives, financial situations, or needs of individual clients. Before acting on any advice or recommendation in this material, investors should consider whether it is suitable for their particular circumstances and, if necessary, seek
professional advice. The price and value of the investments referred to in this material and the income from them may go down as well as up, and investors may realize losses on any investments. Past performance is not a guide
for future performance, future returns are not guaranteed and a loss of original capital may occur.
MOSt and its affiliates are a full-service, integrated investment banking, investment management, brokerage and financing group. We and our affiliates have investment banking and other business relationships with a some
companies covered by our Research Department. Our research professionals may provide input into our investment banking and other business selection processes. Investors should assume that MOSt and/or its affiliates are
seeking or will seek investment banking or other business from the company or companies that are the subject of this material and that the research professionals who were involved in preparing this material may educate
investors on investments in such business . The research professionals responsible for the preparation of this document may interact with trading desk personnel, sales personnel and other parties for the purpose of gathering,
applying and interpreting information. Our research professionals are paid on twin parameters of performance & profitability of MOSt.
MOSt generally prohibits its analysts, persons reporting to analysts, and members of their households from maintaining a financial interest in the securities or derivatives of any companies that the analysts cover. Additionally,
MOSt generally prohibits its analysts and persons reporting to analysts from serving as an officer, director, or advisory board member of any companies that the analysts cover. Our salespeople, traders, and other professionals or
affiliates may provide oral or written market commentary or trading strategies to our clients that reflect opinions that are contrary to the opinions expressed herein, and our proprietary trading and investing businesses may make
investment decisions that are inconsistent with the recommendations expressed herein. In reviewing these materials, you should be aware that any or all of the foregoing among other things, may give rise to real or potential
conflicts of interest. MOSt and its affiliated company(ies), their directors and employees and their relatives may; (a) from time to time, have a long or short position in, act as principal in, and buy or sell the securities or derivatives
thereof of companies mentioned herein. (b) be engaged in any other transaction involving such securities and earn brokerage or other compensation or act as a market maker in the financial instruments of the company(ies)
discussed herein or act as an advisor or lender/borrower to such company(ies) or may have any other potential conflict of interests with respect to any recommendation and other related information and opinions.; however the
same shall have no bearing whatsoever on the specific recommendations made by the analyst(s), as the recommendations made by the analyst(s) are completely independent of the views of the affiliates of MOSt even though
there might exist an inherent conflict of interest in some of the stocks mentioned in the research report
Reports based on technical and derivative analysis center on studying charts company's price movement, outstanding positions and trading volume, as opposed to focusing on a company's fundamentals and, as such, may not
match with a report on a company's fundamental analysis. In addition MOST has different business segments / Divisions with independent research separated by Chinese walls catering to different set of customers having various
objectives, risk profiles, investment horizon, etc, and therefore may at times have different contrary views on stocks sectors and markets.
Unauthorized disclosure, use, dissemination or copying (either whole or partial) of this information, is prohibited. The person accessing this information specifically agrees to exempt MOSt or any of its affiliates or employees from,
any and all responsibility/liability arising from such misuse and agrees not to hold MOSt or any of its affiliates or employees responsible for any such misuse and further agrees to hold MOSt or any of its affiliates or employees free
and harmless from all losses, costs, damages, expenses that may be suffered by the person accessing this information due to any errors and delays. The information contained herein is based on publicly available data or other
sources believed to be reliable. Any statements contained in this report attributed to a third party represent MOSt’s interpretation of the data, information and/or opinions provided by that third party either publicly or through a
subscription service, and such use and interpretation have not been reviewed by the third party. This Report is not intended to be a complete statement or summary of the securities, markets or developments referred to in the
document. While we would endeavor to update the information herein on reasonable basis, MOSt and/or its affiliates are under no obligation to update the information. Also there may be regulatory, compliance, or other reasons
that may prevent MOSt and/or its affiliates from doing so. MOSt or any of its affiliates or employees shall not be in any way responsible and liable for any loss or damage that may arise to any person from any inadvertent error in
the information contained in this report. MOSt or any of its affiliates or employees do not provide, at any time, any express or implied warranty of any kind, regarding any matter pertaining to this report, including without limitation
the implied warranties of merchantability, fitness for a particular purpose, and non-infringement. The recipients of this report should rely on their own investigations.
This report is intended for distribution to institutional investors. Recipients who are not institutional investors should seek advice of their independent financial advisor prior to taking any investment decision based on this report or
for any necessary explanation of its contents.
Most and it’s associates may have managed or co-managed public offering of securities, may have received compensation for investment banking or merchant banking or brokerage services, may have received any compensation
for products or services other than investment banking or merchant banking or brokerage services from the subject company in the past 12 months.
Most and it’s associates have not received any compensation or other benefits from the subject company or third party in connection with the research report.
Subject Company may have been a client of Most or its associates during twelve months preceding the date of distribution of the research report
MOSt and/or its affiliates and/or employees may have interests/positions, financial or otherwise of over 1 % at the end of the month immediately preceding the date of publication of the research in the securities mentioned in this
report. To enhance transparency, MOSt has incorporated a Disclosure of Interest Statement in this document. This should, however, not be treated as endorsement of the views expressed in the report.
Motilal Oswal Securities Limited is registered as a Research Analyst under SEBI (Research Analyst) Regulations, 2014. SEBI Reg. No. INH000000412
Pending Regulatory inspections against Motilal Oswal Securities Limited:
SEBI pursuant to a complaint from client Shri C.R. Mohanraj alleging unauthorized trading, issued a letter dated 29th April 2014 to MOSL notifying appointment of an Adjudicating Officer as per SEBI regulations to hold inquiry and
adjudge violation of SEBI Regulations; MOSL replied to the Show Cause Notice whereby SEBI granted us an opportunity of Inspection of Documents. Since all the documents requested by us were not covered we have requested
to SEBI vide our letter dated June 23, 2015 to provide pending list of documents for inspection.
List of associate companies of Motilal Oswal Securities Limited -
Click here to access detailed report
Analyst Certification
The views expressed in this research report accurately reflect the personal views of the analyst(s) about the subject securities or issues, and no part of the compensation of the research analyst(s) was, is, or will be directly or
indirectly related to the specific recommendations and views expressed by research analyst(s) in this report. The research analysts, strategists, or research associates principally responsible for preparation of MOSt research
receive compensation based upon various factors, including quality of research, investor client feedback, stock picking, competitive factors and firm revenues
Disclosure of Interest Statement
Analyst ownership of the stock
Served as an officer, director or employee -
Oriental
Bank of India
No
No
Disclosures
A graph of daily closing prices of securities is available at www.nseindia.com and http://economictimes.indiatimes.com/markets/stocks/stock-quotes
Regional Disclosures (outside India)
This report is not directed or intended for distribution to or use by any person or entity resident in a state, country or any jurisdiction, where such distribution, publication, availability or use would be contrary to law, regulation or
which would subject MOSt & its group companies to registration or licensing requirements within such jurisdictions.
For Hong Kong:
This report is distributed in Hong Kong by Motilal Oswal capital Markets (Hong Kong) Private Limited, a licensed corporation (CE AYY-301) licensed and regulated by the Hong Kong Securities and Futures
Commission (SFC) pursuant to the Securities and Futures Ordinance (Chapter 571 of the Laws of Hong Kong) “SFO”. As per SEBI (Research Analyst Regulations) 2014 Motilal Oswal Securities (SEBI Reg No. INH000000412)
has an agreement with Motilal Oswal capital Markets (Hong Kong) Private Limited for distribution of research report in Kong Kong. This report is intended for distribution only to “Professional Investors” as defined in Part I of
Schedule 1 to SFO. Any investment or investment activity to which this document relates is only available to professional investor and will be engaged only with professional investors.” Nothing here is an offer or solicitation of
these securities, products and services in any jurisdiction where their offer or sale is not qualified or exempt from registration. The Indian Analyst(s) who compile this report is/are not located in Hong Kong & are not conducting
Research Analysis in Hong Kong.
For U.S.
Motilal Oswal Securities Limited (MOSL) is not a registered broker - dealer under the U.S. Securities Exchange Act of 1934, as amended (the"1934 act") and under applicable state laws in the United States. In addition MOSL is
not a registered investment adviser under the U.S. Investment Advisers Act of 1940, as amended (the "Advisers Act" and together with the 1934 Act, the "Acts), and under applicable state laws in the United States. Accordingly, in
the absence of specific exemption under the Acts, any brokerage and investment services provided by MOSL, including the products and services described herein are not available to or intended for U.S. persons.
This report is intended for distribution only to "Major Institutional Investors" as defined by Rule 15a-6(b)(4) of the Exchange Act and interpretations thereof by SEC (henceforth referred to as "major institutional investors"). This
document must not be acted on or relied on by persons who are not major institutional investors. Any investment or investment activity to which this document relates is only available to major institutional investors and will be
engaged in only with major institutional investors. In reliance on the exemption from registration provided by Rule 15a-6 of the U.S. Securities Exchange Act of 1934, as amended (the "Exchange Act") and interpretations thereof by
the U.S. Securities and Exchange Commission ("SEC") in order to conduct business with Institutional Investors based in the U.S., MOSL has entered into a chaperoning agreement with a U.S. registered broker-dealer, Motilal
Oswal Securities International Private Limited. ("MOSIPL"). Any business interaction pursuant to this report will have to be executed within the provisions of this chaperoning agreement.
The Research Analysts contributing to the report may not be registered /qualified as research analyst with FINRA. Such research analyst may not be associated persons of the U.S. registered broker-dealer, MOSIPL, and
therefore, may not be subject to NASD rule 2711 and NYSE Rule 472 restrictions on communication with a subject company, public appearances and trading securities held by a research analyst account.
For Singapore
Motilal Oswal Capital Markets Singapore Pte Limited is acting as an exempt financial advisor under section 23(1)(f) of the Financial Advisers Act(FAA) read with regulation 17(1)(d) of the Financial Advisors Regulations and is a
subsidiary of Motilal Oswal Securities Limited in India. This research is distributed in Singapore by Motilal Oswal Capital Markets Singapore Pte Limited and it is only directed in Singapore to accredited investors, as defined in the
Financial Advisers Regulations and the Securities and Futures Act (Chapter 289), as amended from time to time.
In respect of any matter arising from or in connection with the research you could contact the following representatives of Motilal Oswal Capital Markets Singapore Pte Limited:
Varun Kumar
Varun.kumar@motilaloswal.com
Contact : (+65) 68189232
Office Address:21 (Suite 31),16 Collyer Quay,Singapore 04931
Motilal Oswal Securities Ltd
12 May 2017
Motilal Oswal Tower, Level 9, Sayani Road, Prabhadevi, Mumbai 400 025
Phone: +91 22 3982 5500 E-mail: reports@motilaloswal.com
10