19 May 2017
Corporate performance
4QFY17: Expectations v/s delivery
Today’s top research idea
Yes: Annual report analysis - A much stronger liability franchise
v
YES’ annual report analysis suggests strong performance across parameters in
a challenging environment. Liability franchise has strengthened significantly,
with sustained improvement in CASA, improving deposit concentration ratios,
and more favorable ALM profile.
v
YES reported ~76bp GNPA for FY16, whereas the RBI estimated 5% GNPA.
While rule-based accounting (90dpd) allows banks to classify some accounts
as standard, RBI may ask banks to classify accounts with inherent weaknesses
as NPAs. Bank has fully accounted for divergences in FY17.
v
Loan market share increased to 1.7% of the system, while return ratios have
been robust – RoA of 1.8% and RoE of 20%. Recent capital raising (INR49b)
provides cushion for future growth. YES remains our top pick among mid-sized
private banks. Reiterate Buy, with a TP of INR2,110/share.
(no of
companies)
Sales
EBIDTA
PAT
Growth (YoY, %)
MOSL
Nifty
Sensex
(100)
(27)
(16)
13.7
11.5
11.5
15.7
33.4
7.7
14.9
6.2
14.9
Research covered
Cos/Sector
Key Highlights
FY17 annual report analysis – A much stronger liability franchise
Capitalizing on multiple opportunities; NBFC and Pharma are key value drivers
GST council finalizes tax rates
Driving value through simplification
Below est.; BS3-related discount, adverse mix, high RM cost hurt margins
Stress additions remain elevated; provisions mar earnings
Results better on all fronts
Highly uncertain operating environment leads to downgrade to Neutral
Robust operating performance supported by impressive asset quality
Dhariwal starts full supplies to Noida PPA
Demon hangover remains, ad growth under pressure
Subdued performance; Household Insecticides declines again
Rail margins impacted; Maintain Buy
Ad pain continues; contained opex salvages margins
EBITDA disappointment led by lower realizations
IPM delivered moderate growth in April 2017
GSK Pharma | Grasim Inds | HT Media | Just Dial | SBI
Yes Bank
Piramal Enterprises
GST
CESC
Bajaj Auto
Bank of Baroda
Pidilite Inds
United Breweries
Muthoot Finance
CESC
D B Corp
Jyothy Lab
Gateway Distripark
Hindustan Media
JK Lakshmi Cement
Healthcare
Results Expectation
Market snapshot
Equities - India
Close
Chg .%
Sensex
30,435
-0.7
Nifty-50
9,429
-1.0
Nifty-M 100
18,030
-2.3
Equities-Global
Close
Chg .%
S&P 500
2,366
0.4
Nasdaq
6,055
0.7
FTSE 100
7,436
-0.9
DAX
12,590
-0.3
Hang Seng
10,271
-1.1
Nikkei 225
19,554
1.3
Commodities
Close
Chg .%
Brent (US$/Bbl)
52
1.0
Gold ($/OZ)
1,264
1.5
Cu (US$/MT)
5,562
-0.5
Almn (US$/MT)
1,921
0.0
Currency
Close
Chg .%
USD/INR
64.9
1.2
USD/EUR
1.1
0.2
USD/JPY
111.0
-1.4
YIELD (%)
Close
1MChg
10 Yrs G-Sec
6.7
0.0
10 Yrs AAA Corp
7.8
0.0
Flows (USD b)
18-May
MTD
FIIs
-0.1
0.7
DIIs
0.1
0.2
Volumes (INRb)
18-May
MTD*
Cash
325
297
F&O
8,650
4,776
Note: YTD is calendar year, *Avg
YTD.%
14.3
15.2
25.6
YTD.%
5.7
12.5
4.1
9.7
9.3
2.3
YTD.%
-6.2
9.0
0.7
12.7
YTD.%
-4.4
5.6
-5.3
YTDchg
0.2
0.3
YTD
7.0
1.8
YTD*
284
4,655
Piping hot news
12-18% GST rate for most products; foodgrain exempted, 5% tax on coal
v
The Goods and Services Tax (GST) Council, at its meeting in Srinagar on
Thursday, approved rates for about 1,200 items…
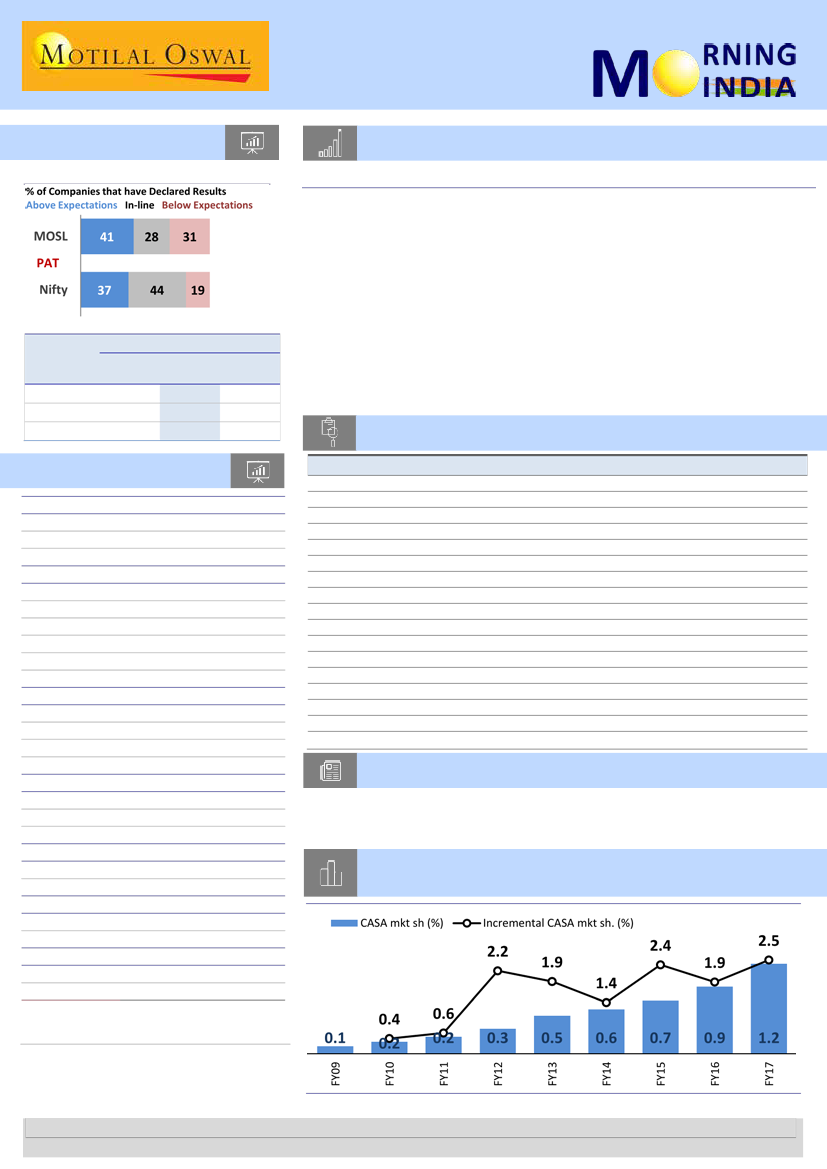
Chart of the Day: YES - A strengthening liability franchise:
Incremental CASA market share of 2.5%+
Quote of the day
The real key to making money in stocks is
not to get scared out of them
Research Team (Gautam.Duggad@MotilalOswal.com)
Motilal Oswal research is available on www.motilaloswal.com/Institutional-Equities, Bloomberg, Thomson Reuters, Factset and S&P Capital.
Investors are advised to refer through important disclosures made at the last page of the Research Report.

In the news today
Kindly click on numbers for the detailed news link
1
Bankers to take over Jaypee's
land bank to recover loans
Lenders to Jaiprakash Associates
have decided to take control of
the company’s vast land bank to
recover their loans worth Rs
13,000 crore. The land bank will,
however, be liquidated at a later
date, the lenders decided at a
meeting in Mumbai on Thursday…
2
The domestic airlines flew 91.34 lakh passengers in April this year
registering a growth of 15.15 per cent over the 79.32 lakh passengers
flown during the same period last year. The latest data released by the
Directorate General of Civil Aviation shows that IndiGo carried the
maximum number of passengers during the month at 37.79 lakh, followed
by Jet Airways (13.90 lakh) with Air India at the number three spot with
11.80 lakh passengers. SpiceJet flew 11.77 lakh passengers while GoAir
carried 7.40 lakh, AirAsia — 2.98 lakh and Vistara —2.97 lakh passengers
during April…
Domestic airlines carried 15% more passengers in April
3
Kotak Mahindra Bank gets
board nod for raising foreign
investor limit to 43%
The board of directors of Kotak
Mahindra Bank has approved
increasing the shareholding of
foreign portfolio investors (FPIs)
in the lender to 43 per cent from
the current limit of 42 per cent.
The increase in FII/FPI ceiling limit
is subject to statutory/ regulatory
approvals as may be necessary…
4
RP Sanjiv Goenka’s CESC splits
into four companies
The RP-Sanjiv Goenka Group
flagship, CESC Ltd demerged its
businesses into four different
companies — power generation,
electricity distribution, retail
(Spencer’s Retail) and other
ventures. The new entities are to
be listed by October 1...
5
Given the states’ demand that
one-time improvement (OTI)
works on national highways be
funded by the Centre, the
ministry of road transport and
highways (MoRTH) has directed
the National Highways Authority
of India (NHAI) to carry out such
works out of budgetary
allocations or borrowed funds.…
NHAI to take up one-time
upgrade of highways
6
GST Council meeting:
Consensus builds for 1 July
rollout
The goods and services tax (GST)
Council on Thursday backed the 1
July deadline for rolling out the
unified indirect tax that will help
create a single national market,
and ensured that items of mass
consumption bear the least tax
burden…
7
The Reserve Bank of India (RBI) on
Thursday relaxed the branch
authorization policy, bringing all
branches and fixed business
correspondent outlets under the
definition of banking outlets and
removing restrictions on opening
branches in Tier 1 centres…
RBI revises definition of what
constitutes a bank branch
19 May 2017
2

18 May 2017
Annual Report Update | Sector: Financials
Yes Bank
Buy
BSE SENSEX
30,435
S&P CNX
9,429
CMP: INR1,401
TP: INR2,110 (+51%)
FY17 annual report analysis: A much stronger liability franchise
Net stress loans at just ~2.2%, despite accounting for divergence
n
Stock Info
Bloomberg
Equity Shares (m)
52-Week Range (INR)
1, 6, 12 Rel. Per (%)
M.Cap. (INR b)
M.Cap. (USD b)
12M Avg Val (INR M)
Free float (%)
YES IN
456.5
1653 / 963
-17/2/26
639.5
9.4
3862
79.8
n
n
Financials Snapshot (INR b)
Y/E March
2017 2018E 2019E
NII
58.0
74.8
95.3
OP
58.4
69.7
88.4
NP
33.3
41.3
52.0
NIM (%)
3.4
3.5
3.6
EPS (INR)
73.0
90.5 114.0
EPS Gr. (%)
20.8
24.1
25.9
BV/Sh. (INR)
468.7 540.7 631.5
ABV/Sh. (INR)
453.4 533.7 622.1
RoE (%)
18.9
17.9
19.4
RoA (%)
1.8
1.7
1.8
P/E(X)
19.2
15.5
12.3
P/BV (X)
3.0
2.6
2.2
Shareholding pattern (%)
Mar-17 Dec-16 Mar-16
As On
Promoter
20.2
21.8
21.9
DII
23.3
23.8
24.3
FII
46.7
42.0
41.3
Others
9.9
12.4
12.6
FII Includes depository receipts
Stock Performance (1-year)
Yes Bank
Sensex - Rebased
1,750
1,550
1,350
1,150
950
n
YES’ annual report analysis (AR) suggests strong performance across parameters in a
period marred by significant economic challenges. Liability franchise has
strengthened significantly, with sustained improvement in CASA ratio to 36.3% (up
820bp), improving deposit concentration ratios, and more favorable ALM profile. This
has also benefitted NIM and increased fee income streams.
The bank has increased its loan market share to 1.7% of the system, while
maintaining strong return ratios – RoA of 1.8% and RoE of 20%. YES is consuming
capital at a fast pace – steep increase in RWA; recent capital raising (INR49b)
provides cushion for future growth.
YES reported ~76bp GNPA for FY16, whereas the RBI estimated 5% GNPA. The
divergence was owing to the fact that while rule-based accounting (90dpd) allows
banks to classify some accounts as standard, RBI may ask banks to classify accounts
with inherent weaknesses as NPAs. From FY17 onwards, reporting of the divergence
is a mandatory disclosure in the AR. Bank has fully accounted for divergences in FY17.
YES remains our top pick among mid-sized private banks, with healthy capitalization
(CET1 of 11.4%), strong capital allocation (best in class RoE), and market-leading
growth rates (expect at least 2x industry growth). We reiterate Buy, with a target
price of INR2,110/share.
Divergences fully accounted for; no recognition impact in ensuing quarters
n
n
n
Of the total divergence of ~INR41.8b reported in the AR, INR10.4b is
outstanding as NPA, with the balance amount repaid, exited, or recovered in
some manner. The bank expects recoveries in one large account amounting to
INR9.1b (part of the o/s INR10.4b NPA).
Large part of the recoveries and upgrades (INR12.2b), and ARC sales (INR9.6b)
was driven by divergence-related accounts. Our analysis suggests that over
INR12b have been repaid in the normal course of business during the year
(INR41.8b divergence = INR10.4b still NPA + INR10b recoveries/upgrades +
INR9b sold to ARC + INR12.4b repaid).
We expect other banks, particularly private corporate lenders, to report
significant divergence in their AR, as well – ICICIBC has reported INR53.8b
(1.2% of loans) and AXSB has reported INR94.8b (2.5% of loans) in their results
conference calls. Even after taking ‘divergence accounts’ into consideration,
YES’ o/s net stress loans stand at 2.2% v/s 8% for ICICIBC and 5% for AXSB.
YES has invested heavily in branches (23% 5-year CAGR), employees (3.5x
increase since FY12), and rollout of complete product suite. Improvement in
productivity is evident, with average SA balance per branch increasing to
INR286m in FY17 v/s INR221m in FY16 and INR58m in FY12.
Resultantly, CASA ratio improved sharply in FY17 (up 820bp) to 36.3% (15% in
FY12), led by robust 61% growth in SA deposits. We believe YES’ customer
strategy of targeting cash rich regions is paying off, given that it has maintained
incremental SA market share of 1.5%+ over the last three years.
3
Stark improvement in balance sheet granularity
n
n
19 May 2017

n
n
Concentration ratios of top-20 customers have improved – top-20 deposits at
11.1% (v/s 11.7% in FY16) and top-20 loans at 12.4% (v/s 13.8% in FY16).
Liability profile is improving sharply, with the less than one-year maturity
deposits declining to 56% of total deposits v/s 64% a year ago and ~85% in FY12.
Capital consumption high; sufficient Tier-1 post recent capital raising
n
n
n
Strong loan growth (~35%) has come at high capital consumption – risk-
weighted assets grew 40% and stood at 87% of total assets v/s 80% in FY16 and
71% in FY12.
The recent capital raising of INR49b (~30% of pre-issue net worth) added
~300bp to Tier-1 ratio. YES also raised INR30b in AT1 bonds during the year.
Hence, Tier-1 capital improved to 13.3% v/s 10.3% a year ago, despite 40%
growth in RWA.
The bank has regularly maintained ~2.1% return on risk-weighted assets, which
despite the high risk weights, continues to be on the higher side v/s peers.
Strong core profitability; return ratios remain robust
n
n
n
Net income growth has been robust at 37%, led by strong loan growth (+35%
YoY), stable margin profile (3.4% NIM), and increasing fee income contribution
(1.5% of assets).
Core PPoP as a percentage of assets has increased steadily to 2.7% v/s 2.3% in
FY12; the bank has contained credit costs at less than 0.3% of assets, thereby
ensuring wide gap between operating profitability and NPL provisions.
RoA improved to 1.8% v/s 1.7% in FY16 and 1.5% in FY12 – at par with the
leading banks in the system. YES has been able to maintain industry-leading RoE
of 20%+, despite frequent capital raising over the last five years.
Other takeaways from annual report
n
n
n
n
n
n
n
Share of overseas loans has increased from 1.5% in FY16 to 4.6% in FY17 led by
strong business growth in GIFT City – YES has already crossed the USD1b
transactions mark here. Bulk of overseas loans is syndicated.
Share of non-interest income as a percentage of assets increased to 2.2% v/s
1.8% in FY16, even as the proportion of off-balance sheet items to on-balance
sheet assets decreased to 1.8x v/s 2x in FY16. Fees grew 43% to INR35b, with
share of retail fees increasing to ~30% v/s 25% a year ago. Trading gains as a
percentage of PBT increased to 14% v/s 7% in FY16.
PCR declined to ~47% v/s 62% in FY16, led by divergence-related NPL formation
during the quarter. With expected normalization in slippages in FY18 and
recovery in the large account (INR9.1b), PCR may increase.
Share of secured loans increased to ~74% of loans v/s ~68% in FY16 and just
~45% in FY12.
Outstanding real estate advances (largely residential real estate) stood at
INR109.3b (8% of loans) v/s 10% a year ago.
YES Securities reported PAT of INR98m v/s a loss of INR98m a year ago. Total
revenue grew 1.6x to INR638m.
The bank granted 0.4% of equity as ESOPs during the year; 0.7% of equity is
diluted on account of exercise of ESOPs. Outstanding ESOPs have exhibited a
declining trend and stand at 3.7% v/s 4.6% in FY16 and 5.5% in FY13.
4
19 May 2017

Valuation and view
n
n
n
n
n
n
n
We see divergence-related issues and surrounding noise as transitory. Despite
the significant recognition during the year, YES has best in class net stress loans
of ~2.2% v/s peer corporate lenders like ICICIBC (11.8%) and AXSB (4.7%).
With continued investment in franchise, people and processes, YES is well
positioned to leverage the opportunity that the Indian economy presents. It has
strong capitalization (CET1 of ~11.4%); branch network has increased to 1,000
v/s 214 in FY11, and employee strength is up at 20,000+ v/s 3,929 in FY11.
Comfortable liquidity, low inflation and bulk deposit rates are significant
positives from the perspective of NIM (higher short-term liabilities) and bond
gains (~9% share of corporate bonds in customer assets). Further, the bank has
room to reduce savings deposits rate, leading to margin stability. Stable/
improving NIM and traction in fees will keep core PPP CAGR strong at ~27% over
FY17-20, despite strong investments in building liability franchise.
With an incremental market share of 3.5%+, aggressive roll-out of retail/SME
products and strong corporate relationships, YES is expected to register loan
CAGR (FY17-20) of 28% – at least 2x system loan growth.
YES has a well-laid strategy for growing small business loans (most of which
qualify as priority sector loans) and cross-selling to acquired customers; On the
balance sheet front, the bank’s initial focus will be on growing the liability side
first, and as customer relationships age, focus would be on cross-selling retail
assets. The bank has been expanding its branch network at an increasing pace.
YES’ total stress loans (NNPA+OSLR+SDR+5:25+S4A) remain one of the lowest in
the industry at ~2.2%. Robust loan growth, NIM expansion (~30bp led by capital
raising, higher CASA and share of retail loans), and rising fee income
contribution are expected to drive a ~25% PAT CAGR through FY20. This will see
RoA remaining healthy at 1.8% and RoE being maintained at ~20%.
The stock trades at 2.4x FY19E BV and 13.1x FY19E EPS. We
reiterate Buy
with a
target price of INR2,110 (3.3x FY19E BV), based on residual income model
(average growth of ~18% over FY16-36, terminal growth of 5%, 14.2% cost of
equity – risk-free rate of 7%, beta of 1.4, and 5% market risk premium).
Exhibit 1. We revisit estimates post the annual report analysis
INR B
NII
Other Income
Total Income
Opex
Operating Profits
Provisions
PBT
Tax
PAT
Old Est.
FY18
FY19
76.6
97.6
46.4
57.5
123.0
155.1
52.1
65.1
70.9
89.9
8.5
11.9
62.4
78.0
20.3
25.0
42.1
53.0
New Est.
FY18
FY19
74.8
95.3
46.4
57.5
121.2
152.8
51.5
64.3
69.7
88.4
8.5
11.9
61.2
76.5
19.9
24.5
41.3
52.0
% Change
FY18
FY19
-2.4
-2.4
0.0
0.0
-1.5
-1.5
-1.2
-1.2
-1.7
-1.7
0.0
0.0
-1.9
-1.9
-1.9
-1.9
-1.9
-1.9
19 May 2017
5

Piramal Enterprises
BSE SENSEX
30,435
S&P CNX
9,429
18 May 2017
Update
| Sector:
Financials
CMP: INR2,798
TP: INR3,044 (+9%)
Buy
Capitalizing on multiple opportunities
NBFC and Pharma are key value drivers
Our Initiating coverage report on
Piramal Enterprises
n
n
n
Stock Info
Bloomberg
Equity Shares (m)
52-Week Range (INR)
1, 6, 12 Rel. Per (%)
M.Cap. (INR b)
M.Cap. (USD b)
Avg Val, INRm
Free float (%)
PIEL IN
172.6
2942 / 1322
20/77/81
488.5
7.5
291
48.6
2019E
143.4
43.4
25.6
166.8
34
960
34.0
17.0
2.9
2.0
Piramal Enterprises (PIEL) has carved a niche for itself in wholesale lending, and is
now one of the dominant players in most of the segments in which it operates. In the
lending business, the company has one of the lowest GNPAs and the highest
profitability. Post the initial years of lower-tenure loan book, PIEL is moving toward
secured and higher-tenure products, which provides support to growth. We expect a
40% loan CAGR in the NBFC business.
The Pharma business has demonstrated strong growth and improvement in
profitability in recent years. With its focus on building a portfolio via inorganic
acquisitions and the impending closure of the imaging business, we expect a sharp
improvement in profitability.
Over last five years, the stock has delivered 44% CAGR returns, and since our
initiation three months ago (Initiation
report),
it has run up 54%. Led by strong macro
tailwinds and healthy profitability, we raise the target multiple for financial services
to 3.6x from 2.7x (in line with peers). Our revised SOTP is INR3,044. Our target price
does not factor in the proposed capital raise of INR50b (~10% dilution), which, in our
view, would be largely utilized for the financial services business.
Product diversification – key to its success story in NBFC space
Since its foray into the financial services business in FY12, PIEL has exhibited a loan
book CAGR of over 100%, mainly driven by its focus on catering to all the needs of
developers – right from equity capital for land purchase to last mile inventory
funding. The company has significantly expanded its product suite over the years,
with new products such as construction finance and LRD contributing to
incremental loan growth. We believe this has been the key to Piramal’s success
story, as product diversification reduces dependence on any single product for
growth and mitigates asset quality risks.
Financials Snapshot (INR b)
Y/E March
2017 2018E
Revenues
85.5 116.8
EBITDA
22.5
34.8
PAT
10.8
19.1
EPS (INR)
72.6 124.6
EPS Gr. (%)
38
72
BV/Sh. (INR)
768
850
Payout (%)
33.8
34.0
Valuations
P/E (x)
39.0
22.7
P/BV (x)
3.7
3.3
Div. Yield (%)
0.9
1.5
Pharma business on a turnaround path
We expect Pharma revenue CAGR of ~20% till FY20, driven by (1) recent
acquisitions (leading to an increase in the addressable market size to USD20b in
FY18 from USD1b in FY16), (2) expansion into new areas and ADC manufacturing
capacity and (3) capacity expansion at other facilities. The global pharma business
(90% of revenue) enjoys a strong operating margin of 20%+, but the domestic
business has a low-single-digit margin. Imaging business, which was a drag on
profitability, is likely to wind down by CY17, driving overall margins higher. We
expect a strong turnaround in this business, with the EBITDA margin expanding to
~20.5% by FY19 (up ~600bp v/s FY17) and a revenue CAGR of 20%.
Shareholding pattern (%)
As On
Mar-17 Dec-16 Mar-16
Promoter
51.4
51.4
51.6
DII
3.6
3.5
3.5
FII
28.7
28.5
28.2
Others
16.3
16.5
16.7
FII Includes depository receipts
19 May 2017
6

Stock Performance (1-year)
Proposed capital raise to drive strong growth in financial services business
PIEL is planning to raise up to INR50b (~10% dilution), which, in our view, would
support strong growth in the financial services business. The Pharma and IT
businesses are sufficiently capitalized, with a debt to equity ratio of ~1x (our
estimate). Our back-of-the-envelope calculations suggest that NBFC leverage in this
business is 5x+. Considering the wholesale nature of the business, we believe peak
leverage could be 6-7x. We have not factored in the capital raise, but, if accounted
for, our consolidated BV for FY18/19 would be ~INR1,040/1,150 v/s our estimate of
INR850/960 (under Indian GAAP).
Reiterate Buy; strong foundation for robust growth
PIEL has the distinction of being one of the few companies in India to generate 25%+
book value CAGR over past 25+ years. Post the sale of the domestic formulations
business, management chose to invest and compound the money, rather than
distributing it to shareholders. We believe the company has the DNA to incubate
and grow businesses in niche segments. Significant proportion of capital (INR45.3b
in Shriram Group + INR4b seed investment in PE business + INR40b in Pharma and
IT) generates less than 5% RoE, but could create significant value over the longer
term. Best talent, coupled with stringent underwriting, has enabled PIEL to build a
fast-growing, highly profitable franchise with robust asset quality. The planned
capital infusion (up to INR50b) will provide the much-needed ammunition to
continue on the robust growth path. We use SOTP to arrive at a target price of
INR3,044. Buy.
Exhibit 2. PIEL: SOTP - March 2019 (without factoring in the proposed capital raise of up to ~INR50b)
Value
(INR B)
273
81
7
164
525
483
8.8
Value
(USD B)
4.1
1.2
0.1
2.5
7.8
7.2
8.8
INR per
share
1,583
470
38
952
3,044
2,798
8.8
Source: Company, MOSL
%
To Total Rationale
52
3.6x PBV; ROA/ROE of ~4%/25%+ - Loan CAGR of 40% FY17-20
15
1
31
100
Based on our Target Multiple; Implied 1.8x of invested capital
7% AUM
Pharma EV/EBITDA 14x; IT EV/Sales of 4x
Implied 3.2x Consolidated BV
NBFC business
Shriram Investments
AMC
Pharma, IT and Others
Target Value
Current market cap.
Upside (%)
Exhibit 3. PIEL: SOTP - March 2020 (without factoring in the proposed capital raise of up to ~INR50b)
Value
(INR B)
355
94
8
202
658
483
36.3
Value
(USD B)
5.3
1.4
0.1
3.0
9.8
7
36.3
INR per
share
2,056
542
44
1,170
3,813
2,798
36.3
Source: Company, MOSL
%
To Total Rationale
54
3.6x PBV; ROA/ROE of ~4%/~25%+ - Loan CAGR of 40% FY17-20
14
1
31
100
Based on our Target Multiple; Implied 1.8x of invested capital
7% AUM
Pharma EV/EBITDA 14x; IT EV/Sales of 4x
Implied 3.5x Consolidated BV
NBFC business
Shriram Investments
AMC
Pharma, IT and Others
Target Value
Current market cap.
Upside (%)
19 May 2017
7

Sector Update | 18 May 2017
GST
GST council finalizes tax rates
The 14
th
Goods and Services Tax (GST) Council, on the first day of its crucial two-
day meeting, finalized the tax rates for 1,211 items (except six items – services,
gold, branded & packaged products, footwear, apparel and beedi) with 81% of the
items to be levied duties at 18% or lower. However, we note that the government
has broadly kept the tax rates close to the existing tax rates in most of the cases.
Exhibit 1: 81% of items will be charged at 18% or lower
Rate slab
0%/Exempt items
5%
12%
18%
28%
% of items
7
14
17
43
19
Source: GST council, Media, MOSL
With the change in
effective
indirect taxation, the respective
sectors may see:
1.
Volume-led impact:
If the GST rate is lower than the current effective tax rate,
then thee could be an increase in volumes for the sector, which will drive
earnings and vice versa.
2.
Margin-led impact:
Certain companies owing to their industry dynamics enjoy
pricing power. A lower GST rate could help such companies retain part of the
benefits, which could positively impact their margins. Also, some companies
may witness margin expansion due to the benefits from operating leverage with
an increase in volumes.
3.
Shift from unorganized to organized trade:
The change in current indirect taxes
will lower the product price differential between organized and unorganized
players. This, in turn, could positively impact the revenue and earnings growth
rates of the organized names and vice versa.
19 May 2017
8

In our view, the rates announce so far are likely to benefit the consumer sector (companies in the
toothpaste, adhesive and soap segments)
Sector
Consumers
Paints
Toothpaste
Adhesive
Soaps
Cigarettes
Auto
2 Wheelers
Motorcycles (engine>350cc)
Others
25-26%
25-26%
22-23%
25-26%
28%
18%
18%
18%
Current
Effective tax
rate
GST rate
Remarks
Neutral: The companies will be able to pass the price increase to
the consumers.
Positive: The reduction in the duty rates may be passed on to
generate volume benefits or may be partially retained to
improve margins
Positive: The reduction in the duty rates may be passed on to
generate volume benefits or may be partially retained to
improve margins
Positive: The reduction in the duty rates may be passed on to
generate volume benefits or may be partially retained to
improve margins
28% + Excise 28% + Cess
Neutral: The Tax incidence is broadly maintained at the current
depending on (As per length
level and hence no major impact
length
+ Advolerum)
30-31%
31%
28%
Neutral
Marginally Positive: as entry level two wheelers can derive some
volume benefit on reduction of tax rate by 2-3%
Neutral: Companies will have to pass on the benefit to the
consumer
Neutral: Tax rates are broadly same as current rates. The change
in tax rates whereever applicable will be passed passed through.
3 Wheelers
30-31%
28%
4 Wheelers
Small Cars (length < 4 m ; Petrol<1200 cc )
Small Cars (length < 4 m ; Diesel < 1500 cc)
Mid Segment Cars (engine < 1500 cc)
Large Cars (engine > 1500 cc)
Sports Utility Vehicles (length > 4m ; engine
1500 cc; ground clearance > 170 mm)
Mid Segment Hybrid Cars (engine < 1500 cc)
Hybrid motor vehicles > 1500 cc
Hydrogen vehicles based on fuel cell tech > 4m
31-49%
29%
31%
43%
43%
43%
43%
43%
43%
43%
CV
Batteries
Cement
Metals
Pharma
Capital Goods – Light electrical and aircon
Capital Goods – Project
Home Building
Tiles / Sanitary ware
Ply wood
30-31%
29-30%
22-24%
19-21%
4-14%
22-26%
22%
28%
28%
28%
18%
5-12%
28%
18%
Neutral: Companies will have to pass on the benefit to the
consumer
Slightly positive: companies may retain a portion of the reduced
tax rates which may improve margins
Neutral: The increase in the tax rates will be a pass through and
is unlikely to impact volumes
Neutral: Reduction in duty rates will be passed on to consumers
Neutral: Duty incidence is broadly maintained for the
pharmaceutical products
Neutral: The marginal increase in tax rates are likely to be passed
to the consumers
Neutral: The decrease in the tax rates will be passed on to the
customers
Neutral: This is likely to increase the product price differential
between the unorganised and organised players, leading to
increase in competitiveness of unorganized players
Neutral: This is likely to increase the product price differential
between the unorganised and organised players, leading to
increase in competitiveness of unorganized players
25-28%
25-28%
28%
28%
19 May 2017
9

18 May 2017
Update
| Sector:
Utilities
CESC
Buy
BSE SENSEX
30,435
S&P CNX
9,429
CMP: INR830
TP: INR1,040(+25%)
Driving value through simplification
n
Stock Info
Bloomberg
Equity Shares (m)
52-Week Range (INR)
1, 6, 12 Rel. Per (%)
M.Cap. (INR b)
M.Cap. (USD b)
Avg Val, INRm
Free float (%)
CESC IN
133.2
1002 / 531
-5/23/33
110.6
1.6
358
50.1
Financials Snapshot (INR b)
2017 2018E 2019E
Y/E Mar
Net Sales
139.0 152.3 161.1
EBITDA
31.6
38.1
39.4
PAT
6.9
9.8
10.7
EPS (INR)
51.9
73.4
80.6
Gr. (%)
86.6
41.6
9.8
BV/Sh (INR)
442.2 503.6 572.3
RoE (%)
11.4
15.5
15.0
RoCE (%)
10.1
11.3
11.4
P/E (x)
19.3
13.6
12.4
P/BV (x)
16.0
11.3
10.3
Shareholding pattern (%)
As On
Mar-17 Dec-16 Mar-16
Promoter
49.9
49.9
49.9
DII
20.3
20.2
19.1
FII
21.1
21.8
22.6
Others
8.7
8.1
8.4
FII Includes depository receipts
Stock Performance (1-year)
CESC
Sensex - Rebased
1,100
900
700
500
In a major development, the board of directors of CESC has approved a scheme for
demerger of the company into four separate entities, which would be listed
individually. Economic interest of shareholders in each of the companies would
remain the same as their current holding in CESC. The four entities are carved out
such that they specialize in a particular line of business – distribution (CESC),
generation (Haldia Energy), retail (RP-SP Retail) and others (RP-SP Business Process
Services). For every 10 shares of CESC, shareholders will receive five (of INR10 each)
shares of distribution, five (of INR10 each) of generation, three (of INR5 each) of
retail and two (of INR10 each) of others. The demerger would require approval of the
Company Law Board and the West Bengal Electricity Regulatory Commission.
Management expects the merger process to be completed by 1 October 2017.
We see significant benefits of the demerger:
n
Exposure to the only pure-play distribution business:
It would be the only
pure-play distribution business in India. A regulated distribution business is one
of the best regulated businesses to own, given low gestation period (high IRRs),
steady growth and negative working capital. The Kolkata business is high-RoE
and growing at a steady rate (5-6%). Noida is growing rapidly, with regulated
equity having increased 3x over past five years. Growth will also be driven by
the entry into new circles through the distribution franchise model, which is
low capex and would leverage on CESC’s 100+ years of experience in the
distribution business. The closest comparable peer is Power Grid.
n
Healthy dividends likely from generation business:
The generation business
would have capacity of ~2.5GW. Of this, ~2.3GW is coal-based generation, with
long-term, largely regulated nature PPAs for ~2GW. The untied capacity of
0.3GW at Dhariwal has the potential to enter into a regulated PPA with CESC’s
Noida distribution circle in 2-4 years. In the interim, the untied capacity will
look at opportunities in the merchant power market (Maharashtra is a
possibility). The regulated generation business earns +17% RoE (incl.
incentives) and, with limited growth opportunities, should be a healthy-
dividend-paying business.
n
Pure-play retail chain:
Spencer is a growing retail chain with a store count of
124 and area of 1,176k.sq.f as at end-FY17. The operations expected to turn
profitable in FY18 through focused expansion, optimization and operating
leverage. The organized retail sector represents just 10% of the estimated
market size of USD600b, and provides a huge growth opportunity. Spencer
recently entered the apparels business, which has gathered strong momentum
with the initial launch. Sales increased from INR20m in April 2017 to INR80m by
June 2017. Apparel is a high-margin business and would drive faster
turnaround at Spencer.
19 May 2017
10

n
Reduces risk of business diversification:
In our interactions with investors, we
understood that CESC’s diversification into unrelated businesses in the past
(BPM, cricket) was a key overhang on the stock. The demerger, in effect, tries to
address this risk. Management clarified that new opportunities will be explored
only through the RP-SP Business Process Services (others entity).
Driving value through simplification
A simplified and concentrated portfolio would drive value unlocking. As a
conglomerate, the business demanded higher cost of equity due to a different risk
profile of each business. While generation and distribution are less volatile, the
organized retail and business process management (Firstsource) has a different risk
profile. The risk of unrelated business diversification (if any) would also be now
confined to a smaller portion of the erstwhile business. The negative reaction (the
stock down ~16%) post the announcement of the demerger is probably due to
misunderstanding of the merge terms and/or misreading of the 4QFY17 results
(announced just later), in our view. We will await the final approvals to incorporate
the demerger. Meanwhile, we roll forward our valuation to FY19E, in line with our
other utility sector companies. The SOTP-based target price is INR1,040. Reiterate
Buy. The key risk is delay in (1) the process of demerger and (2) PPA for Dhariwal.
Exhibit 4. CESC’s proposed new structure
Source: Company, MOSL
19 May 2017
11

RESULTS
FLASH
9 May 2017
Results Flash | Sector: Automobiles
Bajaj Auto
Buy
BSE SENSEX
30,435
S&P CNX
9,429
CMP: INR2974
n
TP: INR3282
We will revisit our estimates
post earnings call/management
interaction.
Below est.; BS3-related discount, adverse mix, high RM cost hurt margins
Net realization increased ~1.2% YoY (~4.5% QoQ) to INR62,171/unit (est. of
~INR62,344) due to a higher contribution from premium segment motorcycles,
partly offset by a decline in the 3W segment.
n
Net sales declined ~8.6% YoY to ~INR48.9b (est. of ~INR49.1b).
n
RM cost was higher by 280bp YoY (+150bp QoQ) due to discount on BS3
inventory, adverse mix (lower exports) and higher commodity cost.
n
EBITDA margin contracted 300bp YoY (-210bp QoQ) to 18.5% (est. of 20.5%).
Higher other income restricted PAT decline to 15.5% YoY (to ~INR8b v/s est. of
~INR8.4b).
n
For FY17, net sales declined ~3.6% to ~INR217.6b, led by 6% volumes decline.
EBITDA margin shrunk 90bp to 20.3%. PAT declined ~2.6% to ~INR38.3b.
Dividend was stable at ~INR55/share.
n
Net cash increased 36% to ~INR123.7b (~71% of capital employed).
n
Its associate KTM (~48% stake) reported 11% volumes growth for CY16,
translating into 12% revenue growth, and ~13% PAT growth to ~EUR72m.
Key questions for management
n
Demand situation and outlook at retail level post BS3 push
n
Outlook on exports demand, especially in key markets like Nigeria and Sri
Lanka
n
Update on Fx hedges for FY18 and FY19
n
Quantum of discounts for BS3 inventory liquidation
n
Commodity inflation impact in 4QFY17 and further estimated impact in FY18
Valuation and view:
We will revisit our estimates post the earnings call. The stock
trades at 19.4x/17.3x FY18E/19E EPS. Maintain
Buy
with a TP of INR3,282.
FY17
2Q
3Q
4Q
1,032
852
788
-2.3
-10.5
-9.7
58,676 59,495 62,171
2.0
2.0
1.2
60,545 50,669 48,973
-0.4
-8.7
-8.6
67.0
66.8
67.8
4.3
4.8
4.6
7.4
7.9
9.2
12,961 10,439 9,060
21.4
20.6
18.5
3,420 3,193 2,936
7
3
2
770
772
757
15,605 12,858 11,236
4,378 3,612 3,218
28.1
28.1
28.6
11,228 9,246 8,018
6.7
(4.7) (15.5)
FY16
3,894
2.2
58,010
2.3
225,865
4.5
66.6
4.1
8.2
47,856
21.2
10,736
11
3,072
55,510
16,177
29.1
39,297
28.9
FY17
3,666
(5.8)
59,375
2.4
217,667
(3.6)
67.2
4.6
8.0
44,224
20.3
12,220
14
3,073
53,357
15,081
28.3
38,276
(2.6)
Est.
4Q
787.7
(9.7)
62,344
1.4
49,109
-8.4
66.5
5.2
7.8
10,084
20.5
2,475
-3
778
11,784
3,365
28.6
8,419
-11.3
Var.
(%)
0.0
-0.3
-0.3
Conference Call Details
Date:
19 May 2017
Time:
10:00am IST
Dial-in details:
+91-22-3960 0663
th
Financials & Valuations (INR b)
2017 2018E
Y/E Mar
Net Sales
217.7 249.1
EBITDA
44.2
50.7
NP
38.3
44.3
EPS (INR)
132.3 153.0
EPS Gr. (%)
-2.6
15.7
BV/Sh. (INR)
588.7 651.5
RoE (%)
25.3
24.7
RoCE (%)
24.6
23.9
P/E (x)
22.5
19.4
P/BV (x)
5.1
4.6
2019E
283.5
57.9
49.8
172.2
12.5
720.4
25.1
24.3
17.3
4.1
Quarterly Performance
(INR Million)
Volumes ('000 units)
Growth YoY (%)
Realization (INR/unit)
Growth YoY (%)
Net Sales
Change (%)
RM/Sales %
Staff cost/Sales %
Oth. Exp./Sales %
EBITDA
EBITDA Margins (%)
Other Income
Interest
Depreciation
PBT
Tax
Effective Tax Rate (%)
Adj. PAT
Change (%)
1Q
1,013
2.5
55,273
4.0
55,993
6.6
67.4
4.3
8.0
11,402
20.4
3,063
1
784
13,680
4,106
30.0
9,574
29.4
FY16
2Q
3Q
1,057
951
0.1
-3.4
57,543 58,306
1.9
1.5
60,799 55,478
2.0
-1.9
66.7
66.6
4.0
4.1
7.7
8.2
13,167 11,716
21.7
21.1
2,680 2,425
3
2
780
746
15,063 13,392
4,540 3,686
30.1
27.5
10,524 9,706
26.4
12.7
4Q
872
11.5
61,430
1.4
53,595
13.1
65.9
3.8
8.9
11,534
21.5
2,569
4
761
13,338
3,844
28.8
9,493
52.7
1Q
995
-1.8
57,784
4.5
57,480
2.7
67.2
4.7
7.7
11,763
20.5
2,671
2
775
13,657
3,873
28.4
9,784
2.2
-10.2
-200bp
-4.6
-4.8
19 May 2017
12

18 May 2017
4QFY17 Results Update | Sector: Financials
Bank of Baroda
Buy
BSE SENSEX
30,435
Bloomberg
Equity Shares (m)
M.Cap.(INRb)/(USDb)
52-Week Range (INR)
1, 6, 12 Rel. Per (%)
Avg Val, INRm
Free float (%)
S&P CNX
9,429
BOB IN
Stress additions remain elevated; provisions mar earnings
2,304
n
Bank of Baroda (BoB) reported PAT of INR1.5b (70% miss) v/s INR2.5b in
433.3 / 6.5
3QFY17. The strong operating performance (+17% YoY; 36% beat) was
202 / 128
driven by robust fee income growth (+50% YoY/QoQ) and controlled opex
3/-10/13
1656
(flat YoY). Elevated NPL provisions (2.7% credit costs annualized) on account
40.8
of continued stress additions led to the PAT miss.
CMP: INR188
TP: INR217(+15%)
Financials & Valuations (INR b)
Y/E March
2017 2018E
NII
135.1
156.3
OP
109.8
119.5
NP
13.8
44.0
NIM (%)
2.2
2.4
EPS (INR)
6.0
19.0
EPS Gr. (%)
NA
218.0
BV/Sh. (INR)
147.8
162.4
RoE (%)
4.1
12.3
RoA (%)
0.2
0.6
P/E(X)
31.4
9.9
P/BV (X)
1.3
1.2
n
2019E
n
180.5
131.5
57.5
2.5
24.9
30.7
n
181.4
14.5
0.7
7.6
n
1.0
n
NIM expanded 11bp QoQ to 2.2% on a low base (3Q had interest income
reversal of ~INR2.6b). Margins were also aided by IT refund of INR1.5b.
Slippages remained elevated at INR40.7b (annualized slippage ratio of 4.3%)
v/s INR41.4b in 3Q, led by relapse of INR22.8b from the restructured book.
While recoveries and upgrades were lower than previous quarters in FY17,
high write-offs of INR15.8b led to flat absolute GNPLs on a sequential basis.
Overall NSL stood at ~9.6%.
FY17 highlights:
BoB reported PAT of INR24.7b v/s loss of ~INR67b in FY16.
This was a year of balance sheet consolidation: loan growth was flat YoY, led
by ~12% decline in overseas loans.
Other highlights:
a) Retail advances grew 13% QoQ and 14% YoY. b) Average
daily CASA ratio improved to 38.8% v/s 37.1% in 3Q. c) CET 1 ratio declined
30bp QoQ to ~9%.
Valuation and view:
We like management’s focus to clean up the balance
sheet and lay the foundation for sustainable growth. We expect stress
addition and credit costs to reduce in FY18/19. Additional buffers like non-
core financial investments among other options will lead to dilution-free
growth in the near term. We largely maintain estimates. Maintain
Buy
with
a TP of INR217 (1.2x FY19BV) – based on RI model.
19 May 2017
13

RESULTS
FLASH
19 May 2017
Results Flash | Sector: Consumer
Pidilite
BSE SENSEX
30,435
S&P CNX
9,429
CMP: INR771
TP: INR740(-4%)
Neutral
We will revisit our estimates
post earnings call/management
interaction.
Results better on all fronts
Conference Call Details
Date:
22 May 2017
Time:
04:00pm IST
Dial-in details:
+91-22-3960 0619
nd
Consolidated results overview
n
Gross sales were up 6.8% YoY to INR14.0b. Net sales increased 4.9% YoY (est.
of flat growth) to INR12.95b, with estimated 7% volume growth (est. flat) in the
Consumer Bazaar segment.
n
Gross margin contracted 210bp YoY to 53.1%. EBITDA was up 8.3% YoY (est. of
-3%) to INR2.58b, with the margin expanding 60bp YoY (est. of -60bp) to
19.9%. PBT also increased by 7.7% YoY.
n
Higher tax rate (38.5% v/s 28.4% in 4QFY16) meant that adj. PAT declined 7.5%
YoY (est. of -8.4%) to INR1.55b.
FY17 performance
n
Net sales grew 4.8% YoY to INR56.2b. EBITDA grew 7.4% YoY to INR12.6b, led
by EBITDA margin improvement of 50bp YoY to 22.4%. Adj. PAT was up 6.7%
YoY to INR8.58b.
Consolidated segmental performance for 4QFY17
n
Consumer Bazaar segment revenues were up 7.6% YoY to INR11.6b. Industrial
segment posted revenue growth of 1.2% YoY to INR2.5b.
n
Consumer Bazaar EBIT grew 28.9% to INR3.6b, with the margin expanding
sharply by 510bp YoY to 31.0%. Industrial segment margin contracted 260bp to
16.1%, driving a 12.8% segmental EBIT decline.
Standalone performance for 4QFY17
n
Gross sales grew 6.5% YoY to INR12.39b. Net sales and EBITDA grew 4.3% and
12.0%, respectively, while adj. PAT was up 6.1% YoY. Gross margin shrunk 80bp
YoY to 53.8%, and EBITDA margin expanded 150bp to 22.4%.
n
Consumer Bazaar segment revenues grew 7.3% YoY. Industrial segment also
posted revenue growth of 1.2% YoY. Consumer Bazaar segmental EBIT margin
expanded 90bp YoY to 26.1%. Consumer Bazaar EBIT grew 11.1% to INR2.6b.
Financials & Valuations (INR b)
2016
2017E
2018E
Y/E Mar
54.1
55.6
63.5
Net Sales
12.2
12.4
13.8
EBITDA
7.6
8.5
9.4
NP
14.8
16.6
18.3
EPS (INR)
47.3
12.5
10.1
EPS Gr. (%)
64.5
79.3
BV/Sh. (INR) 54.3
29.9
27.9
25.4
RoE (%)
28.5
26.5
24.3
RoCE (%)
P/E
52.3
46.5
42.2
EV/EBITDA
31.9
31.1
27.6
19 May 2017
14

United Breweries
BSE SENSEX
30,435
Bloomberg
Equity Shares (m)
M.Cap.(INRb)/(USDb)
52-Week Range (INR)
1, 6, 12 Rel. Per (%)
Avg Val, INRm
Free float (%)
S&P CNX
Downgrade to Neutral
9,429
UBBL IN
Highly uncertain operating environment leads to downgrade to Neutral
264
n
Net sales declined 8.4% YoY (est. of -4.7%) to INR11.1b
(3.9% below
209.4 / 3.3
estimate) in 4QFY17. During the quarter, the beer industry reported its
976 / 690
sharpest volume fall in a decade (-13% YoY; UB declined 9%) due to the
2/-24/-10
impact of demonetization, store closures ahead of the highway ban and
303
higher excise.
26.1
n
Gross margin contracted 230bp YoY to 51.3%.
Staff costs increased 90bp
18 May 2017
4QFY17 Results Update | Sector: Consumer
CMP: INR792
TP: INR830(+5%)
Financials & Valuations (INR b)
FY17 FY18E
Y/E Mar
Net Sales
47.3
48.7
EBITDA
6.4
6.1
NP
2.3
2.6
EPS (INR)
8.7
9.7
EPS Growth (%)
-23.0
11.6
BV/Sh. (INR)
87.1
94.9
RoE (%)
10.4
10.7
RoCE (%)
10.3
9.4
P/E (x)
91.1
81.6
P/BV (x)
9.1
8.3
FY19E
56.5
8.1
3.9
14.7
51.9
107.3
14.6
12.7
53.8
7.4
n
n
Estimate change
TP change
Rating change
n
YoY. Other expenses, however, declined 170bp YoY, restricting EBITDA
margin contraction to 150bp (est. of +30bp) to 9.1% in 4QFY17. EBITDA
declined 21.3% YoY (est. of -2%) to INR1.01b, 19% below estimate. Due to
high depreciation and much lower other income, PAT declined 87% YoY.
Full-year FY17 performance:
Sales declined 2.2% YoY to INR47.34b. EBITDA
declined by 7.3% YoY to INR6.4b and PAT by 23% YoY to INR2.3b. In FY17,
industry volumes fell 5%, while UB reported a 2.5% decline.
Management call takeaways:
(a) Market is down by 10-15% YoY in April due
to the highway ban. Kerala and Maharashtra have been affected more as
licenses expired in March. (b) Management believes that the absolute worst
impact due the highway ban may be over, but the operating environment
remains tough.
Valuation and view:
Long-term volume and earnings growth opportunity
(FY17 PAT at USD 36m) is immense for India’s largest beer player, with
strong barriers to entry in the form of distribution, brewery reach, scale and
brands. However, the operating environment over the next year is expected
to be challenging, both due to the highway ban (de-notification by state
governments have not been as prompt as expected) and the prevailing
uncertainties over GST. There is a sharp cut to our EPS forecast (by 28%/16%
for FY18/FY19) as a result of the likely pressure on sales and profitability.
Owing to limited upside to our target price of INR830 (despite maintaining
target multiple at 33x FY19E cash EPS), we downgrade the stock to
Neutral.
FY17
2Q
3Q
10,322 10,250
-3.7
-6.6
9,139
8,942
1,183
1,308
-12.4
-27.3
11.5
12.8
702
698
141
153
8
330
348
787
0
0
348
787
106
274
30.4
34.8
0
0
242
513
242
513
-53.5
-28.0
2.3
5.0
Standalone - Quarterly Earning Model
Y/E March
Net Sales
YoY Change (%)
Total Expenditure
12,062
EBITDA
2,484
YoY Change (%)
Margins (%)
17.1
Depreciation
583
Interes t
202
Other Income
167
PBT before EO expense
1,866
Extra-Ord expens e
0
PBT
1,866
Tax
645
Rate (%)
34.5
Minority Interes t & Profit/Los s of As s o.
0
Reported PAT
1,221
Adj PAT
1,221
YoY Change (%)
Margins (%)
8.4
E: MOSL Es timates
FY16
1Q
2Q
3Q
14,546 10,723 10,969
9,373
1,350
12.6
598
205
242
789
0
789
268
33.9
0
521
521
4.9
9,169
1,800
16.4
615
224
179
1,140
0
1,140
428
37.5
0
713
713
6.5
4Q
12,150
10,866
1,285
10.6
638
180
273
739
0
739
216
29.2
0
524
524
4.3
1Q
15,642
7.5
12,733
2,909
17.1
18.6
637
148
136
2,260
0
2,260
790
34.9
0
1,471
1,471
20.4
9.4
4Q
11,127
-8.4
10,116
1,011
-21.3
9.1
833
144
43
76
0
76
9
11.7
0
67
67
-87.1
0.6
FY16
48,388
41,470
6,919
14.3
2,435
811
862
4,534
0
4,534
1,556
34.3
0
2,979
2,979
6.2
FY17E
47,341
-2.2
40,930
6,412
-7.3
13.5
2,870
587
516
3,472
0
3,472
1,178
33.9
0
2,293
2,293
-23.0
4.8
4QFY17E
11,583
-4.7
10,334
1,248.6
-2
10.8
600
150
340
838.6
0
839
226
27
0.0
612
612.2
16.9
5.3
Variance
-3.9%
-19.0%
-90.9%
-89.0%
-89.0%
19 May 2017
15

RESULTS
FLASH
Muthoot Finance
18 May 2017
Results Flash | Sector: Financials - NBFC
BSE SENSEX
30,435
S&P CNX
9,429
CMP: INR379
Robust operating performance supported by impressive asset quality
n
Muthoot Finance’s (MUTH) 4QFY17 PAT grew 21% YoY (+11% QoQ) to INR3.2b
(in-line). NII growth was robust at 28% QoQ (+18% YoY), implying 40% beat,
which, in our view, was aided by strong recoveries. We await clarification.
n
Strong operating profits were used to create buffer of 0.87% additional
standard asset provision for gold price fluctuations. We are surprised by this,
considering gold prices were largely stable in 4Q. Hence, despite PPoP beat of
57%, higher provisioning of INR2.3b (v/s INR39m in 3Q) led to in-line PAT.
n
GNPA declined 29% in absolute terms to 2.1% of AUM v/s 2.92% in 3Q. NNPA
declined to 85bp to 1.7% (to INR4.6b). MUTH has INR5b of standard asset
provision (incl. INR2.3b gold fluctuation-related) on the balance sheet.
n
AUM grew 12% YoY (+1% QoQ) to INR273b, lower than management’s
guidance of +17-18%. We await further clarity from MUTH on this. Calculated
margin expanded 620bp QoQ to 17.2% on strong interest income performance.
n
Opex growth was strong at 22% YoY v/s average growth of 7% in last three
quarters. Employee expenses grew 12% YoY (+4% QoQ). Other operating
expenses were significantly higher than our estimate.
Valuation and view:
Given the stable regulatory regime, benign competition and
supportive gold prices, we expect growth to resume, with AUM CAGR of +15% over
next 2-3 years. Given that significant portion of its operating costs is fixed, a growth
recovery will ensure optimum utilization of existing infrastructure, boosting return
ratios. We look to revise our estimates and TP post the conference call.
We will revisit our estimates
post earnings call/management
interaction.
Conference Call Details
Date:
20 May 2017
Time:
03:00pm IST
Dial-in details:
+91-22-3300 1500
th
Financials & Valuations (INR b)
Y/E March
2017 2018E
NII
30.0
34.6
PPP
18.9
21.9
PAT
11.8
13.8
EPS (INR)
29.7
34.5
BV/Sh.(INR)
159.7 181.7
RoE (%)
19.7
20.2
Div. Yld. (%)
2.3
2.7
P/E (x)
12.8
11.0
P/BV (x)
2.4
2.1
2019E
39.3
25.1
16.0
40.0
207.2
20.6
3.2
9.5
1.8
19 May 2017
16

18 May 2017
Results Update | Sector: Utilities
CESC
Buy
BSE SENSEX
30,435
Bloomberg
Equity Shares (m)
M.Cap.(INRb)/(USDb)
52-Week Range (INR)
1, 6, 12 Rel. Per (%)
Avg Val, INRm
Free float (%)
S&P CNX
9,429
CESC IN
133
110.4 / 1.6
1002 / 531
-5/23/33
358
50.1
CMP: INR841
TP: INR1,040(+15%)
Dhariwal starts full supplies to Noida PPA
Consolidated PAT grew 16% YoY in FY17; Re-iterate Buy
CESC’s 4QFY17 standalone PAT was broadly flat YoY at INR2.9b (ahead of
estimate of INR2.5b) as we estimate that growth in regulated equity was offset
by the impact of negative bid for the captive coal block. For FY17, PAT increased
2.1% YoY to INR8.6b. Consolidated PAT grew 16% YoY to INR6.9b.
Standalone:
Power sales declined ~5% YoY to 2.09BU on a strong base. EBITDA
(including regulatory income/expense) was broadly flat YoY at INR5.4b. For a
distribution business, EBITDA alone (down ~50% YoY) is not representative of
the operating performance of the company, as the mismatch in recovery of cost
for the period is presented separately under ‘Regulatory income/expense’ as per
the accounting standards.
Spencer:
Revenue grew 9.6% YoY to ~INR20b in FY17. Reported sales per sq.ft/m
were up 8.5% YoY to INR1,576. EBITDA loss declined from ~INR596m in 4QFY16
to INR460m in the quarter, led by operating leverage and efficiencies. EBITDA
margin improved from negative 3.2% in the year-ago period to 2.3%. Reported
store EBITDA was up ~INR15 per sq.ft/m YoY to INR101.
Dhariwal:
Supply under the Noida PPA has commenced from 1 April 2017. It has
also secured a 150MW one-month contract to supply to Maharashtra. For FY17,
Dhariwal has a loss of INR4.8b (in-line). We expect this to reduce to INR2.5b with
benefit of the Noida PPA.
Financials & Valuations (INR b)
Y/E Mar
2017E 2018E
Net Sales
139.0
152.3
EBITDA
31.6
38.1
PAT
6.9
9.8
EPS (INR)
51.9
73.4
Gr. (%)
86.6
41.6
BV/Sh (INR)
442.2
503.6
RoE (%)
11.4
15.5
RoCE (%)
10.1
11.3
P/E (x)
16.0
11.3
P/BV (x)
1.9
1.6
2019E
161.1
39.4
10.7
80.6
9.8
572.3
15.0
11.4
10.3
1.4
Estimate change
TP change
Rating change
Unlocking value through simplification of the group structure; Buy
CESC has announced the demerger of its business into four separate businesses
to be listed individually (discussed
in detail in our note here).
We see value
unlocking from simplification and concentrated portfolio exposure. We roll
forward valuation to FY19E. The SOTP-based TP is INR1,040. Re-iterate Buy.
Quarterly Performance (Standalone)
19 May 2017
17

RESULTS
FLASH
18 May 2017
Results Flash | Sector: Media
D B Corp
Buy
BSE SENSEX
30,435
S&P CNX
9,429
CMP: INR369
n
n
TP: INR450
We will revisit our estimates
post earnings call/management
interaction.
Demon hangover remains, ad growth under pressure
Opex levers cushion margins
PAT grew 6% YoY to INR642m (in-line) as higher-than-expected net other
income and lower tax outgo offset the EBITDA miss.
EBITDA declined 3% YoY to INR1.12b (6% below est. of INR1.19b), primarily led
by depressed revenues. EBITDA margin shrunk marginally by ~103bp YoY to
21.7% (46bp lower than est. of 22.2%). Mature editions EBITDA margin stood
at 27% v/s 35% in 3QFY17.
Print ad revenue declined 2.7% YoY to INR3.1b (4.6% lower than est. of
INR3.25b) as ad volumes continued to languish due to demonetization.
Circulation revenue growth was disappointing at 7% YoY (INR1.22b v/s est. of
INR1.24b) – majority was yield-driven growth from the mature markets.
Digital business revenue grew 19% YoY to INR142m this quarter, while radio ad
growth moderated to 11% YoY (to INR330m; in-line) due to demonetization.
RM costs increased 1.6% YoY to INR1.6b (4% below est.). Overall operating
expenses grew 3% YoY to INR4.05b (4% below est. of INR4.2b), led by lower-
than-expected RM, employee and SG&A expenses.
Conference Call Details
Date:
19 May 2017
Time:
01:00pm IST
Dial-in details:
+91-22-3938 1071
th
n
n
Financials & Valuations (INR b)
2017E 2018E
Y/E Mar
Net Sales
22.4
24.9
EBITDA
6.4
7.3
NP
3.7
4.4
EPS (INR)
20.4
24.0
EPS Gr. (%)
25.8
18.0
BV/Sh. (INR)
86.7
97.5
RoE (%)
25.5
26.1
RoCE (%)
23.0
24.3
P/E (x)
18.1
15.4
P/BV (x)
4.3
3.8
2019E
27.7
8.4
5.3
28.8
19.7
110.5
27.7
26.0
12.8
3.3
n
n
Key questions for management
n
Sectors that were laggards and those that are expected to aid in ad revival
n
Update on the new IRS survey
n
Clarity regarding impact of GST on print industry
Valuation and view:
We will revisit our estimates post the earnings call. At CMP of
INR369, the stock trades at an attractive P/E of 16.8x FY18E and 14.6x FY19E.
Buy.
Quarterly Performance
Y/E March
Sales
YoY (%)
Operating Expenses
EBITDA
YoY (%)
EBITDA margin (%)
Depreciation
Interest
Other Income
PBT
Tax
Effective Tax Rate(%)
Adj PAT
YoY (%)
1Q
4,734
-3.2
3,515
1,218
-9.5
25.7
208
21
68
1,057
393
37.2
665
-16.0
FY16
2Q
4,781
-0.4
3,654
1,127
-8.7
23.6
215
27
53
938
337
35.9
601
-11.8
3Q
5,859
5.6
3,991
1,868
1.2
31.9
233
19
37
1,654
585
35.4
1,068
1.6
4Q
5,143
5.9
4,001
1,142
-4.4
22.2
222
24
122
1,017
375
36.8
642
0.4
1Q
5,704
20.5
3,892
1,812
48.7
31.8
211
34
41
1,608
568
35.3
1,040
56.5
FY17
2Q
5,287
10.6
3,782
1,505
33.6
28.5
216
6
41
1,325
440
33.2
885
47.3
3Q
6,273
7.1
4,290
1,982
6.1
31.6
218
30
36
1,771
590
33.3
1,181
10.6
4Q
5,171
0.6
4,049
1,122
-1.7
21.7
218
5
51
950
309
32.5
641
-0.2
FY16
20,516
1.9
15,161
5,355
-5.6
26.1
878
92
281
4,666
1,690
36.2
2,976
-7.3
FY17
MOSLe 4Q
22,435
5,399
9.4
5.0
16,013
4,202
6,422
1,197
19.9
4.8
28.6
22.2
863
216
74
30
170
56
5,654
1,007
1,907
363
33.7
36.1
3,747
644
25.9
0.2
FY17
(INR Million)
Var %
-4.2
-3.6
-6.3
-47bp
1.1
-84.0
-9.2
-5.7
-15.1
-361bp
-0.4
19 May 2017
18

Jyothy Laboratories
BSE SENSEX
30,435
Bloomberg
Equity Shares (m)
M.Cap.(INRb)/(USDb)
52-Week Range (INR)
1, 6, 12 Rel. Per (%)
Avg Val, INRm/ Vol m
Free float (%)
S&P CNX
9,429
JYL IN
181.2
69.0 / 1.1
427 / 270
-9/-8/0
56
33.1
18 May 2017
4QFY17 Results Update | Sector: Consumer
CMP: INR378
n
TP: INR390(+3.2%)
Neutral
Subdued performance; Household Insecticides declines again
Consolidated net sales were up 4.1% YoY to INR4.5b
(est. of +9.6% YoY to
INR3.76b). Overall volumes grew 5.1% YoY (ex-HI volumes rose 9.7%). Power
brand sales increased 2.6% YoY, with 4.1% volume growth. EBITDA declined
3.5% YoY to INR606m (est. of +21% to INR765m). PAT grew 778.6% YoY to
INR1.1b (est. of +341.4%), led by benefit recognized on account of deferred tax
assets/MAT credit on brought forward losses due to the merger of Jyothy
Consumer Products Marketing with the company.
Consolidated gross margin contracted 180bp YoY to 43.9%
(est. of 43.1%).
EBITDA margin shrunk 110bp to 13.6% (est. of 14.1%).
Segmental performance:
Fabric Care grew by 8.4% YoY, Dishwashing by 4.2%,
Personal Care by 22.5%, while Mosquito Repellent declined by 6.5%. Among
the major brands, Ujala posted 9.8% growth, Exo/Margo/Pril grew
3.3%/19.3%/2.3%, while Maxo/Henko declined 6.5%/2.9% YoY.
FY17 performance:
Sales, EBITDA and adj. PAT grew 5.7%, 14.6% and 176.6%,
respectively. EBITDA margin expanded 110bp YoY to 15.1%.
Analyst meet highlights:
1) Overall demand scenario remains muted for JYL. 2)
The company took price hike of 7-8% (grammage reduction + MRP hike) in Exo
in 4QFY17, and 8-10% in Ujala in 1QFY18. 3) Targeting GDP+4% volume growth,
and also sees margins expanding in FY18.
Valuation and view:
Performance was below expectations, mainly due to a
decline in the HI segment. While the growth outlook appears promising led by
likely normal monsoon, valuations are fair at 34.5x FY19E EPS/21.2x FY19E
EV/EBITDA. Upside to our target price of INR390 (22x Dec-18 EBITDA) is limited.
Potential speculation around Henkel call option will overshadow underlying
fundamentals in the near term, in our view. Maintain
Neutral.
FY16
2Q
3Q
3,894 3,711
6.6
3,900
2,029
1,871
48.0
1,374
498
12.8
72
151
35
310
121
39.0
199
6.3
3,718
1,914
1,803
48.5
1,290
513
13.8
74
150
24
314
121
38.6
202
FY17
2Q
3Q
4,148 3,834
6.5
3.3
4.2
5.2
4,152 3,839
2,132 2,089
2,020 1,750
48.7
45.6
1,383 1,243
637
507
28.0
-1.3
15.3
13.2
73
73
164
144
31
26
430
314
119
108
27.7
34.3
320
215
61.2
6.6
FY16
FY17
(INR Million)
FY17
Var.
4QE
(%)
5,405
-17.5
9.6
8.9
5,414
-17.6
3,080
2,334
-16.0
43.1
1,569
765
-20.7
21.3
14.1
100
162
31
534
-16.6
58
10.8
476
128.1
341.4
Financials & Valuations (INR b)
Y/E Mar
2017 2018E
Net Sales
16.8
19.2
EBITDA
2.5
2.9
PAT
2.0
1.6
EPS (INR)
11.2
8.9
Gr. (%)
175.7
-20.4
BV/Sh (INR)
59.9
58.6
RoE (%)
21.1
15.1
RoCE (%)
17.3
12.8
P/E (x)
33.6
42.2
28.7
24.8
EV/EBITDA
2019E
22.1
3.4
2.0
11.0
22.4
60.4
18.4
15.1
34.5
21.2
n
n
n
n
Estimate change
TP change
Rating change
n
Quarterly Performance
Y/E March
Net Sales
YoY Cha nge (%)
Other Opera ti ng Income
Total Sales
COGS
Gross Profit
Ma rgi ns (%)
Tota l Exp
EBITDA
EBITDA Growth %
Ma rgi ns (%)
Depreci a ti on
Interes t
Other Income
PBT
Ta x
Ra te (%)
Adjusted PAT
YoY Cha nge (%)
1Q
4,040
3.4
4,043
2,096
1,947
48.2
1,366
581
14.4
69
164
50
398
149
37.5
258
4Q
4,282
2.0
4,284
2,324
1,960
45.7
1,331
629
14.7
100
153
34
410
302
73.7
124
1Q
4,373
8.3
3.9
4,377
2,219
2,158
49.3
1,364
795
36.8
18.2
71
157
29
596
146
24.6
459
78.2
4Q
4,457 15,927 16,812
4.1
5.6
5.0
18.3
18.3
4,462 15,945 16,830
2,502 8,364 8,941
1,960 7,581 7,889
43.9
47.6
46.9
1,354 5,361 5,344
606 2,221 2,545
-3.5
36.2
14.6
13.6
13.9
15.1
83
314
301
99
618
565
21
143
107
446 1,431 1,786
-629
693
-255
-141.1
48.4
-14.3
1,087
782 2,081
778.6
-36.5 166.2
19 May 2017
19

Gateway Distriparks
BSE SENSEX
30,435
Bloomberg
Equity Shares (m)
M.Cap.(INRb)/(USDb)
52-Week Range (INR)
1, 6, 12 Rel. Per (%)
Avg Val, INRm
Free float (%)
S&P CNX
9,429
GDPL IN
109
27.0 / 0.4
325 / 209
-14/-11/-36
40
74.9
18 May 2017
4QFY17 Results Update | Sector: Logistics
CMP: INR249
TP: INR310(+25%)
Buy
Rail margins impacted; Maintain Buy
GDPL reported EBITDA (Rail + CFS) of INR523m (est. of INR569m; -8% YoY, -11%
QoQ). PAT (before associate/minority interests) of INR223m (-6% YoY, -13% QoQ)
was above our estimate of INR209m due to lower interest cost at INR61m (est. of
INR81m; +61% YoY, +21% QoQ) and a lower tax rate. Management has started
accounting for Blackstone’s 49% stake in Gateway Rail from FY17 (FY16 numbers
are restated for Blackstone’s stake).
Rail profitability impacted by higher EXIM imbalance
n
Rail reported EBITDA of INR331m (est. of INR376m; -5% YoY, -3% QoQ).
n
Container volumes were 57,641TEU (est. of 54,472TEU; +14% YoY, +6% QoQ).
n
Rail realization stood at INR37,161/TEU (+2% YoY, +8% QoQ). EBITDA/TEU
declined 17% YoY (-8% QoQ) to INR5,736 (est. of INR6,911), led by increased
share of 40 feet containers (45% from 40%), higher discounts driven by
increased competitive intensity and increased EXIM imbalance.
CFS volumes impacted by implementation of DPD at JNPT
n
Consol. CFS EBITDA stood at INR192m (in-line; -12% YoY, -22% QoQ).
n
Consol. volumes were 91,095TEU (est. of 86,895; +7% YoY, -7% QoQ).
n
Realizations stood at INR10,261/TEU (est. of INR9,144; +20% YoY,+1%% QoQ),
while EBITDA/TEU was INR2,110 (est. of INR2,212; -18% YoY; -16% QoQ).
Valuation and view
n
Our FY17-19 volumes CAGR assumptions for Rail/CFS stand at ~12%/9%. We
value GDPL based on SOTP-based fair value of INR310/share, valuing CFS
business at 12x FY19E earnings, 40% stake in Snowman at 50% discount to
market value, and Rail segment at 15x FY19E EV/EBITDA (premium to
CONCOR). The stock trades at 17.4x FY19E EPS of INR14.3. The company’s
dividend yield stands at 2-3%. Maintain
Buy.
Financials & Valuations (INR b)
Y/E Mar
Net Sales
EBITDA
PAT
EPS (INR)
EPS Gr. (%)
RoE (%)
RoCE (%)
P/E (x)
EV/EBITDA(x)
2017 2018E 2019E
11.6
2.2
0.7
6.8
(40.2)
5.9
7.1
36.6
13.1
12.7
2.9
1.3
11.6
70.6
9.9
10.8
21.4
9.9
14.5
3.5
1.6
14.3
23.3
11.7
13.2
17.4
8.2
Estimate change
TP change
Rating change
19 May 2017
20

RESULTS
FLASH
Hindustan Media Ventures
BSE SENSEX
30,659
S&P CNX
9,526
18 May 2017
Results Flash | Sector: Media
CMP: INR278
n
n
n
n
n
TP: INR360
Buy
We will revisit our estimates
post earnings call/management
interaction.
Ad pain continues; contained opex salvages margins
Print ad revenue rose 3% YoY/QoQ to INR1.74b (est. of INR1.8b).
Circulation revenue increased 3.4% YoY to INR0.55b (in-line).
Revenue grew 3% YoY to INR2.34b (3% lower than est. of INR2.41b).
EBITDA margin expanded 144bp YoY to 24.4% (est. of 22.4%), as contained
opex more than offset revenue disappointment.
RM cost declined 6% YoY/5% QoQ to INR0.81b (12% below est. of INR0.93b),
constituting 34.5% of revenues (v/s 38.2% in 4QFY16, 37.3% in 3QFY17 and est.
of 38.4%).
PAT rose 4% YoY to INR0.46b, exceeding our estimate, which was largely a
function of EBITDA beat flowing through and higher-than-expected other
income.
HMVL announced a 12% dividend (INR1.2/share).
Conference Call Details
Date:
19 May 2017
Time:
01:00pm IST
Dial-in details:
+91-22-3938 1071
th
Financials & Valuations (INR b)
2017E 2018E
Y/E Mar
Net Sales
9.33 10.30
EBITDA
2.06
2.31
NP
1.94
1.99
EPS (INR)
26.4
27.1
EPS Gr. (%)
7.3
2.7
BV/Sh. (INR)
149.6 176.7
RoE (%)
19.3
16.6
RoCE (%)
18.1
15.6
P/E (x)
10.5
10.2
P/BV (x)
1.9
1.6
n
2019E
11.21
2.44
2.19
29.9
10.4
206.6
15.6
14.8
9.3
1.3
n
Key questions for the management
n
Sectors that are laggards in terms of ad spend and those that are expected to
aid in revival
n
Update on the new IRS survey
n
Clarity on impact of GST on print industry
Valuation and view:
We will revisit our estimates post the earnings call. At CMP of
INR277, the stock trades at P/E of 10.2x FY18E and 9.3x FY19E.
Buy.
Quarterly Performance
Y/E March
Ad revenue
YoY (%)
Circulation revenue
YoY (%)
Revenue
YoY (%)
Operating expenses
EBITDA
YoY (%)
EBITDA margin (%)
Depreciation
Interest
Other Income
PBT
Tax
Effective Tax Rate (%)
Adjusted net profit
YoY (%)
1Q
1,662
6.9
534
8.3
2,237
6.5
1,692
545
27
24.4
55
29
117
578
161
27.8
417
23.1
FY16E
2Q
1,685
18.5
522
5.2
2,262
13.4
1,739
523
34
23.1
53
30
190
630
178
28.2
452
44.4
3Q
1,812
19.1
523
2.5
2,404
16.2
1,803
601
50
25.0
56
27
112
630
161
25.6
469
28.1
4Q
1,694
15.6
534
5.1
2,272
12.4
1,749
523
17
23.0
61
27
189
624
179
28.6
445
14.4
1Q
1,777
6.9
563
5.4
2,392
6.9
1,823
569
4
23.8
50
47
201
673
186
27.6
487
16.8
FY17
2Q
1,701
0.9
538
3.1
2,295
1.4
1,791
504
-4
22.0
52
41
338
749
202
27.0
547
20.9
3Q
1,688
-6.8
561
7.3
2,303
-4.2
1,894
409
-32
17.8
50
39
215
536
98
18.2
438
-6.5
4Q
1,745
3.0
552
3.4
2,343
3.1
1,770
573
10
24.4
50
34
167
655
191
29.1
424
-4.8
(INR Million)
FY16
6,839
14.7
2,144
8.4
9,185
12.6
7,009
2,177
29.4
23.7
225
113
608
2,446
641
26.2
1,805
26.5
FY17
6,912
1.1
2,213
3.2
9,333
1.6
7,277
2,055
-5.6
22.0
202
161
921
2,612
676
25.9
1,895
7.3
19 May 2017
21

J K Lakshmi Cement
BSE SENSEX
30,435
Bloomberg
Equity Shares (m)
M.Cap.(INRb)/(USDb)
52-Week Range (INR)
1, 6, 12 Rel. Per (%)
Avg Val, INRm
Free float (%)
S&P CNX
9,429
JKLC IN
EBITDA disappointment led by lower realizations
118
n
Weak realizations in core markets
:
Volumes rose 6% YoY (+24.1% QoQ) to
56.3 / 0.9
2.28mt (est. of 2.27mt) due to ramp-up in its east operations. Realizations
535 / 327
fell 3% QoQ (+3.5% YoY) to INR3,531 (est. of INR3,698) on weak pricing in its
2/20/21
61
focus markets (such as Gujarat and east). EBITDA fell 16% YoY (-13% QoQ) to
54.1
INR0.716b (margin: 8.9%; -2.7pp YoY, -3.5pp QoQ) v/s est. of INR 893m,
18 May 2017
4QFY17 Results Update | Sector: Cement
CMP: INR478
TP: INR550(+15%)
Buy
Financials & Valuations (INR b)
Y/E Mar
2017 2018E
Net Sales
29.1
32.9
EBITDA
3.7
5.0
PAT
0.8
1.3
EPS (INR)
7.0
11.4
Gr. (%)
-1,694.8
63.9
BV/Sh (INR)
119.4
129.6
RoE (%)
6.0
9.2
RoCE (%)
8.7
8.1
P/E (x)
68.7
41.9
P/BV (x)
4.0
3.7
2019E
37.4
6.7
n
2.4
20.5
80.1
149.0
14.7
10.5
23.3
n
3.2
Estimate change
TP change
Rating change
n
translating into EBITDA/ton of INR313 (-INR83 YoY, -INR136 QoQ) v/s est. of
INR394. Revenue grew 10% YoY (+20% QoQ) to INR8.1b (est. of INR7.98b),
while net profit was INR207m (est. of loss of INR84m).
Cost measures to improve profitability
:
JKLC has planned various cost-
saving initiatives: (1) Laying conveyor belt over next two quarters to reduce
freight expenses on limestone by INR30 to INR40/ton. (2) Re-allocating
excess captive power (18MW) from Sirohi to Udaipur Cement Works. (3)
Greenfield WHRS with capacity of 7MW and thermal power with capacity of
20MW in Durg to save power cost by INR200/t for eastern operations.
FY17 performance
:
JKLC’s volumes rose 9% YoY to 7.97mt due to higher
volumes from east and ramp-up of operations at recently commissioned
Surat GU. Revenue grew 11% YoY to INR29.1b as realizations rose 2% YoY to
INR3,651/t. EBITDA grew 34% YoY to INR3.65b with EBITDA/t up 24% YoY to
INR458. JKLC reported PAT of INR819m v/s loss of INR51m in FY16.
Market mix favorable
:
We remain positive on JKLC due to its higher
exposure to north/central markets, which are likely to see highest realization
increase due to utilization improvement. However, turnaround of eastern
operations would be a key monitorable. The stock trades at 9.8x FY19E
EV/EBITDA and USD85/ton on FY19E capacity. We value JKLC at 11x FY19E
EV/EBITDA (implied EV of USD95), translating to TP of INR550.
Buy.
Source: MOSL, Company
19 May 2017
22

Sector Update | 18 May 2017
Healthcare
Performance of top companies:
(Apr 2017)
Company
IPM
Sun Pharma
Abbott India
Cipla
Zydus Cadila
Mankind
Alkem
Lupin
GSK Pharma
Pfizer
Glenmark Pharma
Sanofi
Dr Reddy Labs
Torrent Pharma
Alembic Pharma
Ipca Labs
Natco
Ajanta Pharma
Merck
Biocon
MAT Apr-17
gr (%)
(%)
10.5
11.1
10.5
7.4
12.7
10.4
14.3
11.7
0.5
1.1
13.1
11.2
6.1
13.4
6.7
9.2
11.5
13.7
5.8
9.3
8.3
11.3
5.9
0.6
8.5
11.2
0.6
10.8
10.1
(11.0)
(5.8)
17.8
8.5
8.4
15.6
5.1
9.7
10.8
11.9
7.5
20.9
IPM delivered moderate growth in April 2017
Indian pharmaceutical market (IPM) grew 8.3% YoY in April 2017 (9.4% YoY in
March). IPM grew 8.2%YoY for three month period February-April 2017.
n
April-17 quarter witnessed a volume growth of 3.4%, growth due to new
launches at 1.4% and price growth of 3.3%. Price growth was the lowest since
4QFY15, which has been consistently falling down from 1QFY17. We expect
industry growth to remain muted in the coming months due to GST impact.
n
Moving annual (MAT) growth for April stood at 10.5%YoY, primarily driven by
5.3%YoY increase in volume; new products contributed 3.2%YoY growth; while
price growth contributed 1.9% of MAT growth.
Alkem, Ajanta, Torrent and Glenmark witness highest growth in Apr-2017
n
Biocon and Glenmark Pharma posted robust growth for the month of April
growing 20.9% and 17.8% respectively followed by Torrent Pharma at 15.6% and
Ajanta Pharma at 11.9%.
n
Conversely, Pfizer largely underperformed IPM in April 2017 declining 5.8%YoY.
Cipla and Alkem posted muted growth of 0.6% each.
Anti-Diabetic and Anti-Neoplastic lead among therapies
n
Anti-Diabetic therapeutic products (8.9% of IPM) witnessed robust 19.5%YoY
growth in Apr 2017 followed by Anti-Neoplastic therapeutic category (2.1% of
IPM) at 18.1%YoY growth. Most of the other therapies outperformed market
posting mid double digit growth, Sex stimulants/Rejuvenators (+14.7), Urology
(+13%), Derma & Vaccines (+12.2%).
DPCO v/s non-DPCO market (April-17)
n
In value terms, secondary sales of DPCO-listed products declined 4.7%YoY,
whereas secondary sales of non-DPCO products registered 10.5%YoY growth.
Volume growth for DPCO-listed products stood at 6.1%YoY and for non-DPCO
products at 0.5%YoY.
FDC ban impact (April-17)
n
FDC-banned drugs (~2.4% of IPM in value terms) continued to be a key drag on
IPM sales. Secondary sales of proposed FDC-banned drugs declined 18.4%YoY in
April-17 while secondary sales of non-banned drugs grew 8.9%YoY. Secondary
sales for Indian companies declined 7.8% YoY while MNC de-grew by 39.2% YoY
in the FDC segment in the Month of April 2017.
n
Exhibit 1. No sign of improvement in price growth in 6 months ended Apr 2017 (Quarterly
trend)
Volume Growth (%)
14.9
3.3
5.1
6.5
10.4
3.1
5.1
2.2
Price Growth (%)
1.42.1
20.3
New Product Growth (%)
Total Growth (%)
13.6
3.1
2.6
7.9
10.5
3.5
1.9
5.1
8.7
3.31.4
4
8.1
3.31.4
3.4
-21
3QFY16
4QFY16
1QFY17
2QFY17
3QFY17
4QFY17
3M-Apr 17
Source: AIOCD, MOSL
19 May 2017
23

March 2017 Results Preview | Sector: Healthcare
GSK Pharma
Bloomberg
Equity Shares (m)
M. Cap. (INR b)/(USD b)
52-Week Range (INR)
1,6,12 Rel Perf. (%)
GLXO IN
84.7
232 / 4
3838 / 2600
-3 / -11 / -46
CMP: INR2,738 TP:INR2,700(-1%)
Neutral
Financial Snapshot (INR Billion)
Y/E MARCH
2016 2017E 2018E
Sales
EBITDA
NP
EPS (INR)
EPS Gro. (%)
BV/Sh. (INR)
RoE (%)
RoCE (%)
Valuations
P/E (x)
P/BV (x)
EV/EBITDA (x)
D. Yield (%)
62.0
13.7
48.4
2.4
79.3
17.8
67.8
2.6
49.3
21.2
41.9
2.6
27.4
4.5
3.7
44.2
-29.2
200.2
22.1
21.2
28.9
3.3
2.9
34.5
-21.9
154.3
22.4
19.5
32.5
5.4
4.7
55.5
60.9
129.3
43.0
39.1
2019E
36.4
6.7
5.5
64.4
15.9
113.2
56.9
53.0
42.5
24.2
34.3
2.6
n
In 4QFY17, we expect GlaxoSmithKline Pharmaceuticals (GLXO) to
report modest 6.3% YoY increase in revenues to INR7.3b.
n
EBITDA is expected to decline 15% YoY to INR1b, with the margin
contracting 360bp YoY to 14.2%.
n
Decline in EBITDA margin will impact Adj. PAT, which is expected to
decline ~2% YoY to INR881m. Growth and profitability are expected
to gradually improve with volume ramp-up in key NLEM products.
n
We believe GLXO has strong parent support, superior brand
portfolio (competitive advantage), high payout ratio (>100%) and
industry leading return ratios (RoCE of ~50%). However, current
valuations at 49x FY18E is on the higher side of historical P/E.
Maintain Neutral with TP of INR2,700 @ 45x 1HFY19E PER.
Key issues to watch out
Ø
New product introductions in FY17-18E.
Ø
Market performance of products impacted by DPCO 2013.
Quarterly Performance (Consolidated)
Y/E March
(Standalone)
Net Sales
YoY Change (%)
Total Expenditure
EBITDA
Margins (%)
Depreciation
Other Income
PBT before EO Expense
Tax
Rate (%)
Adjusted PAT
YoY Change (%)
Margins (%)
Extra-Ord Expense
Reported PAT
E: MOSL Estimates
1Q
6,219
-5.1
5,183
1,036
16.7
49
463
1,450
493
34.0
957
-2.7
15.4
24
933
FY16
2Q
7,000
-5.3
5,894
1,105
15.8
53
489
1,541
507
32.9
1,034
-19.6
14.8
78
956
3Q
7,287
12.8
6,260
1,027
14.1
78
334
1,282
450
35.1
832
-8.9
11.4
33
799
4Q
6,861
11.8
5,641
1,220
17.8
67
310
1,463
565
38.6
898
-17.3
13.1
898
1Q
6,852
10.2
6,150
702
10.2
54
441
1,090
386
35.4
705
-26.4
10.3
-18
723
FY17
2Q
7,829
11.8
6,584
1,245
15.9
66
343
1,522
536
35.2
987
-4.5
12.6
-2
988
FY16
3Q
6,893
-5.4
6,543
350
5.1
66
319
603
252
41.8
351
-57.8
5.1
-179
530
4QE
7,292
6.3
6,260
1,033
14.2
74
394
1,353
471
34.8
881
-1.9
12.1
0
881
27,411
N/A
22,895
4,516
16.5
248
1,500
5,769
2,026
35.1
3,742
-29.2
13.7
135
3,607
FY17E
28,866
5.3
25,536
3,330
11.5
259
1,497
4,568
1,644
36.0
2,924
-21.9
10.1
111
2,812
19 May 2017
24

March 2017 Results Preview | Sector: Cement
Grasim Industries
Bloomberg
Equity Shares (m)
M. Cap. (INR b)/(USD b)
52-Week Range (INR)
1,6,12 Rel Perf. (%)
GRASIM IN
466.8
498 / 8
1098 / 765
1 / 2 / 19
CMP: INR1067
TP: INR1067 (+0%)
Neutral
Financial Snapshot (INR Billion)
Y/E March
2016 2017E 2018E 2019E
Sales
EBITDA
Adj. PAT
Adj. EPS (INR)
EPS Gr. (%)
BV/Sh. (INR)
RoE (%)
RoCE (%)
Payout (%)
Valuations
P/E (x)
P/BV (x)
EV/EBITDA (x)
EV/Ton (x)
22.1
1.9
12.4
165
15.6
1.7
10.6
149
12.3
1.5
8.5
140
9.6
1.3
9.5
135
365.9
60.2
22.6
48.3
26.8
553.4
9.2
10.0
11.0
375.1
69.9
32.1
68.7
42.1
616.7
11.7
11.9
7.7
400.9
82.1
40.4
86.6
26.2
698.4
13.2
13.9
5.8
444.4
98.4
51.8
111.1
28.2
804.5
14.8
16.2
4.5
n
We expect VSF volumes to decline 4% YoY to 124,406 tons in
4QFY17, while realizations are expected to fall 1% YoY to
INR124,271/ton. Standalone revenues are likely to decline 4% YoY
to INR23.98b.
n
Standalone EBITDA margin is estimated at 20.1% (+2.9pp YoY, -
0.4pp QoQ).
n
EBITDA is estimated to increase 12% YoY to INR4.8b, translating
into PAT of INR2.5b (+20% YoY).
n
The stock trades at 9.6x FY19E consolidated EPS, 9.5x FY19E
EV/EBITDA, and implied cement EV/ton of USD135.
Key issues to watch out for:
Ø
Pick-up in cement demand and pricing thereon.
Ø
Outlook on VSF business, and strategy to utilize upcoming
capacities globally.
Ø
Impact of demonetization on caustic soda demand.
Quarterly Performance
Y/E March
(Standalone)
VSF Volume (ton)
YoY Change (%)
VSF Realization (INR/ton)
YoY Change (%)
QoQ Change (%)
Net Sales
YoY Change (%)
EBITDA
Margins (%)
Depreciation
Interest
Other Income
PBT after EO Items
Tax
Rate (%)
Reported PAT
Adj. PAT
Margins (%)
YoY Change (%)
E: MOSL Estimates
1Q
102,737
18.9
113,309
-4.8
2.3
19,349
35.9
2,671
13.8
945
409
131
1,447
535
36.9
913
913
4.7
-13.8
FY16
2Q
113,756
12.7
116,708
-1.4
3.0
21,197
34.0
3,354
15.8
1,006
401
2,557
4,504
688
15.3
3,815
3,815
18.0
27.5
3Q
120,700
24.4
126,090
8.0
8.0
23,032
49.1
4,290
18.6
1,233
396
668
3,330
611
18.3
2,719
2,719
11.8
194.9
4Q
130,000
9.7
126,090
13.8
0.0
25,044
47.2
4,298
17.2
1,287
268
635
3,086
1,001
32.4
2,086
2,086
8.3
359.1
1Q
121,000
17.8
128,039
13.0
1.5
23,959
23.8
5,078
21.2
1,104
231
781
4,525
1,317
29.1
3,209
3,209
13.4
251.6
FY17
2Q
123,994
9.0
130,713
12.0
2.1
24,887
17.4
5,301
21.3
1,119
156
3,587
7,612
1,690
22.2
5,923
5,923
23.8
55.2
3Q
122,000
1.1
137,438
9.0
5.1
24,947
8.3
5,116
20.5
1,106
107
865
4,769
1,455
30.5
3,314
3,314
13.3
21.9
4QE
124,406
-4.3
124,271
-1.4
-9.6
23,980
-4.3
4,832
20.1
1,153
201
766
3,953
1,461
37.0
2,492
2,492
10.4
19.5
(INR Million)
FY16
468,000
16.2
121,693
5.0
88,622
41.7
14,613
16.5
4,471
1,474
3,992
12,659
2,835
22.4
9,825
9,825
11.1
81.1
FY17E
491,400
5.0
130,093
6.9
97,772
10.3
20,327
20.8
4,481
694
6,000
21,151
5,922
28.0
15,229
15,229
15.6
55.0
19 May 2017
25

March 2017 Results Preview | Media
HT Media
Bloomberg
Equity Shares (m)
M. Cap. (INR b)/(USD b)
52-Week Range (INR)
1,6,12 Rel Perf. (%)
HTML IN
232.8
20 / 0
96 / 70
-1 / -9 / -9
n
n
n
n
n
n
CMP: INR85
n
n
TP: INR90 (+6%)
Neutral
Financial Snapshot (INR Billion)
Y/E MARCH
2016 2017E 2018E 2019E
Net Sales
EBITDA
Adj. NP
Adj. EPS (INR)
25.0
3.1
1.7
7.3
25.3
3.2
1.8
7.9
8.5
7.6
9.0
4.3
10.8
0.8
4.5
0.4
27.7
3.6
1.8
7.9
-0.4
6.9
8.3
4.3
10.8
0.7
3.4
0.4
29.7
3.7
1.9
8.2
4.6
6.6
8.4
4.3
10.3
0.7
2.6
0.4
Adj. EPS Gr. (%) -16.2
BV/Sh (INR)
99.2
RoE (%)
RoCE (%)
Div. Payout (%)
Valuations
P/E (x)
P/BV (x)
EV/EBITDA (x)*
Div. Yield (%)
* Proportionate
11.7
0.9
5.6
0.4
7.7
8.7
4.3
109.4 119.0 129.3
n
We expect revenue to grow 6% YoY to INR6.6b.
Print ad revenue is likely to grow at a weak 3% YoY to INR4.47b,
despite the UP elections, as slow recovery from demonetization is
expected to partially take away election-led gains.
Languishing English print ad growth is expected to remain flat YoY,
given the low base.
Hindi ad revenue is expected to grow 7% YoY to INR1.8b.
Radio ad revenue growth is expected to remain strong at 30%+ YoY
(INR405m).
We expect circulation revenue to increase 3% YoY to INR0.78b.
EBITDA margin is expected to expand by 440bp YoY to 15.4%.
Adjusted net profit is likely to remain flat YoY to INR0.4b, primarily
led by higher interest outgo related to new radio licenses and
higher tax outgo.
The stock trades at 10.8x FY18E and 10.3x FY19E EPS. We revise
our target price to INR90 (11x FY19E EPS). Neutral.
Key things to watch for
Ø
YoY English ad growth (we expect flat ad growth).
Ø
Ø
Hindi ad growth (we expect 7% YoY de-growth).
EBITDA margin (we expect 15.4%).
Quarterly Performance (Consolidated)
Y/E March
Revenue
YoY (%)
Operating expenses
EBITDA
YoY (%)
EBITDA margin (%)
Depreciation
Interest
Other Income
Extra-ordinary exps
PBT
Tax
Effective Tax Rate (%)
PAT
Minority Interest
Reported PAT
Adj PAT
YoY (%)
1Q
5,872
7.5
5,303
568
-8.3
9.7
228
94
281
0
527
171
32.4
356
107
249
249
-23.8
2Q
6,011
7.2
5,352
659
-8.5
11.0
269
123
457
0
724
208
28.7
516
147
368
368
-16.0
FY16
3Q
6,811
12.5
5,625
1,186
37.7
17.4
247
209
271
0
1,001
193
19.2
809
121
688
688
-11.7
4Q
6,310
9.4
5,612
697
44.4
11.1
271
202
535
0
759
263
34.6
497
121
376
376
-4.2
1Q
6,147
4.7
5,504
643
13.1
10.5
295
247
478
0
579
186
32.2
392
168
224
224
-10.1
2Q
6,022
0.2
5,518
505
-23.4
8.4
304
245
780
0
736
224
30.5
512
202
309
309
-16.1
FY17
3Q
6,499
-4.6
5,394
1,105
-6.9
17.0
312
241
549
0
1,100
36
3.3
1,064
150
914
914
32.8
4QE
6,663
5.6
5,634
1,028
47.4
15.4
326
293
300
0
709
209
29.4
500
100
400
400
6.4
FY16
(INR Million)
FY17E
25,330
1.3
22,050
3,280
5.4
12.9
1,237
1,026
2,107
0
3,123
655
21.0
2,468
621
1,847
1,847
9.9
25,004
9.2
21,892
3,111
15.9
12.4
1,015
628
1,543
0
3,011
834
27.7
2,178
496
1,682
1,682
-6.5
19 May 2017
26

March 2017 Results Preview | Sector: Technology
Just Dial
Bloomberg
Equity Shares (m)
M. Cap. (INR b)/(USD b)
52-Week Range (INR)
1,6,12 Rel Perf. (%)
JUST IN
70.2
39 / 1
903 / 318
-2 / 22 / -45
n
n
CMP: INR555
n
Under Review
JD Omni has temporarily shut down, while paid campaign additions
are expected to be impacted by demonetization. Advertisement
campaigns are expected to start from 4QFY17.
We expect revenue growth of 7.5% YoY to INR1.9b in 4QFY17.
We expect EBITDA margin to contract 1000bp YoY to 15.1%.
Consequently, we estimate EBITDA to de-grow 35% to INR292m.
PAT should decline by 31% to INR244m, as against INR353m in
4QFY16.
Financial Snapshot (INR Billion)
Y/E March
2016 2017E 2018E 2019E
Sales
EBITDA
NP
EPS (INR)
EPS Growth (%)
BV/Sh (INR)
RoE (%)
RoCE (%)
Payout (%)
Valuations
P/E (x)
P/BV (x)
EV/EBITDA (x)
Div Yield (%)
25.8
5.5
18.1
0.0
30.7
4.7
28.2
0.5
28.5
4.1
29.3
0.6
23.8
3.6
19.0
0.6
6.9
1.7
1.4
20.4
3.7
96.7
21.1
21.1
6.9
7.3
1.1
1.2
17.2
-15.9
111.5
16.5
16.5
7.3
8.4
1.0
1.3
18.5
7.5
127.1
15.5
15.5
8.4
9.6
1.4
1.5
22.1
19.8
146.3
16.2
16.2
9.6
n
Key things to watch for
Ø
Ø
Ø
Ø
Performance of Search Plus.
Addition of paid campaigns, impact of demonetization on those.
Promotional campaigns.
Employee addition.
Consolidated - Quarterly Earning Model
Y/E March
Net Sales
YoY Change (%)
Total Expenditure
EBITDA
Margins (%)
Depreciation
Interest
Other Income
PBT before EO expense
Extra-Ord expense
PBT
Tax
Rate (%)
Minority Interest & Profit/Loss of Asso. Cos.
Reported PAT
Adj PAT
YoY Adj PAT Change (%)
Margins (%)
E: MOSL Estimates
1Q
1,660
23.0
1,208
452
27.2
67
0
137
521
0
521
161
31
0
361
361
28.2
21.7
FY16
2Q
3Q
1,639 1,661
11.2
7.6
1,322 1,346
317
315
19.3
19.0
79
81
0
0
264
131
501
0
501
97
19
0
405
405
28.6
24.7
366
0
366
108
29
0
259
259
-19.6
15.6
4Q
1,796
14.9
1,346
450
25.1
84
0
155
521
0
521
168
32
0
353
353
-25.1
19.7
1Q
1,763
6.2
1,470
293
16.6
90
0
287
490
0
490
100
20
0
389
389
8.0
22.1
FY17
2Q
3Q
1,803 1,803
10.0
8.5
1,579 1,545
224
257
12.4
14.3
102
107
0
0
260
197
383
0
383
86
23
0
296
296
-26.8
16.4
348
0
348
73
21.1
0
274
274
6.2
15.2
4QE
1,931
7.5
1,639
292
15.1
108
0
180
364
0
364
120
33
0
244
244
-31.1
12.6
(INR million)
FY16 FY17E
6,908
17.1
5,202
1,706
24.7
311
0
585
1,980
0
1,980
561
28.4
0
1,419
1,419
2.8
20.5
7,298
5.6
6,247
1,051
14.4
405
0
924
1,570
0
1,570
377
24.0
0
1,193
1,193
-15.9
16.3
19 May 2017
27

March 2017 Results Preview | Sector: Financials - Banks
State Bank of India
Bloomberg
Equity Shares (m)
M. Cap. (INR b)/(USD b)
52-Week Range (INR)
1,6,12 Rel Perf. (%)
Financial Snapshot (INR b)
Y/E March
2016 2017E
NII
569 589.1
OP
433 467.7
NP
100
99.0
NIM (%)
3.0
2.8
EPS (INR)
15.7
8.7
EPS Gr. (%)
-30.8 -44.8
Cons. BV (INR)
222 229.1
Cons. ABV (INR)
159 144.7
RoE (%)
7.6
6.9
RoA (%)
0.5
0.4
Div. Payout (%)
20.1
19.0
Valuations
Cons. P/E (x)
18.2
28.1
Cons. P/BV (x)
1.3
1.1
Cons P/ABV (x)
1.8
1.7
Div. Yield (%)
0.9
0.5
SBIN IN
7763.6
2303 / 35
299 / 167
8 / 8 / 40
2018E 2019E
657.5 747.4
481.7 553.7
113.0 155.4
2.7
2.8
18.0
24.2
107.1 34.2
243.7 263.3
170.1 214.1
7.5
9.6
0.4
0.5
18.8
18.8
13.5
1.0
1.4
1.0
10.1
0.9
1.1
1.3
n
CMP: INR297
n
TP: INR340 (+15%)
Buy
n
n
n
We expect loan growth to be moderate at 2.5% YoY, with
incremental growth driven primarily by the retail segment. Deposit
growth is expected to be strong at 13.5% YoY, led by impressive
CASA mobilization in 3Q.
NIM would remain largely stable QoQ at 2.7%. Strong MCLR cuts
and lowering of base rate are set to put downward pressure on
yields, with CASA retention key to maintaining NIM.
Stress additions would remain largely in line with 3QFY17. RBI
resolution with respect to large accounts is key to asset quality.
We expect non-interest income to decline 4% YoY, owing to one-off
repatriation gains in 4QFY16 and lower investment gains. Fee
income growth would remain muted and cost pressure would
remain high (+14% YoY). Trading gains would decline QoQ, as SBIN
had booked gains on stake sale of insurance venture in 3Q.
We expect credit cost to remain elevated, led by continued stress
additions and focus on shoring up PCR. The stock trades at 0.9x
FY19E consolidated BV and 10.1x FY19E consolidated EPS. Buy.
Key issues to watch for
Ø
Performance and guidance on asset quality.
Ø
Growth outlook and key focus segments for growth.
Ø
Outlook and update on non-core stake sales and ABs’ merger.
FY17
2Q
3Q
424,815 439,256
278,814 291,741
146,002 147,515
2.4
7.7
82,614
96,619
228,616 244,135
116,373 118,702
112,243 125,433
9.3
30.7
78,967
89,428
33,276
36,004
7,893
9,904
25,383
26,100
-34.6
134.0
2.8
2.9
13.8
7.2
42.7
27.5
366
2.6
1,058
7.1
2.8
2.7
22.1
4.1
46.6
27.7
346
2.4
1,082
7.2
FY16
Quarterly performance
Y/E March
Interest Income
Interest Expense
Net Interest Income
% Change (YoY)
Other Income
Net Income
Operating Expenses
Operating Profit
% Change (YoY)
Other Provisions
Profit before Tax
Tax Provisions
Net Profit
% Change (YoY)
Operating Parameters
NIM (Reported, %)
NIM (Cal, %)
Deposit Growth (%)
Loan Growth (%)
CASA Ratio (%)
Tax Rate (%)
Asset Quality
OSRL (INR B)
OSRL (%)
Gross NPA (INR B)
Gross NPA (%)
1Q
396,429
259,109
137,320
3.6
50,880
188,200
96,179
92,021
4.7
39,997
52,024
15,099
36,924
10.3
3.0
3.0
13.7
6.8
41.7
34.3
560
4.4
564
4.3
FY16
2Q
3Q
406,576 406,440
264,050 269,470
142,526 136,970
7.4
-0.6
61,973
60,870
204,498 197,840
101,839 101,861
102,659
95,979
21.9
3.3
43,606
79,494
59,053
16,485
20,262
5,332
38,791
11,153
25.1
-61.7
3.0
3.0
10.9
10.5
42.2
32.3
535
4.0
568
4.2
2.8
2.8
10.7
12.9
42.7
32.3
486
3.5
728
5.1
(INR Million)
FY17E
4Q
428,313
275,406
152,907
3.9
106,956
259,864
117,945
141,919
11.2
131,741
10,178
-2,460
12,638
-66.2
3.1
3.0
9.8
12.6
43.8
-24.2
391
2.7
982
6.5
1Q
417,186
272,812
144,373
5.1
72,101
216,474
105,935
110,539
20.1
74,131
36,408
11,198
25,210
-31.7
2.8
2.9
10.5
10.7
42.8
23.7
366
2.6
1,015
6.9
4QE
442,681 1,636,853 1,723,938
291,513 1,068,035 1,134,879
151,168 568,818 589,058
-1.1
3.4
3.6
102,908 281,584 354,243
254,077 850,402 943,301
134,615 417,824 475,625
119,461 432,578 467,676
-15.8
9.4
8.1
88,602 294,838 331,128
30,859 137,741 136,547
8,555
38,234
37,551
22,304
99,507
98,997
76.5
-24.0
-0.5
3.0
3.0
9.8
12.6
43.8
27.8
391
2.7
982
6.5
2.7
13.5
2.5
26.0
2.8
13.5
2.5
27.5
1,097
7.1
1,097
7.1
19 May 2017
28

In conversation
1. Maruti: Sub-4 meter cars to dominate Indian mkt; capacity
expansions key; RC Bhargava, Chairman
n
n
n
n
The way the market and the economy is growing there is a need for more and
more capacity. The retail sales trends currently were excellent.
All the capacity expansion is done by Suzuki Motors in Gujarat, which is a 100%
Suzuki subsidiary. The first line of Gujarat Plant has been commissioned and the
second line work is underway.
In India the cars below 4 meters will remain dominant. The company plans to
move from smaller cars to bigger cars.
However, the new smaller cars could be better equipped with electronics and
connectivity gadgets etc, so their value would likely go up. The cars will remain
in the sub-4 meter segment.
2. Bajaj Finserv: General insurance to grow in 15-18% & life on
new biz at 20-25%; Sanjiv Bajaj, MD
n
n
n
n
The mid-sized corporate lending book is showing strong growth and consumer
business is also growing strongly. However we are a bit cautious on SME
portfolio growth.
Always want to make sure that are risk metrics are playing out right. We have
lost that balance in the last four years and we are trying to get it back again.
It should take us a couple of years to get to the figure of 30% new premium to
renewal premium. Expect it to be flat this year.
We have seen some amount of slippage on our LAP portfolio which is mainly
lending to SMEs. It will take another 3-4 quarters before they really align with
their suppliers and customers towards a lower cash regime.
3. L&T Heavy Engg: See nuclear power plants become
operational between 2025 and 2028; SN Roy, Whole Time
Director
n
n
n
n
The total value of the project sanctioned by the cabinet is Rs 1,05,000 crore and
of that, Rs 70,000 crore is for the equipment of the nuclear power plant. The
remaining will be for infrastructure and civil works.
Sanctioning of the 10 plants is a very bold decision taken by the government.
The company will have a major stake in the construction of these nuclear power
plants.
The company is very capable and all geared up to set up the plant without any
joint ventures. India does not require outside help to set up these plants, the
entire set up can be done by domestic companies.
Gorakhpur plant in Haryana would be the first one to take off and in next two
years most of the plants will be on the anvil and by 2025-28 these plants one–
by-one will become operational.
19 May 2017
29

From the think tank
1. Labour’s share is falling everywhere. by Alok Ray
n
One of the long-accepted stylised facts in economics is the constancy of labour’s
share in national income. But that is not valid anymore. Labour’s share (wages
and other benefits to workers) in GDP has been falling since the early 1990s in
most advanced countries. Further, this has been the case in many emerging
economies (though not all) as well at a time when these countries were growing
at a fast rate. The gap in per capita income between the developed and many of
the developing countries narrowed and millions were pulled above the poverty
line.
2. No single entity seems clearly tasked with blocks’
development. by Bibek Debroy
n
The oldest existing statute is Bengal Districts Act of 1836. It is a statute with a
single sentence and says the following. “Power to create new zilas—It shall be
lawful for the State Government, by notification in the Official Gazette, to create
new zilas in any part of West Bengal.” This is the text as it stands today, not as it
was in 1836. There have been amendments in 1874, 1903, 1920, 1948 and 1950.
The parallel legislation still exists in Bangladesh. Two questions follow. First, why
is such an old statute still on statute books?
3. Capex cycle requires fixing of twin-balance-sheet problem,
assured reforms pipeline. by The Financial Express
n
Despite regular predictions on how investment is picking up, the fact is
companies are in no rush to add capacity. The private sector has been holding
back on capex for almost four years now, save for maintenance capex, though
the government sector is estimated to have spent close to Rs 3 lakh crore in
FY17. While consumption demand has been growing—it grew at 7.9% y-o-y in
the four quarters preceding demonetisation—large sectors of the economy such
as construction and real estate have seen little activity.
4. Taking Eurozone growth seriously. by Jim O’neill
n
I have been out of the world of international finance and economic forecasting
for more than four years, but much of what I learned during my 30 years
working full-time in the field still influences how I view the world. One lesson
was to measure an entity’s economic and financial performance by how it
compares both to the entity’s underlying potential and the market’s valuation of
its performance. Applying this approach to the major economies gives rise to
some surprising observations—and possibilities.
19 May 2017
30

5. Some out-of-the-box action. by Chetan Ahya
n
2017 will be the first year of sy nchronous recovery in emer ging markets (EMs)
and de veloped markets (DMs) post 2010. DMs are exiting the deleveraging
phase and EMs are recovering from a period of macroeconomic adjustment.
This synchronous recovery is creating a positive feedback loop, with the pickup
in DM aggregate demand supporting EM exports and reduced underlying
disinflationary concerns in EMs helping to reinforce reflation in DMs. While a
broad-based global recovery is expected, for the first time since the early 2000s,
EMs except China (EMXCs) will be the largest contributor to the acceleration in
global growth in 2017 and 2018.
International
6. Crises, chaos and the world according to Donald Trump. by
Philip Stephens
n
The story told by foreign policy types in Donald Trump’s administration has been
one of a president “normalised” by the office. From time to time, this narrative
takes hold. Briefly. Then Mr Trump blows it up by sacking the director of the
Federal Bureau of Investigation or sharing sensitive intelligence with the Russian
foreign minister. When the Republican senator Robert Corker frets about a
“downward spiral” in the White House he is guilty only of understatement. Mr
Trump is about to set off on his first overseas trip, taking in visits to allies in the
Middle East and Europe.
19 May 2017
31

Click excel icon
for detailed
valuation guide
CMP
(INR)
913
86
2,974
1,055
23,358
1,845
28,349
803
636
239
3,596
1,351
243
6,838
438
530
TP
% Upside
EPS (INR)
(INR) Downside FY17E FY18E FY19E
1,084
98
3,282
1,266
22,924
1,741
30,402
948
608
274
3,622
1,570
-
8,060
619
581
19
13
10
20
-2
-6
7
18
-4
15
1
16
18
41
10
29.3
4.2
133.7
25.3
472.3
93.3
613.8
23.5
23.2
8.2
169.1
61.7
5.4
248.6
11.5
11.7
37.3
43.4
5.2
6.6
154.8 174.0
37.2
50.6
667.8 764.1
104.9 133.9
892.0 1,135.1
30.8
37.9
34.1
43.4
9.5
11.8
198.1 201.2
75.4
89.5
9.9
11.8
300.0 370.9
29.4
62.0
16.7
26.7
Valuation snapshot
P/E (x)
P/B (x)
ROE (%)
FY17E FY18E FY17E FY18E FY17E FY18E FY19E
31.2
20.4
22.3
41.8
49.5
19.8
46.2
34.2
27.4
29.3
21.3
21.9
45.4
27.5
38.0
45.1
30.3
32.0
27.7
34.2
23.1
27.4
18.2
20.5
28.0
NM
35.1
46.4
12.0
19.2
27.3
25.0
NM
19.6
45.7
12.0
NM
25.5
34.9
22.9
35.2
39.1
34.6
14.1
50.5
32.9
15.3
17.6
11.1
45.2
12.8
24.5
16.7
19.2
28.4
35.0
17.6
31.8
26.1
18.7
25.3
18.2
17.9
24.6
22.8
14.9
31.7
21.5
21.0
22.0
33.4
19.3
23.2
18.2
18.6
23.6
19.3
29.2
31.3
9.1
15.5
22.0
9.9
12.4
11.2
10.9
10.6
9.4
16.8
17.9
7.1
14.3
27.9
22.4
10.8
40.0
30.4
12.8
15.1
8.2
24.7
11.0
6.2
4.0
6.2
6.2
9.4
3.1
16.0
6.5
3.2
4.1
7.1
3.3
2.8
5.7
1.7
10.4
4.3
2.2
2.9
2.4
2.2
4.7
2.1
1.4
4.2
0.8
4.6
4.9
1.0
3.6
3.1
1.2
0.8
0.8
0.6
1.2
0.4
0.9
1.3
0.6
1.0
7.5
4.1
1.7
13.4
6.1
3.7
3.2
2.5
2.8
2.4
5.1
3.5
5.5
5.4
7.8
2.7
11.4
5.4
2.8
3.7
6.0
3.0
2.5
4.9
1.5
8.3
3.8
2.0
2.6
2.3
2.0
4.0
1.9
1.3
3.6
0.8
4.0
4.3
0.9
3.0
2.8
1.1
0.7
0.7
0.6
1.1
0.4
0.9
1.2
0.6
1.0
6.1
3.5
1.5
11.2
5.5
3.3
2.7
2.2
2.6
2.1
21.7
20.6
29.5
15.7
18.2
16.9
40.3
20.8
12.1
14.0
35.7
14.5
6.4
20.3
4.7
25.6
14.2
6.9
10.9
8.9
9.9
17.9
10.1
7.2
16.0
-27.0
13.8
12.3
9.4
18.9
11.4
5.0
-2.5
4.2
1.4
10.1
-8.4
3.6
3.9
2.7
2.9
21.7
15.1
14.4
30.4
19.3
25.5
19.4
23.9
6.4
19.7
22.9
22.3
30.2
20.5
24.5
16.3
41.9
22.6
15.9
14.5
35.9
13.9
10.8
21.2
11.0
29.2
17.6
9.9
12.4
7.1
10.9
18.2
9.1
7.4
16.5
4.0
14.5
14.6
10.6
17.9
12.9
11.9
6.0
6.8
5.8
10.6
4.6
5.2
7.3
8.1
6.8
24.0
16.7
14.5
30.6
18.3
27.0
19.3
29.0
10.9
20.2
22.0
24.9
30.0
23.7
23.4
17.9
38.5
23.1
17.5
15.8
31.3
14.7
11.5
22.3
19.7
35.9
20.9
15.7
14.0
10.1
12.5
19.0
9.8
9.0
17.3
7.0
15.7
17.3
12.2
19.4
14.5
14.8
9.2
9.4
7.3
11.1
5.4
7.2
9.3
10.5
8.9
26.2
19.5
15.2
30.9
17.4
29.6
19.0
32.2
12.9
20.6
Company
Automobiles
Amara Raja
Ashok Ley.
Bajaj Auto
Bharat Forge
Bosch
CEAT
Eicher Mot.
Endurance Tech.
Escorts
Exide Ind
Hero Moto
M&M
Mahindra CIE
Maruti Suzuki
Tata Motors
TVS Motor
Aggregate
Banks - Private
Axis Bank
DCB Bank
Equitas Hold.
Federal Bank
HDFC Bank
ICICI Bank
IDFC Bank
IndusInd
J&K Bank
Kotak Mah. Bk
RBL Bank
South Indian
Yes Bank
Aggregate
Banks - PSU
BOB
BOI
Canara
IDBI Bk
Indian Bk
OBC
PNB
SBI
Union Bk
Aggregate
NBFCs
Bajaj Fin.
Bharat Fin.
Dewan Hsg.
GRUH Fin.
HDFC
Indiabulls Hsg
LIC Hsg Fin
Manappuram
M&M Fin.
Muthoot Fin
Reco
Buy
Buy
Buy
Buy
Neutral
Buy
Buy
Buy
Buy
Buy
Neutral
Buy
Not Rated
Buy
Buy
Buy
Neutral
492
Neutral
194
Buy
162
Buy
111
Buy
1,558
Buy
307
Neutral
62
Buy
1,403
Neutral
85
Buy
943
Under Review 552
Buy
26
Buy
1,401
525
170
210
125
1,790
365
62
1,700
89
1,050
-
31
2,110
7
-12
30
12
15
19
1
21
5
11
19
51
15.4
7.0
4.7
4.8
56.8
16.8
3.0
50.1
-31.3
26.8
11.9
2.2
73.0
23.4
8.8
4.8
5.8
67.1
16.8
3.3
59.4
4.4
32.3
17.6
2.9
90.5
41.2
11.2
7.5
7.3
79.4
19.2
4.3
72.0
8.0
40.5
23.8
3.6
114.0
Buy
Neutral
Neutral
Neutral
Buy
Neutral
Buy
Buy
Neutral
188
179
368
70
352
160
159
303
175
224
129
380
49
360
150
186
340
174
19
-28
3
-29
2
-6
17
12
-1
7.5
-5.7
18.8
1.5
29.3
-31.6
6.2
8.7
7.6
19.0
14.5
33.0
6.4
33.3
17.1
9.4
16.9
24.6
26.1
23.7
48.9
8.6
38.1
21.4
13.8
23.3
34.5
Buy
Neutral
Buy
Neutral
Buy
Buy
Neutral
Not Rated
Buy
Buy
1,312
726
417
411
1,539
1,054
675
91
320
380
1,550
769
559
421
1,797
1,227
723
-
400
465
18
6
34
3
17
16
7
25
22
33.6
21.0
29.6
8.1
46.8
69.0
38.2
8.2
7.1
29.7
47.0
32.4
38.6
10.3
50.7
82.2
44.6
11.1
12.9
34.5
63.6
45.3
45.5
12.5
55.9
101.6
51.2
14.0
16.4
40.0
19 May 2017
32

Click excel icon
for detailed
valuation guide
CMP
(INR)
156
753
218
2,182
994
TP
% Upside
EPS (INR)
(INR) Downside FY17E FY18E FY19E
117
-25
25.7
27.2
30.2
831
10
28.6
34.0
40.2
134
-39
31.4
35.0
40.4
2,689
1,269
23
28
84.3
55.6
130.4
77.4
164.7
98.6
Valuation snapshot
P/E (x)
P/B (x)
ROE (%)
FY17E FY18E FY17E FY18E FY17E FY18E
6.1
5.7
1.0
0.9
17.9 17.0
26.3
22.1
4.2
3.6
17.3 17.5
7.0
6.2
1.3
1.1
19.9 19.1
25.9
17.9
18.5
76.4
27.0
29.7
50.3
50.8
24.8
39.5
61.6
51.9
12.3
22.5
32.1
22.5
77.4
43.0
31.5
42.7
25.3
30.5
36.9
51.5
49.5
35.8
63.1
16.4
40.5
32.7
68.7
25.2
NM
NM
49.0
45.3
38.8
54.7
49.3
46.1
37.6
40.7
47.1
34.0
50.3
33.2
47.4
48.6
16.7
12.8
15.9
60.0
23.9
28.8
34.1
42.5
23.2
34.5
33.5
41.1
NM
19.3
26.6
17.4
56.8
36.6
22.7
35.4
19.4
27.7
31.9
38.0
33.9
18.7
36.7
13.0
23.7
23.8
43.8
23.2
34.8
46.4
39.2
35.8
29.1
49.7
42.7
38.2
35.2
36.9
40.9
31.2
44.0
29.8
42.1
44.0
2.9
2.0
3.2
9.7
5.1
1.2
8.2
38.5
1.3
8.4
7.3
9.5
1.6
3.5
3.4
1.9
7.2
7.4
-1.8
4.8
3.5
5.0
4.1
2.6
3.7
2.1
4.4
1.8
1.7
4.4
4.0
4.5
3.3
6.4
9.3
5.2
3.8
14.5
18.9
20.9
9.9
14.0
11.4
7.1
32.1
8.8
7.5
17.0
2.5
1.8
2.8
8.4
4.5
1.1
7.7
26.2
1.3
7.7
6.6
8.4
1.6
3.0
3.1
1.7
6.2
6.3
-2.0
4.4
3.1
4.5
3.8
2.5
3.7
2.0
3.9
1.6
1.6
3.8
3.9
3.9
3.0
5.8
7.7
4.6
3.5
13.9
15.0
19.7
8.5
11.3
8.9
7.0
31.4
7.7
6.9
14.5
11.8
11.7
17.2
12.7
20.4
4.0
18.0
94.3
5.4
22.6
11.7
18.2
14.9
16.6
10.9
8.6
9.3
18.4
NM
11.6
8.9
17.6
11.1
5.0
7.5
6.0
7.2
11.7
4.0
14.4
6.0
19.6
-3.2
-3.1
20.2
12.0
9.8
28.5
43.1
50.4
28.4
35.8
24.6
22.2
65.6
28.4
16.4
36.7
16.2
14.5
17.7
13.9
18.8
4.0
23.2
73.3
5.5
23.2
20.7
20.4
-3.3
16.8
12.1
10.0
11.0
18.6
-8.8
12.9
16.7
17.1
11.7
6.7
11.0
10.9
11.3
13.2
6.2
17.0
9.1
18.0
9.0
13.1
21.5
13.6
11.9
28.6
39.2
53.2
26.0
33.8
24.5
22.6
72.1
27.6
17.1
35.5
FY19E
16.8
17.6
19.1
17.8
16.3
17.9
15.8
19.1
4.0
31.6
66.1
6.0
25.3
19.2
21.4
15.1
16.2
12.9
11.8
13.7
19.0
-11.0
13.2
17.3
17.1
12.8
7.1
14.2
13.2
13.1
14.8
7.7
18.6
14.1
18.5
12.3
20.8
22.6
15.7
13.7
30.6
38.0
60.3
26.3
32.2
23.0
23.0
81.4
28.7
18.1
38.1
Company
Reco
PFC
Neutral
Repco Home
Buy
REC
Neutral
Shriram
City
Buy
Union
STF
Buy
Aggregate
Capital Goods
ABB
Sell
Bharat Elec.
Buy
BHEL
Sell
Blue Star
Neutral
CG Cons. Elec.
Buy
CG Power & Indu. Sell
Cummins
Neutral
GE T&D
Neutral
Havells
Neutral
Inox Wind
Under Review
K E C Intl
Buy
L&T
Buy
Pennar Eng.
Not Rated
Siemens
Neutral
Solar Ind
Neutral
Suzlon Energy
Not Rated
Thermax
Sell
Va Tech Wab.
Buy
Voltas
Sell
Aggregate
Cement
Ambuja Cem.
Buy
ACC
Neutral
Birla Corp.
Buy
Dalmia Bharat
Buy
Grasim Inds.
Neutral
India Cem
Neutral
J K Cements
Buy
JK Lakshmi Ce
Under Review
Ramco Cem
Buy
Orient Cem
Buy
Prism Cem
Buy
Shree Cem
Buy
Ultratech
Buy
Aggregate
Consumer
Asian Paints
Neutral
Britannia
Buy
Colgate
Buy
Dabur
Neutral
Emami
Buy
Godrej Cons.
Neutral
GSK Cons.
Sell
HUL
Buy
ITC
Buy
Jyothy Lab
Neutral
Marico
Neutral
1,505
175
165
648
232
90
1,053
370
496
158
236
1,722
131
1,379
817
20
1,006
670
414
1,200
180
115
650
221
45
990
340
480
-
175
1,970
-
1,355
800
-
781
760
370
-20
3
-30
0
-5
-50
-6
-8
-3
-26
14
-2
-2
-22
13
-11
19.7
6.5
5.5
12.9
4.6
3.6
26.6
6.0
9.6
12.8
10.5
53.6
5.8
17.8
19.0
0.6
23.5
26.5
13.6
25.1
7.3
5.7
19.0
5.5
3.9
30.5
11.0
12.1
-3.2
12.3
64.7
7.5
24.3
22.3
0.9
28.4
34.5
14.9
32.2
8.5
5.8
28.0
6.7
4.5
36.5
11.4
14.5
15.5
13.5
75.8
10.0
33.3
26.5
1.0
31.5
40.3
16.9
252
1,670
772
2,445
1,129
207
1,102
478
700
157
122
18,821
4,350
283
1,521
869
3,162
1,067
152
1,322
-
815
185
118
23,316
4,928
12
-9
13
29
-5
-26
20
16
18
-3
24
13
4.9
6.6
33.7
49.2
21.5
41.2
38.8
66.7
68.7
86.6
5.1
8.7
33.7
46.4
7.0
10.9
27.8
30.1
-1.6
4.5
-0.6
2.6
384.4 480.7
96.1 121.4
7.2
63.6
54.4
87.1
111.1
11.9
59.5
17.4
36.2
6.8
4.8
621.0
159.1
1,150
3,554
979
272
1,081
1,782
5,302
987
278
378
306
1,210
4,065
1,180
295
1,250
1,950
4,380
1,165
320
380
335
5
14
20
8
16
9
-17
18
15
0
10
21.0
23.1
72.2
83.3
21.2
25.7
7.2
7.7
26.5
29.2
37.8
43.6
156.1 169.7
19.6
22.4
8.4
9.3
8.0
9.0
6.3
6.9
27.4
101.7
31.1
9.1
34.7
50.0
185.5
25.9
11.0
10.5
8.4
19 May 2017
33

Click excel icon
for detailed
valuation guide
CMP
Reco
(INR)
Sell
6,528
Buy
14,622
Neutral
245
Neutral
771
Buy
7,619
Under Review 792
Neutral
2,042
TP
% Upside
(INR) Downside
5,715
-12
17,480
20
250
2
740
-4
8,760
15
-
2,025
-1
EPS (INR)
FY18E FY19E
118.6 139.5
305.1 388.4
6.9
12.5
18.3
20.5
155.8 181.6
13.6
17.6
42.2
58.7
Valuation snapshot
P/E (x)
P/B (x)
ROE (%)
FY17E FY18E FY17E FY18E FY17E FY18E
55.3
55.0 20.9 19.2
39.0 36.4
62.1
47.9 25.6 20.2
41.3 42.2
302.6 35.3
3.0
2.8
1.3
8.2
46.5
42.2 12.0
9.7
27.9 25.4
52.6
48.9 43.5 34.6
45.3 78.9
74.2
58.2
8.9
7.8
12.6 14.3
71.3
48.4 13.5 10.7
20.8 22.1
43.9 39.0 13.1 11.6 29.9 29.6
28.0
24.2
27.8
15.1
32.3
39.1
31.3
14.2
36.9
83.8
17.2
20.4
69.7
33.3
21.2
32.0
24.1
37.9
23.2
25.6
20.1
42.2
40.2
30.0
16.3
15.3
33.5
69.2
18.0
NM
11.0
10.7
17.3
72.8
NM
34.8
22.3
41.0
11.1
12.5
NM
12.9
23.2
22.4
24.5
13.2
29.9
26.6
25.4
18.6
25.0
66.8
15.0
18.2
43.3
18.8
16.6
31.6
20.1
30.6
17.2
21.1
16.6
33.3
29.9
15.9
8.6
12.3
24.5
37.5
16.0
44.4
10.1
10.6
15.2
42.3
NM
29.3
31.5
29.3
8.6
11.4
NM
9.5
6.0
5.4
9.2
3.8
4.4
7.8
3.5
3.5
3.6
2.2
4.2
3.4
15.6
2.7
4.4
5.5
4.6
7.7
5.6
4.6
2.6
18.7
3.5
2.1
2.2
2.4
3.7
19.9
4.5
1.1
1.9
0.8
3.4
7.4
3.8
8.7
8.2
6.1
1.6
3.4
0.3
2.0
5.0
4.5
7.0
3.0
4.0
6.4
3.1
3.1
3.0
1.9
3.4
2.4
18.6
2.4
3.6
5.1
3.9
6.3
4.6
3.9
2.3
14.3
3.2
2.0
2.0
2.0
3.4
13.0
4.0
1.1
1.6
0.7
2.9
6.4
3.2
8.0
6.9
5.4
1.3
2.9
0.3
1.7
23.1
24.4
37.7
28.6
13.6
21.4
11.0
25.4
9.6
2.7
24.7
20.0
22.4
8.4
22.8
17.1
19.8
22.2
25.9
17.9
11.5
50.5
8.8
7.2
12.4
16.7
11.0
33.6
26.2
-4.1
18.5
7.7
20.7
10.6
-21.7
25.1
23.7
14.9
15.9
24.4
-7.5
17.3
23.6
22.0
32.3
25.3
13.3
26.5
12.2
17.7
13.3
3.1
22.4
16.3
43.0
13.5
23.8
16.3
20.9
22.5
29.3
18.3
14.8
48.6
11.2
12.9
19.4
17.8
13.7
42.0
26.2
2.5
16.8
7.1
20.6
16.3
0.0
27.3
23.8
18.3
17.1
27.2
-4.5
19.7
FY19E
39.0
43.2
13.2
23.4
74.0
16.2
23.8
30.5
24.1
21.7
30.0
24.0
16.1
27.9
13.8
18.8
15.1
6.1
21.3
17.2
56.9
15.9
22.1
19.3
21.0
20.7
29.6
18.9
14.8
46.8
11.8
15.3
25.4
18.6
14.9
43.9
26.8
8.8
15.8
7.0
20.4
22.0
11.1
29.0
23.8
20.3
16.3
25.4
-0.6
18.8
Company
Nestle
Page Inds
Parag Milk
Pidilite Ind.
P&G Hygiene
United Brew
United Spirits
Aggregate
Healthcare
Alembic Phar
Alkem Lab
Ajanta Pharma
Aurobindo
Biocon
Cadila
Cipla
Divis Lab
Dr Reddy’s
Fortis Health
Glenmark
Granules
GSK Pharma
IPCA Labs
Lupin
Sanofi India
Sun Pharma
Syngene Intl
Torrent Pharma
Aggregate
Logistics
Allcargo Logistics
Blue Dart
Concor
Gateway
Distriparks
Gati
Transport Corp.
Aggregate
Media
Dish TV
D B Corp
Den Net.
Hind. Media
HT Media
Jagran Prak.
PVR
Siti Net.
Sun TV
Zee Ent.
Aggregate
Metals
Hindalco
Hind. Zinc
JSPL
JSW Steel
FY17E
118.0
235.6
0.8
16.6
144.9
10.7
28.6
Neutral
Neutral
Buy
Buy
Sell
Buy
Neutral
Neutral
Neutral
Buy
Neutral
Buy
Neutral
Neutral
Buy
Buy
Buy
Not Rated
Buy
603
1,920
1,624
601
988
470
559
613
2,678
197
675
148
2,404
526
1,305
4,137
654
493
1,314
640
1,850
2,028
900
900
510
550
600
2,625
250
800
200
2,700
540
1,850
4,850
850
-
1,700
6
-4
25
50
-9
9
-2
-2
-2
27
18
35
12
3
42
17
30
29
21.6
26.0
79.3
85.7
58.4
66.4
39.8
45.4
30.6
33.1
12.0
17.7
17.9
22.0
43.0
32.9
72.6 107.1
2.3
2.9
39.3
45.0
7.3
8.1
34.5
55.5
15.8
27.9
61.4
78.6
129.1 131.0
27.1
32.5
13.0
16.1
56.6
76.3
32.1
100.0
79.9
54.3
44.9
23.0
28.5
38.6
144.5
6.5
53.5
11.1
64.4
37.3
88.8
173.4
38.7
18.0
93.4
Buy
Not Rated
Neutral
Buy
Not Rated
Not Rated
181
4,331
1,193
249
136
259
203
-
1,042
314
-
-
12
-13
26
9.0
10.9
102.5 129.9
29.7
39.9
8.3
8.4
16.9
15.7
15.9
21.0
12.3
163.2
44.9
20.1
23.9
25.9
Buy
Buy
Neutral
Buy
Neutral
Buy
Buy
Neutral
Neutral
Buy
100
368
97
278
86
187
1,511
32
873
515
115
450
90
360
90
225
1,667
40
860
600
15
22
-8
30
4
21
10
25
-1
16
1.4
20.4
-3.6
25.2
8.0
10.8
20.8
-1.8
25.1
23.1
2.7
23.0
2.2
27.4
8.2
12.2
35.7
0.0
29.7
16.4
4.3
26.5
8.5
30.3
8.7
13.9
56.8
1.2
34.5
19.5
Buy
Sell
Buy
Buy
194
245
113
191
242
235
181
241
25
-4
60
26
17.5
19.7
-22.3
14.8
22.6
21.5
-17.5
20.1
25.9
23.7
-2.2
22.6
19 May 2017
34

Click excel icon
for detailed
valuation guide
CMP
(INR)
67
124
60
231
487
TP
% Upside
EPS (INR)
(INR) Downside FY17E FY18E FY19E
83
25
3.9
5.3
5.8
178
43
12.1
12.3
13.0
30
-50
-7.4 -12.6
0.4
225
-3
15.1
24.5
27.4
451
-7
37.0
39.5
45.7
Valuation snapshot
P/E (x)
P/B (x)
ROE (%)
FY17E FY18E FY17E FY18E FY17E FY18E
17.1
12.5
1.2
1.2
7.5
9.6
10.3
10.1
1.6
1.5
13.4 15.5
NM
NM
0.7
0.8
-8.1 -15.4
15.3
9.4
1.4
1.3
9.7
14.8
13.2
12.3
1.5
1.4
15.4 11.4
17.4 14.1
1.4
1.3
8.0
9.3
12.8
18.7
44.9
19.4
9.9
10.1
23.2
11.7
11.1
11.9
19.5
12.4
12.8
82.9
52.2
56.3
16.8
14.2
18.6
15.3
10.8
14.0
19.8
13.5
12.0
15.4
26.2
19.0
13.0
15.5
16.4
16.3
33.4
25.5
NM
25.9
36.5
17.4
16.5
16.9
13.3
13.6
14.5
15.1
13.3
14.0
19.6
15.7
11.8
11.2
22.9
10.7
9.6
9.0
17.1
10.9
11.6
47.0
45.9
47.1
13.5
13.7
16.6
14.9
9.6
13.0
16.1
13.4
12.1
13.2
21.5
18.1
11.8
15.1
13.3
15.9
59.0
21.7
NM
34.4
166.4
14.8
11.1
30.8
11.0
11.7
12.4
12.8
3.3
2.1
4.6
2.2
2.6
2.4
4.9
2.4
1.1
1.2
4.1
1.4
1.8
8.3
9.9
9.9
2.7
3.5
4.5
3.2
1.6
4.9
3.2
2.1
1.9
2.4
10.0
6.0
2.4
2.5
2.5
3.8
2.2
4.6
1.3
12.1
2.5
6.9
1.9
1.0
1.4
2.2
1.4
2.3
2.8
1.9
3.9
2.0
2.3
2.1
4.2
2.0
1.0
1.1
3.5
1.2
1.6
9.2
8.7
9.0
2.4
3.5
4.0
2.9
1.4
3.8
2.9
1.9
1.7
2.3
8.0
6.1
2.1
2.2
2.2
3.6
2.1
4.0
1.6
8.9
2.5
6.9
1.6
1.0
1.3
1.9
1.3
2.2
27.1
13.0
10.7
12.0
27.8
26.0
22.3
24.8
9.8
10.4
23.6
11.9
13.7
10.1
20.6
17.5
16.2
27.5
26.5
23.3
14.3
40.4
16.8
14.1
16.1
17.0
42.5
33.5
20.1
16.9
16.3
23.5
6.7
16.2
-1.6
126.2
6.9
39.5
11.1
6.7
10.6
17.3
10.8
15.6
22.7
14.0
21.5
13.5
20.7
20.4
19.7
20.5
10.8
13.0
22.1
11.8
13.7
19.5
20.2
19.1
17.8
25.4
25.3
21.4
15.6
32.8
18.9
14.9
14.8
18.1
41.3
32.4
19.5
15.5
17.7
22.8
3.7
19.4
-20.8
29.8
1.5
46.3
15.8
3.3
11.9
17.5
11.1
16.9
FY19E
9.9
15.1
0.5
15.3
12.1
11.7
21.4
14.4
22.0
14.5
18.6
18.8
19.2
18.4
11.6
14.1
25.2
11.2
13.6
24.9
20.9
20.2
17.9
26.0
23.5
21.2
15.2
28.3
20.5
14.7
14.7
20.3
40.8
32.3
19.2
15.7
17.8
22.1
6.4
19.1
-27.4
41.4
4.0
51.8
15.2
2.8
13.3
17.7
10.6
17.9
Company
Nalco
NMDC
SAIL
Vedanta
Tata Steel
Aggregate
Oil & Gas
BPCL
GAIL
Gujarat Gas
Gujarat St. Pet.
HPCL
IOC
IGL
MRPL
Oil India
ONGC
PLNG
Reliance Ind.
Aggregate
Retail
Jubilant Food
Titan Co.
Aggregate
Technology
Cyient
HCL Tech.
Hexaware
Infosys
KPIT Tech
L&T Infotech
Mindtree
Mphasis
NIIT Tech
Persistent Sys
Tata Elxsi
TCS
Tech Mah
Wipro
Zensar Tech
Aggregate
Telecom
Bharti Airtel
Bharti Infratel
Idea Cellular
Tata Comm
Aggregate
Utiltites
Coal India
CESC
JSW Energy
NTPC
Power Grid
Tata Power
Aggregate
Reco
Buy
Buy
Sell
Neutral
Sell
Buy
Neutral
Sell
Neutral
Buy
Buy
Neutral
Neutral
Buy
Buy
Buy
Neutral
714
405
786
172
532
440
1,003
136
317
181
443
1,327
763
349
735
162
604
441
1,023
124
382
233
547
1,264
7
-14
-6
-6
14
0
2
-9
20
29
23
-5
55.9
53.7
21.7
28.9
17.5
40.0
8.9
11.0
53.5
44.9
43.7
39.4
43.3
43.8
11.7
12.8
28.6
33.1
15.3
20.0
22.7
25.9
106.6 121.7
58.4
32.5
49.0
13.2
45.8
41.0
49.4
13.3
37.8
22.9
35.1
127.8
Neutral
Neutral
1,023
472
1,110
505
9
7
12.3
9.0
21.7
10.3
29.1
12.1
Buy
Buy
Neutral
Buy
Neutral
Buy
Neutral
Neutral
Neutral
Buy
Buy
Neutral
Buy
Neutral
Buy
516
848
255
962
128
776
492
576
513
582
1,553
2,534
422
524
899
620
960
235
1,200
150
850
475
550
470
700
1,780
2,400
550
500
1,020
20
13
-8
25
17
10
-3
-5
-8
20
15
-5
30
-5
14
30.6
38.3
59.8
61.9
13.7
15.4
62.9
64.7
11.9
13.4
55.5
59.7
24.9
30.5
42.7
43.0
42.8
42.5
37.7
43.9
59.3
72.1
133.4 139.7
32.5
35.7
33.8
34.6
54.9
67.6
44.2
67.6
16.7
71.1
15.2
65.0
36.5
44.9
46.1
51.4
89.0
149.6
40.2
38.2
78.4
Buy
Buy
Buy
Buy
371
379
87
673
430
435
110
811
16
15
27
20
11.1
14.9
-1.1
26.0
6.3
17.5
-12.9
19.5
11.5
19.9
-13.6
39.4
Buy
Buy
Buy
Buy
Buy
Sell
277
830
65
158
208
84
335
970
88
199
243
69
21
17
35
26
17
-18
15.9
50.4
3.9
11.9
15.3
5.8
18.7
74.7
2.1
14.3
17.7
6.7
20.9
82.2
1.8
17.3
20.7
7.0
19 May 2017
35

Click excel icon
for detailed
valuation guide
CMP
(INR)
389
552
434
260
418
156
2,751
321
1,097
195
870
283
94
514
534
399
796
1,004
2,798
163
813
2,798
1,779
283
1,444
6,418
215
384
TP
% Upside
EPS (INR)
(INR) Downside FY17E FY18E FY19E
382
-
532
274
-
229
3,334
287
1,234
229
1,000
240
-
-
649
551
841
1,325
2,841
210
1,046
2,200
1,825
367
1,288
5,281
140
393
-2
23
5
47
21
-11
12
18
15
-15
12.4
13.5
13.6
7.7
16.0
3.3
67.6
11.4
46.0
13.0
16.9
3.3
5.5
17.2
23.4
26.0
13.3
24.8
72.9
6.6
16.6
15.6
14.9
8.6
18.3
6.9
112.9
13.9
65.6
14.6
17.9
8.0
7.6
18.5
28.6
31.0
22.0
30.5
89.3
8.6
23.6
19.3
15.2
11.4
23.6
7.6
166.7
16.9
88.2
17.6
21.0
12.0
10.0
22.1
36.1
36.7
31.1
42.9
109.3
10.5
43.6
164.7
125.1
12.2
42.9
176.0
5.4
16.0
Valuation snapshot
P/E (x)
P/B (x)
ROE (%)
FY17E FY18E FY17E FY18E FY17E FY18E FY19E
31.4
41.0
31.8
33.6
26.2
47.7
40.7
28.2
23.8
15.0
51.6
84.9
16.9
29.9
22.8
15.4
59.8
40.4
38.4
24.5
26.8
37.6
21.6
39.1
53.5
60.0
58.0
54.9
23.4
35.4
29.2
30.1
22.8
22.7
24.4
23.2
16.7
13.4
48.6
35.2
12.3
27.8
18.7
12.9
36.2
32.9
31.3
18.9
23.4
22.0
17.8
29.5
41.1
46.6
46.9
32.2
2.8
5.4
33.5
8.8
4.5
4.1
5.6
8.6
19.6
4.5
5.5
4.9
1.4
4.6
3.8
4.1
3.9
3.8
11.7
6.2
7.3
3.6
3.4
5.0
29.1
9.5
15.3
5.0
2.6
4.8
30.1
7.3
4.1
3.1
4.6
6.9
17.4
3.3
5.1
4.3
1.4
4.0
3.6
3.4
3.6
3.6
10.9
5.2
5.9
3.3
2.9
4.5
24.8
8.6
12.3
4.5
10.3 11.5
14.7
13.9 14.5
15.9
110.9 108.6 100.4
28.9 26.5
28.6
18.2 18.9
21.7
9.0
15.7
17.0
15.1 20.7
24.3
34.7 33.0
32.4
86.2 110.2 129.8
34.8 28.8
25.9
11.1 10.9
11.9
5.9
12.5
16.2
8.6
11.7
14.8
16.5 15.5
16.2
17.3 19.8
22.9
29.9 28.7
27.7
7.7
9.3
13.5
9.9
11.1
14.6
30.4 35.9
39.6
26.0
30.9
10.0
16.5
13.7
56.8
16.5
29.4
9.5
30.0
27.9
15.7
17.4
16.1
65.0
19.4
29.1
14.8
30.9
27.8
18.2
19.1
18.2
66.3
22.2
27.6
17.5
Company
Others
Arvind
Bata India
Castrol India
Century Ply.
Coromandel Intl
Delta Corp
Dynamatic Tech
Eveready Inds.
Interglobe
Indo Count
Info Edge
Inox Leisure
Jain Irrigation
Just Dial
Kaveri Seed
Kitex Garm.
Manpasand
MCX
Monsanto
Navneet
Education
PI Inds.
Piramal Enterp.
SRF
S H Kelkar
Symphony
TTK Prestige
V-Guard
Wonderla
Reco
Neutral
Under Review
Buy
Buy
Under Review
Buy
Buy
Buy
Neutral
Buy
Buy
Sell
Under Review
Under Review
Buy
Buy
Buy
Buy
Buy
Buy
Buy
Buy
Buy
Buy
Sell
Neutral
Neutral
Buy
22
38
6
32
2
29
29
-21
3
29
-11
-18
-35
2
30.4
34.8
74.5 127.1
82.4
99.9
7.2
9.6
27.0
35.1
106.9 137.7
3.7
4.6
7.0
11.9
19 May 2017
36

MOSL Universe stock performance
Company
Automobiles
Amara Raja
Ashok Ley.
Bajaj Auto
Bharat Forge
Bosch
CEAT
Eicher Mot.
Endurance Tech.
Escorts
Exide Ind
Hero Moto
M&M
Mahindra CIE
Maruti Suzuki
Tata Motors
TVS Motor
Banks - Private
Axis Bank
DCB Bank
Equitas Hold.
Federal Bank
HDFC Bank
ICICI Bank
IDFC Bank
IndusInd
J&K Bank
Kotak Mah. Bk
RBL Bank
South Indian
Yes Bank
Banks - PSU
BOB
BOI
Canara
IDBI Bk
Indian Bk
OBC
PNB
SBI
Union Bk
NBFCs
Bajaj Fin.
Bharat Fin.
Dewan Hsg.
GRUH Fin.
HDFC
Indiabulls Hsg
LIC Hsg Fin
Manappuram
M&M Fin.
Muthoot Fin
PFC
Repco Home
REC
STF
Shriram City Union
1 Day (%)
-2.7
-1.6
-1.9
-6.1
-3.6
-0.6
-2.6
-0.4
-2.7
-1.8
-1.3
-1.9
-0.3
-1.6
-2.5
-0.6
-2.1
-1.5
-2.7
-3.3
0.0
-0.9
-3.0
-1.5
-2.6
-0.9
-2.1
-0.4
-3.7
-2.3
-3.0
-1.5
-7.8
-2.0
-1.8
-3.9
-1.5
-2.4
-0.8
-6.9
-2.9
-2.0
-0.9
-2.3
-2.3
-2.0
-4.0
-3.9
-3.4
-1.8
-0.9
-1.7
-3.0
1M (%)
6.7
5.9
5.4
1.6
3.3
28.2
10.9
-1.5
17.6
6.1
11.5
7.0
8.1
11.4
-1.3
13.0
-1.2
9.2
-1.4
21.0
7.8
8.5
4.1
-2.0
8.8
7.1
0.3
16.5
-12.7
6.7
18.2
17.9
-3.7
36.5
5.6
1.6
4.4
14.6
6.0
-1.1
5.8
4.8
4.0
9.8
5.0
-2.5
-4.5
-5.0
0.4
0.4
11.9
-6.2
-2.8
12M (%)
-3.9
-15.5
20.6
43.4
11.0
82.6
51.4
260.2
58.3
24.7
2.4
27.6
74.7
13.8
78.6
-1.9
110.4
11.0
120.8
36.6
35.7
30.9
29.6
37.1
32.9
58.0
44.3
31.6
110.0
104.8
6.6
283.3
89.2
108.1
68.1
58.4
69.0
14.9
106.6
56.8
27.4
44.6
46.3
84.9
6.9
74.8
78.1
10.1
169.4
-12.5
37.9
Company
Capital Goods
ABB
Bharat Elec.
BHEL
Blue Star
CG Cons. Elec.
CG Power & Inds Sol.
Cummins
GE T&D
Havells
Inox Wind
K E C Intl
L&T
Pennar Eng.
Siemens
Solar Ind
Suzlon Energy
Thermax
Va Tech Wab.
Voltas
Cement
Ambuja Cem.
ACC
Birla Corp.
Dalmia Bharat
Grasim Inds.
India Cem
J K Cements
JK Lakshmi Ce
Ramco Cem
Orient Cem
Prism Cem
Shree Cem
Ultratech
Consumer
Asian Paints
Britannia
Colgate
Dabur
Emami
Godrej Cons.
GSK Cons.
HUL
ITC
Jyothy Lab
Marico
Nestle
Page Inds
Parag Milk
Pidilite Ind.
P&G Hygiene
United Brew
United Spirits
Healthcare
Alembic Phar
Alkem Lab
Ajanta Pharma
Aurobindo
1 Day (%)
-3.6
-2.9
-3.7
-3.5
-4.2
-3.4
3.4
-1.4
-2.5
-0.2
-3.7
-1.9
-1.4
-1.7
-1.2
0.5
-0.8
-1.4
-3.7
-2.4
-1.7
-0.3
-3.6
-3.7
-5.0
-1.1
-7.2
-1.4
-2.1
-2.7
-0.2
-2.8
-0.3
-3.1
0.2
-1.3
-0.2
-4.1
-0.1
-1.9
-1.3
-0.8
-0.9
-0.4
-2.6
-1.2
-0.3
-0.7
-2.7
-3.7
-0.9
1.1
-1.3
-1.2
1M (%)
6.6
1.8
-3.3
-5.6
10.1
14.8
12.1
8.9
3.0
-15.0
9.8
3.0
-10.0
6.2
-0.4
1.8
1.2
1.2
1.5
4.4
11.9
3.6
18.6
6.2
28.6
19.3
5.6
4.6
7.5
22.2
6.4
9.5
10.5
5.4
-1.1
-5.6
6.6
7.9
2.0
8.1
-0.3
-3.3
2.4
3.1
6.1
-0.3
8.5
3.5
7.3
8.7
-1.1
-8.2
-6.4
-9.5
12M (%)
20.0
52.2
37.4
48.3
59.5
49.1
22.8
5.4
36.7
-34.3
78.1
31.5
-14.0
19.5
23.1
28.3
37.8
14.0
25.2
16.3
16.2
103.2
162.0
32.6
132.6
87.3
39.3
43.3
0.0
34.2
42.1
35.2
19.3
19.6
18.2
-4.9
-2.4
28.7
-9.4
19.7
25.3
18.7
21.8
5.4
10.4
14.1
26.9
18.4
8.0
-19.6
6.0
57.8
3.0
-23.3
19 May 2017
37

MOSL Universe stock performance
Company
Biocon
Cadila
Cipla
Divis Lab
Dr Reddy’s
Fortis Health
Glenmark
Granules
GSK Pharma
IPCA Labs
Lupin
Sanofi India
Sun Pharma
Syngene Intl
Torrent Pharma
Logistics
Allcargo Logistics
Blue Dart
Concor
Gateway Distriparks
Gati
Transport Corp.
Media
Dish TV
D B Corp
Den Net.
Hind. Media
HT Media
Jagran Prak.
PVR
Siti Net.
Sun TV
Zee Ent.
Metals
Hindalco
Hind. Zinc
JSPL
JSW Steel
Nalco
NMDC
SAIL
Vedanta
Tata Steel
Oil & Gas
BPCL
GAIL
Gujarat Gas
Gujarat St. Pet.
HPCL
IOC
IGL
MRPL
Oil India
ONGC
PLNG
Reliance Ind.
Retail
Jubilant Food
1 Day (%)
-0.4
-1.8
-0.1
-1.2
-2.0
-4.6
-3.2
-2.2
-0.8
-3.3
0.6
-0.8
0.5
0.2
-1.4
-1.2
-1.3
-0.2
1.5
-1.4
-1.7
-1.6
0.4
-4.4
-2.6
-3.8
-1.8
-1.2
0.2
-1.9
-1.7
-2.4
-2.7
-2.7
-7.4
-1.6
-3.0
-3.6
-4.6
-1.3
-1.8
-0.8
-0.2
0.4
-1.9
-1.0
-1.5
0.9
-1.1
-1.7
-1.4
-1.9
-2.6
1M (%)
-11.0
6.1
-2.8
-3.2
1.8
0.7
-24.3
7.5
-9.0
-13.5
-7.8
-8.9
-1.7
-5.2
-9.4
6.6
-11.5
0.2
-8.9
1.1
12.2
1.2
-2.8
2.0
-4.9
2.2
-5.9
-2.8
-14.2
9.2
-0.4
5.3
-10.2
-4.5
2.2
-9.3
-2.1
0.2
0.3
8.1
-1.6
2.8
-7.1
-0.6
-4.3
1.9
-4.3
18.3
-4.5
-0.1
2.8
-3.2
1.5
12M (%)
58.8
46.8
6.6
-42.9
-11.6
15.5
-20.5
11.9
-29.2
16.5
-20.1
-3.8
-17.8
24.3
-5.0
24.8
-20.2
9.3
-17.8
15.7
52.8
5.3
11.2
10.9
-0.8
-3.4
10.4
81.2
-12.8
104.1
18.3
117.2
46.4
84.2
46.1
60.5
34.2
43.0
132.9
48.0
53.1
41.6
50.7
25.4
89.3
116.5
72.6
102.4
22.6
26.7
61.4
36.8
-12.4
Company
Titan Co.
Technology
Cyient
HCL Tech.
Hexaware
Infosys
KPIT Tech
L&T Infotech
Mindtree
Mphasis
NIIT Tech
Persistent Sys
Tata Elxsi
TCS
Tech Mah
Wipro
Zensar Tech
Telecom
Bharti Airtel
Bharti Infratel
Idea Cellular
Tata Comm
Utiltites
Coal India
CESC
JSW Energy
NTPC
Power Grid
Tata Power
Others
Arvind
Bata India
Castrol India
Century Ply.
Coromandel Intl
Delta Corp
Dynamatic Tech
Eveready Inds.
Interglobe
Indo Count
Info Edge
Inox Leisure
Jain Irrigation
Just Dial
Kaveri Seed
Kitex Garm.
Manpasand
MCX
Monsanto
Navneet Educat.
PI Inds.
Piramal Enterp.
SRF
S H Kelkar
Symphony
TTK Prestige
V-Guard
Wonderla
1 Day (%)
-2.2
-1.9
-0.7
1.6
1.0
-0.2
0.0
-3.0
-1.4
-1.8
-0.6
-0.6
3.4
-2.2
3.5
0.1
-1.4
-3.0
-0.2
0.0
0.0
-15.1
-4.5
-1.0
-0.1
-1.9
-2.6
-1.3
-1.2
-2.1
-0.5
-4.3
-0.9
-0.5
-1.5
0.2
-0.6
-1.1
-4.0
-2.0
-0.4
-0.2
1.2
-6.0
-2.8
-1.0
-3.6
-1.2
-2.8
-0.8
1.3
-1.2
-0.6
-0.2
1M (%)
-0.2
5.9
5.0
26.8
4.3
-0.2
10.1
11.6
2.9
19.9
2.7
1.8
9.8
0.9
6.0
-0.6
9.5
11.7
1.2
-5.3
-0.9
-3.4
2.0
-2.4
2.8
0.4
0.3
-3.4
1.2
3.0
21.4
-7.8
-0.1
10.9
2.0
2.9
4.0
-2.3
-5.7
3.7
-1.9
-5.7
11.6
-12.7
11.5
-2.9
-1.5
25.6
8.0
-9.1
-1.8
-1.6
17.5
0.3
12M (%)
29.1
8.2
14.3
16.8
-20.5
-21.3
-23.6
23.5
7.1
-21.0
-19.2
-0.6
-12.7
-2.8
-11.9
5.6
-1.2
-21.3
49.7
-2.7
51.8
-7.8
15.7
45.5
19.8
26.8
-6.2
12.6
56.8
85.8
86.5
27.9
35.4
6.7
4.8
17.6
45.2
40.9
-30.5
21.6
-14.6
48.0
15.8
20.1
80.5
30.2
99.3
40.6
24.4
19.2
46.2
152.1
-0.3
19 May 2017
38

THEMATIC/STRATEGY RESEARCH GALLERY

REPORT GALLERY
RECENT INITIATING COVERAGE REPORTS
Rs

DIFFERENTIATED PRODUCT GALLERY

Disclosures
This document has been prepared by Motilal Oswal Securities Limited (hereinafter referred to as Most) to provide information about the company (ies) and/sector(s), if any, covered in the report and may be distributed by it and/or its
affiliated company(ies). This report is for personal information of the selected recipient/s and does not construe to be any investment, legal or taxation advice to you. This research report does not constitute an offer, invitation or
inducement to invest in securities or other investments and Motilal Oswal Securities Limited (hereinafter referred as MOSt) is not soliciting any action based upon it. This report is not for public distribution and has been furnished to
you solely for your general information and should not be reproduced or redistributed to any other person in any form. This report does not constitute a personal recommendation or take into account the particular investment
objectives, financial situations, or needs of individual clients. Before acting on any advice or recommendation in this material, investors should consider whether it is suitable for their particular circumstances and, if necessary, seek
professional advice. The price and value of the investments referred to in this material and the income from them may go down as well as up, and investors may realize losses on any investments. Past performance is not a guide for
future performance, future returns are not guaranteed and a loss of original capital may occur.
MOSt and its affiliates are a full-service, integrated investment banking, investment management, brokerage and financing group. We and our affiliates have investment banking and other business relationships with a some
companies covered by our Research Department. Our research professionals may provide input into our investment banking and other business selection processes. Investors should assume that MOSt and/or its affiliates are
seeking or will seek investment banking or other business from the company or companies that are the subject of this material and that the research professionals who were involved in preparing this material may educate investors
on investments in such business . The research professionals responsible for the preparation of this document may interact with trading desk personnel, sales personnel and other parties for the purpose of gathering, applying and
interpreting information. Our research professionals are paid on twin parameters of performance & profitability of MOSt.
MOSt generally prohibits its analysts, persons reporting to analysts, and members of their households from maintaining a financial interest in the securities or derivatives of any companies that the analysts cover. Additionally, MOSt
generally prohibits its analysts and persons reporting to analysts from serving as an officer, director, or advisory board member of any companies that the analysts cover. Our salespeople, traders, and other professionals or affiliates
may provide oral or written market commentary or trading strategies to our clients that reflect opinions that are contrary to the opinions expressed herein, and our proprietary trading and investing businesses may make investment
decisions that are inconsistent with the recommendations expressed herein. In reviewing these materials, you should be aware that any or all of the foregoingamong other things, may give rise to real or potential conflicts of interest.
MOSt and its affiliated company(ies), their directors and employees and their relatives may; (a) from time to time, have a long or short position in, act as principal in, and buy or sell the securities or derivatives thereof of companies
mentioned herein. (b) be engaged in any other transaction involving such securities and earn brokerage or other compensation or act as a market maker in the financial instruments of the company(ies) discussed herein or act as an
advisor or lender/borrower to such company(ies) or may have any other potential conflict of interests with respect to any recommendation and other related information and opinions.; however the same shall have no bearing
whatsoever on the specific recommendations made by the analyst(s), as the recommendations made by the analyst(s) are completely independent of the views of the affiliates of MOSt even though there might exist an inherent
conflict of interest in some of the stocks mentioned in the research report Reports based on technical and derivative analysis center on studying charts company's price movement, outstanding positions and trading volume, as
opposed to focusing on a company's fundamentals and, as such, may not match with a report on a company's fundamental analysis. In addition MOST has different business segments / Divisions with independent research
separated by Chinese walls catering to different set of customers having various objectives, risk profiles, investment horizon, etc, and therefore may at times have different contrary views on stocks sectors and markets.
Unauthorized disclosure, use, dissemination or copying (either whole or partial) of this information, is prohibited. The person accessing this information specifically agrees to exempt MOSt or any of its affiliates or employees from,
any and all responsibility/liability arising from such misuse and agrees not to hold MOSt or any of its affiliates or employees responsible for any such misuse and further agrees to hold MOSt or any of its affiliates or employees free
and harmless from all losses, costs, damages, expenses that may be suffered by the person accessing this information due to any errors and delays. The information contained herein is based on publicly available data or other
sources believed to be reliable. Any statements contained in this report attributed to a third party represent MOSt’s interpretation of the data, information and/or opinions provided by that third party either publicly or through a
subscription service, and such use and interpretation have not been reviewed by the third party. This Report is not intended to be a complete statement or summary of the securities, markets or developments referred to in the
document. While we would endeavor to update the information herein on reasonable basis, MOSt and/or its affiliates are under no obligation to update the information. Also there may be regulatory, compliance, or other reasons that
may prevent MOSt and/or its affiliates from doing so. MOSt or any of its affiliates or employees shall not be in any way responsible and liable for any loss or damage that may arise to any person from any inadvertent error in the
information contained in this report. MOSt or any of its affiliates or employees do not provide, at any time, any express or implied warranty of any kind, regarding any matter pertaining to this report, including without limitation the
implied warranties of merchantability, fitness for a particular purpose, and non-infringement. The recipients of this report should rely on their own investigations.
This report is intended for distribution to institutional investors. Recipients who are not institutional investors should seek advice of their independent financial advisor prior to taking any investment decision based on this report or for
any necessary explanation of its contents.
Most and it’s associates may have managed or co-managed public offering of securities, may have received compensation for investment banking or merchant banking or brokerage services, may have received any compensation
for products or services other than investment banking or merchant banking or brokerage services from the subject company in the past 12 months.
Most and it’s associates have not received any compensation or other benefits from the subject company or third party in connection with the research report.
Subject Company may have been a client of Most or its associates during twelve months preceding the date of distribution of the research report
MOSt and/or its affiliates and/or employees may have interests/positions, financial or otherwise of over 1 % at the end of the month immediately preceding the date of publication of the research in the securities mentioned in this
report. To enhance transparency, MOSt has incorporated a Disclosure of Interest Statement in this document. This should, however, not be treated as endorsement of the views expressed in the report.
Motilal Oswal Securities Limited is registered as a Research Analyst under SEBI (Research Analyst) Regulations, 2014. SEBI Reg. No. INH000000412
Pending Regulatory inspections against Motilal Oswal Securities Limited:
SEBI pursuant to a complaint from client Shri C.R. Mohanraj alleging unauthorized trading, issued a letter dated 29th April 2014 to MOSL notifying appointment of an Adjudicating Officer as per SEBI regulations to hold inquiry and
adjudge violation of SEBI Regulations; MOSL replied to the Show Cause Notice whereby SEBI granted us an opportunity of Inspection of Documents. Since all the documents requested by us were not covered we have requested to
SEBI vide our letter dated June 23, 2015 to provide pending list of documents for inspection.
List of associate companies of Motilal Oswal Securities Limited -Click
here to access detailed report
Analyst Certification
The views expressed in this research report accurately reflect the personal views of the analyst(s) about the subject securities or issues, and no part of the compensation of the research analyst(s) was, is, or will be directly or
indirectly related to the specific recommendations and views expressed by research analyst(s) in this report. The research analysts, strategists, or research associates principally responsible for preparation of MOSt research receive
compensation based upon various factors, including quality of research, investor client feedback, stock picking, competitive factors and firm revenues
Disclosure of Interest Statement
Analyst ownership of the stock
Served as an officer, director or employee
Companies where there is interest
No
No
A graph of daily closing prices of securities is available at www.nseindia.com and http://economictimes.indiatimes.com/markets/stocks/stock-quotes
Regional Disclosures (outside India)
This report is not directed or intended for distribution to or use by any person or entity resident in a state, country or any jurisdiction, where such distribution, publication, availability or use would be contrary to law, regulation or which
would subject MOSt& its group companies to registration or licensing requirements within such jurisdictions.
For Hong Kong:
This report is distributed in Hong Kong by Motilal Oswal capital Markets (Hong Kong) Private Limited, a licensed corporation (CE AYY-301) licensed and regulated by the Hong Kong Securities and Futures
Commission (SFC) pursuant to the Securities and Futures Ordinance (Chapter 571 of the Laws of Hong Kong) “SFO”. As per SEBI (Research Analyst Regulations) 2014 Motilal Oswal Securities (SEBI Reg No. INH000000412) has
an agreement with Motilal Oswal capital Markets (Hong Kong) Private Limited for distribution of research report in Kong Kong. This report is intended for distribution only to “Professional Investors” as defined in Part I of Schedule 1 to
SFO. Any investment or investment activity to which this document relates is only available to professional investor and will be engaged only with professional investors.” Nothing here is an offer or solicitation of these securities,
products and services in any jurisdiction where their offer or sale is not qualified or exempt from registration. The Indian Analyst(s) who compile this report is/are not located in Hong Kong & are not conducting Research Analysis in
Hong Kong.
For U.S
Motilal Oswal Securities Limited (MOSL) is not a registered broker - dealer under the U.S. Securities Exchange Act of 1934, as amended (the"1934 act") and under applicable state laws in the United States. In addition MOSL is not a
registered investment adviser under the U.S. Investment Advisers Act of 1940, as amended (the "Advisers Act" and together with the 1934 Act, the "Acts), and under applicable state laws in the United States. Accordingly, in the
absence of specific exemption under the Acts, any brokerage and investment services provided by MOSL, including the products and services described herein are not available to or intended for U.S. persons.
This report is intended for distribution only to "Major Institutional Investors" as defined by Rule 15a-6(b)(4) of the Exchange Act and interpretations thereof by SEC (henceforth referred to as "major institutional investors"). This
document must not be acted on or relied on by persons who are not major institutional investors. Any investment or investment activity to which this document relates is only available to major institutional investors and will be
engaged in only with major institutional investors. In reliance on the exemption from registration provided by Rule 15a-6 of the U.S. Securities Exchange Act of 1934, as amended (the "Exchange Act") and interpretations thereof by
the U.S. Securities and Exchange Commission ("SEC") in order to conduct business with Institutional Investors based in the U.S., MOSL has entered into a chaperoning agreement with a U.S. registered broker-dealer, Motilal Oswal
Securities International Private Limited. ("MOSIPL"). Any business interaction pursuant to this report will have to be executed within the provisions of this chaperoning agreement.
The Research Analysts contributing to the report may not be registered /qualified as research analyst with FINRA. Such research analyst may not be associated persons of the U.S. registered broker-dealer, MOSIPL, and therefore,
may not be subject to NASD rule 2711 and NYSE Rule 472 restrictions on communication with a subject company, public appearances and trading securities held by a research analyst account.
For Singapore
Motilal Oswal Capital Markets Singapore Pte Limited is acting as an exempt financial advisor under section 23(1)(f) of the Financial Advisers Act(FAA) read with regulation 17(1)(d) of the Financial Advisors Regulations and is a
subsidiary of Motilal Oswal Securities Limited in India. This research is distributed in Singapore by Motilal Oswal Capital Markets Singapore Pte Limited and it is only directed in Singapore to accredited investors, as defined in the
Financial Advisers Regulations and the Securities and Futures Act (Chapter 289), as amended from time to time.
In respect of any matter arising from or in connection with the research you could contact the following representatives of Motilal Oswal Capital Markets Singapore Pte Limited:
Varun Kumar
Varun.kumar@motilaloswal.com
Contact : (+65) 68189232
Office Address:21 (Suite 31),16 CollyerQuay,Singapore 04931
13 December 2016
Motilal Oswal Tower, Level 9, Sayani Road, Prabhadevi, Mumbai 400 025
Phone: +91 22 3982 5500 E-mail: reports@motilaloswal.com
Motilal Oswal Securities Ltd
40