22 May 2017
Results Update | Sector: Utilities
Tata Power
Sell
BSE SENSEX
30,465
Bloomberg
Equity Shares (m)
M.Cap.(INRb)/(USDb)
52-Week Range (INR)
1, 6, 12 Rel. Per (%)
Avg Val, INRm
Free float (%)
S&P CNX
9,428
TPWR IN
Net Debt to Equity increases to ~3.5x
2,705
Lack of RoE accretive growth and high leverage; Maintain Sell
227.6 / 3.4
n
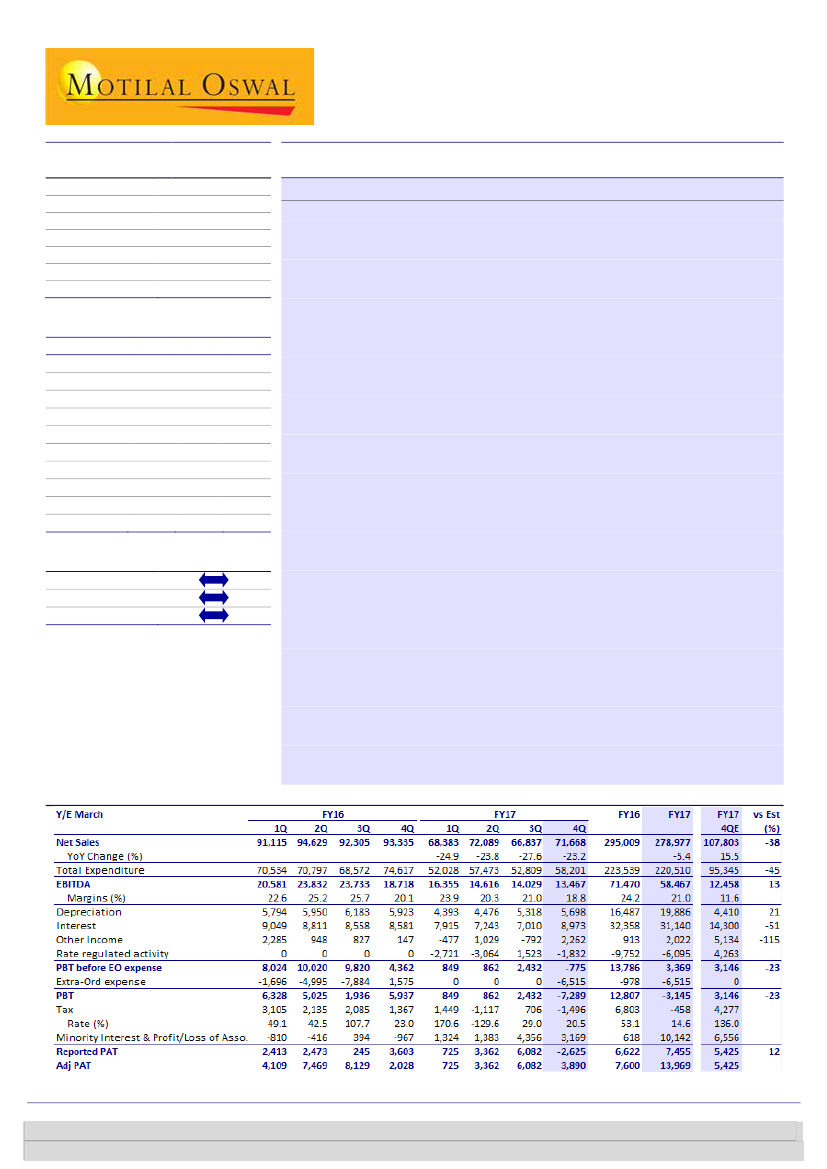
Tata Power’s (TPWR) 4QFY17 PAT, adjusted for the write-off of INR6.5b
849 / 405
relating to advance paid to DOCOMO for TTSL, was down 36% QoQ to
-3/4/3
INR3.9b (est. INR5.4b) on lower billing in Delhi distribution and higher
242.8
50.1
interest cost. EBITDA (incl. JVs) was down 11% QoQ to INR19.6b. For FY17,
CMP: INR84
TP: INR67(-20%)
Financials & Valuations (INR b)
2017 2018E
Y/E Mar
Net Sales
279.0
341.6
EBITDA
58.5
67.1
PAT
14.0
18.3
EPS (INR)
5.2
6.7
Gr. (%)
21.1
30.7
BV/Sh (INR)
43.5
48.7
RoE (%)
11.2
14.6
RoCE (%)
6.6
6.6
P/E (x)
16.3
12.5
P/BV (x)
1.9
1.7
2019E
358.7
69.5
19.0
7.0
3.8
54.2
13.6
6.5
12.0
1.6
Estimate change
TP change
Rating change
EBITDA (inc. JVs) was up 2% YoY to INR78b, while adj. PAT was up 83% YoY to
INR13.9b on lower tax. Net Debt at INR482b (incl. perpetual securities of
INR15b), represented debt/equity ratio of 3.5x (excl. perpetual securities
which is reported as part of net worth).
n
Standalone:
EBIT (incl. rate regulatory items), adj. for the provision of
INR0.3b for Trombay U-6 plant, was flat YoY due to stricter regulatory norms
and lower regulatory assets. The management highlighted the risk of
Trombay generation PPAs expiring in March 2018; clarity is likely in the next
couple of quarters.
n
CGPL & Coal:
Under-recovery increased from INR0.7/kWh in 3QFY17 to
INR0.86/kWh in 4QFY17. PAT loss was however lower (INR1.4b vs. INR2.4b in
3Q) on FX reversal and lower interest cost (on waiver by parent). Coal mines
EBITDA was up 29% QoQ to INR5.7b (ex-Arutmin) on higher coal prices.
n
Sale of non-core investments:
The management assured progress on sale of
non-core investments in FY18. Stake in Tata Sons is not considered as non-
core.
Lack of RoE accretive growth opportunities and high leverage; Sell
n
TPWR’s net worth is down by 21% since 1HFY17 to INR117b as at the end of
FY17 due to change in accounting of investments (from fair value to cost).
Resultantly, RoEs estimates for FY18-20E now look higher at ~13-14% v/s.
~10-11% earlier. We thus revise our P/BV multiple from 1x earlier to 1.2x.
The TP is revised marginally lower to INR67/sh. from earlier 69/sh. as higher
multiple is offset by lower BV. TPWR is facing slower growth in the regulated
business, risk of expiry of generation PPAs, competition in RE and a highly
leveraged balance sheet. We maintain
Sell
rating.
Quarterly Performance (Consolidated)
Investors are advised to refer through important disclosures made at the last page of the Research Report.
Motilal Oswal research is available on www.motilaloswal.com/Institutional-Equities, Bloomberg, Thomson Reuters, Factset and S&P Capital.
Dhruv Muchhal
(Dhruv.Muchhal@MotilalOswal.com); +91 22 6129 1549
Sanjay Jain
(SanjayJain@MotilalOswal.com); +91 22 6129 1523

Tata Power
Highlights from analyst meet
n
n
n
n
n
n
Electricity demand potential in India:
Reliability and available of electricity can
drive significant pent-up demand potential. India uses ~60-90GW of diesel
generator sets which can be replaced with improvement in electricity supply.
Affordability however a constraint:
India’s per capita expenditure on electricity
is higher than most of the developed nations. Controlling cost would be key to
drive electricity consumption as higher prices leads to increase in leakages.
There is no elasticity in the system to accept higher tariffs.
Flexible operations:
With rising RE, coal plants would have to learn to operate
on multiple shifts.
Trombay PPA expiry risk:
Trombay has a capacity of 1.8GW of which 0.4GW is
hydro and remaining is coal/gas/oil. There PPAs for these capacities is expiring
in March 2019. It is uncertain if the regulator will approve extension of these
PPAs. We estimate the Trombay assets have a regulated equity of ~INR20b,
which can be at risk if the PPAs are not extended.
Defence:
While the opportunity size is huge, the predictability of the business is
difficult. Government has been very slow in awarding contracts. Defence
generated revenue of INR5.5b in FY17.
Sale of investments:
The management assured that some of the non-core
investments would be sold in FY18. The stake in Tata Sons and probably Tata
Projects is not considered non-core for now. The management is also hopeful of
concluding the sale in Arutmin coal. Sale of assets is must so deleverage the
balance sheet.
Q4FY17
5,215
260
1,950
840
130
1,050
4,030
5,700
720
430
210
-869
19,665
QoQ - %
3
-21
-11
-72
53
114
17
29
-12
-23
17
-154
-11
Remarks
·
Stricter norms, slowing growth and Unit 6 provision
·
Higher coal prices
·
Seasonal
·
Lower billing, lower carrying cost and provisions
·
·
·
Operating efficiency and volumes
Higher generation
Higher coal prices
Exhibit 1: TPWR adj. EBITDA (incl. JVs) – INR m
Standalone
CGPL
Maithon
Delhi
Trading
Solar
RE
Coal - KPC/BSSR
Coal Infra/logistics
IEL
Powerlinks
Others
Adj. EBITDA (incl. JVs)
Q3FY17
5,054
330
2,180
3,000
85
490
3,430
4,410
820
560
180
1,603
22,141
Source: MOSL, Company
Exhibit 2: CGPL
Revenues
EBITDA
PAT
Generation
Sales
Availability
FoB price of coal
Revenue
Under recovery
INR m
INR/kwh
INR m
INR m
MU
MU
%
USD/t
INR/kWh
INR/kWh
1QFY17
12,150
2.4
2,190
0.4
-3,830
5,420
4,987
63
42
2.47
-0.30
2QFY17
15,920
2.4
2,460
0.4
-800
7,196
6,629
85
45
2.43
-0.43
3QFY17
14,970
2.4
330
0.1
-2,440
6,849
6,304
77
52
2.37
-0.70
4QFY17
17,950
2.6
260
0.0
-1,420
7,995
6,919
93
48
2.36
-0.86
Source: MOSL, Company
22 May 2017
2

Tata Power
Exhibit 3: Maithon Power
1QFY17
Revenues
EBITDA
PAT
Generation
Sales
Availability
Regulated equity
INR m
INR/kwh
INR m
INR/kwh
INR m
MU
MU
%
INR m
5,990
3.4
2,150
1.2
670
1,845
1,742
95
14,440
2QFY17
5,690
3.8
1,930
1.3
530
1,596
1,501
81
14,440
3QFY17
6,240
3.3
2,180
1.2
740
1,984
1,870
97
14,440
4QFY17
6,130
3.4
1,950
1.1
610
1,932
1,826
94
14,440
Source: MOSL, Company
Exhibit 4: Delhi Distribution
1QFY17
Revenues
EBITDA
PAT
Regulated equity
Regulatory assets
INR m
INR m
INR m
INR m
INR m
17,840
2,750
820
12,480
50,320
2QFY17
20,120
-1,340
690
12,560
47,100
3QFY17
14,980
3,000
1,130
12,690
46,500
4QFY17
13,060
840
10
11,630
45,740
Source: MOSL, Company
Exhibit 5: Renewables
1QFY17
TPREPL (Renewable)
Revenues
EBITDA
PAT
Operating capacity
WREPL (Renewable)
Revenues
EBITDA
PAT
Capacity
INR m
INR/kwh
INR m
INR m
MW
410
450
2,700
7.3
2,550
60
1,141
3,160
7.1
2,870
1,220
1,141
INR m
INR/kwh
INR m
INR/kwh
INR m
MW
770
6.4
770
6.4
110
312
870
5.9
880
6.0
150
282
710
8.8
880
10.9
138
370
830
6.3
1,160
8.9
290
449
2QFY17
3QFY17
4QFY17
Source: MOSL, Company
22 May 2017
3

Tata Power
Financials and Valuations
Income Statement
Y/E March
Net Sales
Change (%)
Total Expenses
EBITDA
% of Net Sales
Depn. & Amortization
EBIT
Net Interest
Other income
PBT before EO
Regulatory inc./(exp)
EO expense
PBT after EO
Tax
Rate (%)
Reported PAT
Minority and Associates
Adjusted PAT
Change (%)
2012
260,014
33.7
211,012
49,002
18.8
13,346
35,656
15,271
2,688
23,073
0
18,000
5,073
14,755
290.9
-9,683
-1,194
7,123
-65.4
2012
2,373
110,114
112,487
16,313
353,598
6,471
488,868
334,118
106,028
228,091
126,592
48,444
26,454
187,904
16,847
22,714
45,216
103,128
128,617
27,501
101,115
59,288
488,868
2013
330,254
27.0
265,807
64,447
19.5
20,517
43,930
26,355
3,692
21,267
0
8,500
12,767
11,780
92.3
987
-1,842
7,646
7.3
2013
2,373
105,012
107,385
20,646
393,823
10,254
532,108
504,687
148,396
356,291
23,576
57,241
26,427
209,278
20,265
33,050
24,673
131,290
140,706
35,409
105,298
68,572
532,108
2014
356,487
7.9
288,009
68,478
19.2
27,296
41,182
34,399
2,273
9,055
0
0
9,055
10,084
111.4
-1,028
-2,267
-3,295
-143.1
2014
2,373
104,733
107,106
22,733
416,725
11,379
557,943
550,345
179,730
370,616
33,887
63,320
26,787
219,373
20,733
45,426
18,956
134,258
156,040
45,740
110,300
63,333
557,943
2015
337,276
-5.4
274,264
63,012
18.7
21,742
41,270
36,993
4,167
8,445
6,393
0
14,837
10,749
72.4
4,088
-2,410
1,678
-150.9
2015
2,705
122,716
125,421
24,926
423,419
14,014
587,779
583,351
202,217
381,133
36,505
66,258
27,326
243,207
18,442
55,640
21,064
148,062
166,650
52,354
114,296
76,557
587,779
2016
374,802
11.1
286,876
87,926
23.5
23,764
64,162
34,765
2,970
32,367
-10,194
2,805
19,367
8,693
44.9
10,674
-1,940
11,539
587.5
2016
2,705
128,434
131,139
25,814
416,209
14,875
588,037
617,804
202,550
415,254
45,441
46,767
28,855
240,748
18,061
52,042
16,740
153,905
189,029
61,277
127,752
51,720
588,037
2017
278,977
-25.6
220,510
58,467
21.0
19,886
38,581
31,140
2,022
9,464
-6,095
6,515
-3,145
-458
14.6
-2,687
10,142
13,969
21.1
2017
2,705
115,090
117,795
18,690
503,198
17,598
657,280
597,716
150,507
447,209
21,779
17,325
108,592
226,458
15,996
38,321
20,521
151,621
164,083
55,290
108,793
62,375
657,280
(INR Million)
2018E
341,566
22.4
274,445
67,121
19.7
21,299
45,821
39,887
4,395
10,329
0
0
10,329
6,036
58.4
4,293
13,959
18,253
30.7
2018E
2,705
129,123
131,828
20,137
506,703
17,598
676,267
633,074
171,807
461,267
21,779
17,325
115,297
216,181
12,476
35,870
16,214
151,621
155,583
46,790
108,793
60,598
676,267
2019E
358,733
5.0
289,198
69,535
19.4
22,536
46,998
39,933
4,395
11,460
0
0
11,460
6,625
57.8
4,835
14,117
18,951
3.8
2019E
2,705
143,855
146,560
21,477
507,255
17,598
692,890
666,264
194,343
471,921
21,779
17,325
121,913
217,886
12,794
37,726
15,745
151,621
157,935
49,141
108,793
59,952
692,890
Balance Sheet
Share Capital
Reserves
Net Worth
Minority Interest
Total Loans
Deferred Tax Liability
Capital Employed
Gross Block
Less: Accum. Deprn.
Net Fixed Assets
Capital WIP
Goodwill
Investments
Curr. Assets
Inventories
Account Receivables
Cash and Bank Balance
Others
Curr. Liability & Prov.
Account Payables
Provisions & Others
Net Curr. Assets
Appl. of Funds
(INR Million)
22 May 2017
4

Tata Power
Financials and Valuations
Ratios
2012
Basic (INR)
EPS
Cash EPS
BV/Share
DPS
Payout (%)
Valuation (x)
P/E
Cash P/E
P/BV
EV/EBITDA
Dividend Yield (%)
FCF(pre-int) to EV yield(%)
Return Ratios (%)
RoE
RoCE (post-tax)
RoIC (post-tax)
Working Capital Ratios
Fixed Asset Turnover (x)
Asset Turnover (x)
Debtor (Days)
Inventory (Days)
Leverage Ratio (x)
Net Debt/EBITDA
Debt/Equity
3.0
8.6
47.4
1.3
41.6
2013
3.2
11.9
45.3
1.2
35.7
2014
-1.4
10.1
45.1
1.3
-90.0
2015
0.6
8.7
46.4
1.3
209.5
2016
4.3
13.1
48.5
1.3
30.5
2017
5.2
12.5
43.5
1.3
25.2
2018E
6.7
14.6
48.7
1.3
19.3
2019E
7.0
15.3
54.2
1.3
18.6
124.3
8.9
1.7
10.1
1.7
3.3
15.2
5.0
1.3
6.8
2.0
8.8
16.3
6.7
1.9
12.5
1.5
-3.6
12.4
5.7
1.7
11.0
1.5
5.1
12.0
5.5
1.6
10.6
1.5
6.0
6.0
5.4
-39.8
7.0
7.0
1.1
-3.1
6.1
-1.1
1.4
6.1
2.7
9.0
9.9
8.0
11.2
6.6
7.0
14.6
6.6
3.8
13.6
6.5
3.9
1.1
0.5
32
24
6.3
2.4
2012
49,002
-30,279
8,470
-16,026
11,167
-65,299
-54,132
1,783
0
-4,512
-68,028
788
74,921
-15,576
-3,985
13,975
70,124
13,263
21,410
34,673
0.9
0.6
37
22
5.7
2.9
2013
64,447
-23,511
2,694
-10,833
32,796
-42,702
-9,906
2,753
-8,651
5,738
-42,863
2,858
28,779
-29,912
-4,001
-3,591
-5,867
-15,933
31,223
15,291
1.0
0.6
47
21
5.8
3.1
2014
68,478
38
5,861
-9,546
64,831
-43,361
21,469
2,204
-1,501
5,239
-37,418
259
7,234
-33,931
-3,696
-2,521
-32,654
-5,242
17,896
12,655
0.9
0.6
60
20
6.4
2.7
2015
63,012
-5,611
10,493
-8,085
59,809
-34,936
24,873
2,078
0
-5,891
-38,749
20,692
-1,026
-33,842
-5,121
-3,089
-22,386
-1,326
13,845
12,519
0.9
0.6
51
18
4.5
2.5
2016
87,926
20,488
-6,583
-4,295
97,536
-39,864
57,672
2,141
0
-7,044
-44,767
149
-13,037
-33,515
-5,908
-3,369
-55,680
-2,911
12,616
9,706
0.6
0.4
50
21
8.3
3.5
2017
58,467
3,090
8,637
458
70,652
-35,000
35,652
9,305
-92,490
20,977
-97,208
0
96,440
-31,140
-5,177
0
60,123
33,567
12,108
45,675
0.7
0.5
38
13
7.3
3.2
2018E
67,121
-2,530
0
-6,036
58,555
-35,358
23,198
14,217
0
0
-21,141
0
3,506
-39,887
-5,339
0
-41,721
-4,306
9,543
5,237
0.8
0.5
38
13
7.1
2.9
Cash Flow Statement
EBITDA
FX gain/loss
WC
Others
Direct taxes (net)
CF from Op. Activity
Capex
FCF
Int & div income
Investments(subs/JVs)
Others
CF from Inv. Activity
Share capital
Borrowings
Finance cost
Dividend
Others
CF from Fin. Activity
(Inc)/Dec in Cash
Opening balance
Closing balance
(INR Million)
2019E
69,535
178
0
-6,625
63,087
-33,190
29,897
14,355
0
0
-18,835
0
552
-39,933
-5,339
0
-44,721
-469
5,237
4,768
22 May 2017
5

Disclosures
This document has been prepared by Motilal Oswal Securities Limited (hereinafter referred to as Most) to provide information about the company (ies) and/sector(s), if any, covered in the report and may be distributed by it
and/or its affiliated company(ies). This report is for personal information of the selected recipient/s and does not construe to be any investment, legal or taxation advice to you. This research report does not constitute an
offer, invitation or inducement to invest in securities or other investments and Motilal Oswal Securities Limited (hereinafter referred as MOSt) is not soliciting any action based upon it. This report is not for public distribution
and has been furnished to you solely for your general information and should not be reproduced or redistributed to any other person in any form. This report does not constitute a personal recommendation or take into
account the particular investment objectives, financial situations, or needs of individual clients. Before acting on any advice or recommendation in this material, investors should consider whether it is suitable for their
particular circumstances and, if necessary, seek professional advice. The price and value of the investments referred to in this material and the income from them may go down as well as up, and investors may realize losses
on any investments. Past performance is not a guide for future performance, future returns are not guaranteed and a loss of original capital may occur.
MOSt and its affiliates are a full-service, integrated investment banking, investment management, brokerage and financing group. We and our affiliates have investment banking and other business relationships with a some
companies covered by our Research Department. Our research professionals may provide input into our investment banking and other business selection processes. Investors should assume that MOSt and/or its affiliates are
seeking or will seek investment banking or other business from the company or companies that are the subject of this material and that the research professionals who were involved in preparing this material may educate
investors on investments in such business . The research professionals responsible for the preparation of this document may interact with trading desk personnel, sales personnel and other parties for the purpose of
gathering, applying and interpreting information. Our research professionals are paid on twin parameters of performance & profitability of MOSt.
MOSt generally prohibits its analysts, persons reporting to analysts, and members of their households from maintaining a financial interest in the securities or derivatives of any companies that the analysts cover.
Additionally, MOSt generally prohibits its analysts and persons reporting to analysts from serving as an officer, director, or advisory board member of any companies that the analysts cover. Our salespeople, traders, and
other professionals or affiliates may provide oral or written market commentary or trading strategies to our clients that reflect opinions that are contrary to the opinions expressed herein, and our proprietary trading and
investing businesses may make investment decisions that are inconsistent with the recommendations expressed herein. In reviewing these materials, you should be aware that any or all of the foregoing among other things,
may give rise to real or potential conflicts of interest. MOSt and its affiliated company(ies), their directors and employees and their relatives may; (a) from time to time, have a long or short position in, act as principal in, and
buy or sell the securities or derivatives thereof of companies mentioned herein. (b) be engaged in any other transaction involving such securities and earn brokerage or other compensation or act as a market maker in the
financial instruments of the company(ies) discussed herein or act as an advisor or lender/borrower to such company(ies) or may have any other potential conflict of interests with respect to any recommendation and other
related information and opinions.; however the same shall have no bearing whatsoever on the specific recommendations made by the analyst(s), as the recommendations made by the analyst(s) are completely independent
of the views of the affiliates of MOSt even though there might exist an inherent conflict of interest in some of the stocks mentioned in the research report
Reports based on technical and derivative analysis center on studying charts company's price movement, outstanding positions and trading volume, as opposed to focusing on a company's fundamentals and, as such, may not match with a report on a
company's fundamental analysis. In addition MOST has different business segments / Divisions with independent research separated by Chinese walls catering to different set of customers having various objectives, risk profiles, investment horizon,
etc, and therefore may at times have different contrary views on stocks sectors and markets.
Unauthorized disclosure, use, dissemination or copying (either whole or partial) of this information, is prohibited. The person accessing this information specifically agrees to exempt MOSt or any of its affiliates or employees
from, any and all responsibility/liability arising from such misuse and agrees not to hold MOSt or any of its affiliates or employees responsible for any such misuse and further agrees to hold MOSt or any of its affiliates or
employees free and harmless from all losses, costs, damages, expenses that may be suffered by the person accessing this information due to any errors and delays. The information contained herein is based on publicly
available data or other sources believed to be reliable. Any statements contained in this report attributed to a third party represent MOSt’s interpretation of the data, information and/or opinions provided by that third party
either publicly or through a subscription service, and such use and interpretation have not been reviewed by the third party. This Report is not intended to be a complete statement or summary of the securities, markets or
developments referred to in the document. While we would endeavor to update the information herein on reasonable basis, MOSt and/or its affiliates are under no obligation to update the information. Also there may be
regulatory, compliance, or other reasons that may prevent MOSt and/or its affiliates from doing so. MOSt or any of its affiliates or employees shall not be in any way responsible and liable for any loss or damage that may
arise to any person from any inadvertent error in the information contained in this report. MOSt or any of its affiliates or employees do not provide, at any time, any express or implied warranty of any kind, regarding any
matter pertaining to this report, including without limitation the implied warranties of merchantability, fitness for a particular purpose, and non-infringement. The recipients of this report should rely on their own
investigations.
This report is intended for distribution to institutional investors. Recipients who are not institutional investors should seek advice of their independent financial advisor prior to taking any investment decision based on this
report or for any necessary explanation of its contents.
Most and it’s associates may have managed or co-managed public offering of securities, may have received compensation for investment banking or merchant banking or brokerage services, may have received any
compensation for products or services other than investment banking or merchant banking or brokerage services from the subject company in the past 12 months.
Most and it’s associates have not received any compensation or other benefits from the subject company or third party in connection with the research report.
Subject Company may have been a client of Most or its associates during twelve months preceding the date of distribution of the research report
MOSt and/or its affiliates and/or employees may have interests/positions, financial or otherwise of over 1 % at the end of the month immediately preceding the date of publication of the research in the securities mentioned
in this report. To enhance transparency, MOSt has incorporated a Disclosure of Interest Statement in this document. This should, however, not be treated as endorsement of the views expressed in the report.
Motilal Oswal Securities Limited is registered as a Research Analyst under SEBI (Research Analyst) Regulations, 2014. SEBI Reg. No. INH000000412
Pending Regulatory inspections against Motilal Oswal Securities Limited:
SEBI pursuant to a complaint from client Shri C.R. Mohanraj alleging unauthorized trading, issued a letter dated 29th April 2014 to MOSL notifying appointment of an Adjudicating Officer as per SEBI regulations to hold inquiry
and adjudge violation of SEBI Regulations; MOSL replied to the Show Cause Notice whereby SEBI granted us an opportunity of Inspection of Documents. Since all the documents requested by us were not covered we have
requested to SEBI vide our letter dated June 23, 2015 to provide pending list of documents for inspection.
List of associate companies of Motilal Oswal Securities Limited -Click
here to access detailed report
Analyst Certification
The views expressed in this research report accurately reflect the personal views of the analyst(s) about the subject securities or issues, and no part of the compensation of the research analyst(s) was, is, or will be directly or
indirectly related to the specific recommendations and views expressed by research analyst(s) in this report. The research analysts, strategists, or research associates principally responsible for preparation of MOSt research
receive compensation based upon various factors, including quality of research, investor client feedback, stock picking, competitive factors and firm revenues
Tata Power
Disclosure of Interest Statement
Analyst ownership of the stock
No
Served as an officer, director or employee -
No
A graph of daily closing prices of securities is available at www.nseindia.com and http://economictimes.indiatimes.com/markets/stocks/stock-quotes
Regional Disclosures (outside India)
This report is not directed or intended for distribution to or use by any person or entity resident in a state, country or any jurisdiction, where such distribution, publication, availability or use would be contrary to law,
regulation or which would subject MOSt & its group companies to registration or licensing requirements within such jurisdictions.
For Hong Kong:
This report is distributed in Hong Kong by Motilal Oswal capital Markets (Hong Kong) Private Limited, a licensed corporation (CE AYY-301) licensed and regulated by the Hong Kong Securities and Futures
Commission (SFC) pursuant to the Securities and Futures Ordinance (Chapter 571 of the Laws of Hong Kong) “SFO”. As per SEBI (Research Analyst Regulations) 2014 Motilal Oswal Securities (SEBI Reg No. INH000000412) has
an agreement with Motilal Oswal capital Markets (Hong Kong) Private Limited for distribution of research report in Kong Kong. This report is intended for distribution only to “Professional Investors” as defined in Part I of
Schedule 1 to SFO. Any investment or investment activity to which this document relates is only available to professional investor and will be engaged only with professional investors.” Nothing here is an offer or solicitation
of these securities, products and services in any jurisdiction where their offer or sale is not qualified or exempt from registration. The Indian Analyst(s) who compile this report is/are not located in Hong Kong & are not
conducting Research Analysis in Hong Kong.
For U.S.
Motilal Oswal Securities Limited (MOSL) is not a registered broker - dealer under the U.S. Securities Exchange Act of 1934, as amended (the"1934 act") and under applicable state laws in the United States. In addition MOSL is
not a registered investment adviser under the U.S. Investment Advisers Act of 1940, as amended (the "Advisers Act" and together with the 1934 Act, the "Acts), and under applicable state laws in the United States.
Accordingly, in the absence of specific exemption under the Acts, any brokerage and investment services provided by MOSL, including the products and services described herein are not available to or intended for U.S.
persons.
This report is intended for distribution only to "Major Institutional Investors" as defined by Rule 15a-6(b)(4) of the Exchange Act and interpretations thereof by SEC (henceforth referred to as "major institutional investors").
This document must not be acted on or relied on by persons who are not major institutional investors. Any investment or investment activity to which this document relates is only available to major institutional investors
and will be engaged in only with major institutional investors. In reliance on the exemption from registration provided by Rule 15a-6 of the U.S. Securities Exchange Act of 1934, as amended (the "Exchange Act") and
interpretations thereof by the U.S. Securities and Exchange Commission ("SEC") in order to conduct business with Institutional Investors based in the U.S., MOSL has entered into a chaperoning agreement with a U.S.
registered broker-dealer, Motilal Oswal Securities International Private Limited. ("MOSIPL"). Any business interaction pursuant to this report will have to be executed within the provisions of this chaperoning agreement.
The Research Analysts contributing to the report may not be registered /qualified as research analyst with FINRA. Such research analyst may not be associated persons of the U.S. registered broker-dealer, MOSIPL, and
therefore, may not be subject to NASD rule 2711 and NYSE Rule 472 restrictions on communication with a subject company, public appearances and trading securities held by a research analyst account.
For Singapore
Motilal Oswal Capital Markets Singapore Pte Limited is acting as an exempt financial advisor under section 23(1)(f) of the Financial Advisers Act(FAA) read with regulation 17(1)(d) of the Financial Advisors Regulations and is a
subsidiary of Motilal Oswal Securities Limited in India. This research is distributed in Singapore by Motilal Oswal Capital Markets Singapore Pte Limited and it is only directed in Singapore to accredited investors, as defined in
the Financial Advisers Regulations and the Securities and Futures Act (Chapter 289), as amended from time to time.
In respect of any matter arising from or in connection with the research you could contact the following representatives of Motilal Oswal Capital Markets Singapore Pte Limited:
Varun Kumar
Varun.kumar@motilaloswal.com
Contact : (+65) 68189232
Office Address:21 (Suite 31),16 Collyer Quay,Singapore 04931
§
§
Tata Power
22 May 2017
Motilal Oswal Tower, Level 9, Sayani Road, Prabhadevi, Mumbai 400 025
Phone: +91 22 3982 5500 E-mail: reports@motilaloswal.com
Motilal Oswal Securities Ltd
6