22 May 2017
Metals Weekly
Metal Prices
CMP
19-May
% 12-May
change since
%
1-Jan
%
1-Apr
TMT- Mumba i (INR/ton)
HRC- Mumba i (INR/ton)
HRC (USD/ton) fob CIS
30,200
35,111
445
-3 31,200
-1 35,556
2
435
-4 16,200
-2 24,675
2
61
-9
170
0
251
3
4
-2
-1
1
-1
1
1
4
1,880
121
1,545
2,582
166
346
5,520
356
325
-1 30,600
-8 38,222
-10
495
-2 15,950
7 22,550
-21
79
-36
240
-10
278
13
9
-32
0
-4
-20
2
-4
8
1,714
116
2,202
2,563
174
428
5,501
374
312
9 27,600
14 30,667
21
368
17 13,300
25 19,300
14
55
89
82
7
235
27
25
-46
39
-86
-21
15
13
135
1,524
101
2,783
1,842
1,222
435
4,880
319
143
Sponge i ron - Ra i pur (INR/ton)
15,600
Pi g i ron - Ra i pur (INR/ton)
24,100
Iron ore s pot (USD/ton) cfr Chi na
63
Coki ng coa l (USD/ton) fob Aus .
155
Shred. s cra p (USD/ton) Rotterda m
251
LME Spot (USD/ton)
Indi a n pri ces (INR ‘000/ton)
LME i nventori es (‘000 ton)
LME Spot (USD/ton)
Indi a n pri ces (INR ‘000/ton)
LME i nventori es (‘000 ton)
LME Spot (USD/ton)
Indi a n pri ces (INR ‘000/ton)
LME i nventori es (‘000 ton)
Gol d (INR/10gms )
Sl i ver (INR/1kg)
Lea d Spot LME (USD/ton)
Brent crude (USD/bbl )
INR/USD
BDI
1,938
126
1,507
2,569
167
343
5,596
359
337
28,659
38,690
2,088
53.6
64.5
956
2 28,042
1 38,209
-4 2,166
5
50.8
0
-4
64.2
994
3 27,812
-1 38,921
5 1,985
-6
56.8
-5
-1
68.0
961
-1 29,080
6 36,651
21 1,720
39
38.7
-3
112
66.2
450
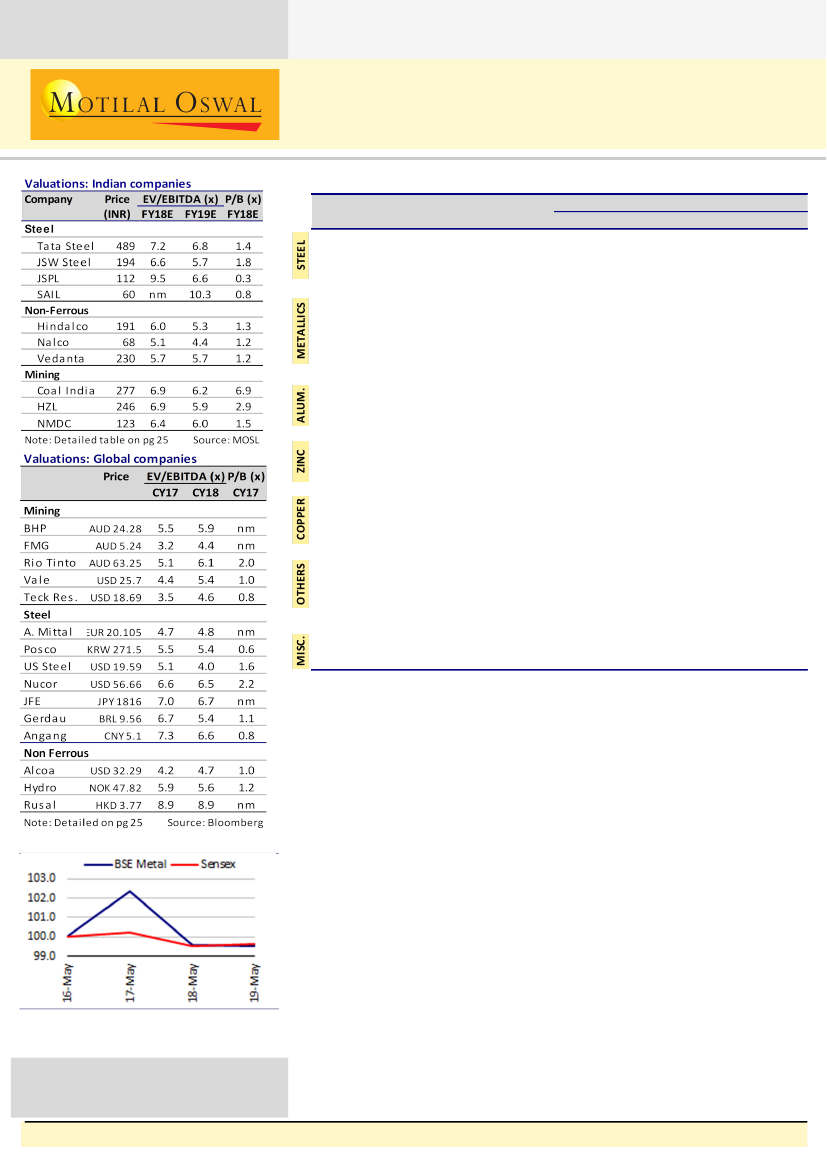
BSE Metals Index v/s Sensex
Source: Bloomberg
Note: Indexed to 100 on 20 March 2017
Stock performance table on pg 26
Investors are advised to refer through
important disclosures made at the last
page of the Research Report
.
Indian steel:
Long product (TMT Mumbai) prices were down ~3% WoW.
Sponge iron fell ~4% WoW while domestic scrap prices were down ~2%
WoW. Domestic iron ore prices were unchanged. Pellet prices were lower.
Domestic HRC prices were down ~1% WoW.
Raw Materials:
Iron ore prices (China cfr) were down ~1% WoW. Thermal
coal prices were unchanged. Coking coal prices were down by ~9% WoW.
China pellet import prices were up ~5% WoW
Europe:
HRC prices were prices were unchanged. EU steel spreads have
improved on sharp decline in coking coal prices. CIS export HRC prices
were up ~2%. Rotterdam scrap prices were flat WoW.
China:
local HRC prices were up ~4% WoW, reversal in trend over the past
few weeks, while rebar prices rose ~3% WoW. Chinese steel product
spreads improved, with spreads on rebars at multi-year high. Export
HRC/rebar prices were up ~1% WoW.
Base metals:
Aluminum (cash LME) was up ~3% WoW. Alumina prices
were marginally higher. Zinc (cash LME) was down ~1% WoW while lead
was down ~4% WoW. Copper was up ~1% WoW. Crude oil (Brent) prices
were up ~5% WoW.
Chinese steel prices trend higher, domestic prices remain weak
Sanjay Jain
(SanjayJain@MotilalOswal.com); +91 22 3982 5412 /
Dhruv Muchhal
(Dhruv.Muchhal@MotilalOswal.com)

Metals Weekly
Contents
Page No.
Ferrous
India
European Union
China
Other regions
Steel raw material
Ferro alloys
3-10
3,4 & 5
6
7
8&9
10 & 11
12
Non-ferrous
Aluminum
Copper
Zinc
Lead
Crude Oil
Commodity curve analysis
China non-ferrous trade data
13-20
13
15
16
17
18
19
20
Key indicators
Industrial production growth across the globe
BSE announcements
Metals valuation matrix
Metals stock performance
21-22
23
24
25
26
22 May 2017
2

Metals Weekly
Ferrous
Domestic HRC prices were
down 1.3% WoW to
INR35,111/t.
Ferrous
INDIA
Indian flat domestic steel prices (INR/T, excl. ED & VAT)
42,000
39,000
36,000
33,000
30,000
27,000
24,000
Spot
Quaterly average
Avg. is down INR1833 QoQ
Long products (TMT
Mumbai) prices were
down 3.2% WoW to
INR30,200/t.
Indian long steel price (INR/T, exl. ED & VAT)
36,000
33,500
31,000
28,500
26,000
23,500
Spot
Quaterly average
Avg. is up INR1407 QoQ
Sponge iron (made from lumps) prices (INR/T, excl. ED & VAT)
Sponge iron prices were
down 3.7% WoW to
INR15,600/t.
19,000
17,000
15,000
13,000
11,000
Coal based Sponge (Raipur)
India: Integrated steel mills spreads (Import parity HRC – 1xcoking coal)
Indian integrated steel mills spreads (INR/t)
35,000
31,000
27,000
23,000
19,000
15,000
Source: SteelMint, WSA, MOSL
22 May 2017
3

Metals Weekly
Ferrous
Ferrous
INDIA
Scrap Mandi (INR/t)
23,500
21,000
18,500
16,000
Domestic scrap prices
were down 5.1% WoW to
INR20,400/t.
Scrap (Mandi)
Iron ore lumps (INR/t)
Iron ore lump prices for
private miners were
unchanged.
4,500
4,000
3,500
3,000
2,500
2,000
1,500
Lumps 5-18 (Odisha)
NMDC 6-40mm (CG)
Iron ore fines (INR/t) ex mine
Iron ore fines prices for
private miners were
unchanged.
Rungta Fines 63% (Odisha, incl. royalty)
2,900
2,500
2,100
1,700
1,300
NMDC Fines, ex-royalty
Pellet (Barbil) INR/t
Pellet prices were at
INR4,000/t.
5,300
4,800
4,300
3,800
3,300
2,800
Pellet (Barbil)
Source: SteelMint, WSA, MOSL
22 May 2017
4

Metals Weekly
India Monthly steel trends
Steel consumption (mt) and growth (trailing 12-month) YoY %
India steel demand grew
3.4% YoY to 6mt in April
2017.
Cons. (mt)
10.0
8.0
6.0
4.0
2.0
0.0
-2.0
Trailing 12m Growth (%)
2.6
Steel imports and exports - kt
India remained a net
exporter of steel at 243kt
in April 2017.
1,000
500
0
-500
-1,000
355
Net steel imports (kt)
475
825
-821
Scrap imports - kt
Import of ferrous scrap
was down 43% YoY to
303kt in November 2016.
Scrap imports - kt
Crude steel production - kt
Crude steel production - mt
Crude steel production
was up 5.4% YoY
to 8.1mt in April.
Source: JPC
22 May 2017
5

Metals Weekly
European Union
European HRC prices (EUR/ton)
EU HRC steel prices were
unchanged at EUR488/t.
North Europe HRC
570
510
450
390
330
270
South Europe HRC
Shredded scrap prices (USD/t) fob Rotterdam
Rotterdam scrap prices
were unchanged at
USD251/t.
355
315
275
235
195
155
European wire rods southern region (Euro/t)
500
460
South Europe wire rod
prices were unchanged.
420
380
340
300
Spreads ( HRC-1.6xiron ore-0.7xcoking coal) – (USD/t)
395
EU
China
EU steel product spreads
improved on lower coking
coal prices.
340
285
230
175
120
Source: Metal Bulletin, Bloomberg, WSA, MOSL
22 May 2017
6

Metals Weekly
China
China domestic prices (USD/ton)
Chinese local HRC steel
price was up 4.4% WoW to
USD467/t, rebar prices
were up 3.1% WoW to
USD556/t.
580
510
440
370
300
230
HRC
Rebar
Steel spreads (Steel price – 1.6x iron ore – 0.55x coke) for Chinese producers
Chinese steel rebar
spreads are at multi-year
high on increase in steel
prices.
315
270
225
180
135
90
HRC
Rebar
Steel trade (m ton)
Chinese steel exports were
down 25% YoY to 7.018mt in
March 2017.
12
10
8
6
4
2
0
Exports
Imports
Steel inventories in main China cities (m tons)
7
Steel inventories in China
declined WoW.
6
5
4
3
22 May 2017
7

Metals Weekly
Other regions
CIS HRC export prices (USD/ton) fob basis
CIS export HRC prices were
up 2.3% WoW to
USD445/t.
CIS Exports (HRC)
500
450
400
350
300
250
Turkish export billets (USD/ton)
Turkish Exp Billets
440
390
340
290
North America HRC prices (USD/ton)
670
US HRC prices
were down 1.6% WoW.
620
570
520
470
420
CIS: Monthly crude steel production
CIS countries crude steel
production increased 0.8%
YoY to 8.9mt in March
2017.
10.0
9.5
9.0
8.5
8.0
7.5
CIS
YoY (%)
15
10
5
0
-5
-10
-15
Source: Metal Bulletin, WSA, Bloomberg, MOSL
22 May 2017
8

Metals Weekly
Other regions
North America: Monthly crude steel production
North America
YoY (%)
15.0
7.5
0.0
-7.5
-15.0
US steel production grew
9.2% YoY to ~10.2mt in
March 2017.
11.0
10.5
10.0
9.5
9.0
8.5
8.0
Global: Monthly crude steel production
Global crude steel
production grew 4.9% YoY
to 144.9mt in March 2017.
150
145
140
135
130
125
120
Global
YoY (%)
8
6
4
2
0
-2
-4
-6
-8
Global: Monthly crude steel capacity utilization
74
Capacity Utilization
Capacity utilization increased
200bps YoY to 72.7% in
March 2017.
70
66
62
Source: Bloomberg, WSA, MOSL
22 May 2017
9

Metals Weekly
Steel raw materials
Import price of 62% grade iron-ore fines in China (USD/ton)
CIF
FOB
Iron ore (China cfr) prices
were up 2% WoW to
USD63/t.
105
90
75
60
45
30
OTC iron-ore swaps (USD/ton)
2017
3Q17
2Q17
90
80
70
60
50
40
30
China iron-ore production and imports (m tons)
China iron ore imports
increased ~11% YoY
to 95.6mt in March 2017.
155
130
105
80
55
30
Ore Imports
Ore Prod
Pig iron prod (RHS)
76
68
60
52
44
China’s iron-ore inventories (mt)
140
130
120
110
100
90
80
70
60
China iron ore inventories
were higher WoW.
Source: Metal Bulletin, Bloomberg, MOSL
22 May 2017
10

Metals Weekly
Steel raw materials
Freight rates to China (USD/ton)
Brazil
Australia
India
Freight rates were
higher WoW.
24
16
8
0
Coal price index
Richards Bay thermal coal
prices were unchanged at
USD72/t.
105
90
75
60
45
Ri chards Bay Steam Coal
Coke price index (fob China)
China coke export spot (LHS)
280
255
230
205
180
155
130
Coking coal (USD/t)
320
270
Spot coking coal (fob Australia)
Coking coal prices were
down 9% WoW to USD
154.7/t.
220
170
120
70
22 May 2017
11

Metals Weekly
Ferro alloys
China’s imports of manganese ore and concentrate
Imports
2,600
2,300
2,000
1,700
1,400
1,100
800
500
Prices (RHS)
250
210
170
130
90
50
Chrome ore FOB spot prices
40% Chrome Africa
420
370
320
270
220
170
120
70
Ferro chrome CIF prices (CNY/t)
12,000
10,500
9,000
7,500
6,000
4,500
Fe Chrome 50% Cr China
Fe Chrome 63% Cr Pittursburgh
Silico Manganese prices
0.8
0.7
0.6
0.5
0.4
0.3
Silico Manganese in warehouses in Pittsburg USA
Source: Metal Bulletin, Bloomberg, MOSL
22 May 2017
12

Metals Weekly
Non-ferrous
Non-ferrous
Aluminum
2,000
1,850
1,700
1,550
1,400
1.9
1.3
LME inventories and spot prices
Inventories (RHS)
Spot
2.5
Aluminum (cash LME) was
up 3% WoW to
USD1,938/t.
Global primary aluminum monthly production and YoY growth
Global aluminum
production declined by
0.3% YoY to 4.9mt in
March 2017.
Production
5,400
4,800
4,200
3,600
3,000
YoY
22.0
17.0
12.0
7.0
2.0
-3.0
-8.0
-13.0
Aluminum: SHFE Vs LME arbitrage (USD/T)
LME and SHFE arbitrage is
unfavorable.
230
130
30
-70
-170
-270
-370
-470
India: Company-wise primary aluminum monthly production
Hindalco
Balco
Nalco
VED - JSG
22 May 2017
13

Metals Weekly
Non-ferrous
Aluminum
All-in-aluminum was
at USD2,139/t.
3,200
2,400
1,600
800
0
Aluminum raw material and power cost for marginal producer in USA (USD/t)
CPC
Alumina
Power
LME+Spot
CPC US (USD/t)
600
500
400
300
200
Alumina (USD/t)
390
Alumina was at USD272/t.
340
290
240
190
Industrial Power US (Lousiana) per mwh
8.0
7.0
6.0
5.0
4.0
Source: Metal Bulletin, Bloomberg, Industry, MOSL
22 May 2017
14

Metals Weekly
Non-ferrous
Copper
LME inventories and prices
Inventories (RHS)
Spot
0.4
0.3
0.2
0.1
Copper (cash LME) prices
were up 1.4% WoW to
USD5,596/t
6,050
5,450
4,850
4,250
Global refined copper monthly production and YoY growth
2.2
Production
YoY - RHS
16.0
11.0
6.0
1.0
-4.0
Global copper production
declined by 1.7% YoY to
1.95mt in March 2017.
2.0
1.8
1.6
1.4
China: Refined copper monthly production and YoY growth
0.90
0.80
0.70
0.60
0.50
0.40
0.30
Production
YoY - RHS
34
23
12
1
-10
Copper: Spot TCRC (USc/lb)
33.0
30.0
27.0
24.0
21.0
18.0
22 May 2017
15

Metals Weekly
Non-ferrous
Zinc
Zinc (cash LME) was down
1% WoW to USD2,569/t
LME inventories and prices
Inventories (RHS)
2,950
2,650
2,350
2,050
1,750
1,450
Spot
0.7
0.6
0.5
0.4
0.3
0.2
Global refined zinc monthly production and YoY growth
Production
YoY growth (RHS)
14.0
8.0
2.0
-4.0
-10.0
Global zinc production was
up 1.6% YoY to 1.146mt in
March 2017.
1.3
1.2
1.1
1.1
1.0
0.9
China: Refined zinc monthly production and YoY growth
Production
0.6
0.5
0.4
0.4
0.3
-2
-22
YoY growth (RHS)
40
19
Zinc: Global metal surplus (deficit) – kt
150
100
50
0
-50
-100
-150
22 May 2017
16

Metals Weekly
Non-ferrous
Lead
Lead (cash LME) was down
4% WoW to USD2,088/t.
LME inventories and prices
Inventories (RHS)
2,350
2,150
1,950
1,750
1,550
Spot
0.25
0.23
0.20
0.18
0.15
0.13
0.10
Global refined lead monthly production and YoY growth
1.3
1.2
1.1
1.0
0.9
0.8
0.7
0.6
Production
YoY - RHS
22
12
2
-8
-18
Refined lead production
increased 13% YoY to
975kt in March 2017.
China: Refined lead monthly production and YoY growth
0.5
0.4
0
0.3
0.2
-20
Production
YoY - RHS
20
India: Company-wise refined lead monthly production
HZL
:
9
12
13 13 13 14 13 14
9
9
11
14
12 13
9
6
10
6
10 9
12
14 13 15 14
Source: Metal Bulletin, Bloomberg, MOSL
22 May 2017
17

Metals Weekly
Crude Oil
Brent crude oil price (USD/bbl)
Brent (crude oil) was
up 5.4% WoW to
USD54.1/bbl.
Brent Crude
75.0
65.0
55.0
45.0
35.0
25.0
Global crude oil quarterly supply (mbpd)
Non-OPEC supply
OPEC Supply
97.2 97.4 96.7 96.0 97.0 98.2
38.6 38.6 38.7 39.0 39.5 40.0
90.6 90.5 90.5 91.1 90.4 91.3 91.8 91.9 92.2 93.2 94.3 95.6 95.2 96.4
38.6 39.1 38.9 38.2 37.7 38.2 37.9 37.1 37.3 37.5 38.0 38.0 37.1 38.2
52.0 51.4 51.6 52.9 52.7 53.1 53.9 54.8 54.9 55.7 56.3 57.6 58.1 58.2 58.6 58.8 58.0 57.0 57.5 58.2
Global crude oil surplus/(deficit) - mbpd
surplus/(deficit)
2.0
1.8
1.3
0.8
0.7 0.8
(0.4) (0.2)
1.4 1.4
1.3
1.2
0.1
(0.2)
0.5
(0.6)
(0.9)
(0.9)
(0.3)
(1.2)
Crude oil futures (USD/bbl)
60
Current
1-week ago
3-month ago
:
55
50
Source: Metal Bulletin, Bloomberg, MOSL
22 May 2017
18

Metals Weekly
Commodity forward curves
LME aluminum (USD/ton)
2,100
1,950
1,800
1,650
Current
1-week ago
3-month ago
LME copper (USD/ton)
6,100
6,000
5,900
5,800
5,700
5,600
5,500
5,400
Current
1-week ago
3-month ago
LME zinc futures (USD/ton)
3,000
2,800
2,600
2,400
2,200
2,000
Current
1-week ago
3-month ago
Base metals US spot premium (USD/ton)
565
490
415
340
265
190
115
40
Aluminium
Zinc
Copper
Source: Metal Bulletin, Bloomberg, MOSL
22 May 2017
19

Metals Weekly
China non-ferrous trade data
China’s aluminum trade ('000 tons)
Aluminum exports were
down 2% YoY
to 410kt in March 2017.
600
500
400
300
200
100
0
Imports
Exports
China’s refined copper trade ('000 tons)
500
400
300
200
100
0
Imports
Exports
China’s refined zinc trade ('000 tons)
100
75
50
25
0
Export
Import
China’s alumina imports ('000 tons)
800
Chinese alumina imports
increased 17% YoY to
420kt in March 2017.
600
400
200
0
Source: Metal Bulletin, Bloomberg, MOSL
22 May 2017
20

Metals Weekly
Key indicators
China new loan growth (Yuan b)
2,400
2,100
1,800
1,500
1,200
900
600
300
China: PMI
54
52
50
48
46
Mfg PMI
Steel PMI
59
53
47
41
35
China: Fixed asset investment growth (%)
Fixed asset investment
growth was at 9.2% YoY
in April.
21
19
17
15
13
11
9
7
Currency movement with respect to the rupee
71
67
63
59
55
51
USD (LHS)
GBP
EURO
110
101
92
83
74
65
Source: Bloomberg, MOSL
22 May 2017
21

Metals Weekly
Key indicators (Contd...)
China Energy Production: Electricity (b kwh)
Electricity
YoY (%, RHS)
32
17
2
-13
China electricity
generation increased 8%
YoY in March 2017.
550
480
410
340
270
200
China Monthly Trade YoY (%)
50
30
10
-10
-30
Import
Export
China Price Index YoY (%)
8
5
2
-1
-4
-7
PPI
CPI
China GDP YoY (%)
8.0
7.7
China’s GDP growth was
6.9% in 4QCY16.
7.4
7.1
6.8
6.5
Source: Bloomberg, MOSL
22 May 2017
22

Metals Weekly
Industrial production growth
The UK and the USA (%)
6
3
0
-3
-6
UK
USA
Japan (%)
10
5
0
-5
-10
European Union (%)
8
2
-4
-10
France
Germany
Italy
BRIC (%)
Russia
13
6
-1
-8
-15
Brazil
India
China
Source: Bloomberg, MOSL
22 May 2017
23

Metals Weekly
Stock exchange announcements
None:
22 May 2017
24

Metals Weekly
Metals
Valuation Matrix
Rating
Steel
Ta ta Steel
JSW Steel
JSPL
SAIL
Non-Ferrous
Hi nda l co
Na l co
Veda nta
Mining
Coa l Indi a
Hi ndus ta n Zi nc
NMDC
CMP=current ma rket pri ce
Sel l
Buy
Buy
Sel l
Buy
Buy
Neutra l
Buy
Sel l
Buy
Price
(INR)
489
194
112
60
191
68
230
277
246
123
MCAP
(USD M) FY17E
7,407
7,289
1,594
3,887
6,148
2,715
10,628
27,261
16,198
7,607
37.0
13.6
-22.3
-7.4
17.5
3.9
17.7
15.9
19.7
11.9
EPS
FY18E
39.5
18.3
-17.5
-12.6
22.6
5.3
24.7
18.7
21.5
12.1
P/E (x)
FY18E FY19E
12.4
10.6
-6.4
-4.8
8.4
12.7
9.3
14.8
11.4
10.2
10.7
9.4
-50.6
nm
7.4
11.6
8.3
13.2
10.4
9.6
EV/EBITDA (x)
FY18E FY19E
7.2
6.6
9.5
nm
6.0
5.1
5.7
6.9
6.9
6.4
6.8
5.7
6.6
10.3
5.3
4.4
5.7
6.2
5.9
6.0
P/B(x)
FY18E FY19E
1.4
1.8
0.3
0.8
1.3
1.2
1.2
1.2
1.6
0.3
0.8
1.1
1.1
1.2
FY19E
45.7
20.5
-2.2
0.4
25.9
5.8
27.7
20.9
23.7
12.8
6.9
6.9
2.9
2.4
1.5
1.4
Source: MOSL
Valuations: Global Companies
Company
Mining
BHP-Bi l l i ton
FMG
Ri o Ti nto
Va l e
Teck Res ources
STEEL
Arcel or Mi tta l
Pos co
US Steel
Nucor
JFE
Gerda u
Anga ng
NON FERROUS
Al coa
Nors k Hydro
Rus a l
BBG
CODE
BHP AU
FMG AU
RIO AU
Va l e US
TCK US
MT NA
005490 KS
X US
NUE US
5411 JT
GGBR4 BZ
000898 CH
AA US
NHY NO
486 HK
Currency
AUD
AUD
AUD
USD
USD
EUR
k KRW
USD
USD
JPY
BRL
CNY
USD
NOK
HKD
PRICE
24
5
63
26
19
20
272
20
57
1,816
10
5
32
48
4
MCAP
(US$ M)
92,455
12,515
77,139
42,961
10,805
22,988
22,248
3,422
18,077
10,307
5,025
5,366
5,949
11,671
7,338
PE (x)
CUR YR
NXT YR
12.8
5.3
10.5
6.3
5.4
8.7
9.7
22.1
12.7
10.7
23.5
14.8
11.6
13.4
6.8
14.7
8.2
14.1
8.2
8.0
8.8
9.1
9.4
12.3
9.7
11.6
12.4
12.5
12.4
6.2
EV/EBITDA(x)
CUR YR
NXT YR
5.5
3.2
5.1
4.4
3.5
4.7
5.5
5.1
6.6
7.0
6.7
7.3
4.2
5.9
8.9
5.9
4.4
6.1
5.4
4.6
4.8
5.4
4.0
6.5
6.7
5.4
6.6
P/BV (x)
CY17
nm
nm
2.0
1.0
0.8
nm
0.6
1.6
2.2
nm
1.1
0.8
4.7
1.0
5.6
1.2
8.9
nm
Source: Bl oomberg
22 May 2017
25

Metals Weekly
Metals Stock
Performance
Among large-cap companies, Tata
Steel was the best relative
performer.
Metals stock performance on absolute and relative basis (%)
Months
Steel
Ta ta Steel
SAIL
JSW Steel
JSPL
NMDC
Non-Ferrous
Veda nta
Hi ndus ta n Zi nc
Na l co
Hi nda l co
Mid Caps
Monnet Is pa t
Goda wa ri
Sa rda Energy
Ta ta Sponge
Adhuni k Meta l i ks
Bhus ha n Steel
Ja i Ba l a ji
Ra i n Indus tri es
Pra ka s h Indus tri es
SENSEX
1
8.7
0.2
3.4
-5.9
-2.8
-0.2
-9.8
-8.0
4.0
12.6
-7.0
3.2
4.3
-12.5
48.6
-4.3
0.5
3.8
3.9
Absolute Perf (%)
3
6
4.2
0.1
3.3
20.5
-10.0
-12.4
-18.6
4.2
1.8
13.5
9.6
7.6
39.7
-11.8
77.1
41.6
31.4
12.3
7.6
24.9
20.2
14.0
64.4
7.2
11.1
3.4
40.0
17.2
90.3
66.0
18.8
60.8
-8.0
138.5
49.6
122.6
92.8
15.8
12
50.1
51.0
46.6
85.3
36.9
142.2
47.5
64.3
119.5
80.7
47.8
163.3
44.2
-20.1
169.2
183.6
200.4
138.9
19.9
Relative Perf to Sensex (%)
1
3
6
12
4.8
-3.7
-0.5
-9.8
-6.7
-4.1
-13.7
-11.9
0.1
8.7
-10.9
-0.7
0.4
-16.4
44.7
-8.2
-3.4
-0.1
-
-3.5
-7.6
-4.3
12.9
-17.7
-20.1
-26.3
-3.4
-5.9
5.9
1.9
0.0
32.1
-19.5
69.5
33.9
23.8
4.6
-
9.1
4.4
-1.9
48.6
-8.6
-4.8
-12.4
24.1
1.3
74.4
50.2
3.0
45.0
-23.8
122.6
33.8
106.7
76.9
-
30.1
31.1
26.7
65.3
17.0
122.2
27.6
44.3
99.5
60.7
27.9
143.4
24.3
-40.1
149.3
163.6
180.5
119.0
-
Among mid-cap companies,
Bhushan Steel was the best
relative performer over one
month.
Global Metals stock performance on absolute basis (%)
1week
1month
5.5
1.5
-1.8
2.9
-1.5
-7.1
-31.8
-1.2
0.2
-6.4
1.7
1.5
-0.9
8.3
9.4
-2.7
1.7
-0.8
-11.9
Absolute Perf (%)
3 months
6 months
-13.1
-9.9
-22.5
-25.7
-20.2
-39.1
-49.9
-10.9
-22.4
-11.9
-3.4
-15.4
-13.9
-0.4
-3.6
-33.5
-11.4
-10.0
-16.2
6.9
1.3
15.2
-10.6
-0.1
-18.9
-31.2
-5.3
0.3
1.2
7.1
11.0
2.5
7.1
11.9
-22.2
2.8
19.3
9.5
7 months
63.3
29.8
104.4
78.2
88.7
72.1
45.5
21.7
70.4
15.4
33.1
26.0
8.9
27.9
36.6
83.4
58.1
58.4
52.8
12 months
63.3
29.8
104.4
78.2
88.7
72.1
45.5
21.7
70.4
15.4
33.1
26.0
8.9
27.9
36.6
83.4
58.1
58.4
52.8
Among global mining companies,
FMG was the best relative
performer over one week.
Among global steel majors,
Thyssen Krupp was the best
relative performer.
Among the global aluminum,
Alcoa was the best
relative performer
Mining
Ri o Ti nto
BHP Bi l l i ton
Va l e
FMG
Angl o Ameri ca n
Veda nta
Steel
US Steel
Nucor
Arcel or Mi tta l
Anga ng
Pos co
JFE Hol di ngs
Ni ppon
Thys s en Krupp
Voes t Al pi ne
Gerda u
Aluminium
Al coa
Rus a l
Cha l co
6.6
2.2
1.9
10.5
5.0
5.7
-2.2
-1.2
0.8
2.4
-0.4
-2.4
-3.0
7.7
2.8
-5.0
1.6
-1.0
-0.3
22 May 2017
26

Metals Weekly
NOTES
22 May 2017
27

Disclosures
This document has been prepared by Motilal Oswal Securities Limited (hereinafter referred to as Most) to provide information about the company (ies) and/sector(s), if any, covered in the report and may be distributed by it and/or its
Metals Weekly
affiliated company(ies). This report is for personal information of the selected recipient/s and does not construe to be any investment, legal or taxation advice to you. This research report does not constitute an offer, invitation or
inducement to invest in securities or other investments and Motilal Oswal Securities Limited (hereinafter referred as MOSt) is not soliciting any action based upon it. This report is not for public distribution and has been furnished to
you solely for your general information and should not be reproduced or redistributed to any other person in any form. This report does not constitute a personal recommendation or take into account the particular investment
objectives, financial situations, or needs of individual clients. Before acting on any advice or recommendation in this material, investors should consider whether it is suitable for their particular circumstances and, if necessary, seek
professional advice. The price and value of the investments referred to in this material and the income from them may go down as well as up, and investors may realize losses on any investments. Past performance is not a guide for
future performance, future returns are not guaranteed and a loss of original capital may occur.
MOSt and its affiliates are a full-service, integrated investment banking, investment management, brokerage and financing group. We and our affiliates have investment banking and other business relationships with a some
companies covered by our Research Department. Our research professionals may provide input into our investment banking and other business selection processes. Investors should assume that MOSt and/or its affiliates are
seeking or will seek investment banking or other business from the company or companies that are the subject of this material and that the research professionals who were involved in preparing this material may educate investors
on investments in such business . The research professionals responsible for the preparation of this document may interact with trading desk personnel, sales personnel and other parties for the purpose of gathering, applying and
interpreting information. Our research professionals are paid on twin parameters of performance & profitability of MOSt.
MOSt generally prohibits its analysts, persons reporting to analysts, and members of their households from maintaining a financial interest in the securities or derivatives of any companies that the analysts cover. Additionally, MOSt
generally prohibits its analysts and persons reporting to analysts from serving as an officer, director, or advisory board member of any companies that the analysts cover. Our salespeople, traders, and other professionals or affiliates
may provide oral or written market commentary or trading strategies to our clients that reflect opinions that are contrary to the opinions expressed herein, and our proprietary trading and investing businesses may make investment
decisions that are inconsistent with the recommendations expressed herein. In reviewing these materials, you should be aware that any or all of the foregoingamong other things, may give rise to real or potential conflicts of interest.
MOSt and its affiliated company(ies), their directors and employees and their relatives may; (a) from time to time, have a long or short position in, act as principal in, and buy or sell the securities or derivatives thereof of companies
mentioned herein. (b) be engaged in any other transaction involving such securities and earn brokerage or other compensation or act as a market maker in the financial instruments of the company(ies) discussed herein or act as an
advisor or lender/borrower to such company(ies) or may have any other potential conflict of interests with respect to any recommendation and other related information and opinions.; however the same shall have no bearing
whatsoever on the specific recommendations made by the analyst(s), as the recommendations made by the analyst(s) are completely independent of the views of the affiliates of MOSt even though there might exist an inherent
conflict of interest in some of the stocks mentioned in the research report Reports based on technical and derivative analysis center on studying charts company's price movement, outstanding positions and trading volume, as
opposed to focusing on a company's fundamentals and, as such, may not match with a report on a company's fundamental analysis. In addition MOST has different business segments / Divisions with independent research
separated by Chinese walls catering to different set of customers having various objectives, risk profiles, investment horizon, etc, and therefore may at times have different contrary views on stocks sectors and markets.
Unauthorized disclosure, use, dissemination or copying (either whole or partial) of this information, is prohibited. The person accessing this information specifically agrees to exempt MOSt or any of its affiliates or employees from,
any and all responsibility/liability arising from such misuse and agrees not to hold MOSt or any of its affiliates or employees responsible for any such misuse and further agrees to hold MOSt or any of its affiliates or employees free
and harmless from all losses, costs, damages, expenses that may be suffered by the person accessing this information due to any errors and delays. The information contained herein is based on publicly available data or other
sources believed to be reliable. Any statements contained in this report attributed to a third party represent MOSt’s interpretation of the data, information and/or opinions provided by that third party either publicly or through a
subscription service, and such use and interpretation have not been reviewed by the third party. This Report is not intended to be a complete statement or summary of the securities, markets or developments referred to in the
document. While we would endeavor to update the information herein on reasonable basis, MOSt and/or its affiliates are under no obligation to update the information. Also there may be regulatory, compliance, or other reasons that
may prevent MOSt and/or its affiliates from doing so. MOSt or any of its affiliates or employees shall not be in any way responsible and liable for any loss or damage that may arise to any person from any inadvertent error in the
information contained in this report. MOSt or any of its affiliates or employees do not provide, at any time, any express or implied warranty of any kind, regarding any matter pertaining to this report, including without limitation the
implied warranties of merchantability, fitness for a particular purpose, and non-infringement. The recipients of this report should rely on their own investigations.
This report is intended for distribution to institutional investors. Recipients who are not institutional investors should seek advice of their independent financial advisor prior to taking any investment decision based on this report or for
any necessary explanation of its contents.
Most and it’s associates may have managed or co-managed public offering of securities, may have received compensation for investment banking or merchant banking or brokerage services, may have received any compensation
for products or services other than investment banking or merchant banking or brokerage services from the subject company in the past 12 months.
Most and it’s associates have not received any compensation or other benefits from the subject company or third party in connection with the research report.
Subject Company may have been a client of Most or its associates during twelve months preceding the date of distribution of the research report
MOSt and/or its affiliates and/or employees may have interests/positions, financial or otherwise of over 1 % at the end of the month immediately preceding the date of publication of the research in the securities mentioned in this
report. To enhance transparency, MOSt has incorporated a Disclosure of Interest Statement in this document. This should, however, not be treated as endorsement of the views expressed in the report.
Motilal Oswal Securities Limited is registered as a Research Analyst under SEBI (Research Analyst) Regulations, 2014. SEBI Reg. No. INH000000412
Pending Regulatory inspections against Motilal Oswal Securities Limited:
SEBI pursuant to a complaint from client Shri C.R. Mohanraj alleging unauthorized trading, issued a letter dated 29th April 2014 to MOSL notifying appointment of an Adjudicating Officer as per SEBI regulations to hold inquiry and
adjudge violation of SEBI Regulations; MOSL replied to the Show Cause Notice whereby SEBI granted us an opportunity of Inspection of Documents. Since all the documents requested by us were not covered we have requested to
SEBI vide our letter dated June 23, 2015 to provide pending list of documents for inspection.
List of associate companies of Motilal Oswal Securities Limited -Click
here to access detailed report
Analyst Certification
The views expressed in this research report accurately reflect the personal views of the analyst(s) about the subject securities or issues, and no part of the compensation of the research analyst(s) was, is, or will be directly or
indirectly related to the specific recommendations and views expressed by research analyst(s) in this report. The research analysts, strategists, or research associates principally responsible for preparation of MOSt research receive
compensation based upon various factors, including quality of research, investor client feedback, stock picking, competitive factors and firm revenues
Disclosure of Interest Statement
Analyst ownership of the stock
Served as an officer, director or employee
Companies where there is interest
VEDANTA LTD
No
A graph of daily closing prices of securities is available at www.nseindia.com and http://economictimes.indiatimes.com/markets/stocks/stock-quotes
Regional Disclosures (outside India)
This report is not directed or intended for distribution to or use by any person or entity resident in a state, country or any jurisdiction, where such distribution, publication, availability or use would be contrary to law, regulation or which
would subject MOSt& its group companies to registration or licensing requirements within such jurisdictions.
For Hong Kong:
This report is distributed in Hong Kong by Motilal Oswal capital Markets (Hong Kong) Private Limited, a licensed corporation (CE AYY-301) licensed and regulated by the Hong Kong Securities and Futures
Commission (SFC) pursuant to the Securities and Futures Ordinance (Chapter 571 of the Laws of Hong Kong) “SFO”. As per SEBI (Research Analyst Regulations) 2014 Motilal Oswal Securities (SEBI Reg No. INH000000412) has
an agreement with Motilal Oswal capital Markets (Hong Kong) Private Limited for distribution of research report in Kong Kong. This report is intended for distribution only to “Professional Investors” as defined in Part I of Schedule 1 to
SFO. Any investment or investment activity to which this document relates is only available to professional investor and will be engaged only with professional investors.” Nothing here is an offer or solicitation of these securities,
products and services in any jurisdiction where their offer or sale is not qualified or exempt from registration. The Indian Analyst(s) who compile this report is/are not located in Hong Kong & are not conducting Research Analysis in
Hong Kong.
For U.S
Motilal Oswal Securities Limited (MOSL) is not a registered broker - dealer under the U.S. Securities Exchange Act of 1934, as amended (the"1934 act") and under applicable state laws in the United States. In addition MOSL is not a
registered investment adviser under the U.S. Investment Advisers Act of 1940, as amended (the "Advisers Act" and together with the 1934 Act, the "Acts), and under applicable state laws in the United States. Accordingly, in the
absence of specific exemption under the Acts, any brokerage and investment services provided by MOSL, including the products and services described herein are not available to or intended for U.S. persons.
This report is intended for distribution only to "Major Institutional Investors" as defined by Rule 15a-6(b)(4) of the Exchange Act and interpretations thereof by SEC (henceforth referred to as "major institutional investors"). This
document must not be acted on or relied on by persons who are not major institutional investors. Any investment or investment activity to which this document relates is only available to major institutional investors and will be
engaged in only with major institutional investors. In reliance on the exemption from registration provided by Rule 15a-6 of the U.S. Securities Exchange Act of 1934, as amended (the "Exchange Act") and interpretations thereof by
the U.S. Securities and Exchange Commission ("SEC") in order to conduct business with Institutional Investors based in the U.S., MOSL has entered into a chaperoning agreement with a U.S. registered broker-dealer, Motilal Oswal
Securities International Private Limited. ("MOSIPL"). Any business interaction pursuant to this report will have to be executed within the provisions of this chaperoning agreement.
The Research Analysts contributing to the report may not be registered /qualified as research analyst with FINRA. Such research analyst may not be associated persons of the U.S. registered broker-dealer, MOSIPL, and therefore,
may not be subject to NASD rule 2711 and NYSE Rule 472 restrictions on communication with a subject company, public appearances and trading securities held by a research analyst account.
For Singapore
Motilal Oswal Capital Markets Singapore Pte Limited is acting as an exempt financial advisor under section 23(1)(f) of the Financial Advisers Act(FAA) read with regulation 17(1)(d) of the Financial Advisors Regulations and is a
subsidiary of Motilal Oswal Securities Limited in India. This research is distributed in Singapore by Motilal Oswal Capital Markets Singapore Pte Limited and it is only directed in Singapore to accredited investors, as defined in the
Financial Advisers Regulations and the Securities and Futures Act (Chapter 289), as amended from time to time.
In respect of any matter arising from or in connection with the research you could contact the following representatives of Motilal Oswal Capital Markets Singapore Pte Limited:
Varun Kumar
Varun.kumar@motilaloswal.com
Contact : (+65) 68189232
Office Address:21 (Suite 31),16 CollyerQuay,Singapore 04931
Motilal Oswal Securities Ltd
Motilal Oswal Tower, Level 9, Sayani Road, Prabhadevi, Mumbai 400 025
Phone: +91 22 3982 5500 E-mail: reports@motilaloswal.com
8 May 2017
28