24 May 2017
4QFY17 Results Update | Sector: Textiles
SRF Ltd
Buy
BSE SENSEX
30,302
Bloomberg
Equity Shares (m)
M.Cap.(INRb)/(USDb)
52-Week Range (INR)
1, 6, 12 Rel. Per (%)
Avg Val, INRm
Free float (%)
S&P CNX
9,361
SRF IN
57.4
91.0/1.4
1970 / 1166
-10/-8/12
389
47.6
CMP: INR1,585
TP: INR1,816(+15%)
Refrigerants business on strong footing; Maintain Buy
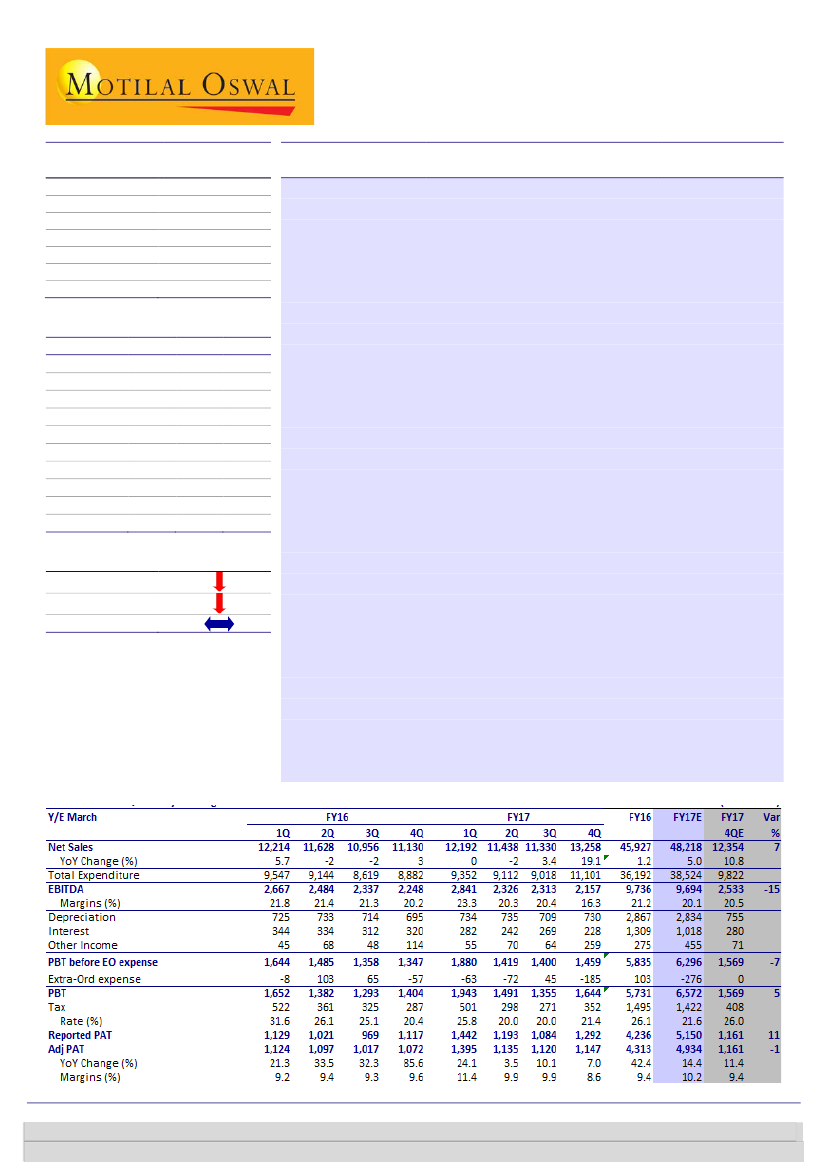
EBITDA below estimate, Chemicals continues to underperform:
SRF reported
overall revenue of INR13.3b (est. of INR12.3b) in 4QFY17, as against INR11.1b in
4QFY16. On a YoY basis, Chemicals grew by 11.7%, Technical Textiles by 23.3%
and Packaging by 26.3%. EBITDA margin contracted from 20.2% in 4QFY16 to
16.3% (est. of 20.5%) in the quarter. EBITDA declined 4% to INR2,157m (est. of
INR2,533m) from INR2,248m in 4QFY16. Segment-wise, PBIT margin for
Technical Textiles was at 10% (v/s 11.1% in 4QFY16), Chemical at 16.6% (v/s
23.2% YoY) and Packaging at 9.7% (v/s 12.8% YoY). Consequently, adj. PAT grew
7% from INR1,072m in 4QFY16 to INR1,147m (est. INR1,161m) in 4QFY17. For
FY17, revenue grew 5% YoY to INR48.2b, EBITDA margin shrunk 110bp to 20.1%,
while adj. PAT grew 13% to INR4.9b.
Refrigerant Gas business on strong footing:
R-134a gas registered healthy
growth, driven by exports. Total volume for FY17 is expected to have crossed
~10,000t (v/s ~7,000t for full-year FY16), in line with management guidance. Due
to anti-dumping levied on Chinese R-134a in the US, SRF’s performance should
see a boost in terms of volumes and margins (approx. 200bp improvement).
Specialty Chemicals to remain subdued in 1HFY18:
Management highlighted
that the global agri-chem environment continues to remain weak, impacting its
SpChem business, and the pain will continue for next few quarters. However, the
pipeline of molecules or funnel remains healthy, with SRF continuing to invest in
capability building.
Valuation and view:
We believe SRF is the best play in chemicals as it is highly
R&D-driven and operating in a niche area. We believe once the global agrochem
situation improves, SRF will benefit the most as it has capacities in place along
with improved R&D prowess. However, considering an increase in the tax rate
and higher depreciation due to new capex, we cut FY18E/FY19E earnings by
12%/12%. We expect 16% revenue CAGR and 15% adj. PAT CAGR over FY17-19E.
We value the stock on SOTP basis and maintain
Buy
with a TP of INR1,816.
Financials & Valuations(INR b)
2017 2018E
Y/E Mar
48.2
56.6
Net Sales
9.7
10.8
EBITDA
4.9
5.1
PAT
85.9
89.0
EPS (INR)
12.8
3.6
Gr. (%)
544.6
613.5
BV/Sh (INR)
16.6
15.1
RoE (%)
17.7
19.2
RoCE (%)
18.4
17.8
P/E (x)
2.9
2.6
P/BV (x)
2019E
65.3
13.1
6.5
111.5
25.3
701.9
17.0
23.6
14.2
2.3
Estimate change
TP change
Rating change
Quarterly Performance (Consolidated)
Investors are advised to refer through important disclosures made at the last page of the Research Report.
MotilalOswal research is available on www.motilaloswal.com/Institutional-Equities, Bloomberg, Thomson Reuters, Factset and S&P Capital.
Chintan Modi(Chintan.Modi@MotilalOswal.com);+91
22 6129 1554
Niket Shah(Niket.Shah@MotilalOswal.com);+91
22 6129 1535

SRF Ltd
Exhibit 1: Revenue trend
12,214
11,628
Revenues (INR m)
12,192
11,130
10,956
Growth %
11,438
11,330
19.1%
5.7%
-2.2%
-1.6%
2.9%
-0.2%
3.4%
-1.6%
13,258
Source: Company, MOSL
Exhibit 2: EBITDA margin trend
EBITDA (INR m)
21.8% 21.4%
21.3% 20.2%
23.3%
Margins (%)
20.3% 20.4%
16.3%
Exhibit 3: PAT trend
PAT (INR m)
1,395
1,124
9%
1,097
9%
1,017
9%
1,072
10%
11%
1,135
10%
1,120
10%
1,147
Margins (%)
9%
2,667
2,484
2,337
2,248
2,841
2,326
2,313
2,157
Source: Company, MOSL
Exhibit 4: Revenue mix
Technical Textile
26%
29%
44%
29%
31%
40%
29%
31%
40%
29%
34%
37%
Chemicals
25%
38%
37%
27%
35%
38%
Packaging
29%
32%
40%
28%
32%
41%
27%
36%
38%
Exhibit 5: PBIT mix
Technical Textile
5%
54%
45%
41%
27%
47%
26%
62%
13%
55%
47%
28%
37%
34%
29%
27%
25%
Chemicals
20%
25%
Packaging
29%
27%
36%
37%
21%
48%
25%
31%
Source: Company, MOSL
Exhibit 6: Chemicals revenue trend
Revenues (INR m)
30.1%
18.0% 20.5%
43.1%
11.4%
0.3% -4.2%
11.7%
Growth
Exhibit 7: Chemicals PBIT trend
25%
19%
PBIT (INR m)
26%
23%
22%
Margins (%)
26%
17%
16%
17%
3,167 3,782 3,852 3,989 4,531 4,214 3,864 3,822 5,063
611
945
857
1,053 1,052 1,116
676
622
841
Source: Company, MOSL
24 May 2017
2

SRF Ltd
Exhibit 8: Packaging revenue trend
Revenues (INR m)
17.1%
0.7%
Growth
26.3%
9.7%
5.1%
-5.2% -1.9% -0.2%
2%
17%
Exhibit 9: Packaging PBIT trend
PBIT (INR m)
14%
13%
13%
Margins (%)
18%
15% 14%
10%
2,848 3,527 3,561 3,360 2,993 3,343 3,494 3,352 3,779
59
604
490
431
384
596
527
477
366
Source: Company, MOSL
Exhibit 10: Technical Textile revenue trend
Revenues (INR m)
Growth
13.3%
-8.2%
-3.1%
-14.1%
-10.3%
-5.6% -4.4%
23.3%
Exhibit 11: Technical Textile PBIT trend
PBIT (INR m)
566
Margins (%)
673
463
10%
462
9%
213
5%
481
14%
11%
13%
13%
10%
610
654
536
11%
4,821 4,924 5,024 4,319 4,326 4,647 4,805 4,892 5,332
Source: Company, MOSL
Other Highlights
The Board approved capex aggregating approximately INR2b in the Chemicals
Business to create production capability to produce new agrochemical with a peak
production capacity of 250 MT and carry out modifications in the P 11/12 plant with
the objective of improving capacities to meet R 134a production requirements, both
at Dahej.
CGMP manufacturing facility & Multipurpose plant capexes remain on schedule.
SRF is the first domestic company to launch the FLORON 22 cans in India, ensuring
genuine product usage. Also, launched the FLORON brand in Thailand - building on
own sales and distribution set up.
Revival in the mining and steel sector leading to enhanced performance from Belting
Fabric segment.
In Q4FY17, SRF commissioned a new BOPET films unit at the Indore while Domestic
Tariff Area BOPP plant installation is under process and is scheduled as per plan.
BOPP margins were seen to be under pressure.
24 May 2017
3

SRF Ltd
Valuation and view
We believe SRF will be the preferred choice for global agrochemicals and
pharmaceutical players for fluorine-based molecule requirements on the back of
SRF’s strong R&D capabilities and ability to provide support across value chain—
from access to critical starting materials, in-house process research and
development, lab synthesis and pilot production to setting up dedicated plants
for commercial production.
SRF continues to exhibit superior performance across all segments except
specialty chemicals which is going through transitory phase. to focus on value
added films and being the lowest cost operator, margin in PB segment have
remained stable while most of the players in industry have witnessed sharp
decline in margins. TTB continues to remain steady and has posted strong
margin improvement.
We believe, SRF is the best play in chemicals as it highly R&D driven and
operating in niche area. We believe, once the global ag-chem bounces back, SRF
will benefit the most as it has got capacities in place and has only improved its
R&D prowess over the years. However, considering increase in tax rate and
higher depreciation on account of new capex, we cut our FY18/FY19 earnings
estimates by 12%/12%. We expect SRF to post 16% revenue CAGR while adj.
PAT to register 15% CAGR over FY17-19E. We value the stock on SOTP basis and
maintain
Buy
with a target price of INR1,816.
Exhibit 12: SOTP valuation
Business Segment
Chemicals
Technical Textile
Packaging
Total
EPS FY19E
62.5
27.4
21.6
111.5
P/E Multiple
FY19E
22x
9x
9x
16x
Value (Rs)
1375
247
194
1816
Exhibit 13: Price to earnings (One year forward)
27
20
14
7
0
7.1
11.1
7.7
P/E (x)
5 Yrs Avg(x)
15 Yrs Avg(x)
10 Yrs Avg(x)
Exhibit 14: Price to book (One year forward)
4.6
3.1
1.7
1.6
0.1
1.2
1.2
P/B (x)
5 Yrs Avg(x)
15 Yrs Avg(x)
10 Yrs Avg(x)
Source: Company, MOSL
24 May 2017
4

SRF Ltd
Story in charts
Exhibit 15: Share of chemicals in revenues increasing
Technical Textile
22
24
27
28
28
34
Chemicals
27
34
Packaging Films
29
34
Exhibit 16: Contribution within chemicals
Specialty chemicals
HFC-134a
Chloromethanes
44
45
1
12
19
8
15
FY15
45
3
18
17
6
11
FY16
Dymel
Other commodity chemcials
Engineering plastics
41
3
24
16
5
10
FY17E
39
3
28
14
6
9
FY18E
41
3
29
13
6
8
FY19E
30
37
11
20
7
18
FY14
54
45
FY15
38
FY16
38
FY17E
36
FY18E
33
FY19E
FY14
Source: MOSL, Company
Exhibit 17: PAT to post a CAGR of 16% over FY16-19E
PAT
86
4299
42
20
-1
Growth %
6519
5150
5112
28
Exhibit 18: Debt to equity to reduce to 0.4
1.1
0.9
Debt
Debt to equity
0.8
0.6
0.5
17,774
0.3
14,274
3028
1625
-36
FY14
FY15
21,753
20,244
21,297
19,774
FY16
FY17E
FY18E
FY19E
FY14
FY15
FY16
FY17E
FY18E
FY19E
Source: MOSL, Company
Exhibit 19: RoCE to improve to 24%
RoE %
20
16
9
8
FY14
FY15
FY16
FY17E
FY18E
FY19E
17
14
RoCE %
24
18
17
19
17
Exhibit 20: Strong free cash flow generating
FCF
3,441
1,021
579
1,424
4,150
4,896
15
-2,517
-4,430
FY12
FY13
FY14
FY15
FY16
FY17E FY18E FY19E
Source: MOSL, Company
24 May 2017
5

SRF Ltd
Exhibit 21:
Revenues (INR m)
Technical Textile
Chemicals
Packaging
Revenue growth %
Technical Textile
Chemicals
Packaging
PBIT (INR m)
Technical Textile
Chemicals
Packaging
PBIT margins (%)
Technical Textile
Chemicals
Packaging
FY13
37,829
21,283
10,348
6,199
-5.5
-0.4
-14.0
-6.1
4,760
1,234
3,465
60
12.6
5.8
33.5
1.0
FY14
40,181
21,802
9,561
8,817
6.2
2.4
-7.6
42.2
3,494
1,631
1,913
-50
8.7
7.5
20.0
-0.6
FY15
45,398
20,319
12,634
12,445
13.0
-6.8
32.1
41.1
5,576
1,957
2,983
636
12.3
9.6
23.6
5.1
FY16
46,001
17,429
15,524
13,048
1.3
-14.2
22.9
4.8
7,545
1,728
3,888
1,930
16.4
9.9
25.0
14.8
FY17
48,447
18,477
16,668
13,302
5.3
6.0
7.4
1.9
7,786
2,543
3,273
1,970
16.1
13.8
19.6
14.8
FY18E
56,607
20,635
19,498
16,474
16.8
11.7
17.0
23.8
8,338
2,559
3,802
1,977
14.7
12.4
19.5
12.0
FY19E
65,210
21,340
24,171
19,700
15.2
3.4
24.0
19.6
10,308
2,582
5,559
2,167
15.8
12.1
23.0
11.0
Source: Company, MOSL
24 May 2017
6

SRF Ltd
Financials and Valuations
Income Statement
Y/E March
Total Income from Operations
Change (%)
EBITDA
Margin (%)
Depreciation
EBIT
Int. and Finance Charges
Other Income
PBT bef. EO Exp.
EO Items
PBT after EO Exp.
Current Tax
Deferred Tax
Tax Rate (%)
Reported PAT
Adjusted PAT
Change (%)
Margin (%)
FY14
40,181
6.2
5,053
12.6
2,248
2,806
961
235
2,080
0
2,080
208
247
21.9
1,625
1,625
-35.8
4.0
FY15
45,398
13.0
7,175
15.8
2,450
4,724
1,376
646
3,994
0
3,994
314
652
24.2
3,028
3,028
86.4
6.7
FY16
45,927
1.2
9,728
21.2
2,750
6,979
1,305
278
5,952
-103
5,849
1,551
0
26.5
4,299
4,374
44.5
9.5
FY17
48,218
5.0
9,694
20.1
2,834
6,860
1,018
455
6,296
276
6,572
1,422
0
21.6
5,150
4,934
12.8
10.2
(INR Million)
FY18E
56,607
17.4
10,812
19.1
3,146
7,666
939
275
7,002
0
7,002
1,891
0
27.0
5,112
5,112
3.6
9.0
FY19E
65,272
15.3
13,054
20.0
3,361
9,694
801
289
9,181
0
9,181
2,663
0
29.0
6,519
6,519
27.5
10.0
Balance Sheet
Y/E March
Equity Share Capital
Total Reserves
Net Worth
Deferred Liabilities
Total Loans
Capital Employed
Gross Block
Less: Accum. Deprn.
Net Fixed Assets
Goodwill on Consolidation
Capital WIP
Total Investments
Curr. Assets, Loans&Adv.
Inventory
Account Receivables
Cash and Bank Balance
Loans and Advances
Curr. Liability & Prov.
Account Payables
Other Current Liabilities
Provisions
Net Current Assets
Deferred Tax assets
Appl. of Funds
FY14
584
20,082
20,667
3,250
21,753
45,670
61,072
25,657
35,415
93
1,121
366
17,693
7,464
6,915
825
2,489
9,516
8,265
908
343
8,177
498
45,670
FY15
584
22,379
22,963
4,094
20,244
47,301
66,773
27,585
39,188
35
1,041
943
17,624
7,635
6,107
1,073
2,810
12,238
6,350
5,606
283
5,386
708
47,301
FY16
584
27,045
27,630
3,820
21,297
52,747
71,410
30,334
41,076
49
1,174
1,649
20,291
6,711
5,145
3,399
5,036
12,789
7,364
5,113
312
7,502
1,297
52,747
FY17
584
31,242
31,827
5,069
19,774
56,670
77,169
33,169
44,000
49
2,586
1,959
20,990
8,381
6,569
876
5,164
15,143
8,388
6,396
359
5,847
2,229
56,670
(INR Million)
FY18E
584
35,269
35,854
5,069
17,774
58,696
84,169
36,315
47,854
49
0
1,959
23,930
9,597
7,134
1,003
6,197
17,324
9,355
6,396
1,573
6,606
2,229
58,696
FY19E
584
40,432
41,016
5,069
14,274
60,359
88,169
39,675
48,493
49
0
1,959
26,098
10,683
8,047
242
7,126
18,469
10,131
6,396
1,942
7,630
2,229
60,359
24 May 2017
7

SRF Ltd
Financials and Valuations
Ratios
Y/E March
Basic (INR)
EPS
Cash EPS
BV/Share
DPS
Payout (%)
Valuation (x)
P/E
Cash P/E
P/BV
EV/Sales
EV/EBITDA
Dividend Yield (%)
FCF per share
Return Ratios (%)
RoE
RoCE
RoIC
Working Capital Ratios
Asset Turnover (x)
Inventory (Days)
Debtor (Days)
Creditor (Days)
Working Cap. Turnover (Days)
Leverage Ratio (x)
Current Ratio
Interest Cover Ratio
Debt/Equity
FY14
28.3
66.3
353.6
10.0
41.3
56.0
23.9
4.5
2.8
22.2
0.6
-75.8
8.1
9.4
10.1
0.9
114
58
126
67
1.9
3
1.1
FY15
52.7
93.7
392.9
10.0
22.5
30.1
16.9
4.0
2.4
15.4
0.6
9.9
13.9
15.6
15.2
1.0
110
46
91
35
1.4
3
0.9
FY16
76.2
121.9
472.8
10.0
15.5
20.8
13.0
3.4
2.4
11.2
0.6
58.9
17.3
19.9
20.2
0.9
105
38
115
33
1.6
5
0.8
FY17
85.9
132.9
544.6
12.0
15.9
18.4
11.9
2.9
2.3
11.3
0.8
24.4
16.6
17.7
18.2
0.9
126
47
127
38
1.4
7
0.6
FY18E
89.0
141.3
613.5
16.3
21.2
17.8
11.2
2.6
1.9
10.0
1.0
71.0
15.1
19.2
18.9
1.0
119
43
116
36
1.4
8
0.5
FY19E
111.5
169.1
701.9
20.0
20.8
14.2
9.4
2.3
1.6
8.0
1.3
83.8
17.0
23.6
22.6
1.1
116
42
110
41
1.4
12
0.3
Cash Flow Statement
Y/E March
OP/(Loss) before Tax
Depreciation
Interest & Finance Charges
Direct Taxes Paid
(Inc)/Dec in WC
CF from Operations
Others
CF from Operating incl EO
(inc)/dec in FA
Free Cash Flow
(Pur)/Sale of Investments
Others
CF from Investments
Issue of Shares
Inc/(Dec) in Debt
Interest Paid
Dividend Paid
Others
CF from Fin. Activity
Inc/Dec of Cash
Opening Balance
Closing Balance
E: MOSL Estimates
FY14
2,080
2,248
908
-413
-1,199
3,623
-156
3,467
-7,897
-4,430
1,156
144
-6,597
0
3,911
-1,198
-668
0
2,045
-1,085
1,910
825
FY15
3,994
2,450
1,346
-850
-1,011
5,931
-507
5,423
-4,845
579
-632
482
-4,994
0
1,889
-1,392
-678
0
-181
248
825
1,073
FY16
5,952
2,750
1,305
-1,551
703
9,159
-947
8,212
-4,771
3,441
0
-707
-5,477
0
1,053
-1,305
-664
507
-409
2,326
1,073
3,399
FY17
6,296
2,834
1,018
-1,422
-2,151
6,576
2,018
8,594
-7,170
1,424
0
-310
-7,479
0
-1,523
-1,018
-821
0
-3,361
-2,247
3,399
1,152
FY18E
7,002
3,146
939
-1,891
-632
8,564
0
8,564
-4,414
4,150
0
0
-4,414
0
-2,000
-939
-1,085
0
-4,023
126
1,152
1,278
(INR Million)
FY19E
9,181
3,361
801
-2,663
-1,784
8,896
0
8,896
-4,000
4,896
0
0
-4,000
0
-3,500
-801
-1,356
0
-5,657
-761
1,278
517
24 May 2017
8

SRF Ltd
Corporate profile
Company description
SRF is a multi-business entity involved in Technical Textiles
(TTB; 45% of FY15 revenue), Chemicals (CB; 28%), and
Packaging (PB; 27%). In terms of PBIT, TTB contributed
35%, CB 53%, and PB 11%. In the past few years, SRF has
invested heavily (~INR18b) in Dahej for setting up a
chemicals complex, which should begin to contribute
meaningfully from FY15. The Chemicals business is likely to
drive overall growth and profitability, the Packaging
business is in the midst of an upturn and the Technical
Textiles business continues to generate enough cash flows
to support expansion of the Chemicals business.
Exhibit 2: Shareholding pattern (%)
Mar-17
Promoter
DII
FII
Others
52.4
10.8
18.1
18.8
Dec-16
52.4
10.8
18.6
18.2
Mar-16
52.4
12.0
16.2
19.4
Source: Capitaline
Exhibit 1: Sensex rebased
Source: MOSL/Bloomberg
Exhibit 3: Top holders
Holder Name
AMANSA HOLDINGS PRIVATE LIMITED
DSP BLACKROCK MIP FUND
SUNDARAM MUTUAL FUND A/C SUNDARAM
SELECT MIDCAP
STICHTING DEPOSITARY APG EMERGING
MARKETS EQUITY POOL
UTI-UNIT SCHEME FOR CHARITABLE AND
RELIGIOUS TRUSTS AND REGISTERED
SOCIETIE
Source: Capitaline
% Holding
6.5
4.0
1.9
1.8
1.5
Note: FII Includes depository receipts
Exhibit 4: Top management
Name
Arun Bharat Ram
Ashish Bharat Ram
Kartikeya Bharat Ram
Anoop K Joshi
Designation
Chairman
Managing Director
Deputy
Managing
Director
CFO
&
Company
Secretary
Exhibit 5: Directors
Name
L Lakshman
Tejpreet S Chopra
Vinayak Chatterjee
K Ravichandra
Name
Pramod Bhasin
Vellayan Subbiah
Meenakshi Gopinath
*Independent
Source: Capitaline
Exhibit 6: Auditors
Name
Deloitte Haskins & Sells
H Tara & Co
Sanjay Grover & Associates
Sanjay Gupta & Associates
Type
Statutory
Cost Auditor
Secretarial Audit
Cost Auditor
Source: Capitaline
Exhibit 7: MOSL forecast v/s consensus
EPS
(INR)
FY18
FY19
MOSL
forecast
89.0
111.5
Consensus
forecast
96.8
117.0
Variation (%)
-8.0
-4.7
Source: Bloomberg
24 May 2017
9

Disclosures
This document has been prepared by Motilal Oswal Securities Limited (hereinafter referred to as Most) to provide information about the company (ies) and/sector(s), if any, covered in the report and may be distributed by it
and/or its affiliated company(ies). This report is for personal information of the selected recipient/s and does not construe to be any investment, legal or taxation advice to you. This research report does not constitute an
offer, invitation or inducement to invest in securities or other investments and Motilal Oswal Securities Limited (hereinafter referred as MOSt) is not soliciting any action based upon it. This report is not for public distribution
and has been furnished to you solely for your general information and should not be reproduced or redistributed to any other person in any form. This report does not constitute a personal recommendation or take into
account the particular investment objectives, financial situations, or needs of individual clients. Before acting on any advice or recommendation in this material, investors should consider whether it is suitable for their
particular circumstances and, if necessary, seek professional advice. The price and value of the investments referred to in this material and the income from them may go down as well as up, and investors may realize losses
on any investments. Past performance is not a guide for future performance, future returns are not guaranteed and a loss of original capital may occur.
MOSt and its affiliates are a full-service, integrated investment banking, investment management, brokerage and financing group. We and our affiliates have investment banking and other business relationships with a some
companies covered by our Research Department. Our research professionals may provide input into our investment banking and other business selection processes. Investors should assume that MOSt and/or its affiliates are
seeking or will seek investment banking or other business from the company or companies that are the subject of this material and that the research professionals who were involved in preparing this material may educate
investors on investments in such business . The research professionals responsible for the preparation of this document may interact with trading desk personnel, sales personnel and other parties for the purpose of
gathering, applying and interpreting information. Our research professionals are paid on twin parameters of performance & profitability of MOSt.
MOSt generally prohibits its analysts, persons reporting to analysts, and members of their households from maintaining a financial interest in the securities or derivatives of any companies that the analysts cover.
Additionally, MOSt generally prohibits its analysts and persons reporting to analysts from serving as an officer, director, or advisory board member of any companies that the analysts cover. Our salespeople, traders, and
other professionals or affiliates may provide oral or written market commentary or trading strategies to our clients that reflect opinions that are contrary to the opinions expressed herein, and our proprietary trading and
investing businesses may make investment decisions that are inconsistent with the recommendations expressed herein. In reviewing these materials, you should be aware that any or all of the foregoing among other things,
may give rise to real or potential conflicts of interest. MOSt and its affiliated company(ies), their directors and employees and their relatives may; (a) from time to time, have a long or short position in, act as principal in, and
buy or sell the securities or derivatives thereof of companies mentioned herein. (b) be engaged in any other transaction involving such securities and earn brokerage or other compensation or act as a market maker in the
financial instruments of the company(ies) discussed herein or act as an advisor or lender/borrower to such company(ies) or may have any other potential conflict of interests with respect to any recommendation and other
related information and opinions.; however the same shall have no bearing whatsoever on the specific recommendations made by the analyst(s), as the recommendations made by the analyst(s) are completely independent
of the views of the affiliates of MOSt even though there might exist an inherent conflict of interest in some of the stocks mentioned in the research report
Reports based on technical and derivative analysis center on studying charts company's price movement, outstanding positions and trading volume, as opposed to focusing on a company's fundamentals and, as such, may not match with a report on a
company's fundamental analysis. In addition MOST has different business segments / Divisions with independent research separated by Chinese walls catering to different set of customers having various objectives, risk profiles, investment horizon,
etc, and therefore may at times have different contrary views on stocks sectors and markets.
Unauthorized disclosure, use, dissemination or copying (either whole or partial) of this information, is prohibited. The person accessing this information specifically agrees to exempt MOSt or any of its affiliates or employees
from, any and all responsibility/liability arising from such misuse and agrees not to hold MOSt or any of its affiliates or employees responsible for any such misuse and further agrees to hold MOSt or any of its affiliates or
employees free and harmless from all losses, costs, damages, expenses that may be suffered by the person accessing this information due to any errors and delays. The information contained herein is based on publicly
available data or other sources believed to be reliable. Any statements contained in this report attributed to a third party represent MOSt’s interpretation of the data, information and/or opinions provided by that third party
either publicly or through a subscription service, and such use and interpretation have not been reviewed by the third party. This Report is not intended to be a complete statement or summary of the securities, markets or
developments referred to in the document. While we would endeavor to update the information herein on reasonable basis, MOSt and/or its affiliates are under no obligation to update the information. Also there may be
regulatory, compliance, or other reasons that may prevent MOSt and/or its affiliates from doing so. MOSt or any of its affiliates or employees shall not be in any way responsible and liable for any loss or damage that may
arise to any person from any inadvertent error in the information contained in this report. MOSt or any of its affiliates or employees do not provide, at any time, any express or implied warranty of any kind, regarding any
matter pertaining to this report, including without limitation the implied warranties of merchantability, fitness for a particular purpose, and non-infringement. The recipients of this report should rely on their own
investigations.
This report is intended for distribution to institutional investors. Recipients who are not institutional investors should seek advice of their independent financial advisor prior to taking any investment decision based on this
report or for any necessary explanation of its contents.
Most and it’s associates may have managed or co-managed public offering of securities, may have received compensation for investment banking or merchant banking or brokerage services, may have received any
compensation for products or services other than investment banking or merchant banking or brokerage services from the subject company in the past 12 months.
Most and it’s associates have not received any compensation or other benefits from the subject company or third party in connection with the research report.
Subject Company may have been a client of Most or its associates during twelve months preceding the date of distribution of the research report
MOSt and/or its affiliates and/or employees may have interests/positions, financial or otherwise of over 1 % at the end of the month immediately preceding the date of publication of the research in the securities mentioned
in this report. To enhance transparency, MOSt has incorporated a Disclosure of Interest Statement in this document. This should, however, not be treated as endorsement of the views expressed in the report.
Motilal Oswal Securities Limited is registered as a Research Analyst under SEBI (Research Analyst) Regulations, 2014. SEBI Reg. No. INH000000412
Pending Regulatory inspections against Motilal Oswal Securities Limited:
SEBI pursuant to a complaint from client Shri C.R. Mohanraj alleging unauthorized trading, issued a letter dated 29th April 2014 to MOSL notifying appointment of an Adjudicating Officer as per SEBI regulations to hold inquiry
and adjudge violation of SEBI Regulations; MOSL replied to the Show Cause Notice whereby SEBI granted us an opportunity of Inspection of Documents. Since all the documents requested by us were not covered we have
requested to SEBI vide our letter dated June 23, 2015 to provide pending list of documents for inspection.
List of associate companies of Motilal Oswal Securities Limited -Click
here to access detailed report
Analyst Certification
The views expressed in this research report accurately reflect the personal views of the analyst(s) about the subject securities or issues, and no part of the compensation of the research analyst(s) was, is, or will be directly or
indirectly related to the specific recommendations and views expressed by research analyst(s) in this report. The research analysts, strategists, or research associates principally responsible for preparation of MOSt research
receive compensation based upon various factors, including quality of research, investor client feedback, stock picking, competitive factors and firm revenues
SRF Ltd
Disclosure of Interest Statement
Analyst ownership of the stock
No
Served as an officer, director or employee -
No
A graph of daily closing prices of securities is available at www.nseindia.com and http://economictimes.indiatimes.com/markets/stocks/stock-quotes
Regional Disclosures (outside India)
This report is not directed or intended for distribution to or use by any person or entity resident in a state, country or any jurisdiction, where such distribution, publication, availability or use would be contrary to law,
regulation or which would subject MOSt & its group companies to registration or licensing requirements within such jurisdictions.
For Hong Kong:
This report is distributed in Hong Kong by Motilal Oswal capital Markets (Hong Kong) Private Limited, a licensed corporation (CE AYY-301) licensed and regulated by the Hong Kong Securities and Futures
Commission (SFC) pursuant to the Securities and Futures Ordinance (Chapter 571 of the Laws of Hong Kong) “SFO”. As per SEBI (Research Analyst Regulations) 2014 Motilal Oswal Securities (SEBI Reg No. INH000000412) has
an agreement with Motilal Oswal capital Markets (Hong Kong) Private Limited for distribution of research report in Kong Kong. This report is intended for distribution only to “Professional Investors” as defined in Part I of
Schedule 1 to SFO. Any investment or investment activity to which this document relates is only available to professional investor and will be engaged only with professional investors.” Nothing here is an offer or solicitation
of these securities, products and services in any jurisdiction where their offer or sale is not qualified or exempt from registration. The Indian Analyst(s) who compile this report is/are not located in Hong Kong & are not
conducting Research Analysis in Hong Kong.
For U.S.
Motilal Oswal Securities Limited (MOSL) is not a registered broker - dealer under the U.S. Securities Exchange Act of 1934, as amended (the"1934 act") and under applicable state laws in the United States. In addition MOSL is
not a registered investment adviser under the U.S. Investment Advisers Act of 1940, as amended (the "Advisers Act" and together with the 1934 Act, the "Acts), and under applicable state laws in the United States.
Accordingly, in the absence of specific exemption under the Acts, any brokerage and investment services provided by MOSL, including the products and services described herein are not available to or intended for U.S.
persons.
This report is intended for distribution only to "Major Institutional Investors" as defined by Rule 15a-6(b)(4) of the Exchange Act and interpretations thereof by SEC (henceforth referred to as "major institutional investors").
This document must not be acted on or relied on by persons who are not major institutional investors. Any investment or investment activity to which this document relates is only available to major institutional investors
and will be engaged in only with major institutional investors. In reliance on the exemption from registration provided by Rule 15a-6 of the U.S. Securities Exchange Act of 1934, as amended (the "Exchange Act") and
interpretations thereof by the U.S. Securities and Exchange Commission ("SEC") in order to conduct business with Institutional Investors based in the U.S., MOSL has entered into a chaperoning agreement with a U.S.
registered broker-dealer, Motilal Oswal Securities International Private Limited. ("MOSIPL"). Any business interaction pursuant to this report will have to be executed within the provisions of this chaperoning agreement.
The Research Analysts contributing to the report may not be registered /qualified as research analyst with FINRA. Such research analyst may not be associated persons of the U.S. registered broker-dealer, MOSIPL, and
therefore, may not be subject to NASD rule 2711 and NYSE Rule 472 restrictions on communication with a subject company, public appearances and trading securities held by a research analyst account.
For Singapore
Motilal Oswal Capital Markets Singapore Pte Limited is acting as an exempt financial advisor under section 23(1)(f) of the Financial Advisers Act(FAA) read with regulation 17(1)(d) of the Financial Advisors Regulations and is a
subsidiary of Motilal Oswal Securities Limited in India. This research is distributed in Singapore by Motilal Oswal Capital Markets Singapore Pte Limited and it is only directed in Singapore to accredited investors, as defined in
the Financial Advisers Regulations and the Securities and Futures Act (Chapter 289), as amended from time to time.
In respect of any matter arising from or in connection with the research you could contact the following representatives of Motilal Oswal Capital Markets Singapore Pte Limited:
Varun Kumar
Varun.kumar@motilaloswal.com
Contact : (+65) 68189232
Office Address:21 (Suite 31),16 Collyer Quay,Singapore 04931
SRF
24 May 2017
Motilal Oswal Tower, Level 9, Sayani Road, Prabhadevi, Mumbai 400 025
Phone: +91 22 3982 5500 E-mail: reports@motilaloswal.com
Motilal Oswal Securities Ltd
10