24 May 2017
4QFY17 Results Update | Sector: Healthcare
Lupin
Buy
BSE SENSEX
30,302
Bloomberg
Equity Shares (m)
M.Cap.(INRb)/(USDb)
52-Week Range (INR)
1, 6, 12 Rel. Per (%)
Avg Val, INRm
Free float (%)
S&P CNX
9,361
LPC IN
Weak 4Q; Guides for muted FY18
448
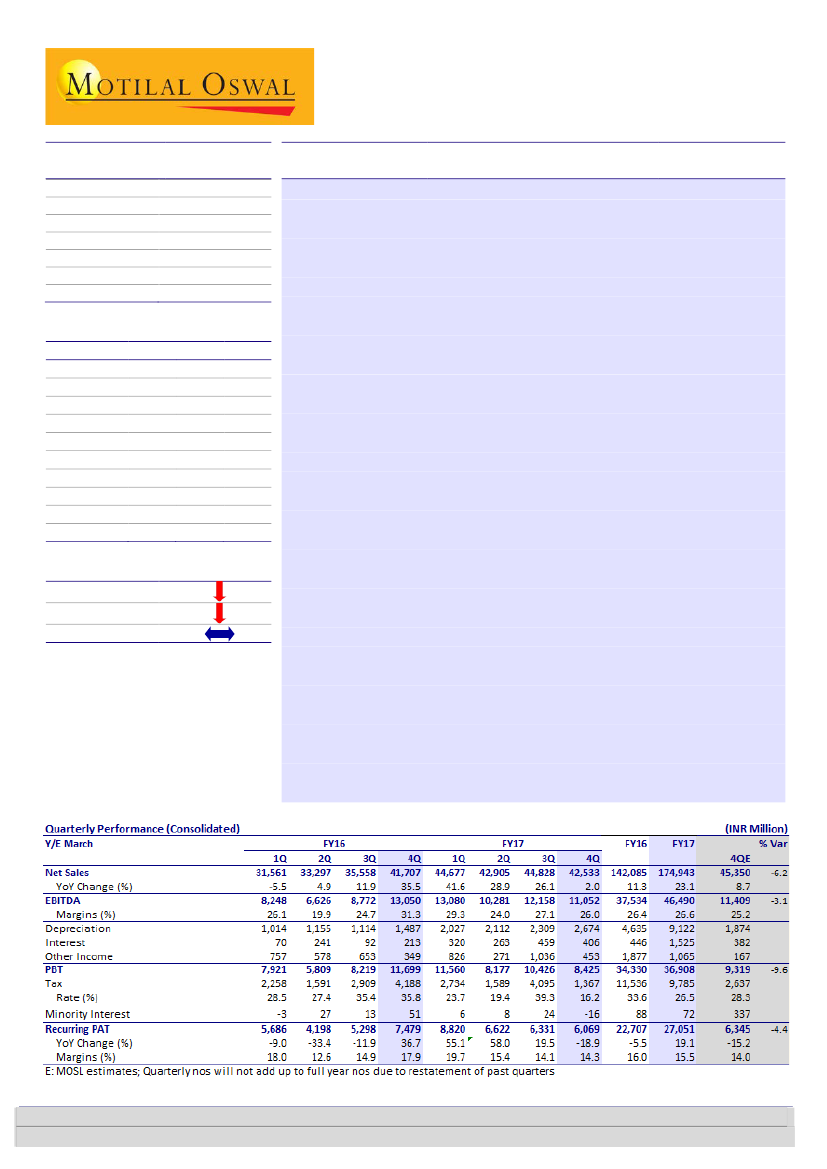
Lupin’s (LPC) 4QFY17 revenue grew 2% YoY to INR42.5b (~6% below est.).
549.6 / 8.2
The miss in revenue is primarily attributed to weak US sales (-13% YoY/QoQ).
1750 / 1168
Despite this, gross margin expanded ~120bp QoQ to 72.1%. Excluding the
-16/-33/-36
one-time impact of INR3.3b (related to provisioning against patent litigation
1699
and forex loss), EBITDA declined 15.3% YoY to INR11.1b (3% below est.), with
53.3
CMP: INR1,228
TP: INR1,475(+20%)
Financials & Valuations (INR b)
Y/E Mar
2017 2018E
Net Sales
174.9
189.6
EBITDA
46.5
47.0
PAT
26.7
27.1
EPS (INR)
59.2
60.2
Gr. (%)
17.5
1.6
BV/Sh (INR)
293.5
343.1
RoE (%)
22.0
18.9
RoCE (%)
14.7
13.1
P/E (x)
20.7
20.4
P/BV (x)
4.2
3.6
2019E
214.9
55.5
33.2
73.7
22.5
406.2
19.7
14.2
16.7
3.0
Estimate change
TP change
Rating change
the margin at 26% v/s our estimate of 25.2%. R&D expense stood at 16% of
sales, higher than the normalized rate of 12-13%.
FY18 growth expected to be muted:
LPC delivered revenue/EBITDA growth
23%/24% in FY17, led by Fortamet/Glumetza ramp-up. However, revenue
growth in FY18 is expected to be ~8% YoY, with flat EBITDA. We expect US
business to decline ~5% YoY in FY18 due to new competition in the diabetes
portfolio, further channel consolidation (impact of which will be visible in
2H) and likely deferral of key approvals for products like sevelamer/co-
sevelamer to 2HFY19. EBITDA margin is expected to shrink to 24.8% in FY18
(v/s management guidance of 26-28%) as it will be difficult to compensate
for the loss of the high-margin US business.
Key earnings call takeaways:
1) 30+ ANDA approvals expected in FY18. 2)
Advair filing to happen in FY19. 3) Tamiflu approval expected in six months.
4) Medicaid accounts for 6-7% of sales in the US. 5) Branded biz sales at
USD78m in FY17. 6) R&D expense as % of sales to be in line with FY17. 7) 14
FTF launches expected over next five years. 8) Renexa and minocycline ER
FTF launch expected in FY19E. 9) ProAir TAD in Sep-17; Indore observations
procedural in nature.
Near-term earnings under pressure; stock already factors in the impact:
Competition in Glumetza and Fortamet is expected to lead to a decline in US
sales in FY18. Due to this, we expect EBITDA margin to contract in FY18. We
believe the recent stock price decline already factors in this impact. Maintain
Buy
with a TP of INR1,475 @ 20x FY19E PER (v/s INR1,850 @ 22x 1HFY19E
PER). We cut FY18E/19E EPS by ~16% as we build in the impact of
competition in key products in the US. Cut in target multiple is attributed to
the weak industry outlook.
Kumar Saurabh
(Kumar.Saurabh@MotilalOswal.com); +91 22 6129 1519
Investors are advised to refer through important disclosures made at the last page of the Research Report.
Motilal Oswal research is available on www.motilaloswal.com/Institutional-Equities, Bloomberg, Thomson Reuters, Factset and S&P Capital.

Lupin
Forex loss and provisions in Australian subsidiary impacted EBITDA
Lupin's 4QFY17 net revenues grew 2% YoY to INR42.5b (~6% above estimate).
Although geographies other than US posted robust growth during the quarter, Japan
grew 34% to INR4.6b, Europe +26%, South Africa +26%, India +15.4% and RoW
+22.7%, decline in US business by 13% as against expectation of -2% led to slower
growth in revenues. Lupin launched 9 products during the quarter.
EBITDA during the quarter was impacted by INR1558m for provision for liability for
patent litigation towards its Isabelle generic in its Australian subsidiary and
INR1680m towards forex loss as against gain of INR267m in 4QFY16 which led to
decrease in EBITDA by 44% to INR7.8b. Adjusting for the one-off’s EBITDA declined
15.3% to INR11.1b (3% below est.). Also R&D expenses were up ~360bpsYoY to
16.1% of sales as against normal run rate of 12-13% of sales.
US delivered muted growth; India and EM shines in 4Q
US sales stood at USD276m (v/s USD316m in 3Q). Sequential decline in US sales was
driven by loss in market share for Glumetza (due to AG launch) and Fortamet
partially offset by channel filling of Minastrin FTF (launched in Mar-17). We expect
incremental pressure on Glumetza/ Fortamet sales in 1H FY18 due to increase in
competition (Teva launched Glumetza in May-17; SUNP launch expected next) and
shift in business to Glycophage. Minastrin FTF launch (expected in Mar-17). India
business delivered growth of ~14% YoY. APAC, LATAM & EMEA business grew at
35%, 37% & 23% YoY, respectively on the back of stable currency and strong core
business growth.
Exhibit 1: Revenues posted muted growth of 2%
Sales (INR b)
36
18 21 20
18
5
0
(6)
2
7
2
YoY Growth (%)
41
34
32 31
Exhibit 2: EBITDA declined YoY due to higher R&D expense
EBITDA (INR b)
33
26
26 28 26 26
24 25
EBITDA margin (%)
25
31 29
24
27 26
20
26 30 31 33 31 31 31 31 32 34 41 43 42 44 42
6
7
8
11
8
9
8
8
7
9
13 13 10 12 11
Source: Company, MOSL
Exhibit 3: R&D expense to be in the range of 13-14%
R&D expense (INR b)
% of sales
14
12
12 11 13 12
16
Exhibit 4: Gross margins increased sequentially
Gross Profit (%)
68
62
68
67
69 68
65
Gross Margin (%)
73
71 70 70 72
67
8
9
8
7
2
9
8
10 10
66 66
2
3
2
3
3
3
3
4
4
5
5
6
6
7
18 19 21 22 20 21 21 21 21 22 30 31 30 31 30
Source: Company, MOSL
24 May 2017
2

Lupin
US Generic business - (45% of sales)
US business declined 13.2%YoY to INR19b, mainly due to introduction of
competition in generic version of Glumetza and Fortamet.
The Company launched 9 products in the US in 4QFY17. Cumulatively LPC is
marketing 139 products in US market, as of end 4QFY17. LPC is the market
leader in 45 products and amongst top 3 in 83 of its marketed products. The
company currently has 154 ANDA’s pending approval in the US with market size
of USD76b, which includes 28 FTF targeting marketing size of USD12.4b (11
exclusive opportunities). Going forward, LPC expects to launch 30 generic
products in FY18E
Exhibit 5: US revenues: Generic business continues to drive
growth
Exhibit 6: FY17 R&D spend split
Oral Solids / Liquids
15
2
5
3
3
5
8
Inhalation
Controlled Substances
Dermatology / Topicals
59
Ophthalmics
Injectables
Depot Injectables
Biosimilars
Source: Company, MOSL
7
11
1
5 3
9
9
45
10
Oral solids
Inhalation
Complex Generics
Injectable
Derma
API Development
IP
Biosimilars
NDDD
Source: Company, MOSL
India business – (~21% of sales)
In 4Q, domestic business exhibited a robust performance and grew 15%YoY to
INR8.8b despite demonetisation. Company moved up to 6
th
rank in the IPM
Chronic and semi-chronic have 80% of the products and balance in Acute
Japan (~11% of sales)
Japanese business increased 34%YoY to JPY7.9 in constant currency. It
strengthened its CNS positioning with acquisition of 21 products from Shionogi
in 3Q FY17 and In-licensing agreement to market Quetiapine Fumarate ER
tablets. Its Tottori site commissioned during the year.
Exhibit 8: Japan sales grew 5.3% YoY
Japan Sales (INR b)
17 17
-12
10 10
9
3
-6
2
12
-8 -9 -5 -7
YoY Growth (%)
31 35
9
17
16
34
Exhibit 7: Domestic growth despite demonetisation
India Sales (INR b)
29
9
14
2
20
14 15 16
11
17 15
7
15
12 14
YoY Growth (%)
7
7
6
8
8
7
7
9
9
9
8
9
3
4
3
3
3
3
3
3
3
4
3
4
4
4
5
Source: Company, MOSL
24 May 2017
3

Lupin
Highlights from Analyst meet
US business saw 13% revenue decline mainly due to competition in Glumetza
and Fortamet, base business in which led to double digit price erosion. Base
business in US also saw single digit price erosion.
Gavis revenues are one year behind in achieving its revenue target of USD250m.
Consolidation of buyers in the US has put high pressure on price which is likely
to continue going forward.
Lupin Somerset saw a strong operating year with 2 FDA inspection and 14 FDA
approvals. With high number of launches from Somerset, it will try to off-set
pricing pressure.
Management has guided for muted growth in FY18E due to pricing pressure.
With company having huge pipeline of products to be launched FY19E onwards,
it expects growth to bounce back to double digit in FY19E and targeted revenues
of USD3.5b FY20E onwards.
With high product launches and ANDA filings, company has guided that it will
maintain its current level of 13.5% of sales in R&D spend. It will also spend more
in clinical trials, biosimilars and Specialty segment.
In FY18 Lupin will get product approvals for Lanthanum, Tamiflu. Albuterol
target action date in September 2017.
In FY19 Lupin is targeting first filing for Microsieve emulsification technology
(Complex Injectables). It will also file for Etanercept in Europe, approvals in
Renaxa, Minocycline ER, Levothyroxine and Moviprep will come in FY19.
Sevelamer/Co-sevelamer approval is expected in late FY19 (CRL needs to be
answered).
Going forward Japan may see pricing pressure as government has proposed
annual price cut from previous biennial system (impact expected in FY19E). Also
government wants to limit generic competition in Japan and has set limit to 5
competitors. Lupin being the 6st largest company in Japan sees a chance to be in
the top 5 competitors.
Lupin and Celon’s collaboration to develop generic Advair (Inhalation) will get
into clinical trial and company will file for ANDA in FY19. Advair has a USD8b
market size and it is expected to contribute to revenues from FY20E onwards.
During the quarter Lab Grin, its Mexican company saw some distribution issues,
but has overcome that. Lupin expects Brazil business to do well in next two
years.
Company plans to foray into specialty segment with focus on Women’s health,
CNS and Paediatrics. For growth in specialty segment company may look at
inorganic route via partnership and acquisition of Phase II and Phase III assets.
Company’s Indore inspection are procedural in nature.
75% of API’s is consumed internally. Company is foraying into Oncology API
segment.
Company expects 14 FTF’s in next 5 years.
24 May 2017
4

Lupin
Valuation and view
We expect US business to decline ~5% YoY in FY18 due to new competition in the
diabetes portfolio, further channel consolidation and likely deferral of key approvals
for products to 2HFY19. EBITDA margin is expected to shrink to 24.8% in FY18 (v/s
management guidance of 26-28%) as it will be difficult to compensate for the loss of
the high-margin US business.
Competition in Glumetza and Fortamet is expected to lead to a decline in US sales in
FY18. We believe the recent stock price decline already factors in this impact.
Maintain
Buy
with a TP of INR1,475 @ 20x FY19E PER (v/s INR1,850 @ 22x 1HFY19E
PER). We cut FY18E/19E EPS by ~16% as we build in the impact of competition in key
products in the US. Cut in target multiple is attributed to the weak industry outlook.
Exhibit 9: P/E valuation band (10 years)
49.0
37.0
25.0
13.0
1.0
18.3
7.0
19.2
15.7
-80
PE (x)
Median(x)
Peak(x)
Min(x)
Avg(x)
39.8
Exhibit 10: Higher premium relative to Sensex
160
80
10.2
0
-14.4
Lupin PE Relative to Sensex PE (%)
LPA (%)
Source: Company, MOSL
24 May 2017
5

Lupin
Operating metrics
Exhibit 11: Key operating metrics
FY14
3Q
Revenue Mix (%)
US
India
Japan
Europe
ROW
APIs
Revenue Growth (%)
US
India
Japan
Europe
ROW
APIs
As % of sales
Raw material
Staff cost
R&D cost
Other expenses
Tax Rate
Margins (%)
Gross Margins
EBITDA Margins
EBIT Margins
PAT margins
45.5
21.8
12.5
2.2
8.1
10.0
21.0
30.6
13.9
1.7
10.5
23.2
26.3
75.4
37.6
12.7
9.1
16.0
34.4
62.4
25.6
24.9
16.0
4Q
48.2
18.9
10.5
2.6
10.2
9.5
20.3
28.2
1.8
16.9
20.5
30.0
10.0
73.5
32.1
12.8
8.0
20.6
29.2
67.9
28.1
26.5
18.1
1Q
48.9
23.2
10.4
2.1
6.5
8.9
35.7
60.3
29.2
16.8
(29.3)
8.8
20.4
67.8
33.7
12.5
7.4
14.1
39.0
66.3
33.4
31.5
19.0
FY15
2Q
40.8
25.6
11.1
2.8
9.4
10.2
18.4
22.9
20.4
11.8
18.2
11.7
11.2
75.1
34.3
14.1
9.1
17.6
23.1
65.7
26.2
24.0
20.2
3Q
44.7
23.7
10.9
2.6
9.5
8.8
5.4
3.5
14.4
(8.0)
21.8
24.0
(7.2)
73.0
32.5
13.2
8.3
18.9
28.0
67.5
27.8
27.2
19.1
4Q
45.1
21.7
9.6
2.9
10.5
10.1
0.1
(6.3)
15.2
(8.5)
12.1
2.8
5.5
74.9
31.3
15.8
10.1
17.7
19.5
68.7
25.6
22.9
17.9
1Q
38.7
28.8
10.5
2.8
8.6
10.6
(6.4)
(25.8)
16.2
(5.4)
24.1
23.5
11.4
75.7
31.9
16.1
10.2
17.4
28.5
68.1
26.1
25.9
18.5
FY16
2Q
36.1
27.8
10.1
3.8
11.7
10.4
2.4
(9.3)
11.2
(6.5)
39.3
26.4
4.6
83.5
35.2
16.7
12.1
19.5
27.4
64.8
19.9
18.9
13.1
3Q
41.8
25.9
11.1
3.0
9.8
8.2
6.8
0.0
17.1
9.3
25.5
10.9
0.1
79.8
33.4
15.7
11.7
18.9
35.4
66.6
24.7
24.8
15.8
4Q
53.5
18.6
8.4
3.1
9.5
6.9
34.0
58.7
14.7
17.0
40.7
21.1
(7.7)
70.2
27.0
14.2
12.5
16.5
35.8
73.0
31.3
29.2
18.3
1Q
50.4
21.9
9.7
2.9
8.2
6.8
41.2
83.8
7.3
31.0
49.5
34.6
(8.9)
72.8
29.3
16.3
11.5
15.7
23.7
70.7
29.3
27.4
20.3
FY17
2Q
47.4
23.6
10.4
2.6
9.0
6.9
31.9
73.1
12.1
35.1
(8.6)
1.4
(12.3)
77.5
29.5
16.9
13.6
17.5
19.4
70.5
24.0
20.0
15.7
3Q
49.4
22.5
9.9
3.2
9.0
6.1
30.5
54.9
13.8
16.2
39.3
19.3
(2.8)
74.2
29.5
16.6
12.9
15.1
39.3
70.5
27.1
24.7
14.4
4Q
45.7
21.1
11.1
3.8
11.6
6.8
1.2
(13.1)
15.4
34.0
26.1
23.7
(0.8)
75.6
28.5
17.0
16.1
14.0
26.4
71.5
26.0
21.2
9.1
Source: Company; MOSL
24 May 2017
6

Lupin
Story in charts
Exhibit 12: Revenue mix in 4QFY17
7
12
11
45
US
Europe
India
Japan
21
4
RoW
APIs
5
49
FY11
9
60
FY12
9
85
FY13
9
100
FY14
11
114
FY15
12
Exhibit 13: Healthy revenue growth on expanded base
Formulations (INR b)
API (INR b)
12
11
13
125
FY16
160
173
197
FY17 FY18E FY19E
Exhibit 14: R&D expense to be in the range of 13-14%
R&D Expense
% of sales
Exhibit 15: Margins to remain under pressure due to pricing
pressure
EBITDA (INR 28.3
b)
26.6
17.3
20.3
55
EBITDA margins (%)
26.6
26.4
24.8
25.8
7.4
5.2
FY12
7.4
7.1
FY13
8.2
9.3
FY14
8.6
11.0
FY15
11.3
13.2
13.2
13.2
16.0
FY16
23.1
FY17
25.0
28.4
14
FY12
23
FY13
30
FY14
36
38
46
47
FY18E FY19E
FY15
FY16
FY17
FY18E FY19E
Exhibit 16: Expect EPS CAGR of 12% over FY17-19E
EPS (INR/ share)
Exhibit 17: Lower tax outflow to support PAT margins
PBT margin (%)
25
17
15
17
20
19
27
PAT margin (%)
24
21
21
20
12
14
16
16
15
14
15
19
18
29
39
53
50
59
60
74
FY11 FY12 FY13 FY14 FY15 FY16 FY17 FY18E FY19E
Exhibit 18: Rich ANDA pipeline
ANDA filed
ANDA pending
343
210
163
93
99
154
368
127
148
100
86
173
109
176
98
192
FY10
FY11
FY12
FY13
FY14
FY15
FY16
FY17
Source: Company, MOSL
24 May 2017
7

Lupin
Financials and Valuations
Income Statement
Y/E March
Net Sales
Change (%)
2012
70,829
21.7
14,446
20.4
2,275
12,171
355
143
11,960
0
11,960
3,086
25.8
196
7,917
-8.4
11.2
2013
96,413
36.1
22,700
23.5
3,322
19,378
410
279
19,246
0
19,246
5,842
30.4
263
13,142
66.0
13.6
2014
112,866
17.1
30,028
26.6
2,610
27,418
267
165
27,317
-1,000
28,317
9,622
34.0
331
17,364
32.1
15.4
2015
127,700
13.1
36,196
28.3
4,347
31,849
98
2,398
34,148
0
34,148
9,704
28.4
412
24,032
38.4
18.8
2016
142,085
11.3
37,534
26.4
4,635
32,899
446
1,877
34,330
0
34,330
11,536
33.6
88
22,707
-5.5
16.0
2017
174,943
23.1
46,490
26.6
9,122
37,368
1,525
1,065
36,908
0
36,908
9,785
26.5
72
26,686
17.5
15.3
2018E
189,554
8.4
47,009
24.8
10,336
36,674
1,182
1,500
36,992
0
36,992
9,803
26.5
85
27,104
1.6
14.3
(INR Million)
2019E
214,940
13.4
55,455
25.8
10,905
44,550
1,068
1,800
45,282
0
45,282
12,000
26.5
85
33,197
22.5
15.4
EBITDA
Margin (%)
Depreciation
EBIT
Int. and Finance Charges
Other Income - Rec.
PBT before EO item
EO Expense/(Income)
PBT after EO item
Tax
Tax Rate (%)
Less: Minority Interest
PAT Adj for EO items
Change (%)
Margin (%)
Consolidated Balance Sheet
Y/E March
Equity Share Capital
Total Reserves
Net Worth
Minority Interest
Deferred liabilities
Secured Loan
Unsecured Laon
Total Loans
Capital Employed
Gross Block
Less: Accum. Deprn.
Net Fixed Assets
Capital WIP
Investments
Goodwill & Intangibles
Curr. Assets
Inventory
Account Receivables
Cash and Bank Balance
Others
Curr. Liability & Prov.
Account Payables
Provisions
Net Current Assets
Appl. of Funds
2012
893
39,236
40,129
723
1,442
5,087
10,470
15,557
57,852
36,274
14,422
21,852
4,437
28
5,644
47,393
17,327
17,800
4,025
8,241
21,503
17,565
3,939
25,889
57,851
2013
895
51,147
52,042
595
1,632
2,972
7,268
10,240
64,509
41,138
16,840
24,298
3,107
21
5,704
55,305
19,489
21,870
4,349
9,597
23,926
19,241
4,684
31,379
64,509
2014
897
68,419
69,316
669
1,779
1,968
4,024
5,992
77,756
45,638
19,283
26,355
3,041
1,785
7,202
62,970
21,295
24,641
7,975
9,060
23,597
18,818
4,779
39,374
77,756
2015
899
87,842
88,741
241
1,182
1,018
3,692
4,710
94,874
45,445
19,174
26,271
5,760
16,584
17,411
64,510
25,036
26,566
4,814
8,095
35,662
28,299
7,363
28,848
94,874
2016
901
108,943
109,844
321
1,239
53,739
17,454
71,193
182,596
55,887
23,262
32,625
9,812
75
73,586
107,473
31,787
45,498
8,379
21,808
40,975
32,318
8,658
66,498
182,596
2017
901
131,331
132,233
393
142
53,739
17,454
71,193
203,960
99,945
33,535
66,409
5,156
2,055
46,832
123,493
29,258
45,793
35,182
13,259
36,992
27,508
9,484
86,501
206,954
2018E
901
153,691
154,592
478
142
53,739
17,454
71,193
226,404
111,968
40,150
71,817
2,828
2,055
46,832
150,278
34,930
49,618
51,660
14,070
42,346
32,840
9,505
107,933
231,465
(INR Million)
2019E
901
182,143
183,045
563
142
53,739
17,454
71,193
254,942
122,827
47,308
75,518
1,664
2,055
46,832
181,701
38,351
56,262
72,126
14,962
45,810
36,056
9,754
135,891
261,960
24 May 2017
8

Lupin
Financials and Valuations
Ratios
Y/E March
EPS (Fully Diluted)
Cash EPS (Fully Diluted)
BV/Share
DPS
Payout (%)
Valuation (x)
P/E (Fully Diluted)
Cash P/E (Fully Diluted)
P/BV
EV/Sales
EV/EBITDA
Return Ratios (%)
RoE
RoCE
RoIC
Leverage Ratio
Current Ratio
Interest Cover Ratio
Debt/Equity (x)
2012
17.7
22.8
89.9
3.4
20.5
69.3
53.8
13.7
7.9
38.8
21.7
18.3
20.9
2.2
34.3
0.4
2013
29.4
36.8
116.3
4.0
15.9
41.8
33.4
10.6
5.8
24.5
28.5
23.2
25.4
2.3
47.2
0.2
2014
38.7
44.5
154.6
6.0
16.0
31.7
27.6
7.9
4.9
18.2
28.6
26.5
29.7
2.7
102.9
0.1
2015
53.5
63.1
197.4
7.5
16.9
23.0
19.5
6.2
4.3
15.2
30.4
29.1
34.4
1.8
324.7
0.1
2016
50.4
60.7
243.8
7.5
17.9
24.4
20.2
5.0
4.3
16.3
22.9
16.8
18.8
2.6
73.7
0.7
2017
59.2
79.5
293.5
9.0
17.5
20.7
15.5
4.2
3.3
12.6
22.0
14.7
16.9
3.3
24.5
0.5
2018E
60.2
83.1
343.1
9.0
17.5
20.4
14.8
3.6
3.0
12.1
18.9
13.1
16.3
3.5
31.0
0.5
2019E
73.7
97.9
406.2
9.0
14.3
16.7
12.5
3.0
2.6
9.9
19.7
14.2
18.8
4.0
41.7
0.4
Cash Flow Statement
Y/E March
Oper. Profit before Tax
Interest/Dividends Recd.
Direct Taxes Paid
(Inc)/Dec in WC
CF from Op. incl EO Exp.
(inc)/dec in FA
Free Cash Flow
(Pur)/Sale of Investments
CF from Investments
Change in Net Worth
Inc/(Dec) in Debt
Interest Paid
Dividend Paid
CF from Fin. Activity
Inc/Dec of Cash
Add: Beginning Balance
Closing Balance
2012
14,446
143
-3,055
-5,370
6,164
-8,736
-2,572
4
-8,733
430
4,094
-355
-1,777
2,392
-177
4,202
4,025
2013
22,700
279
-5,652
-5,166
12,160
-4,497
7,663
7
-4,490
475
-5,317
-410
-2,095
-7,348
323
4,025
4,348
2014
30,028
165
-9,475
-4,368
17,349
-6,098
10,251
-1,764
-7,862
1,593
-4,248
-267
-2,939
-5,861
3,626
4,349
7,975
2015
36,196
2,398
-10,300
7,364
35,657
-17,191
18,466
-14,799
-31,991
-1,389
-1,282
-98
-4,058
-6,828
-3,161
7,975
4,814
2016
37,534
1,877
-11,479
-34,084
-6,152
-71,217
-77,369
16,509
-54,708
2,459
66,483
-446
-4,071
64,425
3,565
4,814
8,379
2017
46,490
1,065
-10,882
6,800
43,473
-11,496
31,977
-1,980
-13,476
82
0
-1,525
-4,745
-6,187
23,809
8,379
32,188
(INR Million)
2018E
47,009
1,500
-9,803
-4,953
33,753
-13,416
20,338
0
-13,416
0
0
-1,182
-4,745
-5,926
14,411
35,182
49,594
2019E
55,455
1,800
-12,000
-7,493
37,762
-13,442
24,320
0
-13,442
0
0
-1,068
-4,745
-5,813
18,508
51,660
70,168
24 May 2017
9

Lupin
Corporate profile
Lupin is amongst the larger pharma companies that
is actively targeting the regulated generics markets.
Historically very strong in the anti-TB segment, it
has over the years built up expertise in
fermentation-based products and segments like
cephalosporins, prils and statins. Lupin is now a fully
integrated company, with manufacturing
capabilities in APIs and formulations and a direct
marketing presence in the target markets.
Source: MOSL/Bloomberg
Company description
Exhibit 1: Sensex rebased
Exhibit 2: Shareholding pattern (%)
Mar-17
Promoter
DII
FII
Others
46.7
9.4
31.9
12.1
Dec-16
46.7
8.2
33.3
11.8
Mar-16
46.5
7.1
35.1
11.2
Source: Capitaline
Exhibit 3: Top holders
Holder Name
First State Investments ICVC
Rakesh Jhunjhunwala
Government of Singapore
ICICI Prudential
Abu Dhabi Investment Authority
% Holding
2.4
1.7
1.7
1.1
1.1
Source: Capitaline
Note: FII Includes depository receipts
Exhibit 4: Top management
Name
D B Gupta
Kamal K Sharma
Nilesh Gupta
Ramesh Swaminathan
M D Gupta
R V Satam
Vinita Gupta
Designation
Chairman
Vice Chairman
Managing Director
Director & CFO
Executive Director
Company Secretary
CEO & Director
Exhibit 5: Directors
Name
Dileep C Choksi
K U Mada
Richard Zahn
Name
Jean-Luc Belingard
R A Shah
Vijay Kelkar
Source: Capitaline
*Independent
Exhibit 6: Auditors
Name
Deloitte Haskins & Sells LLP
Ernst & Young LLP
Neena Bhatia
S D Shenoy
Internal
Secretarial Audit
Cost Auditor
Source: Capitaline
Type
Statutory
Exhibit 7: MOSL forecast v/s consensus
EPS
(INR)
FY18
FY19
MOSL
forecast
60.2
73.7
Consensus
forecast
71.9
83.1
Variation (%)
-16.3
-11.4
Source: Bloomberg
24 May 2017
10

Lupin
NOTES
24 May 2017
11

Disclosures
This document has been prepared by Motilal Oswal Securities Limited (hereinafter referred to as Most) to provide information about the company (ies) and/sector(s), if any, covered in the report and may be distributed by it
and/or its affiliated company(ies). This report is for personal information of the selected recipient/s and does not construe to be any investment, legal or taxation advice to you. This research report does not constitute an
offer, invitation or inducement to invest in securities or other investments and Motilal Oswal Securities Limited (hereinafter referred as MOSt) is not soliciting any action based upon it. This report is not for public distribution
and has been furnished to you solely for your general information and should not be reproduced or redistributed to any other person in any form. This report does not constitute a personal recommendation or take into
account the particular investment objectives, financial situations, or needs of individual clients. Before acting on any advice or recommendation in this material, investors should consider whether it is suitable for their
particular circumstances and, if necessary, seek professional advice. The price and value of the investments referred to in this material and the income from them may go down as well as up, and investors may realize losses
on any investments. Past performance is not a guide for future performance, future returns are not guaranteed and a loss of original capital may occur.
MOSt and its affiliates are a full-service, integrated investment banking, investment management, brokerage and financing group. We and our affiliates have investment banking and other business relationships with a some
companies covered by our Research Department. Our research professionals may provide input into our investment banking and other business selection processes. Investors should assume that MOSt and/or its affiliates are
seeking or will seek investment banking or other business from the company or companies that are the subject of this material and that the research professionals who were involved in preparing this material may educate
investors on investments in such business . The research professionals responsible for the preparation of this document may interact with trading desk personnel, sales personnel and other parties for the purpose of
gathering, applying and interpreting information. Our research professionals are paid on twin parameters of performance & profitability of MOSt.
MOSt generally prohibits its analysts, persons reporting to analysts, and members of their households from maintaining a financial interest in the securities or derivatives of any companies that the analysts cover.
Additionally, MOSt generally prohibits its analysts and persons reporting to analysts from serving as an officer, director, or advisory board member of any companies that the analysts cover. Our salespeople, traders, and
other professionals or affiliates may provide oral or written market commentary or trading strategies to our clients that reflect opinions that are contrary to the opinions expressed herein, and our proprietary trading and
investing businesses may make investment decisions that are inconsistent with the recommendations expressed herein. In reviewing these materials, you should be aware that any or all of the foregoing among other things,
may give rise to real or potential conflicts of interest. MOSt and its affiliated company(ies), their directors and employees and their relatives may; (a) from time to time, have a long or short position in, act as principal in, and
buy or sell the securities or derivatives thereof of companies mentioned herein. (b) be engaged in any other transaction involving such securities and earn brokerage or other compensation or act as a market maker in the
financial instruments of the company(ies) discussed herein or act as an advisor or lender/borrower to such company(ies) or may have any other potential conflict of interests with respect to any recommendation and other
related information and opinions.; however the same shall have no bearing whatsoever on the specific recommendations made by the analyst(s), as the recommendations made by the analyst(s) are completely independent
of the views of the affiliates of MOSt even though there might exist an inherent conflict of interest in some of the stocks mentioned in the research report
Reports based on technical and derivative analysis center on studying charts company's price movement, outstanding positions and trading volume, as opposed to focusing on a company's fundamentals and, as such, may not match with a report on a
company's fundamental analysis. In addition MOST has different business segments / Divisions with independent research separated by Chinese walls catering to different set of customers having various objectives, risk profiles, investment horizon,
etc, and therefore may at times have different contrary views on stocks sectors and markets.
Unauthorized disclosure, use, dissemination or copying (either whole or partial) of this information, is prohibited. The person accessing this information specifically agrees to exempt MOSt or any of its affiliates or employees
from, any and all responsibility/liability arising from such misuse and agrees not to hold MOSt or any of its affiliates or employees responsible for any such misuse and further agrees to hold MOSt or any of its affiliates or
employees free and harmless from all losses, costs, damages, expenses that may be suffered by the person accessing this information due to any errors and delays. The information contained herein is based on publicly
available data or other sources believed to be reliable. Any statements contained in this report attributed to a third party represent MOSt’s interpretation of the data, information and/or opinions provided by that third party
either publicly or through a subscription service, and such use and interpretation have not been reviewed by the third party. This Report is not intended to be a complete statement or summary of the securities, markets or
developments referred to in the document. While we would endeavor to update the information herein on reasonable basis, MOSt and/or its affiliates are under no obligation to update the information. Also there may be
regulatory, compliance, or other reasons that may prevent MOSt and/or its affiliates from doing so. MOSt or any of its affiliates or employees shall not be in any way responsible and liable for any loss or damage that may
arise to any person from any inadvertent error in the information contained in this report. MOSt or any of its affiliates or employees do not provide, at any time, any express or implied warranty of any kind, regarding any
matter pertaining to this report, including without limitation the implied warranties of merchantability, fitness for a particular purpose, and non-infringement. The recipients of this report should rely on their own
investigations.
This report is intended for distribution to institutional investors. Recipients who are not institutional investors should seek advice of their independent financial advisor prior to taking any investment decision based on this
report or for any necessary explanation of its contents.
Most and it’s associates may have managed or co-managed public offering of securities, may have received compensation for investment banking or merchant banking or brokerage services, may have received any
compensation for products or services other than investment banking or merchant banking or brokerage services from the subject company in the past 12 months.
Most and it’s associates have not received any compensation or other benefits from the subject company or third party in connection with the research report.
Subject Company may have been a client of Most or its associates during twelve months preceding the date of distribution of the research report
MOSt and/or its affiliates and/or employees may have interests/positions, financial or otherwise of over 1 % at the end of the month immediately preceding the date of publication of the research in the securities mentioned
in this report. To enhance transparency, MOSt has incorporated a Disclosure of Interest Statement in this document. This should, however, not be treated as endorsement of the views expressed in the report.
Motilal Oswal Securities Limited is registered as a Research Analyst under SEBI (Research Analyst) Regulations, 2014. SEBI Reg. No. INH000000412
Pending Regulatory inspections against Motilal Oswal Securities Limited:
SEBI pursuant to a complaint from client Shri C.R. Mohanraj alleging unauthorized trading, issued a letter dated 29th April 2014 to MOSL notifying appointment of an Adjudicating Officer as per SEBI regulations to hold inquiry
and adjudge violation of SEBI Regulations; MOSL replied to the Show Cause Notice whereby SEBI granted us an opportunity of Inspection of Documents. Since all the documents requested by us were not covered we have
requested to SEBI vide our letter dated June 23, 2015 to provide pending list of documents for inspection.
List of associate companies of Motilal Oswal Securities Limited -Click
here to access detailed report
Analyst Certification
The views expressed in this research report accurately reflect the personal views of the analyst(s) about the subject securities or issues, and no part of the compensation of the research analyst(s) was, is, or will be directly or
indirectly related to the specific recommendations and views expressed by research analyst(s) in this report. The research analysts, strategists, or research associates principally responsible for preparation of MOSt research
receive compensation based upon various factors, including quality of research, investor client feedback, stock picking, competitive factors and firm revenues
Lupin
Disclosure of Interest Statement
Analyst ownership of the stock
No
Served as an officer, director or employee -
No
A graph of daily closing prices of securities is available at www.nseindia.com and http://economictimes.indiatimes.com/markets/stocks/stock-quotes
Regional Disclosures (outside India)
This report is not directed or intended for distribution to or use by any person or entity resident in a state, country or any jurisdiction, where such distribution, publication, availability or use would be contrary to law,
regulation or which would subject MOSt & its group companies to registration or licensing requirements within such jurisdictions.
For Hong Kong:
This report is distributed in Hong Kong by Motilal Oswal capital Markets (Hong Kong) Private Limited, a licensed corporation (CE AYY-301) licensed and regulated by the Hong Kong Securities and Futures
Commission (SFC) pursuant to the Securities and Futures Ordinance (Chapter 571 of the Laws of Hong Kong) “SFO”. As per SEBI (Research Analyst Regulations) 2014 Motilal Oswal Securities (SEBI Reg No. INH000000412) has
an agreement with Motilal Oswal capital Markets (Hong Kong) Private Limited for distribution of research report in Kong Kong. This report is intended for distribution only to “Professional Investors” as defined in Part I of
Schedule 1 to SFO. Any investment or investment activity to which this document relates is only available to professional investor and will be engaged only with professional investors.” Nothing here is an offer or solicitation
of these securities, products and services in any jurisdiction where their offer or sale is not qualified or exempt from registration. The Indian Analyst(s) who compile this report is/are not located in Hong Kong & are not
conducting Research Analysis in Hong Kong.
For U.S.
Motilal Oswal Securities Limited (MOSL) is not a registered broker - dealer under the U.S. Securities Exchange Act of 1934, as amended (the"1934 act") and under applicable state laws in the United States. In addition MOSL is
not a registered investment adviser under the U.S. Investment Advisers Act of 1940, as amended (the "Advisers Act" and together with the 1934 Act, the "Acts), and under applicable state laws in the United States.
Accordingly, in the absence of specific exemption under the Acts, any brokerage and investment services provided by MOSL, including the products and services described herein are not available to or intended for U.S.
persons.
This report is intended for distribution only to "Major Institutional Investors" as defined by Rule 15a-6(b)(4) of the Exchange Act and interpretations thereof by SEC (henceforth referred to as "major institutional investors").
This document must not be acted on or relied on by persons who are not major institutional investors. Any investment or investment activity to which this document relates is only available to major institutional investors
and will be engaged in only with major institutional investors. In reliance on the exemption from registration provided by Rule 15a-6 of the U.S. Securities Exchange Act of 1934, as amended (the "Exchange Act") and
interpretations thereof by the U.S. Securities and Exchange Commission ("SEC") in order to conduct business with Institutional Investors based in the U.S., MOSL has entered into a chaperoning agreement with a U.S.
registered broker-dealer, Motilal Oswal Securities International Private Limited. ("MOSIPL"). Any business interaction pursuant to this report will have to be executed within the provisions of this chaperoning agreement.
The Research Analysts contributing to the report may not be registered /qualified as research analyst with FINRA. Such research analyst may not be associated persons of the U.S. registered broker-dealer, MOSIPL, and
therefore, may not be subject to NASD rule 2711 and NYSE Rule 472 restrictions on communication with a subject company, public appearances and trading securities held by a research analyst account.
For Singapore
Motilal Oswal Capital Markets Singapore Pte Limited is acting as an exempt financial advisor under section 23(1)(f) of the Financial Advisers Act(FAA) read with regulation 17(1)(d) of the Financial Advisors Regulations and is a
subsidiary of Motilal Oswal Securities Limited in India. This research is distributed in Singapore by Motilal Oswal Capital Markets Singapore Pte Limited and it is only directed in Singapore to accredited investors, as defined in
the Financial Advisers Regulations and the Securities and Futures Act (Chapter 289), as amended from time to time.
In respect of any matter arising from or in connection with the research you could contact the following representatives of Motilal Oswal Capital Markets Singapore Pte Limited:
Varun Kumar
Varun.kumar@motilaloswal.com
Contact : (+65) 68189232
Office Address:21 (Suite 31),16 Collyer Quay,Singapore 04931
LUPIN
24 May 2017
Motilal Oswal Tower, Level 9, Sayani Road, Prabhadevi, Mumbai 400 025
Phone: +91 22 3982 5500 E-mail: reports@motilaloswal.com
Motilal Oswal Securities Ltd
12