Alkem Laboratories
BSE SENSEX
31,028
Bloomberg
Equity Shares (m)
M.Cap.(INRb)/(USDb)
52-Week Range (INR)
1, 6, 12 Rel. Per (%)
Avg Val, INRm
Free float (%)
S&P CNX
9,595
ALKEM IN
120
263.9 / 4.1
2238 / 1200
-10/-8/31
108
33.0
27 May 2017
4QFY17 Results Update | Sector: Healthcare
CMP: INR1,866
TP: INR1,900(+2%)
Neutral
Weak 4Q; domestic business delivers muted performance
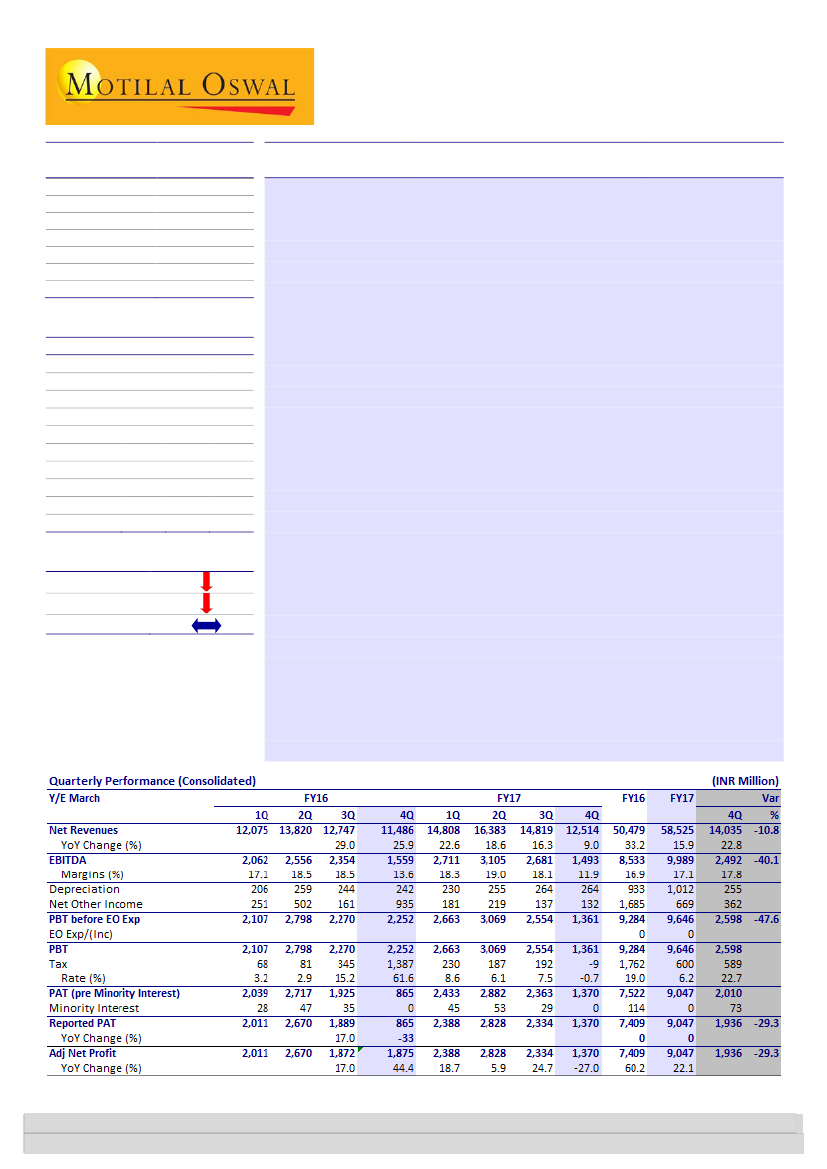
Revenues grew 9% YoY to INR12.5b, missing estimate by 10.8%, primarily due
to weak domestic business growth of ~7%. US business sales stood at USD44m
(v/s USD50m in 3QFY17). EBITDA of INR1.5b declined 4% YoY, with the margin
contracting 160bp YoY (-620bp QoQ) to ~11.9%, mainly due to higher R&D
spend (7.3% of sales v/s normalized rate of ~4-4.5%), muted growth in
domestic business and addition of 400-500 MRs in the acute segment.
Domestic business – weak growth:
Domestic business grew by a muted 7% YoY
to INR8.6b due to a decline in the anti-infective market, demonetization impact
and destocking in the channel due to GST. Despite the impact of GST in the near
term, Alkem expects its domestic business to grow at mid-teens in FY18.
US – sequential decline due to seasonality:
US sales declined 12% QoQ (+20%
YoY) to USD44m due to seasonality (Benzonatate sales goes up in winter). We
expect ramp-up in US business in coming quarters on the back of four ANDA
launches in 4Q and expected high-single-digit launches in FY18.
Key concall takeaways:
a) Net cash at end-4Q stood at INR7.2b. b) R&D as % of
sales stood at 7.3% in 4Q (v/s 5.2% in FY17). c) Impact of GST will be ~2.5% of
domestic sales; mitigation of this impact will depend upon price escalation. d)
R&D guidance of ~6% in FY18. e) Planning to file 12-15 ANDAs in FY18. f) Tax
rate guidance of ~MAT rate in FY18 and 12-15% in FY19 (lower in FY19 due to
annual impact of tax benefit from new Sikkim plant). g) Capex expected to be
~INR6b in FY18 (INR6.27b invested in FY17). h) Trade generics account for
>10% of domestic sales.
Maintain Neutral:
We continue believing that Alkem is the best way to play the
domestic growth story (>70% of revenue and >85% of EBITDA came from India
in FY17). Having said that, at current valuations, the stock offers limited upside
potential. Our target price of INR1,900 is based on 20x FY19E PER (v/s INR1,850
@ 20x 1HFY19E PER).
Financials & Valuations (INR b)
Y/E Mar
2017 2018E 2019E
Net Sales
58.5
65.4
76.4
EBITDA
10.0
11.6
13.8
PAT
9.0
9.6
11.3
EPS (INR)
75.7
80.0
94.9
Gr. (%)
7.5
5.8
18.6
BV/Sh (INR)
353.4 415.4 489.0
RoE (%)
23.4
20.8
21.0
RoCE (%)
21.3
18.9
23.1
P/E (x)
24.7
23.3
19.7
P/BV (x)
5.3
4.5
3.8
Estimate change
TP change
Rating change
Kumar Saurabh
(Kumar.Saurabh@MotilalOswal.com); +91 22 6129 1519
Investors are advised to refer through important disclosures made at the last page of the Research Report.
Motilal Oswal research is available on www.motilaloswal.com/Institutional-Equities, Bloomberg, Thomson Reuters, Factset and S&P Capital.

Alkem Laboratories
Highlights from the earnings call
India business (73% of sales)
Alkem’s India sales reported INR8.6b sales in 4QFY17, exhibiting 7%YoY growth.
Weak performance in domestic business to continue in 1HFY18
Demonetization, weak anti-infective season, destocking in the channel due to
GST adversely impacted domestic sales growth.
Alkem exhibited robust growth in emerging therapies of Neuro/CNS, Derma, Cardiac
and Anti-Diabetic. Secondary sales growth for the quarter was at 11.4% YoY (as per
IMS), ahead of the IPM which grew 9.1% YoY. Although company outperformed in
some therapies, management has guided for a challenging 1HFY18E on back on
uncertaintie of GST impact. Company has guided for mid-teens growth in FY18
backed by higher single digit launches.
Exhibit 1: India business grew 7% YoY in 4QFY17
India sales (INR m)
8004
4QFY16
8563
4QFY17
Source: Company, MOSL
Exhibit 2: Alkem outperformed across major therapies
Source: Company
27 May 2017
2

Alkem Laboratories
US business (21% of sales)
US sales grew 19.4%YoY to INR INR2.9b, driven by increased market share in existing
products and contribution from 7 new product launches during the year. Of the 7
products launched 5 were own and 2 in-licensed products. In 4QFY17, Alkem
received 9 approvals including 4 tentative approvals.
Cumulatively, it has filed 91 ANDAs and received 32 approvals till date. Total
pending approvals stands at 52. Company expects to file ~12-15 filings per year from
FY18.
Exhibit 3: US business grew 19.4% in 4QFY17
US sales (INR m)
2434.67
4QFY16
2907
4QFY17
Source: Company, MOSL
Exhibit 4: Cumulative US ANDA filings
91
Exhibit 5: 79% of pending ANDA’s are Para IVs
US Filings
Total ANDAs filed
Para IV (including FTFs)
NDAs
# Nos.
91
37
1
Source: Company, MOSL
52
32
7
Final Approval
Tentative
Approvals
Pending Total
Total
Source: Company, MOSL
Other international business (6.4% of sales)
Other international business increased 1.6%YoY to INR946m.
Other highlights
Revenue R&D expenses for the quarter were at INR915m (7.3% of sales),
Concluded inspection at 3 facilities, Baddi, Daman and Mandva
Cash and cash equivalents on books stand at ~INR7.2b at end of FY17.
27 May 2017
3

Alkem Laboratories
Valuations & Risk
Over last 10 years, Alkem has outperformed the most of the Indian pharma
companies in domestic market, driven by consistent launches in acute therapies like
Anti Infective, Pain/Analgesic, and Vitamins while growing its presence in high
growth chronic therapies like CNS, Cardiac, Derma and Anti-Diabetic. Besides India
segment, Alkem has also launched ~30 products in US market and has 52 pending
approvals. Although India business faces regulatory issues and up-coming GST
impact, which is expected to be a short term phenomena, and structural changes
along with pricing pressure in the US business, we expect Alkem’s revenues to grow
14% CAGR and earnings growth of 12% CAGR FY17-19E.
We continue believing that Alkem is the best way to play the domestic growth story
(>70% of revenue and >85% of EBITDA came from India in FY17). Having said that, at
current valuations, stock provides limited room for upside. Our target price of
INR1,900 for Alkem is based on 20x FY19E PER (vs INR1,850 @ 20x 1H FY19E PER).
27 May 2017
4

Alkem Laboratories
Story in charts
Exhibit 6: Overall sales grew 9% YoY to INR14.8b in 4Q
Sales (INR b)
17.3
14.5
Exhibit 7: EBITDA margin declined 160bps YoY
EBITDA (INR b)
18.5 18.5
17.1
13.6
EBITDA margin (%)
18.3 19.0 18.1
11.9
9.9
9.1
14.8 16.4 14.8 12.5
12.1 13.8 12.7 11.5
1.7
1.3
2.1
2.6
2.4
1.6
2.7
3.1
2.7
1.5
Source: Company, MOSL
Exhibit 8: Gross margins at 63.2%
Gross Profit (INR b)
60.7 60.3 60.1
57.1
5.2
7.3
8.3
7.7
7.2
9.0
10.0
9.4
7.9
62.5
Gross margin (%)
60.9 60.9
63.5 63.2
Exhibit 9: 4Q reported EPS stood at INR11.5/share
EPS (INR/sh)
58.3
5.8
13.5 10.9
16.8
22.3
15.8
20.0
7.2
23.7
19.5
11.5
Source: Company, MOSL
Exhibit 10: Revenues to exhibit 14% CAGR over FY17-19E
Revenue (INR b)
Exhibit 11: India sales to exhibit 15% CAGR over FY17-19E
India business (INR b)
16.9
20.2
25.0
31.3
37.9
50.5
58.5
65.4
76.4
14.8
17.5
20.5
23.6
28.3
36.5
42.2
48.5
56.2
Source: Company, MOSL
27 May 2017
5

Alkem Laboratories
Story in charts
Exhibit 12: US sales to be driven by new launches
US sales (INR m)
150.6
56.5
127.8
53.2
53.3
13.5
21.5
12.0
20.4
14.5
23.8
17.9
2.8
5.9
7.4
YoY Growth (%)
Exhibit 13: Increasing US sales contribution
% of sales
19.9
20.8
21.8
23.3
17.1
0.5
1.2
1.9
4.2
6.5
9.9
Source: Company, MOSL
Exhibit 14: R&D expense to increase …
R&D expense (INR m)
5.0%
5.2%
As % of sales
6.0%
6.0%
Exhibit 15: Better business mix to drive profitability
EBITDA (INR b)
17.0
18.6
14.5
13.1
14.4
EBITDA margin (%)
16.9
17.1
17.8
18.1
4.3%
4.5%
4.3%
1082
1570
1696
2171
3043
3926
4581
2.9
3.8
3.6
4.1
5.4
8.5
10.0
11.6
13.8
Source: Company, MOSL
Exhibit 16: Earnings to grow at 12% CAGR over FY17-19E
EPS (INR/sh)
24.7
34.0
32.1
36.4
38.7
70.4
75.7
80.0
94.9
Source: Company, MOSL
27 May 2017
6

Alkem Laboratories
Financials and Valuations
Income Statement
Y/E Mar
Net Sales
Change (%)
EBITDA
EBITDA Margin (%)
Depreciation
EBIT
Interest
Other Income
Extraordinary items
PBT
Tax
Tax Rate (%)
Min. Int. & Assoc. Share
Reported PAT
Adjusted PAT
Change (%)
2012
20,156
19.2
3,752
18.6
290
3,462
581
1,453
0
4,334
275
6.4
-7
4,065
4,065
37.5
2012
120
18,081
18,201
2
10,048
357
28,607
6,741
0
2,451
3,227
22,239
3,849
2,466
5,138
10,785
6,050
3,622
2,428
16,189
28,607
2013
24,952
23.8
3,625
14.5
398
3,227
882
1,672
0
4,016
180
4.5
-2
3,838
3,838
-5.6
2013
120
21,654
21,773
0
15,485
487
37,745
8,964
0
1,758
4,776
27,202
5,540
3,182
9,955
8,526
4,955
4,049
906
22,247
37,745
2014
31,260
25.3
4,100
13.1
523
3,578
931
1,653
0
4,300
-54
-1.2
0
4,353
4,353
13.4
2014
120
25,730
25,850
0
11,284
609
37,743
9,797
0
1,903
5,880
25,414
6,203
3,669
2,063
13,478
5,251
4,325
926
20,163
37,743
2015
37,887
21.2
5,445
14.4
703
4,742
811
1,810
-574
5,167
542
10.5
0
4,625
5,139
18.1
2015
239
29,752
29,991
857
13,059
964
44,870
11,429
0
3,421
4,808
33,008
7,842
5,271
7,908
11,987
7,796
6,286
1,510
25,212
44,870
2016
50,479
33.2
8,533
16.9
933
7,599
712
2,397
0
9,284
1,762
19.0
114
7,409
8,419
63.8
2016
239
34,787
35,027
965
5,885
945
42,822
11,589
1,093
3,531
4,220
33,944
9,094
5,645
7,964
11,241
11,482
9,487
1,995
22,462
42,895
2017
58,525
15.9
9,990
17.1
1,012
8,978
452
1,120
0
9,646
600
6.2
0
9,047
9,047
7.5
2017
239
42,012
42,251
965
5,885
937
50,038
14,202
2,969
3,531
4,220
39,928
10,904
7,215
9,292
12,516
14,214
10,267
3,947
25,714
50,636
2018E
65,439
11.8
11,648
17.8
1,175
10,473
294
1,351
0
11,530
1,960
17.0
0
9,570
9,570
5.8
2018E
239
49,427
49,666
965
5,885
937
57,453
16,901
2,094
3,531
4,220
47,853
11,053
7,171
16,016
13,613
16,548
11,863
4,685
31,305
58,051
(INR Million)
2019E
76,352
16.7
13,820
18.1
1,405
12,415
324
1,417
0
13,508
2,161
16.0
0
11,347
11,347
18.6
2019E
239
58,219
58,458
965
5,885
937
66,245
18,672
1,919
3,531
4,220
57,885
12,849
8,367
24,562
12,106
19,383
13,811
5,572
38,501
66,843
Balance Sheet
Y/E Mar
Share Capital
Reserves
Net Worth
Minority Interest
Debt
Deferred Tax
Total Capital Employed
Net Fixed Assets
Capital WIP
Goodwill on consolidation
Investments
Current Assets
Inventory
Debtors
Cash & Bank
Loans & Adv, Others
Curr Liabs & Provns
Curr. Liabilities
Provisions
Net Current Assets
Total Assets
(INR Million)
27 May 2017
7

Alkem Laboratories
Financials and Valuations
Ratios
Y/E Mar
Basic (INR)
EPS
Cash EPS
Book Value
DPS
Payout (incl. Div. Tax.)
Valuation(x)
P/E
Price / Book Value
EV/Sales
EV/EBITDA
Dividend Yield (%)
Profitability Ratios (%)
RoE
RoCE
RoIC
Turnover Ratios (%)
Asset Turnover (x)
Debtors (No. of Days)
Inventory (No. of Days)
Creditors (No. of Days)
Leverage Ratios (%)
Net Debt/Equity (x)
2012
34.0
36.4
152.2
2.0
6.8
0.0
0.0
0.0
0.0
0.1
25.0
17.8
19.3
0.7
43
70
50
0.1
2012
3,752
243
-1,448
-966
10
1,591
-2,481
-890
-2,612
-1,147
-6,240
0
646
-547
-210
-111
-4,760
9,898
5,138
2013
32.1
35.4
182.1
2.0
7.2
0.0
0.0
0.0
0.0
0.1
19.2
14.3
14.2
0.7
45
81
42
0.0
2013
3,625
59
-1,827
-1,102
26
781
-2,335
-1,554
-281
3,095
480
0
4,870
-797
-517
3,556
4,816
5,138
9,955
2014
36.4
40.8
216.2
2.0
6.4
51.3
8.6
7.4
56.7
0.1
18.3
14.2
13.7
0.8
41
72
36
0.1
2014
4,100
167
-364
-1,111
107
2,900
-1,004
1,897
25
-3,814
-4,792
0
-4,732
-914
-354
-6,000
-7,892
9,955
2,063
2015
38.7
48.9
250.9
4.0
12.3
48.2
7.4
6.0
41.9
0.2
18.4
14.6
13.6
0.8
49
76
45
0.0
2015
5,445
-796
-963
-1,056
652
3,281
-1,354
1,928
1,028
3,406
3,081
0
871
-793
-596
-518
5,845
2,063
7,908
2016
70.4
78.2
293.0
6.2
11.9
26.5
6.4
4.4
25.9
0.3
25.9
19.3
19.8
1.2
40
66
42
-0.2
2016
8,533
0
1,992
-1,762
8
8,770
-2,296
6,475
588
2,397
689
0
-7,174
-712
-992
-8,878
581
7,908
8,489
2017
75.7
84.1
353.4
12.9
20.1
24.7
5.3
3.8
22.0
0.7
23.4
21.3
26.6
1.2
45
68
37
-0.2
2017
9,990
0
-1,924
-600
0
7,466
-5,500
1,966
0
1,120
-4,380
0
0
-452
-1,822
-2,274
812
8,481
9,292
2018E
80.0
89.9
415.4
15.2
22.5
23.3
4.5
3.3
18.3
0.8
20.8
18.9
25.2
1.1
39
62
39
-0.3
2018E
11,648
0
1,133
-1,960
0
10,821
-3,000
7,821
0
1,351
-1,649
0
0
-294
-2,155
-2,449
6,723
9,292
16,016
2019E
94.9
106.7
489.0
18.0
22.5
19.7
3.8
2.7
14.8
1.0
21.0
23.1
29.4
1.1
39
61
39
-0.4
2019E
13,820
0
1,350
-2,161
0
13,008
-3,000
10,008
0
1,417
-1,583
0
0
-324
-2,555
-2,878
8,546
16,016
24,562
Cash Flow Statement
Y/E Mar
Adjusted EBITDA
Non cash opr. exp (inc)
(Inc)/Dec in Wkg. Cap.
Tax Paid
Other operating activities
CF from Op. Activity
(Inc)/Dec in FA & CWIP
Free cash flows
(Pur)/Sale of Invt
Others
CF from Inv. Activity
Inc/(Dec) in Net Worth
Inc / (Dec) in Debt
Interest Paid
Divd Paid (incl Tax) & Others
CF from Fin. Activity
Inc/(Dec) in Cash
Add: Opening Balance
Closing Balance
(INR Million)
27 May 2017
8

Alkem Laboratories
Corporate profile
Company description
Exhibit 1: Sensex rebased
Established in 1973 and headquartered in Mumbai,
Alkem is a leading India pharmaceutical company
with global operations, engaged in the
development, manufacture and sale of
pharmaceutical and nutraceutical products. With a
portfolio of more than 700 brands in India, Alkem is
ranked fifth largest pharmaceutical company in
India in terms of domestic sales.
Source: MOSL/Bloomberg
Exhibit 2: Shareholding pattern (%)
Mar-17
Promoter
DII
FII
Others
67.0
2.5
4.2
26.3
Dec-16
67.0
2.9
3.9
26.2
Mar-16
66.8
3.2
3.6
26.4
Source: Capitaline
Exhibit 3: Top holders
Holder Name
Prabhat Narain Singh
Rajesh Kumar
Rajeev Ranjan
Deepak Kumar Singh
Kishor Kumar Singh
% Holding
3.1
2.8
2.5
2.3
2.3
Source: Capitaline
Note: FII Includes depository receipts
Exhibit 4: Top management
Name
Basudeo N Singh
Samprada Singh
Dhananjay Kumar Singh.
SANDEEP SINGH
Balmiki Prasad Singh
Mritunjay Kumar Singh
Manish Narang
Designation
Executive Chairman
Chairman Emeritus
Joint
Managing
Director
Joint
Managing
Director
Executive Director
Executive Director
Company Secretary
Exhibit 5: Directors
Name
A K Purwar
Mangaldas Chhaganlal Shah
SANGEETA KAPILJIT SINGH
Name
Akhouri Maheshwar Prasad
Ranjal Laxmana Shenoy
SUDHA RAVI
*Independent
Source: Capitaline
Exhibit 6: Auditors
Name
BSR & Co LLP
Manish Ghia & Associates
Suresh D Shenoy
Type
Statutory
Secretarial Audit
Cost Auditor
Exhibit 7: MOSL forecast v/s consensus
EPS
(INR)
FY18
FY19
MOSL
forecast
80.0
94.9
Consensus
forecast
83.2
100.2
Variation (%)
-3.8
-5.3
Source: Bloomberg
Source: Capitaline
27 May 2017
9

Disclosures
This document has been prepared by Motilal Oswal Securities Limited (hereinafter referred to as Most) to provide information about the company (ies) and/sector(s), if any, covered in the report and may be distributed by it
and/or its affiliated company(ies). This report is for personal information of the selected recipient/s and does not construe to be any investment, legal or taxation advice to you. This research report does not constitute an
offer, invitation or inducement to invest in securities or other investments and Motilal Oswal Securities Limited (hereinafter referred as MOSt) is not soliciting any action based upon it. This report is not for public distribution
and has been furnished to you solely for your general information and should not be reproduced or redistributed to any other person in any form. This report does not constitute a personal recommendation or take into
account the particular investment objectives, financial situations, or needs of individual clients. Before acting on any advice or recommendation in this material, investors should consider whether it is suitable for their
particular circumstances and, if necessary, seek professional advice. The price and value of the investments referred to in this material and the income from them may go down as well as up, and investors may realize losses
on any investments. Past performance is not a guide for future performance, future returns are not guaranteed and a loss of original capital may occur.
MOSt and its affiliates are a full-service, integrated investment banking, investment management, brokerage and financing group. We and our affiliates have investment banking and other business relationships with a some
companies covered by our Research Department. Our research professionals may provide input into our investment banking and other business selection processes. Investors should assume that MOSt and/or its affiliates are
seeking or will seek investment banking or other business from the company or companies that are the subject of this material and that the research professionals who were involved in preparing this material may educate
investors on investments in such business . The research professionals responsible for the preparation of this document may interact with trading desk personnel, sales personnel and other parties for the purpose of
gathering, applying and interpreting information. Our research professionals are paid on twin parameters of performance & profitability of MOSt.
MOSt generally prohibits its analysts, persons reporting to analysts, and members of their households from maintaining a financial interest in the securities or derivatives of any companies that the analysts cover.
Additionally, MOSt generally prohibits its analysts and persons reporting to analysts from serving as an officer, director, or advisory board member of any companies that the analysts cover. Our salespeople, traders, and
other professionals or affiliates may provide oral or written market commentary or trading strategies to our clients that reflect opinions that are contrary to the opinions expressed herein, and our proprietary trading and
investing businesses may make investment decisions that are inconsistent with the recommendations expressed herein. In reviewing these materials, you should be aware that any or all of the foregoing among other things,
may give rise to real or potential conflicts of interest. MOSt and its affiliated company(ies), their directors and employees and their relatives may; (a) from time to time, have a long or short position in, act as principal in, and
buy or sell the securities or derivatives thereof of companies mentioned herein. (b) be engaged in any other transaction involving such securities and earn brokerage or other compensation or act as a market maker in the
financial instruments of the company(ies) discussed herein or act as an advisor or lender/borrower to such company(ies) or may have any other potential conflict of interests with respect to any recommendation and other
related information and opinions.; however the same shall have no bearing whatsoever on the specific recommendations made by the analyst(s), as the recommendations made by the analyst(s) are completely independent
of the views of the affiliates of MOSt even though there might exist an inherent conflict of interest in some of the stocks mentioned in the research report
Reports based on technical and derivative analysis center on studying charts company's price movement, outstanding positions and trading volume, as opposed to focusing on a company's fundamentals and, as such, may not match with a report on a
company's fundamental analysis. In addition MOST has different business segments / Divisions with independent research separated by Chinese walls catering to different set of customers having various objectives, risk profiles, investment horizon,
etc, and therefore may at times have different contrary views on stocks sectors and markets.
Unauthorized disclosure, use, dissemination or copying (either whole or partial) of this information, is prohibited. The person accessing this information specifically agrees to exempt MOSt or any of its affiliates or employees
from, any and all responsibility/liability arising from such misuse and agrees not to hold MOSt or any of its affiliates or employees responsible for any such misuse and further agrees to hold MOSt or any of its affiliates or
employees free and harmless from all losses, costs, damages, expenses that may be suffered by the person accessing this information due to any errors and delays. The information contained herein is based on publicly
available data or other sources believed to be reliable. Any statements contained in this report attributed to a third party represent MOSt’s interpretation of the data, information and/or opinions provided by that third party
either publicly or through a subscription service, and such use and interpretation have not been reviewed by the third party. This Report is not intended to be a complete statement or summary of the securities, markets or
developments referred to in the document. While we would endeavor to update the information herein on reasonable basis, MOSt and/or its affiliates are under no obligation to update the information. Also there may be
regulatory, compliance, or other reasons that may prevent MOSt and/or its affiliates from doing so. MOSt or any of its affiliates or employees shall not be in any way responsible and liable for any loss or damage that may
arise to any person from any inadvertent error in the information contained in this report. MOSt or any of its affiliates or employees do not provide, at any time, any express or implied warranty of any kind, regarding any
matter pertaining to this report, including without limitation the implied warranties of merchantability, fitness for a particular purpose, and non-infringement. The recipients of this report should rely on their own
investigations.
This report is intended for distribution to institutional investors. Recipients who are not institutional investors should seek advice of their independent financial advisor prior to taking any investment decision based on this
report or for any necessary explanation of its contents.
Most and it’s associates may have managed or co-managed public offering of securities, may have received compensation for investment banking or merchant banking or brokerage services, may have received any
compensation for products or services other than investment banking or merchant banking or brokerage services from the subject company in the past 12 months.
Most and it’s associates have not received any compensation or other benefits from the subject company or third party in connection with the research report.
Subject Company may have been a client of Most or its associates during twelve months preceding the date of distribution of the research report
MOSt and/or its affiliates and/or employees may have interests/positions, financial or otherwise of over 1 % at the end of the month immediately preceding the date of publication of the research in the securities mentioned
in this report. To enhance transparency, MOSt has incorporated a Disclosure of Interest Statement in this document. This should, however, not be treated as endorsement of the views expressed in the report.
Motilal Oswal Securities Limited is registered as a Research Analyst under SEBI (Research Analyst) Regulations, 2014. SEBI Reg. No. INH000000412
Pending Regulatory inspections against Motilal Oswal Securities Limited:
SEBI pursuant to a complaint from client Shri C.R. Mohanraj alleging unauthorized trading, issued a letter dated 29th April 2014 to MOSL notifying appointment of an Adjudicating Officer as per SEBI regulations to hold inquiry
and adjudge violation of SEBI Regulations; MOSL replied to the Show Cause Notice whereby SEBI granted us an opportunity of Inspection of Documents. Since all the documents requested by us were not covered we have
requested to SEBI vide our letter dated June 23, 2015 to provide pending list of documents for inspection.
List of associate companies of Motilal Oswal Securities Limited -Click
here to access detailed report
Analyst Certification
The views expressed in this research report accurately reflect the personal views of the analyst(s) about the subject securities or issues, and no part of the compensation of the research analyst(s) was, is, or will be directly or
indirectly related to the specific recommendations and views expressed by research analyst(s) in this report. The research analysts, strategists, or research associates principally responsible for preparation of MOSt research
receive compensation based upon various factors, including quality of research, investor client feedback, stock picking, competitive factors and firm revenues
Alkem Laboratories
Disclosure of Interest Statement
Analyst ownership of the stock
No
Served as an officer, director or employee -
No
A graph of daily closing prices of securities is available at www.nseindia.com and http://economictimes.indiatimes.com/markets/stocks/stock-quotes
Regional Disclosures (outside India)
This report is not directed or intended for distribution to or use by any person or entity resident in a state, country or any jurisdiction, where such distribution, publication, availability or use would be contrary to law,
regulation or which would subject MOSt & its group companies to registration or licensing requirements within such jurisdictions.
For Hong Kong:
This report is distributed in Hong Kong by Motilal Oswal capital Markets (Hong Kong) Private Limited, a licensed corporation (CE AYY-301) licensed and regulated by the Hong Kong Securities and Futures
Commission (SFC) pursuant to the Securities and Futures Ordinance (Chapter 571 of the Laws of Hong Kong) “SFO”. As per SEBI (Research Analyst Regulations) 2014 Motilal Oswal Securities (SEBI Reg No. INH000000412) has
an agreement with Motilal Oswal capital Markets (Hong Kong) Private Limited for distribution of research report in Kong Kong. This report is intended for distribution only to “Professional Investors” as defined in Part I of
Schedule 1 to SFO. Any investment or investment activity to which this document relates is only available to professional investor and will be engaged only with professional investors.” Nothing here is an offer or solicitation
of these securities, products and services in any jurisdiction where their offer or sale is not qualified or exempt from registration. The Indian Analyst(s) who compile this report is/are not located in Hong Kong & are not
conducting Research Analysis in Hong Kong.
For U.S.
Motilal Oswal Securities Limited (MOSL) is not a registered broker - dealer under the U.S. Securities Exchange Act of 1934, as amended (the"1934 act") and under applicable state laws in the United States. In addition MOSL is
not a registered investment adviser under the U.S. Investment Advisers Act of 1940, as amended (the "Advisers Act" and together with the 1934 Act, the "Acts), and under applicable state laws in the United States.
Accordingly, in the absence of specific exemption under the Acts, any brokerage and investment services provided by MOSL, including the products and services described herein are not available to or intended for U.S.
persons.
This report is intended for distribution only to "Major Institutional Investors" as defined by Rule 15a-6(b)(4) of the Exchange Act and interpretations thereof by SEC (henceforth referred to as "major institutional investors").
This document must not be acted on or relied on by persons who are not major institutional investors. Any investment or investment activity to which this document relates is only available to major institutional investors
and will be engaged in only with major institutional investors. In reliance on the exemption from registration provided by Rule 15a-6 of the U.S. Securities Exchange Act of 1934, as amended (the "Exchange Act") and
interpretations thereof by the U.S. Securities and Exchange Commission ("SEC") in order to conduct business with Institutional Investors based in the U.S., MOSL has entered into a chaperoning agreement with a U.S.
registered broker-dealer, Motilal Oswal Securities International Private Limited. ("MOSIPL"). Any business interaction pursuant to this report will have to be executed within the provisions of this chaperoning agreement.
The Research Analysts contributing to the report may not be registered /qualified as research analyst with FINRA. Such research analyst may not be associated persons of the U.S. registered broker-dealer, MOSIPL, and
therefore, may not be subject to NASD rule 2711 and NYSE Rule 472 restrictions on communication with a subject company, public appearances and trading securities held by a research analyst account.
For Singapore
Motilal Oswal Capital Markets Singapore Pte Limited is acting as an exempt financial advisor under section 23(1)(f) of the Financial Advisers Act(FAA) read with regulation 17(1)(d) of the Financial Advisors Regulations and is a
subsidiary of Motilal Oswal Securities Limited in India. This research is distributed in Singapore by Motilal Oswal Capital Markets Singapore Pte Limited and it is only directed in Singapore to accredited investors, as defined in
the Financial Advisers Regulations and the Securities and Futures Act (Chapter 289), as amended from time to time.
In respect of any matter arising from or in connection with the research you could contact the following representatives of Motilal Oswal Capital Markets Singapore Pte Limited:
Varun Kumar
Varun.kumar@motilaloswal.com
Contact : (+65) 68189232
Office Address:21 (Suite 31),16 Collyer Quay,Singapore 04931
ALKEM LABORATORIES
27 May 2017
Motilal Oswal Tower, Level 9, Sayani Road, Prabhadevi, Mumbai 400 025
Phone: +91 22 3982 5500 E-mail: reports@motilaloswal.com
Motilal Oswal Securities Ltd
10