29 May 2017
4QFY17 Results Update | Sector: Utilities
NTPC
BSE SENSEX
31,109
Bloomberg
Equity Shares (m)
M.Cap.(INRb)/(USDb)
52-Week Range (INR)
1, 6, 12 Rel. Per (%)
Avg Val, INRm
Free float (%)
S&P CNX
9,605
NTPC IN
8,245
1,417.8 / 21.1
178 / 138
-9/-22/-5
758
30.3
CMP: INR156
TP: INR198 (+27%)
Buy
PAT growth muted on change in GCV measurement
Capacity addition to accelerate and drive earnings growth; Maintain Buy
NTPCsa (NTPC standalone) 4QFY17 PAT, adjusted for investment write-off of
INR7.8b and employee wage hike provision of INR3.2b (not considered as pass-
through in tariff for now), was up 14% YoY to INR31.8b. However, on a like-to-
like basis, adjusting for prior-period items, we estimate PAT was broadly flat YoY
at INR26.6b (est. of INR24.1b), primarily due to the impact of change in
measurement of GCV. Regulated equity (RAB) increased 6% YoY to INR440b. For
FY17, adjusted for one-offs/prior-period items, PAT rose 1% YoY to INR96b.
Pay revision impacts reported performance:
Of the pay revision provision of
INR8.7b, NTPC has conservatively recognized INR3.5b (50% of ex-gratuity
hike) as non-recoverable through tariff. However, we estimate the regulator,
like in the past, would allow complete pass-through of wage hike.
Commercialization of 4.7GW (NTPCsa ex-solar)
(Exhibit 3) and capitalization
of 5.3GW are guided for FY18. We estimate commercialization would be
lower at 3.3GW (NTPCsa ex-solar), still an increase from 1.4GW in FY17.
JV performance improves:
PAT of JVs increased from INR1.6b in FY16 to
INR6.2b in FY17, driven by improved performance at NTPC-SAIL, NTPC-TN
and Aravali. Consolidated reported PAT was flat YoY at INR107b in FY17.
Expect some delay in execution, but earnings outlook remains robust
Although there are some delays in project execution, the earnings growth
outlook remains robust. We expect CAGR 9.5% in DC and 17% in regulated
equity over FY16-21E.
NTPC’s consolidated EPS CAGR is estimated at 11% over FY17-21E. RoE is
expected to improve from ~11% in FY17 to ~12% in FY20. We value the stock
at INR198 based on DCF. Maintain
Buy.
Financials & Valuations (INR b)
2016 2017E
Y/E Mar
787.1
826.9
Net Sales
191.6
232.2
EBITDA
101.3
99.4
PAT
12.3
12.1
EPS (INR)
15.4
-1.8
Gr. (%)
108.2
115.4
BV/Sh (INR)
11.9
10.8
RoE (%)
7.3
6.4
RoCE (%)
14.0
14.3
P/E (x)
1.6
1.5
P/BV (x)
2018E
963.5
300.4
118.0
14.3
18.7
124.3
11.9
7.5
12.0
1.4
Estimate change
TP change
Rating change
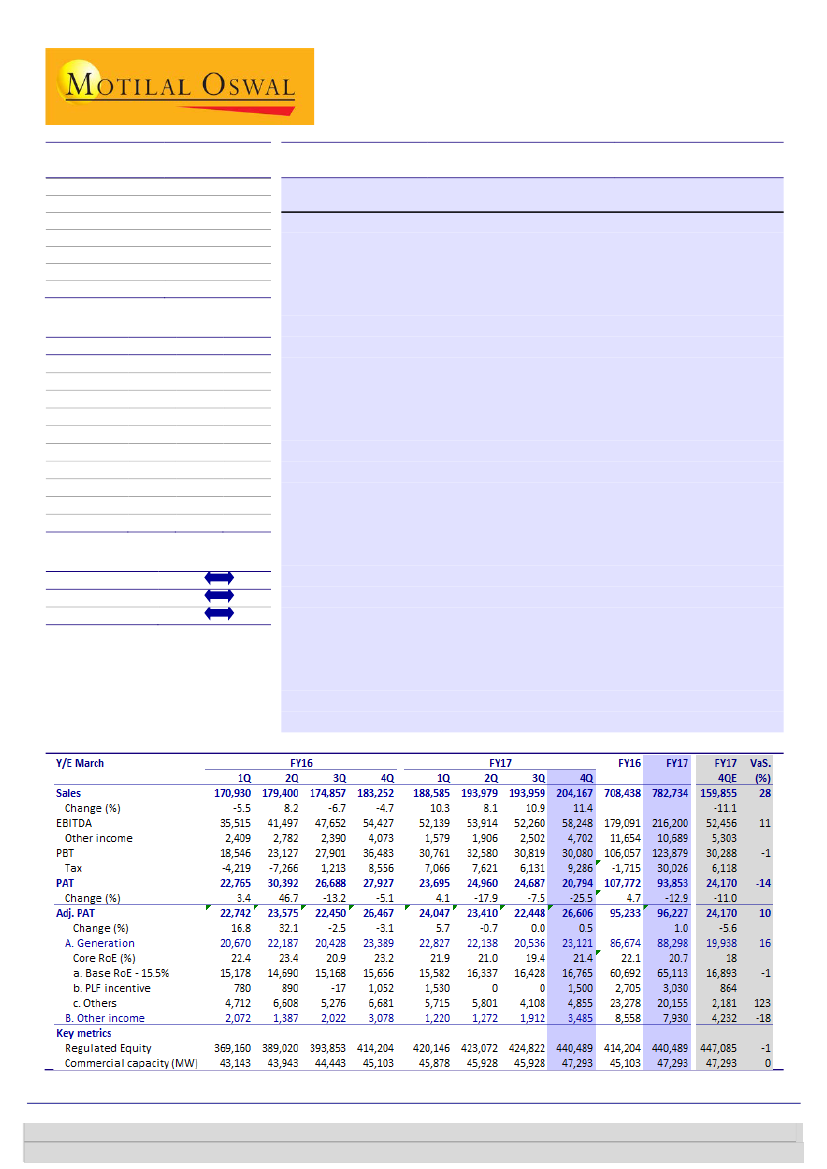
Quarterly Performance (standalone) – INR m
Investors are advised to refer through important disclosures made at the last page of the Research Report.
Motilal Oswal research is available on www.motilaloswal.com/Institutional-Equities, Bloomberg, Thomson Reuters, Factset and S&P Capital.
Sanjay Jain
(SanjayJain@MotilalOswal.com); +91 22 6129 1523
Dhruv Muchhal
(Dhruv.Muchhal@MotilalOswal.com); +91 22 6129 1549