Ipca Laboratories
BSE SENSEX
31,159
Bloomberg
Equity Shares (m)
M.Cap.(INRb)/(USDb)
52-Week Range (INR)
1, 6, 12 Rel. Per (%)
Avg Val, INRm
Free float (%)
S&P CNX
9,625
IPCA IN
Weak quarter; resolution of FDA issue key
126
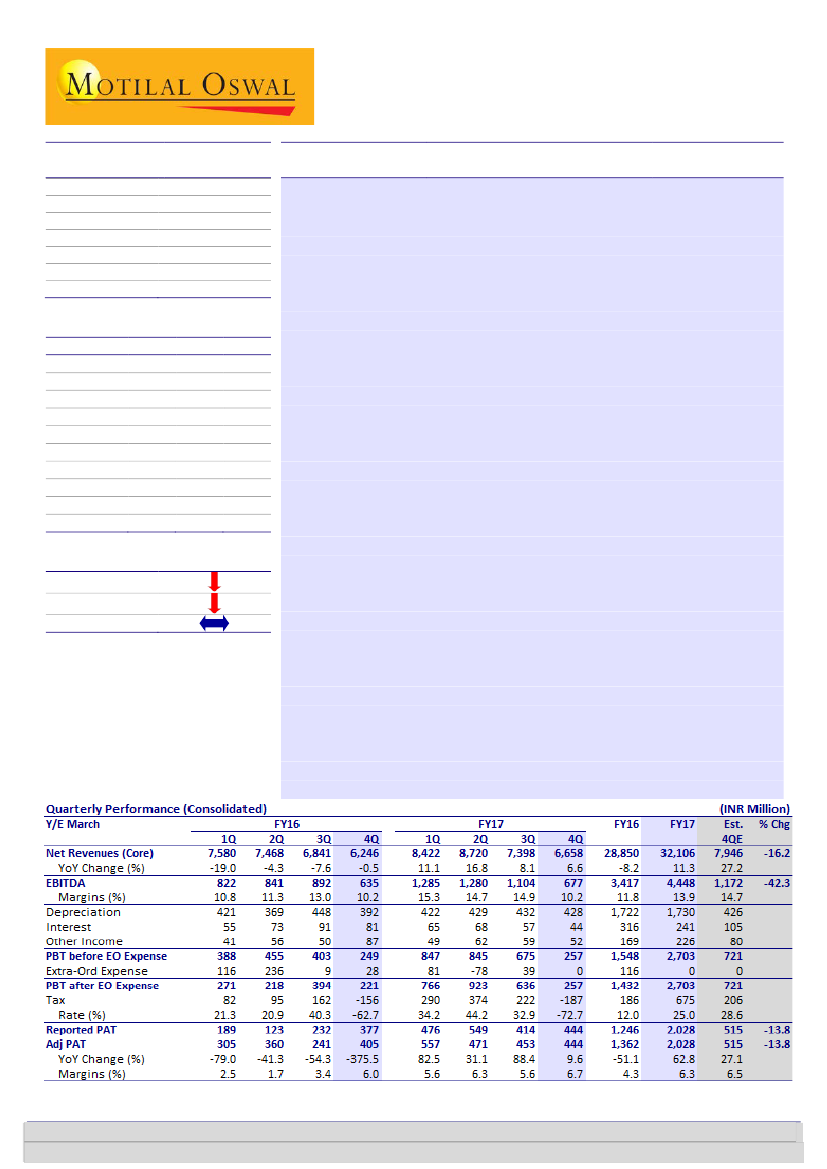
4QFY17 revenue of INR6.7b (+7% YoY) came in 16% below our estimate,
67.7 / 1.1
primarily due to muted performance by the generic and domestic
656 / 402
businesses. EBITDA margin contracted significantly to 10.2% (-480bp QoQ
-22/-32/-6
and flat YoY) due
to muted sales and lower gross margin. Reported PAT of
119
INR444m included the impact of deferred tax asset of INR237m in 4Q. For FY17
53.9
30 May 2017
4QFY17 Results Update | Sector: Healthcare
CMP: INR489
TP: INR480(-2%)
Neutral
Financials & Valuations (INR b)
2017 2018E
Y/E Mar
Net Sales
32.1
35.0
EBITDA
4.4
5.4
PAT
2.0
2.8
EPS (INR)
16.1
22.4
Gr. (%)
52.8
39.4
BV/Sh (INR)
194.1
213.1
RoE (%)
8.6
11.0
RoCE (%)
7.4
9.5
P/E (x)
30.4
21.8
P/BV (x)
2.5
2.3
2019E
40.6
6.7
3.8
29.9
33.5
238.5
13.2
11.4
16.3
2.0
Estimate change
TP change
Rating change
sales, EBITDA and Adj. PAT stood at INR32b (+11%YoY), INR4.4b (+30%YoY) and
INR2b (+53%YoY) respectively
Domestic/generic businesses deliver muted performance:
India formulation
sales grew ~11% YoY to ~INR2.8b. India business growth was impacted by the
demonetization drive. Apart from this, NLEM and FDC ban impacted domestic
revenue growth by ~4% and 2%, respectively. Management expects domestic
business to grow at ~12-14% YoY in FY18 as the impact of demonetization is
already fading. Export formulations segment declined ~10% YoY due to a fall in
generics business by ~16% YoY to INR1b and in institutional business by 34% YoY
to INR310m. Generic business declined due to weak EU sales growth.
Update on regulatory resolution:
IPCA management is planning to meet USFDA
in Jun-17 to offer invitation for Piparia inspection. Invite for Pithampur
inspection is expected by mid-3Q. Currently >90% of ANDAs are linked to API
from Ratlam. Given that the remediation process at Ratlam will only get over by
end-CY17, we do not expect full regulatory resolution before 2HFY19E.
Key earnings call takeaways:
a) R&D as % of sales expected to be ~4% in FY18E.
b) Filed 1 new ANDA in FY17; total 43 ANDA filings – 2 in market, 25 pending
and 18 approved. c) Debt of INR7.2b at FY17 end; d) Received RFP from global
funds for institutional business tender scheduled at 2018 beginning; expected to
participate without USFDA resolutions.
Resolution of regulatory issues key:
At CMP, the stock trades at 21.8x FY18E
EPS, at a discount to three-year average P/E. We do not expect a revival in US
business before 2HFY19E. Despite the stock’s attractive valuation, we believe
regulatory overhang will keep multiples under check in the near term. Reiterate
Neutral
on IPCA with a TP of INR480 @ 16x FY19E, discount of ~15-20% to its
peers (v/s INR540 @ 16x 1H FY19E). We have cut our FY18/19E EPS by ~19% as
we build in delay in USFDA resolution and muted margins in base business.
Investors are advised to refer through important disclosures made at the last page of the Research Report.
Motilal Oswal research is available on www.motilaloswal.com/Institutional-Equities, Bloomberg, Thomson Reuters, Factset and S&P Capital.
Kumar Saurabh
(Kumar.Saurabh@MotilalOswal.com); +91 22 6129 1519

Ipca Laboratories
Operating metrics
Exhibit 1: Key operating metrics
4QFY14 1QFY15 2QFY15 3QFY15 4QFY15 1QFY16 2QFY16 3QFY16 4QFY16 1QFY17 2QFY17 3QFY17 4QFY17
Revenue Mix (%)
India
International branded
International generics
Institutional business
API
Revenue Growth (%)
India
International branded
International generics
Institutional business
API
Cost of sales (%)
Raw material
Staff cost
Other expenses
Tax Rate
Margins (%)
Gross Margins
EBITDA Margins
EBIT Margins
PAT margins
26.6
13.0
21.8
15.6
23.0
12.3
10.2
32.8
11.0
21.4
1.7
76.7
32.7
16.0
27.9
24.0
31.6
12.5
17.0
12.2
26.6
17.1
17.1
58.6
(8.5)
35.4
16.5
76.0
36.9
15.0
24.1
25.7
42.3
13.0
22.0
4.6
18.2
(7.1)
18.7
18.9
(3.6)
(65.2)
(28.0)
83.3
35.0
17.7
30.6
30.9
38.0
10.1
18.4
11.2
20.5
(9.9)
13.1
(26.1)
(7.3)
(39.7)
(19.6)
84.4
37.1
18.3
28.9
33.9
36.8
10.5
23.3
4.7
24.7
(15.8)
16.5
(32.0)
(9.8)
(74.6)
(9.7)
95.4
41.2
20.7
33.5
18.0
42.4
7.3
18.6
4.0
27.7
(19.1)
8.5
(52.5)
(11.6)
(73.6)
(15.8)
90.0
39.6
21.0
29.4
21.3
44.6
6.6
17.9
6.4
24.5
(5.0)
0.1
(51.8)
(22.6)
33.2
28.0
90.1
38.1
20.1
31.8
20.9
45.7
8.9
20.4
3.6
21.4
(8.2)
10.7
(18.9)
1.8
(70.7)
(3.8)
88.2
37.2
22.0
29.0
40.3
40.8
12.1
20.9
7.7
18.7
(1.7)
9.0
13.1
(11.9)
59.9
(25.6)
91.6
35.6
24.3
31.8
(62.7)
42.0
8.9
19.8
4.5
24.5
9.4
8.5
32.7
16.6
23.3
(3.2)
86.9
38.1
21.8
26.9
34.2
47.4
8.7
17.4
4.7
21.6
15.9
23.2
52.9
12.1
(14.9)
2.5
87.2
37.5
20.6
29.1
44.2
45.9
7.9
21.2
2.9
22.2
8.4
8.7
(3.3)
12.7
(12.5)
12.1
86.1
33.2
22.0
30.9
32.9
42.3
12.7
16.4
4.7
23.5
6.8
10.9
12.2
(16.4)
(34.0)
34.7
89.8
34.8
23.8
31.2
(72.7)
67.3
24.3
21.1
16.1
63.1
24.7
20.8
15.7
65.0
17.3
12.3
7.9
62.9
16.4
10.8
7.2
58.8
5.4
(3.9)
(2.4)
60.4
10.8
5.3
4.1
61.9
11.3
6.4
4.9
62.8
13.0
6.6
3.6
64.4
10.2
4.0
6.6
61.9
15.3
10.5
6.8
62.5
14.7
10.0
5.5
66.8
14.9
9.2
6.2
65.2
10.2
3.7
6.7
Source: Company; MOSL
Valuation and view
USFDA import alert (on Ratlam, Pithampur, Piparia), subsequent stoppage of US
sales (except for few exempted products) and no business allocation from the
Global fund (70% of Institutional generic business) have led to sharp stock
correction in the last 18 months. IPCA is currently trading at 21.8x FY18E EPS, which
is at a discount to its 10 year average trading history.
At CMP, the stock trades at 21.8x FY18E EPS, which is at a discount to three-year average
P/E. We do not expect revival in US business before 2H FY19E. Despite the stock’s attractive
valuation, we believe regulatory overhang will keep multiples under check in the near term.
Reiterate
Neutral
on IPCA with a TP of INR480 @ 16x FY19E, marking a discount of ~15-20%
to its peers (vs INR540 @ 16x 1H FY19E). We have cut our FY18/19E EPS estimate by ~19% as
we build delay in US FDA resolution and muted margins in base business.
Key catalysts to drive stock’s performance over the medium term are
Higher than expected recovery in US sales, led by sharp price hikes in key
product (Hydroxychloroquine sulfate, Propranolol)
Rebound in Institutional business (anti-malarial tender), which accounted for
only 4% of sales in FY17 compared to 14% in FY14.
Improvement in domestic business growth trajectory, with focus on new
therapy introductions in chronic segments.
30 May 2017
2

Ipca Laboratories
Key risks to our investment thesis
Lack of regulatory clearance by other regulators would impact export business
outlook (~50% of sales).
Further addition of drugs in DPCO coverage could hurt domestic business.
Weakness in emerging market currencies could impair growth prospects.
Exhibit 1:
Change in Estimate
FY18E
Sales
EBITDA
PAT
New
34.9
5.4
2.8
Old
37.9
6.3
3.5
% change
-7.75
-14.43
-19.81
New
40.6
6.7
3.8
Old
44.3
7.9
4.7
FY19E
% change
-8.36
-15.23
-19.70
Source: Company, MOSL
Exhibit 2: IPCA’s 10 year average at 20.9x
81
65
49
33
17
1
22.8
4.0
15.1
PE (x)
Median(x)
Peak(x)
Min(x)
62.2
Avg(x)
Exhibit 3: IPCA’s PE relative to Sensex PE (%)
240
180
120
60
0
19.1
-60
-120
26.1
IPCA Labs. PE Relative to Sensex PE (%)
LPA (%)
3.8
Source: Company; MOSL
30 May 2017
3

Ipca Laboratories
Story in charts
Exhibit 4: Revenues grew 7%YoY
Sales (INR b)
10
19
12 16
-8 -11
-16 -19
-4 -8
YoY Growth (%)
11
17
8
7
5
16
Exhibit 5: Domestic sales impacted by demonetization
Domestic formulations (INR b)
17 19 13 16
10
8
11 9
YoY Growth (%)
23
0
9
9 11
-1
8.5 8.3 7.5 9.4 7.8 7.4 6.3 7.6 7.5 6.8 6.2 8.4 8.7 7.4 6.7
2.8 2.5 2.0 2.9 3.3 2.8 2.3 3.2 3.3 3.1 2.5 3.5 4.0 3.4 2.8
Source: Company, MOSL
Exhibit 6: Generics & Institutional business led to decline in
export formulation
Export formulations (INR b)
7
20 19 18
-16 -20
-36 -42
-26 -27
YoY Growth (%)
22 16
6
3
-10
Exhibit 7: API business increased significantly in 4QFY17
APIs (INR b)
26
15
17
-28
-20
-10 -16
28
-4
-26
-3
2
YoY Growth (%)
35
12
2
3.6 3.8 3.7 3.9 3.1 3.1 2.4 2.2 2.3 2.2 2.5 2.7 2.6 2.3 2.2
2.0 1.9 1.7 2.5 1.4 1.5 1.5 2.1 1.8 1.4 1.1 2.0 1.8 1.6 1.5
Source: Company, MOSL
Exhibit 8: Total sales to exhibit 15% CAGR from FY17-19E
Formulation (INR b)
API (INR b)
Exhibit 9: EBITDA Margins declined sequentially
EBITDA (INR b)
28 26 24 25
17 16
EBITDA Margin (%)
11 11 13 10 15 15 15 10
5
14
FY11
6
17
FY12
7
8
8
7
9
9
10
5
2.3 2.2 1.8 2.3 1.3 1.2 0.3 0.8 0.8 0.9 0.6 1.3 1.3 1.1 0.7
20
FY13
24
FY14
23
FY15
20
FY16
22
26
30
FY17 FY18E FY19E
Source: Company, MOSL
30 May 2017
4

Ipca Laboratories
Exhibit 10: Domestic revenues to grow ahead of market
DF Revenues (INR b)
16.6
16.4
10.4
6.7
5
8
FY12
9
FY13
10
FY14
11
FY15
12
FY16
14
FY17
16
19
FY12
FY13
FY14
FY15
6
8
5
3
FY16
4
FY17
5
Growth (%)
15.3
15.0
16.0
21.8
22.2
Exhibit 11: EBITDA growth to recover in FY18E
EBITDA (INR b)
24.7
16.8
11.8
15.5
16.6
7
EBITDA Margin (%)
8.2
13.9
FY18E FY19E
FY18E FY19E
Source: Company, MOSL
Exhibit 12: Gross margins v/s EBITDA margins
Gross Margin (%)
59.1
61.3
61.0
65.4
63.2
EBITDA Margin (%)
63.3
65.4
66.0
66.5
Exhibit 13: Earnings to exhibit 36% CAGR over FY17-19E
Core EPS (INR/ share)
19.8
21.8
22.2
24.7
16.8
11.8
13.9
15.5
16.6
22
26
FY13
38
FY14
20
FY15
11
FY16
16
FY17
22
30
FY11 FY12 FY13 FY14 FY15 FY16 FY17 FY18E FY19E
Source: Company, MOSL
FY12
FY18E FY19E
Source: Company, MOSL
30 May 2017
5

Ipca Laboratories
Financials and Valuations
Income Statement
Y/E Mar
Net Sales
Change (%)
EBITDA
EBITDA Margin (%)
Depreciation
EBIT
Interest
Other Income
Extraordinary items
PBT
Tax
Tax Rate (%)
Min. Int. & Assoc. Share
Reported PAT
Adjusted PAT
Change (%)
2012
23,587
24.3
5,135
21.8
671
4,464
413
-408
0
3,643
881
24.2
-9
2,771
2,771
5.4
2012
252
12,288
12,540
5,326
932
18,798
13,386
3,945
9,441
945
341
12,547
6,699
3,491
122
2,235
4,475
4,099
377
8,071
18,798
2013
28,131
19.3
6,232
22.2
867
5,365
334
-488
0
4,543
1,299
28.6
8
3,236
3,236
16.8
2013
252
15,285
15,538
5,234
1,304
22,075
15,791
4,748
11,042
1,292
90
14,545
7,410
4,178
582
2,374
4,894
4,351
544
9,651
22,075
2014
32,818
16.7
8,106
24.7
1,031
7,074
269
-500
0
6,306
1,524
24.2
-3
4,785
4,785
47.9
2014
252
19,344
19,597
4,379
1,471
25,447
19,321
5,785
13,536
1,649
92
16,827
8,476
4,495
763
3,093
6,656
5,950
706
10,171
25,447
2015
31,418
-4.3
5,291
16.8
1,796
3,495
284
358
42
3,611
1,019
28.2
49
2,542
2,501
-47.7
2015
252
21,832
22,084
8,286
1,743
32,113
25,463
7,459
18,004
2,672
162
17,285
9,266
3,530
1,248
3,242
6,011
5,471
540
11,275
32,113
2016
28,850
-8.2
3,417
11.8
1,722
1,695
316
169
-395
1,153
186
16.1
35
933
1,328
-46.9
2016
252
22,586
22,838
6,048
1,701
30,587
29,312
9,124
20,189
1,289
219
16,563
8,437
3,768
1,760
2,598
7,672
7,273
400
8,890
30,587
2017
32,106
11.3
4,448
13.9
1,730
2,718
241
226
0
2,703
675
25.0
83
1,945
1,945
46.5
2017
252
24,239
24,492
6,222
1,843
32,557
31,312
10,853
20,459
1,289
219
16,718
8,436
4,618
733
2,930
6,127
5,506
622
10,590
32,557
2018E
34,950
8.9
5,417
15.5
1,836
3,580
285
400
0
3,696
869
23.5
0
2,827
2,827
45.3
2018E
252
26,643
26,895
6,423
1,917
35,235
33,812
12,689
21,123
1,289
219
19,278
9,188
5,029
1,869
3,192
6,673
5,996
677
12,605
35,235
(INR Million)
2019E
40,586
16.1
6,743
16.6
1,944
4,799
294
430
0
4,934
1,160
23.5
0
3,775
3,775
33.5
2019E
252
29,851
30,104
6,654
2,016
38,774
36,312
14,634
21,679
1,289
219
23,337
10,669
5,840
3,121
3,706
7,749
6,963
786
15,587
38,774
Balance Sheet
Y/E Mar
Share Capital
Reserves
Net Worth
Debt
Deferred Tax
Total Capital Employed
Gross Fixed Assets
Less: Acc Depreciation
Net Fixed Assets
Capital WIP
Investments
Current Assets
Inventory
Debtors
Cash & Bank
Loans & Adv, Others
Curr Liabs & Provns
Curr. Liabilities
Provisions
Net Current Assets
Total Assets
(INR Million)
30 May 2017
6

Ipca Laboratories
Financials and Valuations
Ratios
Y/E Mar
Basic (INR)
EPS
Cash EPS
Book Value
DPS
Payout (incl. Div. Tax.)
Valuation(x)
P/E
Price / Book Value
EV/Sales
EV/EBITDA
Dividend Yield (%)
Profitability Ratios (%)
RoE
RoCE
RoIC
Turnover Ratios (%)
Asset Turnover (x)
Debtors (No. of Days)
Inventory (No. of Days)
Creditors (No. of Days)
Leverage Ratios (%)
Net Debt/Equity (x)
2012
22.0
27.3
99.4
3.7
17.0
22.3
4.9
3.1
14.2
0.8
24.0
18.3
20.9
1.8
54
104
95
0.4
2013
25.6
32.5
123.1
4.7
18.1
19.1
4.0
2.6
11.6
1.0
23.0
18.0
20.4
1.8
54
96
83
0.3
2014
37.9
46.1
155.3
5.9
15.4
12.9
3.1
2.7
11.0
1.2
27.2
22.3
24.9
1.7
50
94
100
0.2
2015
19.8
34.4
175.0
1.2
5.9
24.7
2.8
2.9
17.5
0.2
12.0
10.1
9.8
1.2
41
108
87
0.3
2016
10.5
21.0
181.0
0.0
0.0
46.5
2.7
2.7
15.1
0.0
5.9
5.5
5.4
1.0
47
107
118
0.2
2017
16.1
29.8
194.1
2.3
14.4
30.4
2.5
2.3
11.9
0.5
8.6
7.4
7.1
1.0
52
96
82
0.2
2018E
22.4
37.0
213.1
3.4
15.0
21.8
2.3
2.3
11.9
0.7
11.0
9.5
8.8
1.0
52
96
83
0.2
2019E
29.9
45.3
238.5
4.5
15.0
16.3
2.0
0.0
0.0
0.9
13.2
11.4
11.1
1.1
52
96
85
0.1
Cash Flow Statement
Y/E Mar
Adjusted EBITDA
Non cash opr. exp (inc)
(Inc)/Dec in Wkg. Cap.
Tax Paid
Other operating activities
CF from Op. Activity
(Inc)/Dec in FA & CWIP
Free cash flows
(Pur)/Sale of Invt
Others
CF from Inv. Activity
Inc/(Dec) in Net Worth
Inc / (Dec) in Debt
Interest Paid
Divd Paid (incl Tax) & Others
CF from Fin. Activity
Inc/(Dec) in Cash
Add: Opening Balance
Closing Balance
2012
5,135
-408
39
-757
0
4,010
-3,315
695
68
0
-3,247
1
25
-413
-357
-744
18
104
122
2013
6,232
-488
-1,119
-927
0
3,698
-2,752
946
251
0
-2,501
0
-93
-334
-309
-736
461
122
582
2014
8,106
-500
-339
-1,357
0
5,910
-3,887
2,023
-1
0
-3,888
0
-854
-269
-718
-1,841
180
582
763
2015
5,291
358
-619
-747
42
4,324
-7,166
-2,842
-70
0
-7,236
0
3,906
-284
-224
3,398
486
763
1,248
2016
3,417
169
2,896
-228
-395
5,860
-2,466
3,394
-57
0
-2,523
0
-2,238
-316
-271
-2,825
512
1,248
1,760
2017
4,448
226
-2,727
-533
0
1,414
-2,000
-586
0
0
-2,000
0
175
-241
-374
-441
-1,027
1,760
733
2018E
5,417
400
-878
-795
0
4,144
-2,500
1,644
0
0
-2,500
0
201
-285
-424
-508
1,136
733
1,869
(INR Million)
2019E
6,743
430
-1,731
-1,061
0
4,381
-2,500
1,881
0
0
-2,500
0
231
-294
-566
-629
1,252
1,869
3,121
30 May 2017
7

Ipca Laboratories
Corporate profile
Established in 1949, IPCA Labs is one of India's
better managed mid-sized pharma companies. It
has presence in (1) domestic branded formulations,
(2) global branded and generic formulations, and (3)
global APIs (active pharmaceutical ingredients).
IPCA's core business strategy is to leverage its
strength in manufacturing API to develop vertically
integrated and highly competitive formulations.
Most of the company's formulations are backed by
its own APIs.
Source: MOSL/Bloomberg
Company description
Exhibit 1: Sensex rebased
Exhibit 2: Shareholding pattern (%)
Mar-17
Promoter
DII
FII
Others
46.1
21.7
15.6
16.6
Dec-16
46.1
22.2
15.8
15.9
Mar-16
45.9
16.6
21.6
15.9
Source: Capitaline
Exhibit 3: Top holders
Holder Name
ICICI Prudential
HDFC Trustee Company Ltd.
Lavender Investments Limited
DSP Blackrock
Axis Mutual Fund Trustee Limited
% Holding
6.8
4.7
4.0
3.2
1.8
Source: Capitaline
Note: FII Includes depository receipts
Exhibit 4: Top management
Name
Premchand Godha
A K Jain
Harish P Kamath
Designation
Chairman & Managing
Director
Joint
Managing
Director
Company Secretary
Exhibit 5: Directors
Name
Anand T Kusre
Dev Parkash Yadava
Pranay Godha
Ramakanta Panda
Name
Babulal Jain
Manisha Premnath
Prashant Godha
*Independent
Source: Capitaline
Exhibit 6: Auditors
Name
ABK & Associates
Natvarlal Vepari & Company
Parikh & Associates
Type
Cost Auditor
Statutory
Secretarial Audit
Exhibit 7: MOSL forecast v/s consensus
EPS
(INR)
FY18
FY19
MOSL
forecast
22.4
29.9
Consensus
forecast
25.5
33.8
Variation (%)
-12.3
-11.6
Source: Bloomberg
Source: Capitaline
30 May 2017
8

Ipca Laboratories
NOTES
30 May 2017
9

Disclosures
This document has been prepared by Motilal Oswal Securities Limited (hereinafter referred to as Most) to provide information about the company (ies) and/sector(s), if any, covered in the report and may be distributed by it
and/or its affiliated company(ies). This report is for personal information of the selected recipient/s and does not construe to be any investment, legal or taxation advice to you. This research report does not constitute an
offer, invitation or inducement to invest in securities or other investments and Motilal Oswal Securities Limited (hereinafter referred as MOSt) is not soliciting any action based upon it. This report is not for public distribution
and has been furnished to you solely for your general information and should not be reproduced or redistributed to any other person in any form. This report does not constitute a personal recommendation or take into
account the particular investment objectives, financial situations, or needs of individual clients. Before acting on any advice or recommendation in this material, investors should consider whether it is suitable for their
particular circumstances and, if necessary, seek professional advice. The price and value of the investments referred to in this material and the income from them may go down as well as up, and investors may realize losses
on any investments. Past performance is not a guide for future performance, future returns are not guaranteed and a loss of original capital may occur.
MOSt and its affiliates are a full-service, integrated investment banking, investment management, brokerage and financing group. We and our affiliates have investment banking and other business relationships with a some
companies covered by our Research Department. Our research professionals may provide input into our investment banking and other business selection processes. Investors should assume that MOSt and/or its affiliates are
seeking or will seek investment banking or other business from the company or companies that are the subject of this material and that the research professionals who were involved in preparing this material may educate
investors on investments in such business . The research professionals responsible for the preparation of this document may interact with trading desk personnel, sales personnel and other parties for the purpose of
gathering, applying and interpreting information. Our research professionals are paid on twin parameters of performance & profitability of MOSt.
MOSt generally prohibits its analysts, persons reporting to analysts, and members of their households from maintaining a financial interest in the securities or derivatives of any companies that the analysts cover.
Additionally, MOSt generally prohibits its analysts and persons reporting to analysts from serving as an officer, director, or advisory board member of any companies that the analysts cover. Our salespeople, traders, and
other professionals or affiliates may provide oral or written market commentary or trading strategies to our clients that reflect opinions that are contrary to the opinions expressed herein, and our proprietary trading and
investing businesses may make investment decisions that are inconsistent with the recommendations expressed herein. In reviewing these materials, you should be aware that any or all of the foregoing among other things,
may give rise to real or potential conflicts of interest. MOSt and its affiliated company(ies), their directors and employees and their relatives may; (a) from time to time, have a long or short position in, act as principal in, and
buy or sell the securities or derivatives thereof of companies mentioned herein. (b) be engaged in any other transaction involving such securities and earn brokerage or other compensation or act as a market maker in the
financial instruments of the company(ies) discussed herein or act as an advisor or lender/borrower to such company(ies) or may have any other potential conflict of interests with respect to any recommendation and other
related information and opinions.; however the same shall have no bearing whatsoever on the specific recommendations made by the analyst(s), as the recommendations made by the analyst(s) are completely independent
of the views of the affiliates of MOSt even though there might exist an inherent conflict of interest in some of the stocks mentioned in the research report
Reports based on technical and derivative analysis center on studying charts company's price movement, outstanding positions and trading volume, as opposed to focusing on a company's fundamentals and, as such, may not match with a report on a
company's fundamental analysis. In addition MOST has different business segments / Divisions with independent research separated by Chinese walls catering to different set of customers having various objectives, risk profiles, investment horizon,
etc, and therefore may at times have different contrary views on stocks sectors and markets.
Unauthorized disclosure, use, dissemination or copying (either whole or partial) of this information, is prohibited. The person accessing this information specifically agrees to exempt MOSt or any of its affiliates or employees
from, any and all responsibility/liability arising from such misuse and agrees not to hold MOSt or any of its affiliates or employees responsible for any such misuse and further agrees to hold MOSt or any of its affiliates or
employees free and harmless from all losses, costs, damages, expenses that may be suffered by the person accessing this information due to any errors and delays. The information contained herein is based on publicly
available data or other sources believed to be reliable. Any statements contained in this report attributed to a third party represent MOSt’s interpretation of the data, information and/or opinions provided by that third party
either publicly or through a subscription service, and such use and interpretation have not been reviewed by the third party. This Report is not intended to be a complete statement or summary of the securities, markets or
developments referred to in the document. While we would endeavor to update the information herein on reasonable basis, MOSt and/or its affiliates are under no obligation to update the information. Also there may be
regulatory, compliance, or other reasons that may prevent MOSt and/or its affiliates from doing so. MOSt or any of its affiliates or employees shall not be in any way responsible and liable for any loss or damage that may
arise to any person from any inadvertent error in the information contained in this report. MOSt or any of its affiliates or employees do not provide, at any time, any express or implied warranty of any kind, regarding any
matter pertaining to this report, including without limitation the implied warranties of merchantability, fitness for a particular purpose, and non-infringement. The recipients of this report should rely on their own
investigations.
This report is intended for distribution to institutional investors. Recipients who are not institutional investors should seek advice of their independent financial advisor prior to taking any investment decision based on this
report or for any necessary explanation of its contents.
Most and it’s associates may have managed or co-managed public offering of securities, may have received compensation for investment banking or merchant banking or brokerage services, may have received any
compensation for products or services other than investment banking or merchant banking or brokerage services from the subject company in the past 12 months.
Most and it’s associates have not received any compensation or other benefits from the subject company or third party in connection with the research report.
Subject Company may have been a client of Most or its associates during twelve months preceding the date of distribution of the research report
MOSt and/or its affiliates and/or employees may have interests/positions, financial or otherwise of over 1 % at the end of the month immediately preceding the date of publication of the research in the securities mentioned
in this report. To enhance transparency, MOSt has incorporated a Disclosure of Interest Statement in this document. This should, however, not be treated as endorsement of the views expressed in the report.
Motilal Oswal Securities Limited is registered as a Research Analyst under SEBI (Research Analyst) Regulations, 2014. SEBI Reg. No. INH000000412
Pending Regulatory inspections against Motilal Oswal Securities Limited:
SEBI pursuant to a complaint from client Shri C.R. Mohanraj alleging unauthorized trading, issued a letter dated 29th April 2014 to MOSL notifying appointment of an Adjudicating Officer as per SEBI regulations to hold inquiry
and adjudge violation of SEBI Regulations; MOSL replied to the Show Cause Notice whereby SEBI granted us an opportunity of Inspection of Documents. Since all the documents requested by us were not covered we have
requested to SEBI vide our letter dated June 23, 2015 to provide pending list of documents for inspection.
List of associate companies of Motilal Oswal Securities Limited -Click
here to access detailed report
Analyst Certification
The views expressed in this research report accurately reflect the personal views of the analyst(s) about the subject securities or issues, and no part of the compensation of the research analyst(s) was, is, or will be directly or
indirectly related to the specific recommendations and views expressed by research analyst(s) in this report. The research analysts, strategists, or research associates principally responsible for preparation of MOSt research
receive compensation based upon various factors, including quality of research, investor client feedback, stock picking, competitive factors and firm revenues
Ipca Laboratories
Disclosure of Interest Statement
Analyst ownership of the stock
No
Served as an officer, director or employee -
No
A graph of daily closing prices of securities is available at www.nseindia.com and http://economictimes.indiatimes.com/markets/stocks/stock-quotes
Regional Disclosures (outside India)
This report is not directed or intended for distribution to or use by any person or entity resident in a state, country or any jurisdiction, where such distribution, publication, availability or use would be contrary to law,
regulation or which would subject MOSt & its group companies to registration or licensing requirements within such jurisdictions.
For Hong Kong:
This report is distributed in Hong Kong by Motilal Oswal capital Markets (Hong Kong) Private Limited, a licensed corporation (CE AYY-301) licensed and regulated by the Hong Kong Securities and Futures
Commission (SFC) pursuant to the Securities and Futures Ordinance (Chapter 571 of the Laws of Hong Kong) “SFO”. As per SEBI (Research Analyst Regulations) 2014 Motilal Oswal Securities (SEBI Reg No. INH000000412) has
an agreement with Motilal Oswal capital Markets (Hong Kong) Private Limited for distribution of research report in Kong Kong. This report is intended for distribution only to “Professional Investors” as defined in Part I of
Schedule 1 to SFO. Any investment or investment activity to which this document relates is only available to professional investor and will be engaged only with professional investors.” Nothing here is an offer or solicitation
of these securities, products and services in any jurisdiction where their offer or sale is not qualified or exempt from registration. The Indian Analyst(s) who compile this report is/are not located in Hong Kong & are not
conducting Research Analysis in Hong Kong.
For U.S.
Motilal Oswal Securities Limited (MOSL) is not a registered broker - dealer under the U.S. Securities Exchange Act of 1934, as amended (the"1934 act") and under applicable state laws in the United States. In addition MOSL is
not a registered investment adviser under the U.S. Investment Advisers Act of 1940, as amended (the "Advisers Act" and together with the 1934 Act, the "Acts), and under applicable state laws in the United States.
Accordingly, in the absence of specific exemption under the Acts, any brokerage and investment services provided by MOSL, including the products and services described herein are not available to or intended for U.S.
persons.
This report is intended for distribution only to "Major Institutional Investors" as defined by Rule 15a-6(b)(4) of the Exchange Act and interpretations thereof by SEC (henceforth referred to as "major institutional investors").
This document must not be acted on or relied on by persons who are not major institutional investors. Any investment or investment activity to which this document relates is only available to major institutional investors
and will be engaged in only with major institutional investors. In reliance on the exemption from registration provided by Rule 15a-6 of the U.S. Securities Exchange Act of 1934, as amended (the "Exchange Act") and
interpretations thereof by the U.S. Securities and Exchange Commission ("SEC") in order to conduct business with Institutional Investors based in the U.S., MOSL has entered into a chaperoning agreement with a U.S.
registered broker-dealer, Motilal Oswal Securities International Private Limited. ("MOSIPL"). Any business interaction pursuant to this report will have to be executed within the provisions of this chaperoning agreement.
The Research Analysts contributing to the report may not be registered /qualified as research analyst with FINRA. Such research analyst may not be associated persons of the U.S. registered broker-dealer, MOSIPL, and
therefore, may not be subject to NASD rule 2711 and NYSE Rule 472 restrictions on communication with a subject company, public appearances and trading securities held by a research analyst account.
For Singapore
Motilal Oswal Capital Markets Singapore Pte Limited is acting as an exempt financial advisor under section 23(1)(f) of the Financial Advisers Act(FAA) read with regulation 17(1)(d) of the Financial Advisors Regulations and is a
subsidiary of Motilal Oswal Securities Limited in India. This research is distributed in Singapore by Motilal Oswal Capital Markets Singapore Pte Limited and it is only directed in Singapore to accredited investors, as defined in
the Financial Advisers Regulations and the Securities and Futures Act (Chapter 289), as amended from time to time.
In respect of any matter arising from or in connection with the research you could contact the following representatives of Motilal Oswal Capital Markets Singapore Pte Limited:
Varun Kumar
Varun.kumar@motilaloswal.com
Contact : (+65) 68189232
Office Address:21 (Suite 31),16 Collyer Quay,Singapore 04931
IPCA LABORATORIES
30 May 2017
Motilal Oswal Tower, Level 9, Sayani Road, Prabhadevi, Mumbai 400 025
Phone: +91 22 3982 5500 E-mail: reports@motilaloswal.com
Motilal Oswal Securities Ltd
10