Eveready Industries
BSE SENSEX
31,146
Bloomberg
Equity Shares (m)
M.Cap.(INRb)/(USDb)
52-Week Range (INR)
1, 6, 12 Rel. Per (%)
Avg Val, INRm
Free float (%)
Financials & Valuations (INR b)
2017
2018E
Y/E Mar
Net Sales
13.6
15.3
EBITDA
1.3
1.6
PAT
0.9
1.0
EPS (INR)
12.9
14.4
Gr. (%)
35.5
12.1
BV/Sh (INR)
39.8
49.6
RoE (%)
37.7
32.3
RoCE (%)
27.5
25.1
P/E (x)
24.8
22.1
P/BV (x)
8.0
6.4
S&P CNX
9,621
EVRIN IN
Appliance and Lighting to drive growth ahead
73
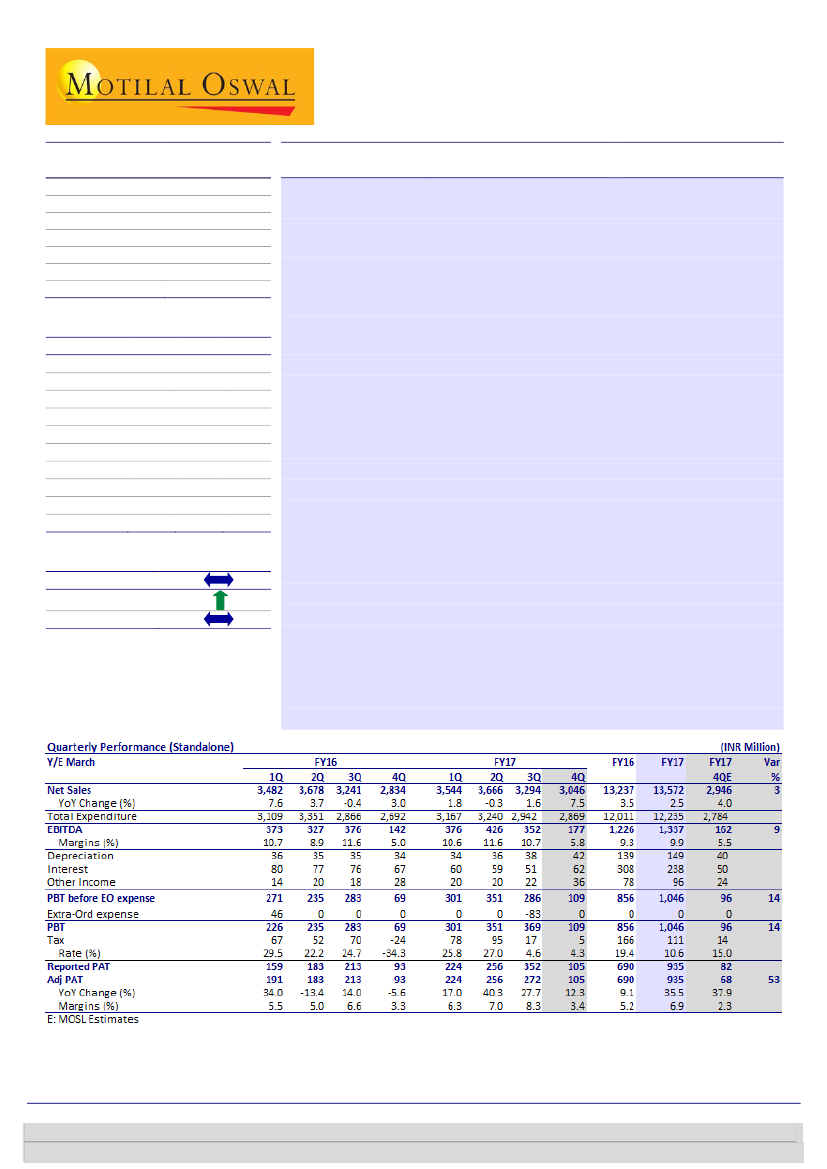
Revenue in-line, PAT beats estimates:
EVRIN reported overall revenue of
17.5 / 0.3
INR3,046m in 4QFY17 (est. of INR2,946m) v/s INR2,834m in 4QFY16,
335 / 190
marking an increase of 7.5%, mainly due to significant turnover growth in
0/30/19
lighting and appliances segments. Lighting grew robustly by 26% in 4QFY17.
47
EBITDA rose 24% YoY to INR177m (est. of INR162m), with the margin
56.0
31 May 2017
4QFY17 Results Update | Sector: Others
CMP: INR319
TP: INR368(+15%)
Buy
2019E
16.8
1.8
1.3
17.5
21.4
61.2
31.6
26.9
18.2
5.2
Estimate change
TP change
Rating change
expanding 80bp to 5.8% (est. of 5.5%). Adj. PAT thus grew from INR93m to
INR105m (est. INR68m), marking YoY growth of 12.3%. For FY17, EBITDA
margin stood at 10% (+60bp YoY) and PAT at INR935m (+35% YoY).
Significant opportunity in appliance:
Revenue from appliance segment
stood at INR400m in FY17 – the first year of operations. EVRIN plans to
achieve revenue of INR1b in FY18 from appliance (making the segment
EBITDA breakeven) and then ~INR2,500m by FY20. The size of fan &
appliance market stands at INR150b, with average industry growth at 10-
15%. We believe EVRIN has significant opportunity to grow this business,
with access to 6,000 retail outlets (200 distributors). It plans to increase
outlets to 10,000 by FY18. The business can generate asset turnover of 5x.
JV with McLeod to develop packet tea business:
EVRIN will initiate
discussions with McLeod for a JV to develop its packet tea business.
Management cited McLeod will invest required capital for marketing of tea
business and will bring in its expertise/sourcing capabilities. EVRIN has
access to 1m outlets, allowing it to aggressively grow the business.
Valuation and view:
We believe that appliances and LED businesses will
drive growth for Eveready, leveraging upon its strong brand and distribution
network. We thus maintain our earnings estimates. We expect revenue
CAGR of 11% and PAT CAGR of 17% over FY17-19E. We value the stock at
21x FY19E, and maintain
Buy
with a target price of INR368.
Investors are advised to refer through important disclosures made at the last page of the Research Report.
Motilal Oswal research is available on www.motilaloswal.com/Institutional-Equities, Bloomberg, Thomson Reuters, Factset and S&P Capital.
Niket Shah
(Niket.Shah@MotilalOswal.com); +91 22 6129 1535
Chintan Modi
(Chintan.Modi@MotilalOswal.com); +91 22 6129 1554

Eveready Industries
Revenue in-line, PAT beats estimates
EVRIN reported overall revenue of INR3,046m in 4QFY17 (est. INR2,946m) as
against INR2,834m in 4QFY16 marking a growth of 7.5% YoY, mainly due to
significant turnover growth in the lighting and appliances segment.
The lighting segment registered a robust growth of 26% in 4QFY17. Turnover for
LED products registered a yearly turnover of INR1.9b vs INR1b in FY16 growing
83%.
EBITDA margins increased 80bp YoY to 5.8% in 4QFY17 (est. 5.5%) compared to
5% in 4QFY16. EBITDA stood at INR177m (est. INR162m) as against INR142m in
4QFY16, growth of 24%.
Consequently, adjusted PAT grew from INR93m in 4QFY16 to INR105m (est.
INR68m) in 4QFY17 marking a growth of 12.3% YoY. For FY17, EBITDA margin
stood at 10%, up 60bp and PAT increased 35% YoY to INR935m.
Exhibit 1: Revenue trend
Revenue (INRm)
3,236
15.7%
11.0%
9.7%
6.9%
7.6%
3.7%
-0.4%
3.0% 1.8%
-0.3%
1.6%
3,548
3,254
3,482
2,751
3,678
3,241
2,834
7.5%
Growth YoY (%)
3,544
3,666
3,294
3,046
Source: MOSL, Company
Exhibit 2: EBITDA trend
EBITDA (INRm)
10.5%
10.4%
10.3%
EBITDA Margins (%)
Exhibit 3: PAT trend
PAT (INRm)
6.6%
3.3%
PAT Margin (%)
6.3%
7.0%
8.3%
3.4%
11.6%
11.6%
10.7%
10.7%
10.6%
8.9%
7.0%
5.8%
5.0%
4.4%
5.9% 5.8%
3.6%
5.5% 5.0%
332 370 342 193 373 327 376 142 376 426 352 177
143 211 187 99 191 183 213 93 224 256 272 105
Source: MOSL, Company
Lighting to drive growth, Battery trend flattish
The lighting segment contributes 22% to the total revenue and has grown 8% in
FY17 YoY, led by the growth in LED segment. LED clocked a revenue of
INR2,000m in FY17 forming 2/3
rd
of the total lighting revenue, out of which
INR500m was from government business and EVRIN plans to grow the
remaining INR1,500m to ~INR2,500 in FY18.
Flashlight segment too witnessed a volume growth of 7-8% in FY17 and with
better monsoon being predicted, the growth is further expected to increase.
31 May 2017
2

Eveready Industries
However, on value terms, flashlight remained flattish because of pricing benefits
being passed on to the market.
EVRIN commissioned its largest battery plant in Assam in Mar’17 which is
expected to contribute 40-50% in FY18. Presently operating at 65% utilization,
the plant is also expected to contribute ~9m flashlights in the coming year.
Going forward, battery is expected to continue its flattish trend in growth, CFL
to further decline 50% in FY18, LED margins expected to be ~10% and margins in
flashlight to remain stable on account of better monsoon being expected.
Valuation and view
Over FY17-19E, we expect EVRIN’s revenue to grow at 11% CAGR (to INR16.8b in
FY19E), EBITDA margin to expand 110bp (to 11%), adj. PAT to grow at 17% CAGR
and return ratios to improve (adj. RoCE to be 26.9% in FY19E).
We believe that appliances and LED businesses will drive growth for Eveready,
leveraging upon its strong brand. We thus maintain our earnings estimates. We
value the stock at 21x FY19E, and maintain Buy with a target price of INR368.
Exhibit 5: Price to book (one-year forward)
Exhibit 4: Price to earnings (one-year forward)
Source: MOSL, Company
31 May 2017
3

Eveready Industries
Story in charts
Exhibit 6: Chinese players dominate unorg. Battery market
Unorganise
d, 10
Exhibit 7: EIIL has consistently led the organized market
Others, 2
Panasonic ,
18
Nippo, 28
Organised,
90
Source: MOSL, Company
Eveready,
52
Source: MOSL, Company
Exhibit 8: Consistent spends lead to top of the mind recall
Advt & Sales promo exp (INR m)
5.2
5.6
4.6 4.4
6.3
4.1
5.8
3.5
3.1
% of revenue
5.1 5.0 5.0
Exhibit 9: Distribution strength matches top FMCG players
8.0
4.8
3.6
3.2
FY06 FY07 FY08 FY09 FY10 FY11 FY12 FY13 FY14 FY15 FY16 FY17
Source: MOSL, Company
HUL
Colgate
Marico
Eveready
Source: MOSL, Company
Exhibit 10: RoE to improve to 32%
RoE (%)
38
32
32
Exhibit 11: Net debt to equity to reduce to 0.17x
Net Debt to Equity (x)
0.72
0.46
0.70
0.63
0.38
0.17
17
10
5
FY14
FY15
FY16E
FY17
FY18E
FY19E
0.38
0.35
FY12
FY13
FY14
FY15
FY16
FY17
FY18E FY19E
Source: MOSL, Company
31 May 2017
4

Eveready Industries
Exhibit 12: Key assumptions (INR m)
Y/E March
Sales Value (INR Million)
Battery
Flashlight
Tea
Electrical & Lightings
CFL
GLS
Led Lamp
Led Lamp (Govt order)
Luminaire
Small Appliances
Total Sales Value
Sales Value Growth %
Battery
Flashlight
Tea
Electrical & Lightings
CFL
GLS
Led Lamp
Total Growth %
Notes
FY12
5,854
2,151
724
1,033
707
317
-
-
9,762
2%
5%
-1%
6%
-2%
67%
-
3%
FY13
6,038
2,516
745
1,044
699
317
-
7
10,343
3%
17%
3%
1%
-1%
0%
-
6%
FY14
6,870
2,441
768
1,444
934
385
14
31
11,523
14%
-3%
3%
38%
34%
21%
-
11%
FY15
7,700
2,417
762
1,898
1,121
431
182
47
12,778
12%
-1%
-1%
31%
20%
12%
1229%
11%
FY16
8,171
2,118
722
2,849
1,256
452
898
74
82
13,943
6%
-12%
-5%
50%
12%
5%
395%
9%
FY17
7,814
2,131
710
3,126
540
450
1,120
480
350
426
14,208
-4%
1%
-2%
10%
-57%
-1%
78%
2%
FY18E
8,127
2,152
746
3,485
270
459
1,428
350
662
810
15,319
4%
1%
5%
11%
-50%
2%
11%
8%
FY19E
8,452
2,174
783
4,211
135
468
1,799
315
1,042
1,215
16,816
4%
1%
5%
21%
-50%
2%
19%
10%
31 May 2017
5

Eveready Industries
Financials and Valuations
Income Statement
Y/E Mar
Net Sales
Change (%)
EBITDA
EBITDA Margin (%)
Depreciation
EBIT
Interest
Other Income
Extraordinary items
PBT
Tax
Tax Rate (%)
Min. Int. & Assoc. Share
Reported PAT
Adjusted PAT
Change (%)
2012
11,001
2.4
424
3.9
292
132
383
150
-773
-874
7
-0.8
0
-881
-102
-141.1
2012
363
4,711
5,075
3,720
147
8,917
13,517
5,562
7,955
111
0
3,635
2,321
619
72
623
2,846
2,615
231
789
8,917
2013
10,353
-5.9
654
6.3
170
484
405
94
-181
-8
-58
753.5
0
51
139
-235.9
2013
363
5,478
5,841
2,761
134
8,736
13,296
5,659
7,637
89
0
3,317
2,210
442
46
620
2,357
2,187
170
961
8,736
2014
11,534
11.4
907
7.9
253
654
411
87
-165
165
29
17.5
0
136
272
96.4
2014
363
5,571
5,935
2,251
149
8,334
13,173
5,870
7,303
144
0
3,629
2,569
490
11
559
2,785
2,566
219
845
8,334
2015
12,789
10.9
1,240
9.7
155
1,085
340
39
-165
619
130
21.0
0
489
620
127.7
2015
363
5,883
6,246
2,278
148
8,672
13,255
6,292
6,964
278
0
3,715
2,596
489
71
559
2,344
2,169
175
1,371
8,672
2016
13,237
3.5
1,226
9.3
139
1,087
308
78
0
856
166
19.4
0
690
690
11.4
2016
363
1,700
2,063
1,515
0
3,578
8,662
6,431
2,232
210
0
4,252
2,381
705
72
1,094
3,116
2,949
167
1,136
3,578
2017
13,572
2.5
1,337
9.9
149
1,188
238
96
0
1,046
111
10.6
0
935
935
35.5
2017
363
2,532
2,895
1,866
12
4,774
9,954
6,580
3,374
32
0
4,647
2,844
839
56
908
3,280
3,079
200
1,368
4,774
(INR Million)
2018E
15,319
12.9
1,578
10.3
135
1,443
233
101
0
1,311
262
20.0
0
1,048
1,048
12.1
2018E
363
3,240
3,603
1,466
12
5,083
10,254
6,715
3,538
0
0
4,892
2,853
839
110
1,089
3,349
3,113
236
1,543
5,083
2019E
16,816
9.8
1,850
11.0
139
1,710
163
106
0
1,654
380
23.0
0
1,273
1,273
21.4
2019E
363
4,088
4,451
866
12
5,331
10,554
6,855
3,699
0
0
5,183
2,985
875
125
1,198
3,552
3,269
283
1,631
5,331
Balance Sheet
Y/E Mar
Share Capital
Reserves
Net Worth
Debt
Deferred Tax
Total Capital Employed
Gross Fixed Assets
Less: Acc Depreciation
Net Fixed Assets
Capital WIP
Investments
Current Assets
Inventory
Debtors
Cash & Bank
Loans & Adv, Others
Curr Liabs & Provns
Curr. Liabilities
Provisions
Net Current Assets
Total Assets
(INR Million)
31 May 2017
6

Eveready Industries
Financials and Valuations
Ratios
Y/E Mar
Basic (INR)
EPS
Cash EPS
Book Value
DPS
Payout (incl. Div. Tax.)
Valuation(x)
P/E
Price / Book Value
EV/Sales
EV/EBITDA
Dividend Yield (%)
Profitability Ratios (%)
RoE
RoCE
RoIC
Turnover Ratios (%)
Asset Turnover (x)
Debtors (No. of Days)
Inventory (No. of Days)
Creditors (No. of Days)
Leverage Ratios (%)
Net Debt/Equity (x)
2012
-1.4
2.6
69.8
0.0
0.0
2013
1.9
4.2
80.4
0.0
0.0
167.3
4.0
39.6
0.0
2.5
-43.4
-36.5
1.2
15
117
116
0.5
2013
-8
351
336
76
-134
23
644
-101
543
0
-55
-156
0
-97
-417
0
-514
-26
72
46
2014
3.7
7.2
81.7
0.5
31.0
85.2
3.9
2.2
28.0
0.2
4.6
7.3
6.4
1.4
15
122
122
0.4
2014
165
418
408
3
7
-69
931
-66
865
0
3
-63
0
-499
-398
-5
-902
-35
46
11
2015
8.5
10.7
85.9
0.0
0.0
37.4
3.7
2.0
20.5
0.0
10.2
10.6
10.4
1.5
13
117
98
0.4
2015
619
320
314
-103
-440
7
717
-323
394
0
33
-290
0
36
-362
-42
-368
60
11
71
2016
9.5
11.4
28.4
2.3
27.7
33.6
11.2
1.9
20.1
0.7
16.6
15.5
15.1
3.7
18
105
130
0.7
2016
856
139
308
-150
323
0
1,476
-259
1,217
0
-15
-274
0
-762
-308
-191
-1,201
1
71
72
2017
12.9
14.9
39.8
3.0
27.3
24.8
8.0
1.8
18.7
0.9
37.7
27.5
26.6
2.8
22
124
134
0.6
2017
1,046
149
238
-67
-248
0
1,119
-1,113
5
0
121
-992
0
351
-238
-255
-142
-16
72
57
2018E
14.4
16.3
49.6
4.0
32.4
22.1
6.4
1.6
15.6
1.3
32.3
25.1
23.9
3.0
19
110
120
0.4
2018E
1,311
135
233
-262
-122
0
1,295
-268
1,027
0
0
-268
0
-400
-233
-340
-973
54
57
110
2019E
17.5
19.4
61.2
5.0
33.4
18.2
5.2
1.4
12.9
1.6
31.6
26.9
25.9
3.2
18
105
115
0.2
2019E
1,654
139
163
-380
-73
0
1,503
-300
1,203
0
0
-300
0
-600
-163
-425
-1,188
15
110
125
0.0
-1.8
3.1
1.5
1.2
20
118
133
0.7
2012
-874
292
353
49
-119
693
393
-257
135
0
58
-199
0
138
-367
-42
-271
-78
150
72
Cash Flow Statement
Y/E Mar
Adjusted EBITDA
Depreciation
Interest & Finance Charges
Direct Taxes Paid
(Inc)/Dec in WC
Other operating activities
CF from Op. Activity
(Inc)/Dec in FA & CWIP
Free cash flows
(Pur)/Sale of Invt
Others
CF from Inv. Activity
Inc/(Dec) in Net Worth
Inc / (Dec) in Debt
Interest Paid
Divd Paid (incl Tax) & Others
CF from Fin. Activity
Inc/(Dec) in Cash
Add: Opening Balance
Closing Balance
(INR Million)
31 May 2017
7

Eveready Industries
Corporate profile
Company description
EIIL has a well-diversified product portfolio spanning
four products, with strong leadership in two key
products segments—batteries (~52% market share)
and flashlights (~70% market share). It commands
premium pricing over peers driven by regular brand
building exercise and vast distribution network (3.2m
outlets) unmatched by its peers. Battery segment
contributes 60% to revenues, flashlights contribute
19% to revenues, lighting and electrical contribute
15% to revenues while packet tea contributes
balance.
Exhibit 2: Shareholding pattern (%)
Mar-17
Promoter
DII
FII
Others
44.1
11.7
23.4
20.8
Dec-16
44.0
18.4
15.7
21.9
Mar-16
44.0
8.3
22.9
24.8
Source: Capitaline
Exhibit 1: Sensex rebased
Source: MOSL/Bloomberg
Exhibit 3: Top holders
Holder Name
DSP BLACKROCK MICRO CAP FUND
AMANSA HOLDINGS PRIVATE LIMITED
NOMURA INDIA INVESTMENT FUND
MOTHER FUND
FRANKLIN TEMPLETON INVESTMENT FUNDS
MALABAR INDIA FUND LIMITED
% Holding
6.2
5.6
3.7
3.2
2.1
Source: Capitaline
Note: FII Includes depository receipts
Exhibit 4: Top management
Name
B M Khaitan
Aditya Khaitan
Amritanshu Khaitan
S Saha
T Punwani
Designation
Chairman
Vice Chairman
Managing Director
Whole Time Director & CFO
Company Secretary
Exhibit 5: Directors
Name
Ramni Nirula
Sanjiv Goenka
Name
S R Dasgupta
Sudipto Sarkar
Source: Capitaline
*Independent
Exhibit 6: Auditors
Name
Deloitte Haskins & Sells
Mani & Co
Type
Statutory
Cost Auditor
Exhibit 7: MOSL forecast v/s consensus
EPS
(INR)
FY18
FY19
MOSL
forecast
14.4
17.5
Consensus
forecast
13.8
16.6
Variation (%)
4.6
5.4
Source: Bloomberg
Source: Capitaline
31 May 2017
8

Eveready Industries
NOTES
31 May 2017
9

Disclosures
This document has been prepared by Motilal Oswal Securities Limited (hereinafter referred to as Most) to provide information about the company (ies) and/sector(s), if any, covered in the report and may be distributed by it
and/or its affiliated company(ies). This report is for personal information of the selected recipient/s and does not construe to be any investment, legal or taxation advice to you. This research report does not constitute an
offer, invitation or inducement to invest in securities or other investments and Motilal Oswal Securities Limited (hereinafter referred as MOSt) is not soliciting any action based upon it. This report is not for public distribution
and has been furnished to you solely for your general information and should not be reproduced or redistributed to any other person in any form. This report does not constitute a personal recommendation or take into
account the particular investment objectives, financial situations, or needs of individual clients. Before acting on any advice or recommendation in this material, investors should consider whether it is suitable for their
particular circumstances and, if necessary, seek professional advice. The price and value of the investments referred to in this material and the income from them may go down as well as up, and investors may realize losses
on any investments. Past performance is not a guide for future performance, future returns are not guaranteed and a loss of original capital may occur.
MOSt and its affiliates are a full-service, integrated investment banking, investment management, brokerage and financing group. We and our affiliates have investment banking and other business relationships with a some
companies covered by our Research Department. Our research professionals may provide input into our investment banking and other business selection processes. Investors should assume that MOSt and/or its affiliates are
seeking or will seek investment banking or other business from the company or companies that are the subject of this material and that the research professionals who were involved in preparing this material may educate
investors on investments in such business . The research professionals responsible for the preparation of this document may interact with trading desk personnel, sales personnel and other parties for the purpose of
gathering, applying and interpreting information. Our research professionals are paid on twin parameters of performance & profitability of MOSt.
MOSt generally prohibits its analysts, persons reporting to analysts, and members of their households from maintaining a financial interest in the securities or derivatives of any companies that the analysts cover.
Additionally, MOSt generally prohibits its analysts and persons reporting to analysts from serving as an officer, director, or advisory board member of any companies that the analysts cover. Our salespeople, traders, and
other professionals or affiliates may provide oral or written market commentary or trading strategies to our clients that reflect opinions that are contrary to the opinions expressed herein, and our proprietary trading and
investing businesses may make investment decisions that are inconsistent with the recommendations expressed herein. In reviewing these materials, you should be aware that any or all of the foregoing among other things,
may give rise to real or potential conflicts of interest. MOSt and its affiliated company(ies), their directors and employees and their relatives may; (a) from time to time, have a long or short position in, act as principal in, and
buy or sell the securities or derivatives thereof of companies mentioned herein. (b) be engaged in any other transaction involving such securities and earn brokerage or other compensation or act as a market maker in the
financial instruments of the company(ies) discussed herein or act as an advisor or lender/borrower to such company(ies) or may have any other potential conflict of interests with respect to any recommendation and other
related information and opinions.; however the same shall have no bearing whatsoever on the specific recommendations made by the analyst(s), as the recommendations made by the analyst(s) are completely independent
of the views of the affiliates of MOSt even though there might exist an inherent conflict of interest in some of the stocks mentioned in the research report
Reports based on technical and derivative analysis center on studying charts company's price movement, outstanding positions and trading volume, as opposed to focusing on a company's fundamentals and, as such, may not match with a report on a
company's fundamental analysis. In addition MOST has different business segments / Divisions with independent research separated by Chinese walls catering to different set of customers having various objectives, risk profiles, investment horizon,
etc, and therefore may at times have different contrary views on stocks sectors and markets.
Unauthorized disclosure, use, dissemination or copying (either whole or partial) of this information, is prohibited. The person accessing this information specifically agrees to exempt MOSt or any of its affiliates or employees
from, any and all responsibility/liability arising from such misuse and agrees not to hold MOSt or any of its affiliates or employees responsible for any such misuse and further agrees to hold MOSt or any of its affiliates or
employees free and harmless from all losses, costs, damages, expenses that may be suffered by the person accessing this information due to any errors and delays. The information contained herein is based on publicly
available data or other sources believed to be reliable. Any statements contained in this report attributed to a third party represent MOSt’s interpretation of the data, information and/or opinions provided by that third party
either publicly or through a subscription service, and such use and interpretation have not been reviewed by the third party. This Report is not intended to be a complete statement or summary of the securities, markets or
developments referred to in the document. While we would endeavor to update the information herein on reasonable basis, MOSt and/or its affiliates are under no obligation to update the information. Also there may be
regulatory, compliance, or other reasons that may prevent MOSt and/or its affiliates from doing so. MOSt or any of its affiliates or employees shall not be in any way responsible and liable for any loss or damage that may
arise to any person from any inadvertent error in the information contained in this report. MOSt or any of its affiliates or employees do not provide, at any time, any express or implied warranty of any kind, regarding any
matter pertaining to this report, including without limitation the implied warranties of merchantability, fitness for a particular purpose, and non-infringement. The recipients of this report should rely on their own
investigations.
This report is intended for distribution to institutional investors. Recipients who are not institutional investors should seek advice of their independent financial advisor prior to taking any investment decision based on this
report or for any necessary explanation of its contents.
Most and it’s associates may have managed or co-managed public offering of securities, may have received compensation for investment banking or merchant banking or brokerage services, may have received any
compensation for products or services other than investment banking or merchant banking or brokerage services from the subject company in the past 12 months.
Most and it’s associates have not received any compensation or other benefits from the subject company or third party in connection with the research report.
Subject Company may have been a client of Most or its associates during twelve months preceding the date of distribution of the research report
MOSt and/or its affiliates and/or employees may have interests/positions, financial or otherwise of over 1 % at the end of the month immediately preceding the date of publication of the research in the securities mentioned
in this report. To enhance transparency, MOSt has incorporated a Disclosure of Interest Statement in this document. This should, however, not be treated as endorsement of the views expressed in the report.
Motilal Oswal Securities Limited is registered as a Research Analyst under SEBI (Research Analyst) Regulations, 2014. SEBI Reg. No. INH000000412
Pending Regulatory inspections against Motilal Oswal Securities Limited:
SEBI pursuant to a complaint from client Shri C.R. Mohanraj alleging unauthorized trading, issued a letter dated 29th April 2014 to MOSL notifying appointment of an Adjudicating Officer as per SEBI regulations to hold inquiry
and adjudge violation of SEBI Regulations; MOSL replied to the Show Cause Notice whereby SEBI granted us an opportunity of Inspection of Documents. Since all the documents requested by us were not covered we have
requested to SEBI vide our letter dated June 23, 2015 to provide pending list of documents for inspection.
List of associate companies of Motilal Oswal Securities Limited -Click
here to access detailed report
Analyst Certification
The views expressed in this research report accurately reflect the personal views of the analyst(s) about the subject securities or issues, and no part of the compensation of the research analyst(s) was, is, or will be directly or
indirectly related to the specific recommendations and views expressed by research analyst(s) in this report. The research analysts, strategists, or research associates principally responsible for preparation of MOSt research
receive compensation based upon various factors, including quality of research, investor client feedback, stock picking, competitive factors and firm revenues
Eveready Industries
Disclosure of Interest Statement
Analyst ownership of the stock
No
Served as an officer, director or employee -
No
A graph of daily closing prices of securities is available at www.nseindia.com and http://economictimes.indiatimes.com/markets/stocks/stock-quotes
Regional Disclosures (outside India)
This report is not directed or intended for distribution to or use by any person or entity resident in a state, country or any jurisdiction, where such distribution, publication, availability or use would be contrary to law,
regulation or which would subject MOSt & its group companies to registration or licensing requirements within such jurisdictions.
For Hong Kong:
This report is distributed in Hong Kong by Motilal Oswal capital Markets (Hong Kong) Private Limited, a licensed corporation (CE AYY-301) licensed and regulated by the Hong Kong Securities and Futures
Commission (SFC) pursuant to the Securities and Futures Ordinance (Chapter 571 of the Laws of Hong Kong) “SFO”. As per SEBI (Research Analyst Regulations) 2014 Motilal Oswal Securities (SEBI Reg No. INH000000412) has
an agreement with Motilal Oswal capital Markets (Hong Kong) Private Limited for distribution of research report in Kong Kong. This report is intended for distribution only to “Professional Investors” as defined in Part I of
Schedule 1 to SFO. Any investment or investment activity to which this document relates is only available to professional investor and will be engaged only with professional investors.” Nothing here is an offer or solicitation
of these securities, products and services in any jurisdiction where their offer or sale is not qualified or exempt from registration. The Indian Analyst(s) who compile this report is/are not located in Hong Kong & are not
conducting Research Analysis in Hong Kong.
For U.S.
Motilal Oswal Securities Limited (MOSL) is not a registered broker - dealer under the U.S. Securities Exchange Act of 1934, as amended (the"1934 act") and under applicable state laws in the United States. In addition MOSL is
not a registered investment adviser under the U.S. Investment Advisers Act of 1940, as amended (the "Advisers Act" and together with the 1934 Act, the "Acts), and under applicable state laws in the United States.
Accordingly, in the absence of specific exemption under the Acts, any brokerage and investment services provided by MOSL, including the products and services described herein are not available to or intended for U.S.
persons.
This report is intended for distribution only to "Major Institutional Investors" as defined by Rule 15a-6(b)(4) of the Exchange Act and interpretations thereof by SEC (henceforth referred to as "major institutional investors").
This document must not be acted on or relied on by persons who are not major institutional investors. Any investment or investment activity to which this document relates is only available to major institutional investors
and will be engaged in only with major institutional investors. In reliance on the exemption from registration provided by Rule 15a-6 of the U.S. Securities Exchange Act of 1934, as amended (the "Exchange Act") and
interpretations thereof by the U.S. Securities and Exchange Commission ("SEC") in order to conduct business with Institutional Investors based in the U.S., MOSL has entered into a chaperoning agreement with a U.S.
registered broker-dealer, Motilal Oswal Securities International Private Limited. ("MOSIPL"). Any business interaction pursuant to this report will have to be executed within the provisions of this chaperoning agreement.
The Research Analysts contributing to the report may not be registered /qualified as research analyst with FINRA. Such research analyst may not be associated persons of the U.S. registered broker-dealer, MOSIPL, and
therefore, may not be subject to NASD rule 2711 and NYSE Rule 472 restrictions on communication with a subject company, public appearances and trading securities held by a research analyst account.
For Singapore
Motilal Oswal Capital Markets Singapore Pte Limited is acting as an exempt financial advisor under section 23(1)(f) of the Financial Advisers Act(FAA) read with regulation 17(1)(d) of the Financial Advisors Regulations and is a
subsidiary of Motilal Oswal Securities Limited in India. This research is distributed in Singapore by Motilal Oswal Capital Markets Singapore Pte Limited and it is only directed in Singapore to accredited investors, as defined in
the Financial Advisers Regulations and the Securities and Futures Act (Chapter 289), as amended from time to time.
In respect of any matter arising from or in connection with the research you could contact the following representatives of Motilal Oswal Capital Markets Singapore Pte Limited:
Varun Kumar
Varun.kumar@motilaloswal.com
Contact : (+65) 68189232
Office Address:21 (Suite 31),16 Collyer Quay,Singapore 04931
EVEREADY INDUSTRIES IN
Motilal Oswal Securities Ltd
31 May 2017
Motilal Oswal Tower, Level 9, Sayani Road, Prabhadevi, Mumbai 400 025
Phone: +91 22 3982 5500 E-mail: reports@motilaloswal.com
10