Petronet LNG
BSE SENSEX
31,076
S&P CNX
9,578
16 June 2017
Update
| Sector:
Oil & Gas
CMP: INR427
For the long haul
TP: INR546(+23%)
Buy
Volume growth to continue for a long time
Though PLNG witnessed 5.8% volume CAGR over FY12-17, its volumes grew 25% in
FY17, aided by favorable LNG prices and Dahej expansion. To better capture sporadic
increases in offtake, as PLNG expands its Dahej facility and ramps up Kochi
utilization, we believe a 3-5 year view on its prospects is desirable.
Stock Info
Bloomberg
Equity Shares (m)
52-Week Range (INR)
1, 6, 12 Rel. Per (%)
M.Cap. (INR b)
M.Cap. (USD b)
Avg Val, INRm
Free float (%)
PLNG IN
750
459 / 275
-8/-4/36
323.7
5.0
695
50.0
We expect a volume CAGR of 10% over the next three years (FY17-20E) for PLNG. Low
LNG prices along with lack of domestic gas availability and huge unmet demand is
likely to result in sustained volume growth for PLNG for a long time to come.
Additional factors contributing to our Buy recommendation: (1) lack of competition,
(2) Dahej being the most economical facility, (3) firm contracts at Dahej and Kochi,
and (4) expansion of gas pipeline network across India.
Financials Snapshot (INR b)
2017 2018E 2019E
Y/E Mar
246.2 275.4 343.9
Net Sales
25.9
31.4
39.4
EBITDA
17.1
19.7
27.0
PAT
22.7
26.3
35.9
EPS (INR)
102.7
15.7
36.6
Gr. (%)
107.9 126.8 152.7
BV/Sh (INR)
23.2
22.4
25.7
RoE (%)
20.2
19.8
24.2
RoCE (%)
18.8
16.5
12.1
P/E (x)
4.0
3.4
2.8
P/BV (x)
Shareholding pattern (%)
As On
Mar-17 Dec-16 Mar-16
Promoter
50.0
50.0
50.0
DII
17.7
16.3
16.1
FII
19.4
21.7
21.6
Others
12.9
12.0
12.3
FII Includes depository receipts
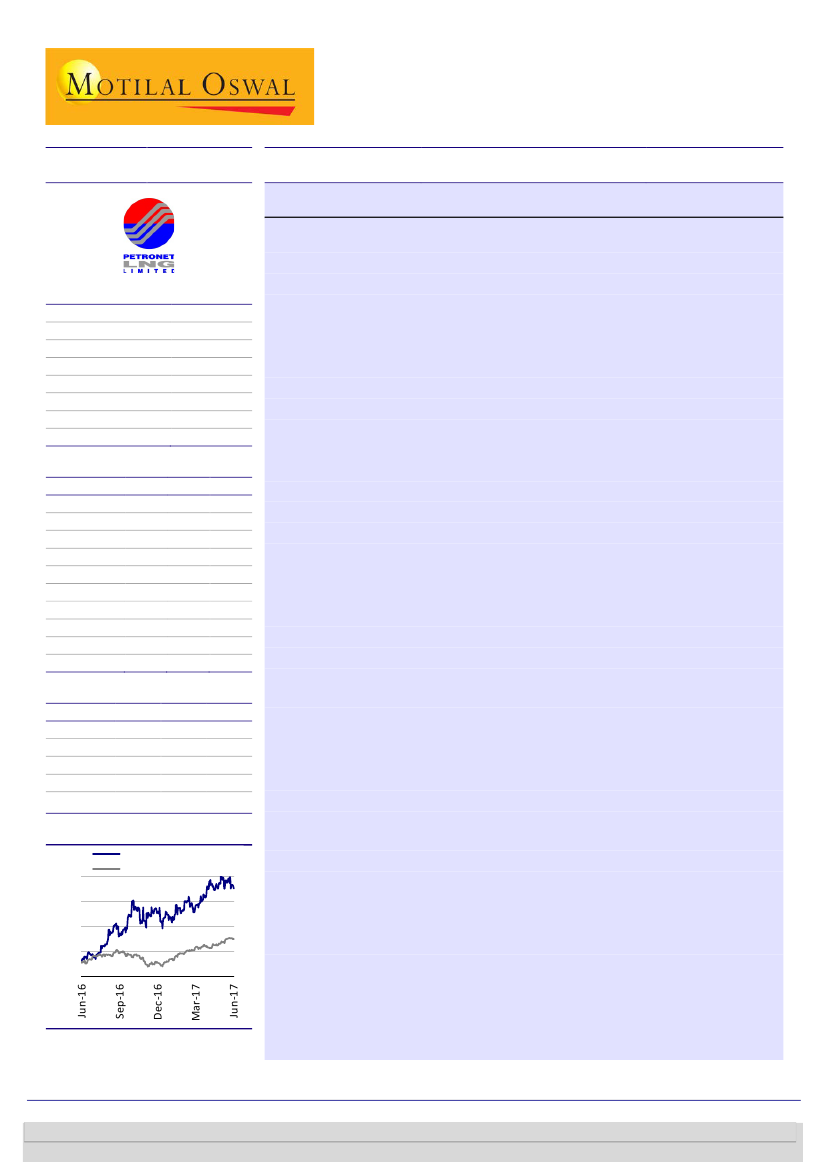
Stock Performance (1-year)
Petronet LNG
Sensex - Rebased
450
400
350
300
250
LNG imports to rise; Petronet LNG to be biggest beneficiary
Amidst constrained domestic gas availability, LNG imports accounted for ~50%
of total gas sales in India in FY17 compared with 32% in FY14. Even in an
optimistic scenario of domestic gas production growing at a CAGR of 10.5%
over FY17-22, we expect LNG consumption to rise at a CAGR of 10%. PLNG is
best placed to benefit from this rise in demand.
While existing LNG terminals face their own problems, we do not see much
competition from upcoming LNG terminals. Dahej’s brownfield expansion
makes it the cheapest alternative for LNG imports.
Access to large parts of India; the cheapest alternative
PLNG’s Dahej terminal is already connected to HVJ, Dahej-Uran-Panvel-Dabhol,
Dabhol-Bangalore, and East-West pipelines.
Once the Jagdishpur-Haldia pipeline comes up, it will also have access beyond
Jagdishpur. Combined with the upcoming Mehsana-Bhatinda-Srinagar and
Mallavaram-Bhilwara pipelines, it would have access to large parts of India.
Valuation and recommendation
Dahej is already expanding to 17.5mmtpa in two years. Given the connectivity
of Dahej to a larger part of India through increased pipeline access, further
expansion to 20mmtpa looks imminent.
Assuming 3% terminal growth and WACC of 11%, we arrive at a one-year target
price of INR546 (upside of 23%) and a three-year price target of INR767.
Buy.
Swarnendu Bhushan
(Swarnendu.Bhushan@MotilalOswal.com); +91 22 6129 1529
Abhinil Dahiwale
(Abhinil.Dahiwale@MotilalOswal.com); +91 22 6129 1566
Investors are advised to refer through important disclosures made at the last page of the Research Report.
Motilal Oswal research is available on www.motilaloswal.com/Institutional-Equities, Bloomberg, Thomson Reuters, Factset and S&P Capital.

Petronet LNG
LNG imports to rise; PLNG to be biggest beneficiary
Natural gas accounts for just 6.5% in India’s primary energy mix v/s ~25% globally.
With supply growing and the government’s thrust on greener fuels, gas consumption
is set to increase in India.
We expect domestic gas supply to increase at a CAGR of 10.5% over FY17-22. Gas
consumption is likely to grow at 10.5% CAGR, led primarily by the Fertilizers, CGD,
Petrochem/Refineries, and Power sectors.
Even an optimistic 10.5% CAGR in domestic gas production leaves space for 10% CAGR
in LNG consumption.
Gas consumption set to grow in India
Against 25% globally, natural gas accounts for just ~6.5% of India’s primary
energy mix. This is mainly due to insufficient domestic gas production, lack of
pan-India gas pipelines, and lack of sufficient import terminals and pipelines.
Battling a severe pollution problem and signatory to COP21, India now aims to
increase its dependence on natural gas to 20% by 2025. The government has
been pushing investments in gas pipeline infrastructure through viability gas
funding.
Exhibit 1: Natural gas consumption in the Indian energy basket is low
778
Natural Gas Consumption 2015 (in BCM)
392
197
191
113
106
102
83
75
69
68
61
53
51
Source: Statistical Review of World Energy 2016, MOSL
Exhibit 2: Natural gas accounts for ~6.5% share in the
primary energy mix
Oil
Natural Gas
6%
1%
58%
7%
28%
2015
Coal
Nuclear Energy
2%
3%
50%
20%
25%
2025
Source: Natural Gas Vision 2030, MOSL
Others
Exhibit 3: Power and fertilizer sectors dominate the current
energy consumption
Segment-wise gas consumption (2016)
Fertilizer
29%
31%
Power
1%
City Gas
Industrial
1%
14%
23%
Petrochem/Ref/Internal/L
PG/Shrinkage/Mnfg/Misc
Sponge Iron/Steel
Source: PPAC, MOSL
16 June 2017
2

Petronet LNG
Domestic gas supply to increase at a CAGR of 10.5% over FY17-22
Primarily led by ONGC’s projects – Daman/C26, B127, WO16, Vasai East,
Rajahmundry, Cauvery Basin, S1 and Vashishta, and KG Basin, India’s gas
production is expected to grow at a CAGR of 10.5% in an optimistic scenario.
Production from KG Basin not only requires expertise in deep water, but also
involves complex geological formation, as witnessed in KG-DWN-98/3. This may,
in fact, result in lower production growth than projected in FY20 and beyond.
Sales with contribution from KG-DWN-98/2
120
100
80
60
FY12
FY13
FY14
FY15
FY16
FY17
FY18E FY19E FY20E FY21E FY22E
Source: Industry, MOSL
Decline due
to KG D6
Sales without KG-DWN-98/2
Exhibit 4: Domestic gas production during FY17-22E (mmscmd)
KG-DWN-98/2 is a deep water block and
accounts for 10-15mmscmd in FY20-22E
Natural gas demand to grow at a CAGR of 10.3% during FY17-22
The Power sector does not have an appetite for high-priced gas. However, with
rise in domestic gas production, demand from the Power sector is expected to
rise from 31.6mmscmd in FY17 to 65.5mmscmd in FY22 (at 60% PLF).
Three fertilizer plants that are ready to take gas – MFL (Manali), MCFL
(Mangalore), and SPIC (Tuticorin) – are not consuming any gas, as they are not
on the gas grid right now. However, Indian Oil’s upcoming Ennore LNG terminal
and related pipeline infrastructure would make this possible. The government
has also been pushing revival of three defunct fertilizer plants – Gorakhpur,
Sindri, and Barauni – each with a capacity of 1.27mmtpa. In total, these six
plants would consume 13.3mmscmd of incremental gas, taking the total
consumption from 42.1mmscmd in FY17 to 55.4mmscmd by FY22.
Petrochemical projects like OPaL, BCPL, Pata expansion, and OMPL would take
require another 15.3mmscmd of natural gas. A total of 84mmtpa of refining
capacity (MRPL: 15mmtpa, Kochi: 15mmtpa, Vizag post expansion: 15mmtpa,
Barauni: 6mmtpa, Haldia: 7.5mmtpa, CPCL: 10.5mmtpa, and Paradip: 15mmtpa)
would require incremental gas supply of 16mmscmd.
In total, we expect demand of 228mmscmd by FY22, a CAGR of 10.3% over
FY17-22, which would translate to 10% CAGR in LNG consumption through FY17-
22. In the absence of production from KG-DWN-98/2, LNG consumption may
grow at a CAGR of 12.4% over FY17-22.
Sponge Iron/Steel
Petrochem/Ref/Internal/LPG/Shrinkage/Mnfg/Misc
Industrial
City Gas
2.4
40.7
20.0 1.5
31.6
42.1
FY17
Exhibit 5: Demand to grow at a CAGR of 10.3% over FY17-22
3.1
61.7
40.2
65.5
55.4
FY22E
Source: Industry, MOSL
16 June 2017
3
1.9
Domestic gas production to
help higher PLF in power

Petronet LNG
Low LNG prices to aid consumption growth
Against 258mmtpa of global trade in 2016, 115mmtpa of LNG capacity is currently
under various stages of construction.
We expect decoupling of LNG prices – like that of Henry Hub in the US.
Demand may face pressure with restart of nuclear reactors in Japan and South Korea.
Global liquefaction capacity to rise
The Middle East and Asia Pacific have ~66% of the total global liquefaction
capacity of ~336mmtpa. Global LNG trade in 2016 stood at 258mmt. A total of
115mmtpa of liquefaction capacity is under various stages of construction.
Qatar has recently lifted is self-imposed moratorium on development of the
world’s largest gas field, which would also put pressure on long-term LNG prices.
Exxon Mobil and ENI appear to be going ahead with development of
Mozambique Area 4, which is expected to have a recoverable reserve of 85tcf,
sufficient to supply gas to Germany, Britain, France and Italy for two decades.
Exhibit 6: Upcoming LNG liquefaction capacities (mmtpa)
Africa
160
120
80
40
0
2010
2016
2022
Source: International Gas Union, 2017, MOSL
Asia Pacific
Europe
FSU
Latin America
North America
Middle East
115mmtpa of LNG liquefaction capacity under various
stages of construction
Exhibit 7: Demand unlikely to keep pace with supply
Liquefaction Capacity (mmtpa)
500
400
300
200
100
0
Demand outlook is benign considering that Japan and
Korea would cut consumption as their nuclear reactors
restart
Utilization (%)-RHS
Even after assuming 6% annual
growth, utilizations likely to
remain muted
90
85
80
75
70
Source: IGU, MOSL
16 June 2017
4

Petronet LNG
Natural gas prices have decoupled from oil prices
Our research shows that Henry Hub prices delinked from WTI from 2009 due to
abundance in supply of shale gas. Average slope during 2000-08 stood at 13.2%
and has come down to 6.5% in 2016.
We believe LNG prices would also follow the same course due to the expansion
in global glut.
Exhibit 8: HH delinks with WTI, with abundant shale
85
80
75
70
65
60
55
50
45
Natural Gas Total Marketed Production (bcfd)
HH delinks with WTI
% slope
35
30
25
20
15
10
5
0
Source: EIA, MOSL
Exhibit 9: Recent rally in spot LNG prices
Spot LNG (USD/mmBtu)
11
10
9
8
7
6
5
4
Brent (USD/bbl)-RHS
70
60
50
40
30
Exhibit 10: Linkage of LN with JCC
Spot Asian LNG Price (USD/mmBtu)
25
20
15
10
5
0
% slope to JCC
25
20
15
10
5
Source: Bloomberg, Platts, MOSL
16 June 2017
5

Petronet LNG
PLNG has access to large parts of India
Within months of expansion from 10mmtpa to 15mmtpa, the Dahej LNG terminal is
near full utilization.
The Dahej LNG terminal is already connected to existing pipelines – HVJ, Dahej-Uran-
Panvel-Dabhol, Dabhol-Bangalore, and East-West pipelines.
Upcoming pipelines like Jagdishpur-Haldia, Mehsana-Bhatinda-Srinagar, and
Mallavaram-Bhilwara would further boost its reach.
Increasing access
The Dahej LNG terminal is already connected to the 53mmscmd HVJ pipeline,
20mmscmd Dahej-Uran-Panvel-Dabhol pipeline, 16mmscmd Dabhol-Bangalore
pipeline, and 80mmscmd East-West pipeline.
Against 15mmtpa capacity, Dahej has firm contracts for 15.75mmtpa. We
believe that the ongoing expansion to 17.5mmtpa would also be fully utilized
due to the vast pipeline infrastructure.
The upcoming Jagdishpur-Haldia pipeline would further give PLNG reach beyond
Jagdishpur. Although Adani is developing the 5mmtpa Dhamra LNG terminal to
service the pipeline, there is a lot of demand and Dahej would partly fulfill the
same. Phase-I and Phase-II would be completed by December 2018 while the
pipeline portion connected to Dhamra LNG terminal would be completed only
by December 2020. As a result, most of the demand including from Gorakhpur,
Sindri and Barauni fertilizer units, would be serviced by Dahej LNG terminal.
The upcoming Mehsana-Bhatinda-Srinagar pipeline would also give Dahej access
to Northern India, with large anchor consumers like Bhatinda Refinery.
Our discussions with the industry suggest that Dahej would further expand from
17.5mmtpa to 20mmtpa in due course.
Exhibit 11: Existing pipelines give access to North and South
Source: PPAC, MOSL
16 June 2017
6

Petronet LNG
Exhibit 12: Existing pipelines have no capacity constraint
Pipeline
HVJ
Dahej-Uran-Panvel
Dabhol-Bangalore
East-West
Capacity (mmscmd)
53
20
16
80
Utilization FY17 (%)
62.6
63.4
7.3
21.3
Source: PPAC, MOSL
Exhibit 13: Jagdishpur-Haldia would give Dahej access to consumers beyond Jagdishpur
Source: GAIL, MOSL
16 June 2017
7

Petronet LNG
Competition is lacking
We see no competition from the existing 5mmtpa Dabhol LNG terminal in the next 4-5
years. Shell’s 5mmtpa Hazira terminal is also not likely to be a big threat.
GSPC-Adani’s upcoming 5mmtpa LNG terminal at Mundra faces pipeline constraints.
IOC’s upcoming 5mmtpa Ennore LNG terminal would be catering to a new market.
We do not see any more LNG terminals apart from these two in the next three years.
Poor competition from existing LNG terminals
The existing 5mmtpa Dabhol LNG terminal does not have a break-water facility
and is non-operational for nearly five months in a year. The break-water facility
would require four years for construction post the award of the tender. The
tender is expected to be awarded only post demerger of the LNG terminal and
the power plant.
Shell’s 5mmtpa Hazira LNG terminal has been traditionally supplying only to
Reliance Industries. It has still not shown any inclination to tie up with new
consumers despite the fact that RIL’s offtake would decrease drastically as soon
as its petcoke gasifier starts.
The 5mmtpa GSPC-Adani LNG terminal is almost ready except that the tender
for 60km Mundra-Anjar pipeline was awarded only in January 2017 and is
expected to come up by January 2018. Even the 170km existing pipeline from
Anjar to Chotila is a 3mmtpa pipeline, which needs to be augmented to handle
the higher capacity of the LNG terminal. Tender for this part has not even been
awarded so far. The Mundra terminal has been developed on the concept of
tolling. The LNG terminal costs INR45b against INR20b for Dahej’s just concluded
expansion from 10mmtpa to 15mmtpa. Dahej is further adding 2.5mmtpa at a
cost of INR10b. These low cost brownfield expansions would keep Dahej as the
cheapest LNG terminal in the region. As a result, not a single contract appears to
have been signed up for the Mundra LNG terminal so far.
Indian Oil is coming up with a 5mmtpa LNG terminal at Ennore along the east
oast of India. The terminal is expected to come up by 2019 and would serve an
entirely new market through the upcoming Ennore-Tuticorin pipeline.
Several announcements for new LNG terminals/FSRUs have been made: H-
Energy’s FSRU at Jaigad and Digha, Essar’s 1mmtpa LNG terminal at Haldia,
GAIL’s Paradip LNG terminal, Petronet’s Gangavaram terminal, and
GAIL/GDF/Shell’s Kakinada terminal. However, we do not see any of these
coming up in the next three years.
New LNG terminals also not much of a threat
16 June 2017
8

Petronet LNG
Exhibit 14: GSPC-Adani’s 5mmtpa Mundra LNG terminal faces pipeline constraints
Source: Company, MOSL
Exhibit 15: Upcoming LNG capacities are just enough for the demand
Dahej
LNG import of
19.3mmt in FY17
Kochi
Hazira
Dabhol
Mundra
Ennore
LNG demand of 31mmt in FY22E in optimistic scenario of domestic gas production. In absence of KG-
DWN-98/2, demand could rise to 35mmt. In total capacity of 42.5mmtpa, Dabhol, Ennore and Mundra
are likely to remain underutilized
5
5
5
5
5
5
5
5
5
5
5
5
5
5
5
5
5
5
5
5
5
5
15
FY18E
15
FY19E
17.5
FY20E
17.5
FY21E
17.5
FY22E
Source: IGU, MOSL
5
5
5
15
FY17
16 June 2017
9

Petronet LNG
Exhibit 16: Indian Oil’s 5mmtpa Ennore LNG terminal will service new market from 2019
Source: Company, MOSL
16 June 2017
10

Petronet LNG
PLNG to see volume CAGR of 9% over FY17-22
PLNG is likely to continue gradual capacity addition at Dahej terminal to benefit from
the evolving LNG opportunity in India. We expect its total capacity to reach
22.5mmtpa by FY20.
Firm offtake contracts at Dahej terminal and ramp-up of Kochi terminal would enable
PLNG to post volume CAGR of 9% over FY17-22.
Assured volume growth and tariff hikes would help PLNG to post 14%/15%
EBITDA/PAT CAGR over FY17-22. This means PLNG’s EPS is set to double by FY22.
Gradual capacity addition to continue
PLNG commissioned its Dahej facility with 5mmtpa capacity in 2004 and
doubled the capacity to 10mmtpa in 2009. In 3QFY17, it successfully completed
capacity expansion to 15mmtpa.
We expect PLNG to continue its gradual capacity addition to make the most of
the evolving LNG opportunity in India. We expect PLNG’s capacity to grow to
22.5mmtpa in FY20, led by expansion at Dahej terminal.
Exhibit 17: PLNG’s capacity to reach 22.5mmtpa by FY20, led by capacity addition at Dahej
Dahej (mmt)
Kochi (mmt)
Total capacity (mmt)
20.0
15.0
10.0
10.0
FY11
10.0
10.0
FY12
10.0
10.0
FY13
5.0
10.0
FY14
15.0
5.0
10.0
FY15
15.0
5.0
10.0
FY16
16.3
5.0
11.3
FY17
15.0
15.0
17.5
17.5
17.5
5.0
20.0
5.0
22.5
5.0
22.5
5.0
22.5
5.0
FY18E FY19E FY20E FY21E FY22E
Source: Company, MOSL
Firm contracts at Dahej give earnings visibility
Against the expanded capacity of 15mmtpa at Dahej, PLNG already has long-
term usage contracts of 15.75mmtpa, implying 105% utilization. The initial
7.5mmtpa capacity at Dahej was booked by GAIL, IOC and BPCL in the ratio
60:30%:10%. Subsequently, PLNG entered into contracts with GAIL, GSPC, IOC,
BPCL and Torrent Power for 15.75mmtpa.
Exhibit 18: Firm offtake contracts exceed total capacity (mmtpa)
GAIL
IOC
BPCL
GSPC
Torrent Power
Firm offtake
Total capacity
15.75
7.00
GAIL
3.75
IOC
1.00
Torrent
Power
15.00
1.75
BPCL
2.25
GSPC
Firm offtake Total capacity
Source: Company, MOSL
16 June 2017
11

Petronet LNG
Higher short-term contracts to boost return ratios
PLNG enters two types of contract agreements with its customers: long-term
(more than 1-year) and short-term contracts (less than a year). It charges re-
gasification charges on long-term contracts, which are computed to ensure 16%
RoE considering only long-term contract volumes (as a short-term contract
volume is virtually not assured). On short-term contracts, it charges re-
gasification charges and marketing margins.
Marketing margins depend on the demand-supply scenario in the LNG domestic
market. PLNG has historically maintained margins at INR10-40/mmbtu. Increase
in short-volumes will not only improve margins, but also return ratios.
Exhibit 19: Dahej terminal to operate at higher utilization; capacity addition allows increase in spot/short term contracts
Long term
88%
109%
104%
Re-gas
97%
Spot/Short term
125%
112%
103%
Throughput (mmt)
105%
15.8
7.5
110%
16.5
1.3
7.5
Utilization (%)
95%
16.6
1.5
7.5
100%
17.5
2.3
7.5
100%
17.5
2.3
7.5
14.1
8.8
0.8
0.6
7.4
FY11
10.9
2.0
1.4
7.5
FY12
10.4
2.0
0.9
7.5
FY13
1.2
9.7
1.1
7.4
FY14
10.3
1.4
2.1
6.8
FY15
11.2
1.5
4.2
5.5
FY16
0.7
5.1
8.4
FY17
7.7
FY18E
7.7
FY19E
7.7
FY20E
7.7
FY21E
7.7
FY22E
Source: Company, MOSL
Kochi to ramp up
Kochi terminal has been witnessing lower utilization at ~4% due to stalled
development of Kochi-Mangalore-Bangalore pipeline connectivity to access
demand centers of Tamil Nadu and Karnataka. We expect local demand to come
from BPCL’s Kochi refinery expansion. Even without Phase-II pipeline, utilization
would increase to ~20% by FY18E. We expect Kochi terminal utilization to
increase gradually to reach 90% by FY22 with throughput at 4.5mmtpa.
Exhibit 20: Utilization to increase
Throughput (mmt)
Utilization (%)
50%
20%
50%
50%
90%
4.5
1%
0.1
FY14
2%
0.1
FY15
6%
0.3
FY16
6%
0.3
FY17
2.5
2.5
2.5
1.0
FY18E
FY19E
FY20E
FY21E
FY22E
Source: Company, MOSL
16 June 2017
12

Petronet LNG
PLNG to post volume CAGR of 9% over FY17-22
Gradual capacity addition at Dahej and increased utilization at Kochi terminal
would enable PLNG to post volume CAGR of 9% over FY17-22. We expect 4%
CAGR in Dahej volumes and 74% CAGR in Kochi volumes over FY17-22.
Exhibit 21: PLNG to post volume CAGR of 9% over FY17-22
Dahej (mmt)
88%
109% 104%
65%
10.9
10.9
FY12
10.4
10.4
FY13
Kochi (mmt)
77%
Throughput (mmt)
95%
88%
80%
Utilization rate (%)
98%
89%
85%
22.0
20.0
2.5 4.5
17.5
17.5
69%
8.8
8.8
FY11
14.4 16.0
11.5
1.0
10.4
9.8
0.3
0.3
0.1
0.1
16.5
15.0
14.1
11.2
10.3
9.7
FY14
FY15
FY16
FY17
19.0 19.1
2.5
2.5
16.6
FY18E FY19E FY20E FY21E FY22E
Source: Company, MOSL
Model 5% increase in re-gas charges for Dahej
We are modeling a 5% annual increase in re-gas charges for Dahej terminal and
~3-4% hike in re-gas charges at Kochi terminal for FY18/19 and flat growth
thereafter. Also, we are assuming marketing margins of INR29.6/mmbtu for
short-term/spot volumes at Dahej terminal. PLNG has historically maintained
marketing margins at INR10-40/mmbtu.
Exhibit 23: Assume ~3-4% hike in regas charges at Kochi for
FY18/19 and flat growth thereafter
Re-gassification charges
5.0%
0.0%
5.0%
5.0%
3.7%
3.3%
0.0%
0.0%
0.0%
YoY (%)
Exhibit 22: PLNG has been consistently raising re-gasification
charges by 5% every year for Dahej terminal
Re-gassification charges
Marketing margin
62.8
65.9
FY15
69.2
FY16
72.7
75.4
77.9
77.9
77.9
77.9
FY14 FY15 FY16 FY17 FY18E FY19E FY20E FY21E FY22E
Source: Company, MOSL
FY14
FY17 FY18E FY19E FY20E FY21E FY22E
Source: Company, MOSL
Expect 14%/17% EBITDA/PAT CAGR through FY22
PLNG is likely to witness margin expansion due to (a) assured volume growth,
(b) 5% annual increase in re-gasification charges at Dahej, (c) lower LNG prices,
which will cut operating costs, and (d) higher margins on short-term contracts.
We expect PLNG’s EBITDA to register 14% CAGR during FY17-22E, with PAT
growing at 17% CAGR through FY22E. We expect EBITDA margin to improve to
11.6% and PAT margin to 7-9% by FY22E.
16 June 2017
13

Petronet LNG
Exhibit 24: PLNG to post 14%/17% EBITDA/PAT CAGR during
FY17-22E
EBITDA (INRb)
Adj. PAT (INRb)
Exhibit 25: EBITDA/PAT margins to improve over FY17-22E
EBITDA margins (%)
11.5
11.4
10.5
PAT margins (%)
11.7
11.6
11.6
5.9
6.9
3.1
FY16
FY17
FY18E
FY19E
FY20E
FY21E
FY22E
FY16
FY17
FY18E
FY19E
FY20E
7.7
7.8
7.8
8.3
8.7
FY21E
FY22E
Source: Company, MOSL
Return ratios to stay strong
With PAT growing at 17% CAGR over FY17-22E, we expect PLNG’s return ratios
to improve in FY18/19, and stay strong going ahead. Short-term higher margin
contracts could further boost return ratios.
RoE (%)
28.8
23.2
15.1
19.8
14.4
17.9
11.2
FY12
FY13
FY14
11.8
FY15
11.6
FY16
FY17
FY18E FY19E FY20E FY21E FY22E
Source: Company, MOSL
14.1
13.7
20.2
22.4
19.8
RoCE (%)
25.7
24.2
Exhibit 26: Spot volumes could boost return ratios further
35.3
25.2
22.0
22.0
21.5
21.5
21.9
21.9
FY11
Expect EPS to double by FY22
Assured volume growth led by capacity addition and tariff hikes would help
PLNG to post 17% EPS CAGR over FY17-22. Its EPS is set to double to INR49.7 in
FY22E from INR22.7 in FY17.
Exhibit 27: EPS to grow at 17% over FY17-22E
EPS (INR)
103%
53%
77%
5%
-38%
8.3
FY11
14.6
FY12
15.3
FY13
9.5
FY14
10.0
FY15
11.2
FY16
22.7
FY17
26.3
35.9
36.5
41.6
49.7
5%
12%
16%
37%
1%
14%
19%
YoY (%)
FY18E FY19E FY20E FY21E FY22E
Source: Company, MOSL
16 June 2017
14

Petronet LNG
Valuation and view
Buy for a target of INR767 in FY20
Strong earnings visibility:
Visibility on PLNG’s medium/long-term earnings is
high, given (a) the huge gas demand-supply gap in India, (b) volume growth,
driven by gradual capacity addition, and (c) earnings growth boosted by annual
re-gas charge escalation to protect IRR.
Poor competition from existing and upcoming terminals:
We believe that the
existing Dabhol and Hazira terminals would remain underutilized, while the
upcoming Mundra and Ennore terminals would face pipeline issues.
LNG prices to correct downwards:
We believe that LNG prices would remain
structurally weak for a long time, even if oil prices were to rise, due to (a)
decoupling of oil-gas prices link since 2009 due to abundance in supply of shale
gas, and (b) 142mmtpa of LNG liquefaction capacity under various stages of
construction v/s global LNG trade of 245mmt in 2015.
Key assumptions
In our estimates through FY22, we model (a) 9% volume CAGR over FY17-22E, (b) 5%
annual increase in re-gas changes and INR29.6/mmbtu of marketing margins for
Dahej terminal, and (c) ~3-4% hike in re-gas charges for FY18/19 and flat growth
thereafter for Kochi terminal
Exhibit 28: PLNG – Key assumptions
FY13
Exchange Rate (INR/USD)
Capacity (mmt)
Dahej
Kochi
Throughput (mmt)
Dahej
Long term
Re-gas
Spot/Short term
Kochi
Utilization rate (%)
Dahej
Kochi
Re-gasification charges (INR/mmbtu)
Dahej
Kochi
Marketing margins on short-term/spot
35.5
62.0
66.6
37.2
62.8
55.8
39.1
65.9
9.3
41.0
69.2
-15.5
43.1
72.7
44.1
45.2
75.4
28.6
47.5
77.9
29.6
49.9
77.9
29.6
52.4
77.9
29.6
55.0
77.9
29.6
104%
104%
10.4
10.4
7.5
0.9
2.0
54.4
10.0
10.0
FY14
60.6
15.0
10.0
5.0
9.7
9.7
7.4
1.1
1.2
0.0
65%
97%
1%
FY15
61.4
15.0
10.0
5.0
10.5
10.4
6.8
2.1
1.4
0.1
70%
104%
2%
FY16
65.5
15.0
10.0
5.0
11.2
10.9
5.5
4.2
1.5
0.3
75%
109%
6%
FY17
67.1
16.3
11.3
5.0
14.4
14.1
8.4
5.1
0.7
0.3
88%
126%
5%
FY18E
66.1
20.0
15.0
5.0
16.8
15.8
7.7
7.5
0.6
1.0
84%
105%
20%
FY19E
68.3
20.0
15.0
5.0
19.0
16.5
7.7
7.5
1.3
2.5
95%
110%
50%
FY20E
68.3
22.5
17.5
5.0
19.1
16.6
7.7
7.5
1.5
2.5
85%
95%
50%
FY21E
68.3
22.5
17.5
5.0
20.0
17.5
7.7
7.5
2.3
2.5
89%
100%
50%
FY22E
68.3
22.5
17.5
5.0
22.0
17.5
7.7
7.5
2.3
4.5
98%
100%
90%
Source: Company, MOSL
16 June 2017
15

Petronet LNG
Buy for a 1-year target of INR546, implying an upside of 23%
We value Petronet LNG on DCF to arrive at a price target of INR546. The stock
trades at 12.1x FY19E EPS of INR35.9.
FY17
17,057
3,691
-25,979
-4,796
-10,028
FY18E
19,737
4,310
-3,995
-5,000
15,052
15,052
FY19E
26,954
5,760
532
-5,000
28,246
25,446
FY20E
27,351
5,885
346
-5,000
28,581
23,197
FY21E
31,213
6,010
522
-5,000
32,746
23,943
FY22E
37,295
6,135
609
-5,000
39,039
25,716
FY23E
39,047
6,260
415
-5,000
40723
24167
FY24E
39,418
6,385
166
-5,000
40,968
21,903
FY25E
39,518
6,510
112
-5,000
41,140
19,815
Exhibit 29: We value PLNG on DCF methodology
DCF (INRm)
PAT incld div/FBT
Depreciation
WC changes
Capex
FCFF
One year valuation
NPV (Rs mn)
Terminal growth rate
TV (Rs mn)
Enterprise value (Rs mn)
Net debt (Rs mn)
Equity value (Rs mn)
Target price (Rs)
WACC Calculation
Risk free rate
Beta
Rm
Re
D/E
Rd
WACC
FY16
9,133
3,216
17,087
-9,931
19,504
FY18
113,355
3.0%
298,282
411,636
1,780
409,856
546
7.0%
0.826
14.0%
12.8%
30.0%
4.0%
11.0%
Source: Company
Buy for a 3-year target of INR767
DCF (INRm)
PAT incld div/FBT
Depreciation
WC changes
Capex
FCFF
Three year valuation
NPV (Rs mn)
Terminal growth rate
TV (Rs mn)
Enterprise value (Rs mn)
Net debt (Rs mn)
Equity value (Rs mn)
Target price (Rs)
WACC Calculation
Risk free rate
Beta
Rm
Re
D/E
Rd
WACC
We value Petronet LNG on DCF to arrive at a 3-year price target of INR767.
FY17
17,057
3,691
-25,979
-4,796
-10,028
FY18E
19,737
4,310
-3,995
-5,000
15,052
18,545
FY19E
26,954
5,760
532
-5,000
28,246
31,353
FY20E
27,351
5,885
346
-5,000
28,581
28,581
FY21E
31,213
6,010
522
-5,000
32,746
29,501
FY22E
37,295
6,135
609
-5,000
39,039
31,685
FY23E
39,047
6,260
415
-5,000
40723
29776
FY24E
39,418
6,385
166
-5,000
40,968
26,987
FY25E
39,518
6,510
112
-5,000
41,140
24,414
Exhibit 30: We value PLNG on DCF methodology
FY16
9,133
3,216
17,087
-9,931
19,504
FY20
220,842
3.0%
314,336
535,178
-39,798
574,976
767
7.0%
0.826
14.0%
12.8%
30.0%
4.0%
11.0%
Source: Company
16 June 2017
16

Petronet LNG
Key risks to our call
Low utilization at Kochi terminal:
The Kochi terminal has been witnessing lower
utilization of ~4% due to stalled development of Kochi-Mangalore-Bangalore
pipeline connectivity. We expect Kochi terminal utilization to increase gradually
to reach 90% by FY22, with throughput at 4.5mmtpa. Any delay in ramp-up at
the Kochi terminal may impact volume growth for PLNG and is thus a downside
risk to our earnings estimates.
Exhibit 31: Earnings sensitivity to Kochi terminal utilization
Kochi utilization
20%/50% for FY18/19
20% for FY18/19
10% For FY18/19
5% For FY18/19
FY19E EPS
36.5
31.7
26.3
21.1
Variance
0%
-13%
-17%
-20%
Source: Company, MOSL
Lower marketing margins for spot/short-term volumes:
Marketing margins
depend on the demand-supply scenario in the LNG domestic market. PLNG has
historically maintained margins at INR10-40/mmbtu.
We have assumed
marketing margin of ~INR30/mmbtu for Dahej terminal.
Lower-than-expected
marketing margin is a downward risk to our earnings estimates.
Spike in LNG prices:
LNG demand in India is price-sensitive due to alternatives
such as naphtha and fuel oil. Sharp increase in LNG price will make alternative
fuels more attractive and impact LNG consumption demand in India.
Increase in domestic gas production:
Increase in domestic gas production
from
Daman/C26, B127, WO16, Vasai East, Rajahmundry, Cauvery Basin, S1 &
Vashishta and KG Basin could result in lower LNG imports for the country and
may lead to a decline in volumes for PLNG.
16 June 2017
17

Petronet LNG
Annexure: Future opportunities for LNG in India
LNG as an automotive fuel
LNG is an environmentally friendly fuel with less proportion of NOx, SOx and
particulate matters, compared to any other automotive fuel. CO2 emission is
also lesser than diesel. It is greener and more economical compared to diesel. It
is more suitable for heavy-duty segments like trucks and buses.
Exhibit 32: India’s first LNG-powered bus rolls out in Kerala
Source: Company, MOSL
Union Petroleum and Natural Gas Minister Dharmendra Pradhan and Kerala CM
Pinarayi Vijayan jointly launched India’s first LNG bus on 8 November 2016 in
Kerala. PLNG, IOCL and Tata Motors have jointly introduced LNG as a fuel in
commercial vehicles.
PLNG has finalized an arrangement with Kerala State Road Transport
Corporation (KSRTC) to set up an integrated fuel complex at its various depots in
the state that have the provision to dispense different fuels, including LNG and
CNG. The KSRTC, which has a fleet of 6,000 buses, has already announced to use
natural gas.
LNG bunkering
Government has provided a thrust to the use of LNG as a marine fuel on India’s
inland waterways and in coastal shipping. Vessels operating in the country’s
inland waterways switch from diesel to LNG bunkers.
Inland Waterways Authority of India (IWAI) and PLNG will work together to
develop the operation of LNG barges on Ganga, National Waterway -1, by the
end of 2018. (Petronet
LNG to Develop India LNG Bunkering for 2018).
PLNG will design, construct and operate LNG unloading, storage, bunkering and
reloading facilities.
16 June 2017
18

Petronet LNG
Financials and Valuations
Standalone - Income Statement
Y/E March
Total Income from Operations
Change (%)
Raw Materials
Employees Cost
Other Expenses
Total Expenditure
% of Sales
EBITDA
Margin (%)
Depreciation
EBIT
Int. and Finance Charges
Other Income
PBT bef. EO Exp.
EO Items
PBT after EO Exp.
Total Tax
Tax Rate (%)
Reported PAT
Adjusted PAT
Change (%)
Margin (%)
FY13
314,672
38.6
293,050
370
2,819
296,239
94.1
18,433
5.9
1,866
16,567
1,184
1,817
17,200
0
17,200
5,710
33.2
11,490
11,490
4.9
3.7
FY14
377,476
20.0
358,424
466
3,601
362,491
96.0
14,984
4.0
3,081
11,903
2,196
838
10,545
0
10,545
3,426
32.5
7,119
7,119
-38.0
1.9
FY15
395,010
4.6
376,109
571
3,940
380,620
96.4
14,390
3.6
3,154
11,236
2,935
1,548
9,849
1,323
11,172
2,347
21.0
8,825
7,502
5.4
1.9
FY16
271,334
-31.3
250,757
717
3,958
255,431
94.1
15,903
5.9
3,216
12,687
2,387
1,704
12,004
724
12,728
3,588
28.2
9,140
8,416
12.2
3.1
FY17
246,160
-9.3
214,169
739
5,330
220,238
89.5
25,923
10.5
3,691
22,232
2,097
3,466
23,602
0
23,602
6,545
27.7
17,057
17,057
102.7
6.9
FY18E
275,416
11.9
236,639
870
6,464
243,973
88.6
31,442
11.4
4,310
27,132
1,068
4,442
28,195
0
28,195
8,459
30.0
19,737
19,737
15.7
7.7
(INR Million)
FY19E
343,872
24.9
294,778
1,240
8,414
304,432
88.5
39,439
11.5
5,760
33,680
564
5,389
38,506
0
38,506
11,552
30.0
26,954
26,954
36.6
7.8
FY20E
349,275
1.6
297,722
1,438
9,719
308,879
88.4
40,396
11.6
5,885
34,511
7
6,930
41,435
0
41,435
14,084
34.0
27,351
27,351
1.5
7.8
Standalone - Balance Sheet
Y/E March
Equity Share Capital
Total Reserves
Net Worth
Total Loans
Deferred Tax Liabilities
Capital Employed
Gross Block
Less: Accum. Deprn.
Net Fixed Assets
Capital WIP
Total Investments
Curr. Assets, Loans&Adv.
Inventory
Account Receivables
Cash and Bank Balance
Loans and Advances
Curr. Liability & Prov.
Account Payables
Provisions
Net Current Assets
Appl. of Funds
E: MOSL Estimates
FY13
7,500
36,997
44,497
27,182
3,910
75,589
35,796
12,217
23,579
43,305
1,399
42,546
10,366
16,898
12,685
2,596
35,239
32,940
2,299
7,306
75,589
FY14
7,500
42,361
49,861
31,965
5,530
87,356
77,946
15,295
62,650
8,799
1,399
46,278
9,557
20,156
12,327
4,237
31,771
29,042
2,729
14,507
87,355
FY15
7,500
49,386
56,886
32,738
7,270
96,894
87,869
18,443
69,426
7,469
900
33,392
8,826
13,428
3,641
7,497
14,292
12,356
1,936
19,100
96,894
FY16
7,500
58,640
66,140
22,329
5,886
94,355
90,214
22,109
68,105
15,505
4,606
36,046
2,461
9,885
21,767
1,932
29,907
29,752
155
6,139
94,354
FY17
7,500
73,439
80,939
14,500
7,302
102,741
110,507
26,277
84,230
486
4,322
49,253
5,405
12,108
3,210
28,530
35,550
35,390
160
13,703
102,741
FY18E
7,500
87,634
95,134
16,000
7,302
118,436
113,946
30,587
83,359
2,047
4,322
63,096
6,684
12,073
14,220
31,607
34,389
30,804
4,737
28,708
118,436
(INR Million)
FY19E
7,500
107,019
114,519
100
7,302
121,921
116,446
36,347
80,099
4,547
4,322
74,427
8,341
15,074
18,997
32,016
41,474
35,006
6,469
32,953
121,921
FY20E
7,500
126,690
134,190
100
7,302
141,592
118,946
42,231
76,714
7,047
4,322
95,392
8,462
15,311
39,898
31,721
41,884
35,319
6,564
53,509
141,592
16 June 2017
19

Petronet LNG
Financials and Valuations
Ratios
Y/E March
Basic (INR)
EPS
Cash EPS
BV/Share
DPS
Payout (%)
Valuation (x)
P/E
Cash P/E
P/BV
EV/Sales
EV/EBITDA
Dividend Yield (%)
FCF per share
Return Ratios (%)
RoE
RoCE
RoIC
Working Capital Ratios
Asset Turnover (x)
Inventory (Days)
Debtor (Days)
Leverage Ratio (x)
Net Debt/Equity
FY13
15.3
17.8
59.3
2.5
19.1
FY14
9.5
13.6
66.5
2.0
24.7
FY15
10.0
14.2
75.8
2.0
19.9
42.7
30.1
5.6
0.9
24.3
0.5
-2.9
14.1
11.8
11.9
4.1
8
12
0.5
FY16
11.2
15.5
88.2
2.5
24.0
38.1
27.5
4.8
1.2
20.2
0.6
30.8
13.7
11.6
13.3
2.9
3
13
-0.1
FY17
22.7
27.7
107.9
5.0
25.7
18.8
15.4
4.0
1.3
12.8
1.2
-11.7
23.2
20.2
21.8
2.4
8
18
0.1
FY18E
26.3
32.1
126.8
6.3
28.1
16.5
13.6
3.4
1.3
11.3
1.5
20.1
22.4
19.8
18.0
2.2
9
16
0.0
FY19E
35.9
43.6
152.7
8.6
28.1
12.1
10.0
2.8
0.9
7.8
2.0
37.7
25.7
24.2
24.6
2.8
9
16
-0.2
FY20E
36.5
44.3
178.9
8.8
28.1
11.9
9.8
2.4
0.8
7.1
2.0
38.1
22.0
22.0
24.7
2.5
9
16
-0.3
0.6
10.9
28.8
17.9
51.2
4.2
12
20
0.3
0.5
-0.5
15.1
11.2
19.4
4.3
9
19
0.4
Standalone - Cash Flow Statement
Y/E March
OP/(Loss) before Tax
Depreciation
Direct Taxes Paid
(Inc)/Dec in WC
CF from Operations
Others
CF from Operating incl EO
(Inc)/Dec in FA
Free Cash Flow
(Pur)/Sale of Investments
Others
CF from Investments
Issue of Shares
Inc/(Dec) in Debt
Dividend Paid
Others
CF from Fin. Activity
Inc/Dec of Cash
Opening Balance
Closing Balance
FY13
17,203
1,866
-5,710
5,194
18,552
280
18,832
-10,635
8,197
0
0
-10,635
0
-3,158
-2,194
0
-5,351
2,846
9,839
12,685
FY14
10,545
3,081
-3,426
-7,559
2,641
4,620
7,261
-7,647
-386
0
0
-7,647
0
1,782
-1,755
0
28
-358
12,685
12,327
FY15
9,849
3,154
-1,024
-13,279
-1,300
7,740
6,440
-8,599
-2,159
499
0
-8,100
-45
-5,227
-1,755
0
-7,027
-8,686
12,327
3,641
FY16
11,992
3,216
-2,860
17,087
29,435
3,616
33,051
-9,931
23,120
-3,706
0
-13,637
2,314
-1,409
-2,194
0
-1,288
18,126
3,641
21,767
FY17
23,602
3,691
-6,545
-25,979
-5,232
1,274
-3,958
-4,796
-8,754
283
0
-4,513
2,130
-7,829
-4,387
0
-10,086
-18,557
21,767
3,210
FY18E
28,195
4,310
-8,459
-3,995
20,052
0
20,052
-5,000
15,052
0
0
-5,000
0
1,500
-5,542
0
-4,042
11,010
3,210
14,220
(INR Million)
FY19E
38,506
5,760
-11,552
532
33,246
0
33,246
-5,000
28,246
0
0
-5,000
0
-15,900
-7,568
0
-23,468
4,777
14,220
18,997
FY20E
41,435
5,885
-14,084
346
33,581
0
33,581
-5,000
28,581
0
0
-5,000
0
0
-7,680
0
-7,680
20,902
18,997
39,898
16 June 2017
20

Petronet LNG
NOTES
16 June 2017
21

Disclosures
This document has been prepared by Motilal Oswal Securities Limited (hereinafter referred to as Most) to provide information about the company (ies) and/sector(s), if any, covered in the report and may be distributed by it
and/or its affiliated company(ies). This report is for personal information of the selected recipient/s and does not construe to be any investment, legal or taxation advice to you. This research report does not constitute an
offer, invitation or inducement to invest in securities or other investments and Motilal Oswal Securities Limited (hereinafter referred as MOSt) is not soliciting any action based upon it. This report is not for public distribution
and has been furnished to you solely for your general information and should not be reproduced or redistributed to any other person in any form. This report does not constitute a personal recommendation or take into
account the particular investment objectives, financial situations, or needs of individual clients. Before acting on any advice or recommendation in this material, investors should consider whether it is suitable for their
particular circumstances and, if necessary, seek professional advice. The price and value of the investments referred to in this material and the income from them may go down as well as up, and investors may realize losses
on any investments. Past performance is not a guide for future performance, future returns are not guaranteed and a loss of original capital may occur.
MOSt and its affiliates are a full-service, integrated investment banking, investment management, brokerage and financing group. We and our affiliates have investment banking and other business relationships with a some
companies covered by our Research Department. Our research professionals may provide input into our investment banking and other business selection processes. Investors should assume that MOSt and/or its affiliates are
seeking or will seek investment banking or other business from the company or companies that are the subject of this material and that the research professionals who were involved in preparing this material may educate
investors on investments in such business . The research professionals responsible for the preparation of this document may interact with trading desk personnel, sales personnel and other parties for the purpose of
gathering, applying and interpreting information. Our research professionals are paid on twin parameters of performance & profitability of MOSt.
MOSt generally prohibits its analysts, persons reporting to analysts, and members of their households from maintaining a financial interest in the securities or derivatives of any companies that the analysts cover.
Additionally, MOSt generally prohibits its analysts and persons reporting to analysts from serving as an officer, director, or advisory board member of any companies that the analysts cover. Our salespeople, traders, and
other professionals or affiliates may provide oral or written market commentary or trading strategies to our clients that reflect opinions that are contrary to the opinions expressed herein, and our proprietary trading and
investing businesses may make investment decisions that are inconsistent with the recommendations expressed herein. In reviewing these materials, you should be aware that any or all of the foregoing among other things,
may give rise to real or potential conflicts of interest. MOSt and its affiliated company(ies), their directors and employees and their relatives may; (a) from time to time, have a long or short position in, act as principal in, and
buy or sell the securities or derivatives thereof of companies mentioned herein. (b) be engaged in any other transaction involving such securities and earn brokerage or other compensation or act as a market maker in the
financial instruments of the company(ies) discussed herein or act as an advisor or lender/borrower to such company(ies) or may have any other potential conflict of interests with respect to any recommendation and other
related information and opinions.; however the same shall have no bearing whatsoever on the specific recommendations made by the analyst(s), as the recommendations made by the analyst(s) are completely independent
of the views of the affiliates of MOSt even though there might exist an inherent conflict of interest in some of the stocks mentioned in the research report
Reports based on technical and derivative analysis center on studying charts company's price movement, outstanding positions and trading volume, as opposed to focusing on a company's fundamentals and, as such, may not match with a report on a
company's fundamental analysis. In addition MOST has different business segments / Divisions with independent research separated by Chinese walls catering to different set of customers having various objectives, risk profiles, investment horizon,
etc, and therefore may at times have different contrary views on stocks sectors and markets.
Unauthorized disclosure, use, dissemination or copying (either whole or partial) of this information, is prohibited. The person accessing this information specifically agrees to exempt MOSt or any of its affiliates or employees
from, any and all responsibility/liability arising from such misuse and agrees not to hold MOSt or any of its affiliates or employees responsible for any such misuse and further agrees to hold MOSt or any of its affiliates or
employees free and harmless from all losses, costs, damages, expenses that may be suffered by the person accessing this information due to any errors and delays. The information contained herein is based on publicly
available data or other sources believed to be reliable. Any statements contained in this report attributed to a third party represent MOSt’s interpretation of the data, information and/or opinions provided by that third party
either publicly or through a subscription service, and such use and interpretation have not been reviewed by the third party. This Report is not intended to be a complete statement or summary of the securities, markets or
developments referred to in the document. While we would endeavor to update the information herein on reasonable basis, MOSt and/or its affiliates are under no obligation to update the information. Also there may be
regulatory, compliance, or other reasons that may prevent MOSt and/or its affiliates from doing so. MOSt or any of its affiliates or employees shall not be in any way responsible and liable for any loss or damage that may
arise to any person from any inadvertent error in the information contained in this report. MOSt or any of its affiliates or employees do not provide, at any time, any express or implied warranty of any kind, regarding any
matter pertaining to this report, including without limitation the implied warranties of merchantability, fitness for a particular purpose, and non-infringement. The recipients of this report should rely on their own
investigations.
This report is intended for distribution to institutional investors. Recipients who are not institutional investors should seek advice of their independent financial advisor prior to taking any investment decision based on this
report or for any necessary explanation of its contents.
Most and it’s associates may have managed or co-managed public offering of securities, may have received compensation for investment banking or merchant banking or brokerage services, may have received any
compensation for products or services other than investment banking or merchant banking or brokerage services from the subject company in the past 12 months.
Most and it’s associates have not received any compensation or other benefits from the subject company or third party in connection with the research report.
Subject Company may have been a client of Most or its associates during twelve months preceding the date of distribution of the research report
MOSt and/or its affiliates and/or employees may have interests/positions, financial or otherwise of over 1 % at the end of the month immediately preceding the date of publication of the research in the securities mentioned
in this report. To enhance transparency, MOSt has incorporated a Disclosure of Interest Statement in this document. This should, however, not be treated as endorsement of the views expressed in the report.
Motilal Oswal Securities Limited is registered as a Research Analyst under SEBI (Research Analyst) Regulations, 2014. SEBI Reg. No. INH000000412
Pending Regulatory inspections against Motilal Oswal Securities Limited:
SEBI pursuant to a complaint from client Shri C.R. Mohanraj alleging unauthorized trading, issued a letter dated 29th April 2014 to MOSL notifying appointment of an Adjudicating Officer as per SEBI regulations to hold inquiry
and adjudge violation of SEBI Regulations; MOSL replied to the Show Cause Notice whereby SEBI granted us an opportunity of Inspection of Documents. Since all the documents requested by us were not covered we have
requested to SEBI vide our letter dated June 23, 2015 to provide pending list of documents for inspection.
List of associate companies of Motilal Oswal Securities Limited -Click
here to access detailed report
Analyst Certification
The views expressed in this research report accurately reflect the personal views of the analyst(s) about the subject securities or issues, and no part of the compensation of the research analyst(s) was, is, or will be directly or
indirectly related to the specific recommendations and views expressed by research analyst(s) in this report. The research analysts, strategists, or research associates principally responsible for preparation of MOSt research
receive compensation based upon various factors, including quality of research, investor client feedback, stock picking, competitive factors and firm revenues
Petronet LNG
Disclosure of Interest Statement
Analyst ownership of the stock
No
Served as an officer, director or employee -
No
A graph of daily closing prices of securities is available at www.nseindia.com and http://economictimes.indiatimes.com/markets/stocks/stock-quotes
Regional Disclosures (outside India)
This report is not directed or intended for distribution to or use by any person or entity resident in a state, country or any jurisdiction, where such distribution, publication, availability or use would be contrary to law,
regulation or which would subject MOSt & its group companies to registration or licensing requirements within such jurisdictions.
For Hong Kong:
This report is distributed in Hong Kong by Motilal Oswal capital Markets (Hong Kong) Private Limited, a licensed corporation (CE AYY-301) licensed and regulated by the Hong Kong Securities and Futures
Commission (SFC) pursuant to the Securities and Futures Ordinance (Chapter 571 of the Laws of Hong Kong) “SFO”. As per SEBI (Research Analyst Regulations) 2014 Motilal Oswal Securities (SEBI Reg No. INH000000412) has
an agreement with Motilal Oswal capital Markets (Hong Kong) Private Limited for distribution of research report in Kong Kong. This report is intended for distribution only to “Professional Investors” as defined in Part I of
Schedule 1 to SFO. Any investment or investment activity to which this document relates is only available to professional investor and will be engaged only with professional investors.” Nothing here is an offer or solicitation
of these securities, products and services in any jurisdiction where their offer or sale is not qualified or exempt from registration. The Indian Analyst(s) who compile this report is/are not located in Hong Kong & are not
conducting Research Analysis in Hong Kong.
For U.S.
Motilal Oswal Securities Limited (MOSL) is not a registered broker - dealer under the U.S. Securities Exchange Act of 1934, as amended (the"1934 act") and under applicable state laws in the United States. In addition MOSL is
not a registered investment adviser under the U.S. Investment Advisers Act of 1940, as amended (the "Advisers Act" and together with the 1934 Act, the "Acts), and under applicable state laws in the United States.
Accordingly, in the absence of specific exemption under the Acts, any brokerage and investment services provided by MOSL, including the products and services described herein are not available to or intended for U.S.
persons.
This report is intended for distribution only to "Major Institutional Investors" as defined by Rule 15a-6(b)(4) of the Exchange Act and interpretations thereof by SEC (henceforth referred to as "major institutional investors").
This document must not be acted on or relied on by persons who are not major institutional investors. Any investment or investment activity to which this document relates is only available to major institutional investors
and will be engaged in only with major institutional investors. In reliance on the exemption from registration provided by Rule 15a-6 of the U.S. Securities Exchange Act of 1934, as amended (the "Exchange Act") and
interpretations thereof by the U.S. Securities and Exchange Commission ("SEC") in order to conduct business with Institutional Investors based in the U.S., MOSL has entered into a chaperoning agreement with a U.S.
registered broker-dealer, Motilal Oswal Securities International Private Limited. ("MOSIPL"). Any business interaction pursuant to this report will have to be executed within the provisions of this chaperoning agreement.
The Research Analysts contributing to the report may not be registered /qualified as research analyst with FINRA. Such research analyst may not be associated persons of the U.S. registered broker-dealer, MOSIPL, and
therefore, may not be subject to NASD rule 2711 and NYSE Rule 472 restrictions on communication with a subject company, public appearances and trading securities held by a research analyst account.
For Singapore
Motilal Oswal Capital Markets Singapore Pte Limited is acting as an exempt financial advisor under section 23(1)(f) of the Financial Advisers Act(FAA) read with regulation 17(1)(d) of the Financial Advisors Regulations and is a
subsidiary of Motilal Oswal Securities Limited in India. This research is distributed in Singapore by Motilal Oswal Capital Markets Singapore Pte Limited and it is only directed in Singapore to accredited investors, as defined in
the Financial Advisers Regulations and the Securities and Futures Act (Chapter 289), as amended from time to time.
In respect of any matter arising from or in connection with the research you could contact the following representatives of Motilal Oswal Capital Markets Singapore Pte Limited:
Varun Kumar
Varun.kumar@motilaloswal.com
Contact : (+65) 68189232
Office Address:21 (Suite 31),16 Collyer Quay,Singapore 04931
PETRONET LNG
Motilal Oswal Securities Ltd
16 June 2017
Motilal Oswal Tower, Level 9, Sayani Road, Prabhadevi, Mumbai 400 025
Phone: +91 22 3982 5500 E-mail: reports@motilaloswal.com
22