28 June 2017
Market snapshot
Equities - India
Close
Chg .%
Sensex
30,958
-0.6
Nifty-50
9,511
-0.7
Nifty-M 100
17,456
-1.3
Equities-Global
Close
Chg .%
S&P 500
2,419
-0.8
Nasdaq
6,147
-1.6
FTSE 100
7,434
-0.2
DAX
12,671
-0.8
Hang Seng
10,498
-0.3
Nikkei 225
20,225
-0.4
Commodities
Close
Chg .%
Brent (US$/Bbl)
46
0.6
Gold ($/OZ)
1,251
0.7
Cu (US$/MT)
5,838
1.2
Almn (US$/MT)
1,877
1.2
Currency
Close
Chg .%
USD/INR
64.5
0.0
USD/EUR
1.1
0.9
USD/JPY
111.6
0.4
YIELD (%)
Close
1MChg
10 Yrs G-Sec
6.5
0.0
10 Yrs AAA Corp
7.5
0.0
Flows (USD b)
27-Jun
MTD
FIIs
0.0
0.5
DIIs
0.0
0.7
Volumes (INRb)
27-Jun
MTD*
Cash
285
270
F&O
8,261
4,976
Note: YTD is calendar year, *Avg
YTD.%
16.3
16.2
21.6
YTD.%
8.1
14.2
4.1
10.4
11.7
5.8
YTD.%
-17.5
7.9
5.7
10.1
YTD.%
-5.0
6.8
-4.7
YTDchg
-0.1
0.0
YTD
8.3
3.0
YTD*
285
4,827
Today’s top research idea
Titan Company: Ambitious 20% CAGR targeted in Jewelry sales
Fair valuations limit upside
v
Management outlined the five key pillars that would help it achieve targeted
growth of 2.5x over the next five years (20% CAGR): (1) Wedding Jewelry, (2)
High-value Diamond Jewelry, (3) Golden Harvest Scheme, (4) Store Addition
and (5) Market Share Growth.
v
The company is also investing in loyalty programs, a weak area.
v
Higher compliance focus under the GST regime should boost growth.
v
Valuations at 42.2x FY19E are fair for a business with~20% RoEs, and earnings
CAGR is expected at 16%. Watches and Eyewear segments continue to be a bit
of drag on overall earnings growth. We maintain
Neutral
rating with a target
price of INR525 (valued at 41x June-2019E EPS, in line with three-year average
multiple).
Research covered
Cos/Sector
Financials
Technology
Titan Company
United Spirits
Key Highlights
INR6t opportunity in affordable housing finance
TCS and Infosys AGMs
Ambitious 20% CAGR targeted in Jewelry sales
Significant challenges on the horizon
Piping hot news
Bankruptcy proceedings started against Essar Steel, Monnet Ispat
v
Essar Steel Ltd and Monnet Ispat and Energy Ltd have become the first of the
12 big bad loans cases identified by the Reserve Bank of India (RBI) against
which bankruptcy proceedings have been filed, said two people aware of the
matter.
Quote of the day
Time is more valuable than money. You
can get more money, but you cannot get
more time
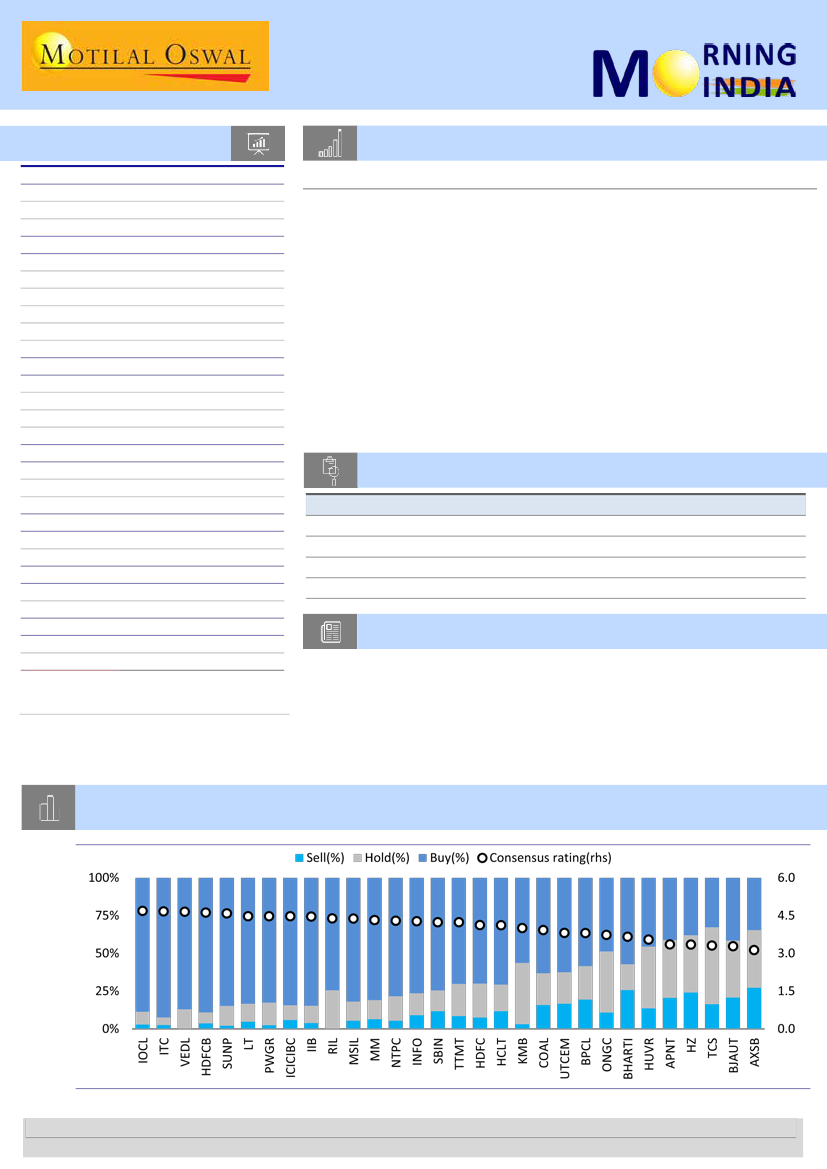
Chart of the Day: Contrarian Investing - Stock popularity of 30 largest companies arranged by consensus
popularity ratings (Consensus rating of 30 largest stocks of BSE100)
Research Team (Gautam.Duggad@MotilalOswal.com)
Motilal Oswal research is available on www.motilaloswal.com/Institutional-Equities, Bloomberg, Thomson Reuters, Factset and S&P Capital.
Investors are advised to refer through important disclosures made at the last page of the Research Report.

In the news today
Kindly click on textbox for the detailed news link
1
NITI Aayog proposes break up
of Coal India into seven firms
India should split the seven units
of state-controlled Coal India Ltd
into independent companies to
make it more competitive,
government’s policy thinktank
NITI Aayog said on Tuesday in a
draft of a new energy policy…
2
The objective of the recent Reliance-BP Plc investment plan may be to
boost domestic gas production, but this may take some time. K
Ravichandran, Senior Vice-President at ICRA, told BusinessLine that the
demand for natural gas will double in the near term, but domestic
production will lag far behind. India’s domestic production has been falling
for some time despite a number of new fields being developed and RIL-BP
announcing further investments in their KG-D6 block…
Gas imports unlikely to fall for now
3
Growth in toll revenues led by
traffic volumes witnessed in the
last two years could come to a halt
in the financial year 2017-2018.
With traffic volumes still limping
back to normal after
demonetisation, the traffic is
estimated to grow in the range of
4-5% in terms of the average
annual daily traffic in FY18.…
Infrastructure: Toll revenue
growth to be hit in F418, says
Icra
4
Used car GST: No levy on sales
by individuals, says Hasmukh
Adhia
The sale of second-hand cars on
the vendor platforms will attract
goods and services tax (GST) only
on the margins made by the
dealer, revenue secretary
Hasmukh Adhia clarified on
Tuesday, removing apprehensions
that the tax will apply on the
entire sale value …
5
Tata Power, Adani Power
crisis-Mundra units on offer at
Re 1: GUVNL says ready to
take 100 pct stake
6
Cotton crop in top grower seen
at three-year high on local
price
Cotton output in India, the world’s
biggest grower, may increase to a
three-year high as some farmers
plant more of the fiber on better
returns compared to other
crops.…
7
IMF cuts 2017 economic
growth forecast for US
The International Monetary Fund
revised its 2017 gross domestic
product (GDP) growth forecast for
the US downward from 2.3 per
cent to 2.1 per cent, citing the
Trump administration's inability to
implement its economic policies...
Gujarat’s state-run power utility
GUVNL has expressed its
willingness to take ownership of
the troubled plants of Tata Power
and Adani Power in the state but
only if 100% stakes are transferred
to it for a nominal Rs 1, instead of
the 51% each offered by the two
private companies…
28 June 2017
2

Sector Update | 28 June 2017
Financials
INR6t opportunity in affordable housing finance
Strong medium- to long-term tailwinds in place
Long-term structural drivers in place
Opportunity for housing financing companies (HFCs) continues to remain large, led
by multiple growth drivers: a) strong housing demand in tier-2/3 cities due to
continued urbanization, b) rising income with increasing affordability and c)
shrinking/nuclear families. Low interest rates also bode well for HFCs (mortgage
rates are down ~250bp from five-year peak, effectively resulting in ~15% reduction
in mortgage payments).
Affordable housing could attract ~INR200b in equity over next five years
Rural India is facing significant housing shortage (43.7m units, as per the Working
Group on Rural Housing for the 12
th
Five-Year Plan). Also, according to estimates of
the Technical Group constituted by the Ministry of Housing and Urban Poverty
Alleviation (MHUPA), urban housing shortage in the country at the end of the 10
th
Five-Year Plan stood at 24.71m, 88% of which pertains to economically weaker
sections (EWS) and another 11% for lower income group (LIG). India Ratings
estimates demand for ~25m homes in the affordable housing segment (MIG and
LIG), translating into INR6t opportunity in housing finance through FY22. Affordable
housing is expected to attract ~INR200b in equity over FY17-22.
Schemes in affordable housing show strong regulator intent
The Indian government has taken a number of steps to promote affordable housing.
The Union Budget 2017 allows 100% deduction for profits generated from
affordable housing projects (<30 sq.mt. in metro cities and <60 sq.mt. in other
areas) approved before March 2019 and completed within three years of approval.
A recently approved scheme for middle income group (MIG) first-time borrowers
provides interest subsidy of 4%/3% for loans up to INR0.9m/INR1.2m for borrowers
whose household income is below INR1.2m/INR1.8m.
Infrastructure status to affordable housing will help lower cost of funds
The Budget proposed granting infrastructure status to affordable housing, which
should help developers to diversify their funding sources and reduce cost of funds.
Implementation of Real Estate Regulatory Authority (RERA) bill is likely to bring
greater transparency in the real estate sector, protect the interests of the
shareholders and ensure timely delivery of projects. On key implication of RERA is
that housing prices will remain stable until all units are sold. In-situ slum
redevelopment programs and PPP schemes are likely to be the key enablers of
affordable housing over the coming years.
28 June 2017
3

Huge opportunity, but challenges persist
The biggest challenge to the housing finance opportunity is in relation to the funding
requirements of developers, as to whether they have the balance sheet strength to
take on such high leverage and fund land purchases. We expect margins to come
under considerable pressure in case of: a) rising interest rate scenario, b) increasing
refinancing of loans and c) trade-off between yields and ratings/risk profile. New
entrants in the HFC space are operating in a demanding environment wherein they
have very high opex and low margins. This may tempt the new entrants to have
greater exposure to developer finance, which, in turn, will impact their risk profiles
and ratings.
Valuation and view
We believe the best time for the sector is yet to come. With stable property prices
and lower interest rates (-150bp over the past two years), we expect demand for
housing to pick up. Additionally, we expect good traction in the CLSS-MIG scheme,
which should drive further allocation from the government. More importantly, the
government has taken several measures, such as tax incentives, to address supply-
side challenges. While we do not expect pick-up in the sector in FY18, we believe
growth could be stronger than expected over FY19-22. Re-rating of stocks reflects
the optimism around growth and profitability. We remain sanguine on the sector
and expect it to be a strong compounder over time.
Union Budget apportioned ~INR10b for the interest subsidy scheme for MIG first-time borrowers
Particulars
Household income (INR p.a.)
Interest subsidy (%)
Maximum loan tenure (years)
Eligible housing loan amount for interest subsidy (INR)
Dwelling unit carpet area
Discount rate for NPV calculation
MIG I
12,00,000
4.00%
20
9,00,000
90 Sq. m.
9.00%
MIG II
18,00,000
3.00%
20
12,00,000
110 Sq. m.
9.00%
Source: MOSL, MHUPA
Average ticket size (INR m)
3.2
2.5
2.1
1.7
0.9
0.9
1.2
2.5
REPCO
GRUH
DHFL
CanFin
LICHF
HDFC
IHFL
PNBHF
Source: MOSL, Company
28 June 2017
4

Estimated housing shortage in rural areas
Factors
No. of households without houses - 2012
No. of temporary houses - 2012
Shortage due to congestion - 2012
Shortage due to obsolescence - 2012
Additional housing shortage arising between 2012-17
Total rural housing shortage
Shortage (million)
4.2
20.2
11.3
7.5
0.6
43.7
th
Source: MOSL, Working Group on Rural Housing for the 12 Five-Year Plan
Housing requirement in top 10 states by 2022
Urban housing requirement
Rural housing requirement
146
55
54
50
69
19
Bihar
40
37
Andhra
Pradesh
42
34
West Bengal
51
22
Madhya
Pradesh
45
21
Rajasthan
18
39
Tamil Nadu
21
29
Gujrat
21
28
Karnataka
Uttar Pradesh Maharashtra
Source: MOSL, NAREDCO
PSBs vacating low-ticket housing owing to high opex and NPLs
PSB's HL disbursement >INR1m (%)
PSB's HL disbursement <INR1m (%)
Delinquency trend of HFCs v/s PSBs
Median for HFCs for 1HFY17 (%)
11.4
PSBs delinquencies for FY15 (%)
62
59
69
75
82
84
87
89
2.8
1.2
1
1.4
38
FY10
41
FY11
31
FY12
25
FY13
18
FY14
16
FY15
13
FY16
11
FY17
<INR0.2m
0.8
0.7 0.9
0.6 0.6
>INR2.5m
INR0.2-0.5m INR0.5-1.0m INR1-2.5m
Source: NHB, RBI, Ind-Ra estimates
Source: NHB, Ind-Ra, Company
28 June 2017
5

Sector Update | 28 June 2017
Technology
TCS and Infosys AGMs
A tale of contrasting states of existence
Last week the top-2 Indian IT firms hosted their respective AGMs and laid out the details of
the fiscal gone by and the road ahead. Appended below are a couple of quick pointers
comparing the two events:
TCS Valuation Summary (INR b)
Y/E Mar
2017 2018E 2019E
Sales
EBITDA
PAT
EPS (INR)
EPS Gr. %
BV/Sh. INR
RoE (%)
RoCE (%)
Payout (%)
Valuations
P/E (x)
P/BV (x)
EV/EBITDA
Div. yld %
17.3
5.4
13.0
2.0
16.5
5.6
12.6
5.9
15.4
4.7
11.2
2.6
n
High level focus – INFY’s evident distraction
n
1,180
323.1
262.9
133.4
8.3
425.3
33.5
32.4
35.2
1,264
336.8
267.5
139.7
4.7
413.9
32.4
27.7
97.2
1,399
370.2
286.3
149.6
7.0
485.8
32.3
25.5
40.6
n
Expectedly, much of the time-share in INFO’s presentation stressed on clearing
the air around Governance w.r.t Panaya, top management compensation and
couple of severances. INFO detailed how enough investigations have been
carried out and they have come clean. These issues and the consequent tiff with
promoters also dominated investor queries and concerns from investors.
TCS, on the other hand, could fully devote its attention to the achievements in
FY17, outlook for FY18, strategic road ahead and focus on shareholder value.
A ready engine v/s another fighting multiple battles – view of their
respective worlds
n
Infosys Valuation Summary (INR b)
Y/E Mar
Sales
EBITDA
PAT
EPS (INR)
EPS Gr. %
BV/Sh. INR
RoE (%)
RoCE (%)
Payout (%)
Valuations
P/E (x)
P/BV (x)
EV/EBITDA
Div Yld (%)
14.7
3.1
9.3
2.8
14.8
2.8
8.9
3.2
13.5
2.5
7.7
3.7
n
2017
684.9
186.1
143.8
62.9
6.6
301.6
22.0
22.0
40.9
2018E
712.5
184.9
143.0
62.6
-0.6
334.2
19.7
19.7
48.0
2019E
797.7
207.7
157.4
68.9
10.1
364.2
19.7
19.7
49.4
n
TCS highlighted process excellence till now gave companies edge. But now, data
excellence will be increasingly relevant for all industries. The immense
opportunity in technology will continue to drive growth in the future. Business
models will change, TCS is invested in the right areas and the management team
is ready for execution.
INFO interestingly cited the three simultaneous transformations being
undertaken: [1] “Abrupt " transformation from promoter-led to professional
management led, [2] Cultural transformation with recruiting top-level talent
from across the globe, and [3] Business transformation from traditional to
innovative led.
INFO also cited three challenges that it needs to overcome on the execution
front: [1] Process and execution (agility), [2] Empowerment, decentralization,
[3] Managing and communicating change.
New technologies – some incremental learning
n
INFO cited a host of new services that it had launched and the traction in the
same. From 1QFY18, it will start reporting revenues in new areas: [1] moving
legacy systems to cloud, [2] Internet of Things, [3] Cyber security, [4] API
economy, [5] Strategic Design Consulting. Revenues from INFO’s new software
grew 42% YoY in FY17.
TCS cited its revenues from Digital were USD3b in FY17 (they have been sharing
this metric through the quarterly disclosures in FY17). They recently announced
a restructuring of their services to align with the new demand era, and the same
may also reflect in their reporting metrics going forward. The management is
relooking at this. TCS’ Digital business grew 28.8% YoY
28 June 2017
6

Future Thrusts: Continued firsts for one, continued transformational
endeavor for the other
n
n
TCS cited how sailed through multiple technology waves - of mainframe, ERP
systems and the likes. It has invested ahead of time and has managed to skill its
employees ahead of the curve this time as well. What is different in this wave is
the number of strategic partnerships with startups and co-innovation with
customers.
INFO on the other hand laid out the same old endeavor of “renew + new,
governed by a culture of learning & innovation” – In NRN’s words “Transform
from a culture of reactive problem solvers to proactive problem finders”.
Despite its troubles, INFO has matched industry growth in last two fiscals and its guidance (6.5-
8.5% YoY CC) again is in line with Nasscom’s (7-8%) for the IT industry in FY18
YoY CC revenue growth (%)
13.3
12.3
Infosys
Industry
8.3
8.6
FY16
FY17
Employee costs as a % of revenues have declined over last two years despite evident pricing pressure on top-line and wage hikes
INFO's Employee cost as a % of revenue (%)
55.8
INFO's YoY Realization change (%)
55.1
55
-1.4
-1.1
FY15
FY16
FY17
-1.9
28 June 2017
7

C
orner
O
ffice
Interaction with the CEO
the
23 June 2017
Ambitious 20% CAGR targeted in Jewelry sales
Fair valuations limit upside
Key highlights:
n
Management outlined the five key pillars that would help it achieve targeted growth of
2.5x over the next five years (20% CAGR): (1) wedding jewelry, (2) high-value diamond
jewelry, (3) Golden Harvest Scheme, (4) store addition and (5) market share growth.
n
The company is also investing in loyalty programs, a weak area.
n
Higher compliance focus under the GST regime should boost growth.
Titan Company
There is no change to our forecasts. Valuations at 42.2x FY19E are fair for a business with~20%
RoEs, and earnings CAGR is expected at 16%. Watches and Eyewear segments continue to be a
Mr Bhaskar Bhat —
bit of drag on overall earnings growth. We maintain Neutral rating with a target price of INR525
Managing Director
Mr Bhaskar Bhat has been
(valued at 41x June-2019E EPS, in line with three-year average multiple).
Managing Director of Titan
Company Limited since April
Key pillars of growth
2002. He also serves as the
The company outlined the five key pillars that would help it achieve the targeted 20%
company’s Chief Executive
sales CAGR (assuming no gold price escalation or reduction) over the next five years:
Officer and Executive Non-
n
Wedding jewelry
Independent Director. At
Ø
The company was growing strongly in adornment jewelry. However, market
Titan, Mr Bhat was also part
slowdown due to weak consumer sentiment and regulatory issues in the Golden
of sales & marketing,
human resources,
Harvest Scheme (used to be 30% of sales at peak) necessitated an entry into
international business and
wedding jewelry. Wedding jewelry (INR1.5t) is a much bigger market than
various general managerial
adornment jewelry (INR0.5t).
assignments. He started his
Ø
The large hub wedding jewelry stores aim to be the best in the city in terms of
career as management
variety, display, staff knowledge and customer experience. Inventory in these
trainee at Godrej & Boyce
stores will be high, given the special-occasion nature of the purchases.
Manufacturing in 1978. Mr
Ø
Post five years, wedding jewelry would be 40% of jewelry sales for the company,
Bhat completed his Post
Graduate Diploma in
as against industry average of 55-60%.
Management from Indian
n
High-value diamond jewelry
offers higher customization. After an increased focus on
Institute of Management
wedding jewelry and high-value diamond jewelry in recent years, the average ticket
(IIM), Ahmedabad in 1978,
size of first-time walk-ins has increased significantly.
and B.Tech in Mechanical
n
Golden Harvest Scheme
is recovering and accounted for 14% of sales in FY17 (target:
Engineering from Indian
Institute of Technology (IIT),
18% in FY18). This used to be 30% of sales at peak, and now recovering sharply.
Madras in 1976 (also
n
Store addition,
particularly in traditionally weaker cities (middle India towns), with
received the Distinguished
region-specific jewelry portfolio. The company plans to open 27 new stores in 19
Alumnus Award in IIT
towns in FY18 as part of this initiative.
Madras in 2008).
n
Market share growth
Ø
Compliance requirements are high under the GST regime, which should benefit organized players like Titan.
Ø
The industry is likely to see growth coming mainly from large stores, rather than small jewelers. There are
many big local jewelers in each city. While long-term family relationship with local jewelers is a hindrance in
attracting new customers, Titan aims to take share via initiatives on store addition, portfolio diversification
and benefiting from a favorable regulatory regime.
Ø
Tanishq brand is weak only in Chennai, partly because buyers there are extremely value conscious and the
brand is perceived to be a north Indian one. In the rest of the cities (including other South Indian ones), the
brand recall is good even amid high competition.
28 June 2017
8

Ø
Ø
Titan has design (manufacturing) strength and wide assortment coming from a precision engineering
background. No other jeweler has that strength.
Southern organized players like Kalyan and Malabar have a large share of customers from the South Indian population in
cities outside of this region, which leaves the market wide open for players like Titan.
GST regime and challenges
n
n
On gold purchases from customers, Titan will pay 3% and avail credit, but not charge customers.
100-150 tons of gold is smuggled, which could help unorganized trade thrive.
Weaknesses on which the company is working
n
Management acknowledges that loyalty programs can be used better. This is an area in which the company is
reportedly investing a lot. Knowledge of customers can be leveraged better for cross-selling. It has 8m watch
customers.
Financials
n
According to management, RoCE in FY18 will be similar to FY17, even if margins are lower in the quest for
growth. The company is looking to increase asset turns to offset margin impact.
28 June 2017
9

C
orner
O
ffice
Interaction with the CEO
the
23 June 2017
Significant challenges on the horizon
Valuations fair, maintain Neutral
n
United Spirits
n
n
Mr Anand Kripalu —
MD & CEO
Mr Anand Kripalu has
served as the Chief
Executive Officer and
n
Managing Director at
United Spirits since
September 1, 2014. He has
been a Director of United
Impact of highway ban on demand unlikely to continue beyond FY18
The ban on the sale of alcoholic beverages along highways is impacting consumption as
Spirits since August 14,
2014. A Bachelor in
well as the pipeline. UNSP expects instability in demand up to 3QFY18, but does not
Electronics from the Indian
expect sustained loss of demand beyond the current financial year. Given that the states
Institute of Technology,
too want to maximize revenue, UNSP expects a quick resolution. The Restaurant Owners
Madras, and an MBA from
Association in Tamil Nadu has appealed against the Supreme Court judgment that has
the Indian Institute of
Management, Calcutta, Mr
brought on-premise consumption into the ambit of the highway ban; a hearing on this
Kripalu has a rich
issue is expected in July.
experience of over 24 years
in the FMCG industry.
The ban on sale of alcoholic beverages along highways is likely to impact the business up to
3QFY18. A favorable hearing in July to a petition filed by the Restaurant Owners
Association of Tamil Nadu could help mitigate the impact.
UNSP is confident of an improvement in the long-term pricing environment. The longer-
term margin growth potential remains intact, mainly led by continued mix improvements.
UNSP believes franchising of Popular brands is a win-win situation for both parties.
In our recent report on
Alcoholic Beverages,
we had pointed out the risks emanating from a
host of factors like (a) the impact of GST implementation on profitability, and (b) the
impact of ban on sale of alcoholic beverages along highways and the prohibition decrees by
various states on volumes.
Our DCF-based valuation indicates a target price of INR2,415. Owing to limited 8% upside,
we maintain our Neutral rating on the stock.
GST effect not as high as feared
The impact of GST would not be as severe as feared initially, with ENA being kept out of
the GST ambit. However, packaging and molasses would be subject to higher rates of
taxation under the GST regime. UNSP should be able to provide clarity on the margin
impact with a fair degree of accuracy in two weeks, by when it expects it would be able
to understand all the provisions.
Company expects price hikes on a regular basis in medium term
UNSP took price increases in Karnataka, Maharashtra and West Bengal in FY17. It is yet
to be granted price increases in other key states like Andhra Pradesh and Telangana.
The company intends to bargain for price increases after fully understanding the GST
impact. In FY17, higher proportion of the gross margin increase (90bp out of 155bp
improvement) was on account of price increases and not due to premiumization, which
is more sustainable. However, UNSP is not worried, as it expects price increases more
regularly in the medium to long term.
Franchising to help arrest gross margin decline and free up working capital
In states where UNSP intends to retain its Popular brands (lower end brands), it is
developing separate teams for the Popular and the Prestige and Above (P&A) segments.
It already has such a system in place in Karnataka, which it plans to replicate in
Maharashtra and West Bengal.
He has served as President
of Asian Operations at
Cadbury, President of South
Asia and Indo-China at
Mondelez India Foods,
Managing Director of
Cadbury Schweppes Asia-
Pacific, and served the
Unilever Group for over two
decades. With Unilever, his
key stints include setting up
of the Dental Innovation
Center at Mumbai, Head of
Market Research, Head of
Marketing for the Laundry
category for both India and
the Central Asia Middle East
Region, General Manager of
Sales & Customer
Development for HLL
Lifecare, and Managing
Director for Unilever's East
African Operations.
28 June 2017
10

In the 13 states where UNSP has exited the Popular segment by opting for the franchise route (to reduce negative
impact on gross margin and free up working capital), it has adopted a strategy similar to Coke’s. UNSP retains the
intellectual property – if and when country liquor is banned in these states, UNSP would have an option to get back
the business from the franchise partner after paying compensation.
UNSP would continue to develop the brands in the states where it retains them and would share the benefits with
the franchisees in other states.
Other takeaways
Ø
Ø
Investors were concerned by a one-off INR3.1b compensation to a third party in 4QFY17. While one-offs cannot
be predicted, UNSP believes that such one-offs are highly unlikely going forward.
Demonetization dented UNSP’s asset restructuring plan. This is why the company is guiding for value unlocking
over a 3-4 year period.
28 June 2017
11

In conversation
1. Prepared for some degree of degrowth: Marico; Harsh
Mariwala, Chairman
n
n
n
n
Will see single digit negative growth in April – June Quarter
Production to be cut in the range of 5-7% to adjust to the varying demand
Expect volume growth to resume from 3QFY18 onwards. 2HFY18 to be better
than 2HFY17
Would focus on wellness and beauty products going forward
2. India & America must work together to create jobs: Spicejet;
Ajay Singh, Chairman
n
n
n
n
n
SpiceJet has bought up to 205 aircrafts from Boeing. They are worth USD 22
billion and helped create 132k jobs in USA
In addition, announced 20 more on the sidelines of the Paris air-show
These aircrafts start coming in, in August of 2018 and then they come pretty
quickly all the way to 2024.
Placed order for up to 50 Bombardier aircrafts which should start to come in
April of 2018.
2 Issues related to GST: 1. Double taxation: Custom duty being charged on the
aircraft along while being imported, and charging tax on leasing of the aircraft.
2. Oppose the import duty on aircraft which was not imposed so far
3. Expect strong recovery in demand q2 onwards: Kajaria
Ceramics / Century Plyboard; Ashok Kajaria, CMD & Sanjay
Agarwal, MD & CEO of Century Plyboard
n
n
n
n
Q1 numbers will take a hit especially in the month of June.
Projecting a double-digit growth in FY18.
Expects strong recovery in demand from Q2 onwards. Will gain market share
from unorganised players,
Century Plyboard:
Shift from unorganised market will accelerate after
introduction of e-way bill as 80% of the plywood industry is unorganised. Actual
effect of GST will be visible after a year
4. Expect crude prices to be in range of USD 50-55/BBL: ONGC;
AK Srinivasan, Director-Finance
n
n
n
Expect the crude prices to come around USD 50 per barrel to USD 55 per barrel
range
Crude prices have dropped in the last couple of days. Net realisations for ONGC
may be around USD 50 per barrel in Q1 because of this drop.
No decision has been taken with regards to buying stake in Hindustan Petroleum
Corporation Ltd (HPCL) as of now
28 June 2017
12

From the think tank
1. Is WPI useful in India anymore?
n
Prior to the introduction of the all-India Consumer Price Index, popularly known
as CPI combined (rural plus urban), the Wholesale Price Index (WPI) was the
most useful price index in India. It measured the weekly rhythm of price
movement in the country. Since 2009, WPI has been computed on a monthly
basis, similar to other price indices. The Reserve Bank of India (RBI) primarily
used WPI inflation for the formulation of monetary policy under monetary
targeting framework as well as under multiple indicator approach (MIA)—
although inflation measured by other indices was also monitored/ analysed.
Moreover, the Central Statistics Office (CSO) has been predominantly using WPI
to deflate GDP at current prices to arrive at GDP at constant prices. Where only
volume data are available, the CSO uses WPI to convert volume to value to
arrive at GDP at current prices.
2. NPA resolution: Well begun but half done
n
The Reserve Bank of India (RBI) has set the ball rolling for resolution of non-
performing assets (NPAs) with the shortlisting of 12 big defaulters. These will
now be processed further by the banks before being admitted by the National
Company Law Tribunal (NCLT) for further processing of insolvency resolution as
per the Insolvency and Bankruptcy Code, 2016. This is a step in the right
direction. The 12 borrowers comprise a significant part of the NPAs in the
banking system, and therefore need to be handled with the importance that
these deserve. The pace and extent of resolution of these assets would also act
as an important signal for the remaining NPAs as well as for future
delinquencies.
3. Setting up the defence industrial ecosystem
n
Last week was an interesting one for Indian defence manufacturing. On
Monday, Tata Advanced Systems Ltd and US plane-maker Lockheed Martin
Corp. signed an agreement at the Paris Air Show to produce F-16 fighter jets in
India. On Tuesday, in Delhi, Reliance Defence entered into a strategic
partnership with Serbia’s Yugoimport for ammunition manufacturing in India.
On Wednesday, back in Paris, Reliance Defence joined hands with France’s
Thales to set up a joint venture that will develop Indian capabilities in radars and
high-tech airborne electronics. In Moscow, on Friday, defence minister Arun
Jaitley and his Russian counterpart signed off on a road map for strengthening
bilateral military ties. Meanwhile, at home in India, the army rejected, for the
second year in a row, an indigenously-built assault rifle after it failed field
tests—a pointed reminder of how the country’s sub-par defence industry
continues to damage the military’s operational preparedness.
28 June 2017
13

4. Repo rate: data show no guarantee that by merely lowering
rates, credit growth will pick up
n
An issue which generates controversy every now and then is whether or not
interest rates should be lowered. It is almost axiomatic that just before a credit
policy is announced, there is a clarion call for lowering of interest rates. Is this
really justified? The decibel levels for lowering have increased ever since the
decision to target CPI inflation number at 4% (with a 2% band). With inflation
below 6%, it is logical to argue heuristically for the same. Inflation-targeting
makes sense, but ideally the path for action should be defined, like if inflation
moves from 5 to 4.5%, the repo rate will be lowered—so on and so forth. While
this would make policy more objective, it would be predictable and remove
discretionary power of the MPC. To this extent, the MPC can deliberate on the
appropriateness of a rate-cut.
5. Inflation targeting in democratic India
n
Much ink has been spilt on a recent remark by Reserve Bank of India (RBI)
governer Urjit Patel. At the post-monetary policy press conference this month,
he said the government of India had asked for a meeting with members of the
monetary policy committee (MPC) and that they refused to travel to Delhi to
meet with government officials. In a country where the so-called elite are
always on the lookout for reasons to beat up the government with—and this
government in particular—the RBI governor has given them a perfect story.
David has slain Goliath. Now, if only reality were so simple. Central banking
independence is something of recent origin. Like all economic constructs and
arrangements, its origins are political. Partially, it is a triumph of the interests of
financial markets over the real economy, particularly over the working class.
International
6. North Korea and the dangers of America first
n
Moon Jae-in is not Donald Trump’s kind of guy. The new president of South
Korea is a former human-rights lawyer, not a businessman. Mr Trump likes to
threaten North Korea with isolation and aircraft-carriers; Mr Moon is an
advocate of dialogue and co-operation. The South Korean president is reserved,
while the US president is bombastic. These differences in style and policy will
make for an awkward first summit, when the two leaders meet in Washington
later this week. But it is crucial that the South Korean and US presidents forge an
understanding. The great danger for Mr Moon is that if he cannot persuade Mr
Trump to see things his way, the US president’s policy of “America First” could
persuade him to launch a pre-emptive strike on North Korea’s nuclear
programme — eliminating a risk to US security, at the cost of massive retaliation
aimed at South Korea.
28 June 2017
14

Click excel icon
for detailed
valuation guide
Rs
Valuation snapshot
P/E (x)
P/B (x)
FY17 FY18E FY17 FY18E
24.3
16.6
18.5
29.0
35.8
17.0
29.9
29.0
18.1
22.5
18.7
19.7
23.3
24.0
14.3
31.9
21.3
21.0
22.1
31.2
19.5
24.8
17.7
16.9
25.1
20.4
30.2
28.8
9.6
15.6
22.6
8.1
9.7
9.8
8.6
8.3
8.2
13.4
14.2
5.8
11.9
28.7
21.8
19.1
11.0
41.4
32.6
13.1
16.8
8.4
5.5
4.3
4.7
6.2
8.1
3.0
15.1
7.3
3.3
3.6
7.3
3.2
2.7
6.0
2.6
10.5
4.8
2.2
2.9
2.3
2.2
5.0
2.1
1.3
4.5
0.8
4.7
4.5
1.1
3.6
3.2
1.0
0.6
0.7
0.5
0.9
0.4
0.8
1.3
0.5
0.9
7.7
4.0
3.9
1.7
13.9
6.5
3.8
3.5
2.6
4.6
3.8
4.2
5.4
7.1
2.6
10.7
6.0
2.8
3.3
6.2
2.9
2.4
5.2
2.2
8.4
4.1
2.0
2.6
2.1
2.0
4.3
2.0
1.2
3.9
0.8
4.1
4.0
1.0
3.0
2.9
1.0
0.6
0.7
0.5
0.8
0.4
0.7
1.2
0.5
0.9
6.3
3.4
3.3
1.5
11.6
5.9
3.4
3.0
2.3
ROE (%)
FY17 FY18E FY19E
20.3
23.3
25.3
16.2
15.8
16.9
40.3
20.8
12.3
14.0
35.7
14.2
6.4
20.3
9.8
25.6
17.1
6.9
10.9
8.9
9.9
17.9
10.2
7.2
16.0
-27.0
13.8
12.3
9.4
18.9
11.4
4.1
-6.7
4.2
1.4
10.1
-8.4
3.6
-0.2
2.7
0.9
21.7
15.1
18.1
14.4
30.4
19.3
25.5
19.4
23.9
20.8
24.4
24.1
19.9
21.2
16.3
41.9
22.6
16.8
14.5
35.9
14.2
10.8
21.2
16.5
29.2
19.3
9.9
12.4
7.1
10.9
18.2
9.9
7.4
16.5
4.0
14.5
14.6
10.6
17.9
13.0
12.3
6.1
6.8
5.8
10.6
4.6
5.6
8.9
8.1
7.4
24.0
16.7
19.0
14.5
30.6
18.3
27.0
19.3
29.0
21.2
26.9
25.6
22.5
22.2
17.9
38.5
23.1
17.9
15.8
31.3
14.4
11.5
22.3
27.8
35.9
22.8
15.7
14.0
10.1
12.5
19.0
10.6
9.0
17.3
7.0
15.7
17.3
12.2
19.4
14.7
14.5
9.0
9.4
7.3
11.1
5.4
7.5
10.7
10.5
9.3
26.2
19.5
19.9
15.2
30.9
17.4
29.6
19.0
32.2
Company
Automobiles
Amara Raja
Ashok Ley.
Bajaj Auto
Bharat Forge
Bosch
CEAT
Eicher Mot.
Endurance Tech.
Escorts
Exide Ind
Hero Moto
M&M
Mahindra CIE
Maruti Suzuki
Tata Motors
TVS Motor
Aggregate
Banks - Private
Axis Bank
DCB Bank
Equitas Hold.
Federal Bank
HDFC Bank
ICICI Bank
IDFC Bank
IndusInd
J&K Bank
Kotak Mah. Bk
RBL Bank
South Indian
Yes Bank
Aggregate
Banks - PSU
BOB
BOI
Canara
IDBI Bk
Indian Bk
OBC
PNB
SBI
Union Bk
Aggregate
NBFCs
Bajaj Fin.
Bharat Fin.
Cholaman.Inv.&F
n
Dewan Hsg.
GRUH Fin.
HDFC
Indiabulls Hsg
LIC Hsg Fin
Manappuram
Reco
Buy
Buy
Buy
Buy
Neutral
Buy
Buy
Buy
Neutral
Buy
Neutral
Buy
Not Rated
Buy
Buy
Buy
CMP
(INR)
TP % Upside
EPS (INR)
(INR) Downside FY17 FY18E FY19E
25
29
23
14
0
-2
14
6
9
29
-2
17
12
44
9
28.0
4.6
132.3
26.2
473.1
93.3
613.8
23.5
23.2
8.2
169.1
54.3
5.4
248.6
19.8
11.7
837
1,044
91
117
2,779 3,422
1,090 1,242
23,269 23,287
1,783 1,741
26,669 30,402
892
948
650
711
213
274
3,696 3,622
1,370 1,603
230
-
7,191 8,060
442
635
533
581
34.5
41.8
29.9
5.5
7.1
19.8
150.4 178.2 21.0
37.7
49.7
41.7
650.7 776.2 49.2
104.9 133.9 19.1
892.0 1,135.1 43.4
30.8
37.9
38.0
35.9
44.4
28.0
9.5
11.8
26.1
198.1 201.2 21.9
69.6
81.7
25.2
9.9
11.8
42.9
300.0 370.9 28.9
30.8
65.8
22.3
16.7
26.7
45.4
27.8
23.4
8.8
4.8
5.8
67.1
16.3
3.3
59.4
4.4
32.3
17.6
2.9
90.5
41.2
11.2
7.5
7.3
79.4
18.7
4.3
72.0
8.0
40.5
23.8
3.6
114.0
32.1
27.7
32.0
23.3
29.4
18.8
18.6
29.7
NM
36.3
42.7
12.7
19.4
28.3
25.9
NM
17.3
36.1
9.4
NM
22.0
923.5
18.6
99.8
40.2
33.7
23.5
14.4
52.3
35.2
15.7
19.6
11.4
Neutral
493
Neutral
194
Buy
151
Buy
113
Buy
1,668
Buy
288
Neutral
56
Buy
1,490
Neutral
90
Buy
974
Under Review 507
Buy
28
Buy
1,415
525
170
210
125
1,790
329
62
1,700
89
1,050
-
31
2,110
7
-12
39
11
7
14
11
14
-1
8
13
49
15.4
7.0
4.7
4.8
56.8
15.3
3.0
50.1
-31.3
26.8
11.9
2.2
73.0
Buy
Neutral
Neutral
Neutral
Buy
Neutral
Buy
Buy
Neutral
155
134
324
55
276
139
137
279
143
217
147
380
49
360
150
184
375
174
40
10
17
-11
30
8
34
34
22
6.0
-14.8
18.8
1.5
29.3
-31.6
6.2
0.3
7.6
19.0
13.7
33.0
6.4
33.3
17.1
10.3
19.7
24.6
24.9
22.0
48.9
8.6
38.1
21.4
14.5
25.9
34.5
Buy
Neutral
Buy
Buy
Neutral
Buy
Buy
Neutral
Not Rated
1,351
707
1,080
427
425
1,651
1,080
748
93
1,550
769
1,250
559
421
1,797
1,227
723
-
15
9
16
31
-1
9
14
-3
33.6
21.0
46.0
29.6
8.1
46.8
69.0
38.2
8.2
47.0
32.4
56.7
38.6
10.3
50.7
82.2
44.6
11.1
63.6
45.3
70.6
45.5
12.5
55.9
101.6
51.2
14.0
28 June 2017
15

Click excel icon
for detailed
valuation guide
CMP
(INR)
332
436
122
826
169
2,427
989
TP % Upside
(INR) Downside
400
21
465
7
117
-4
900
9
134
-21
2,689
1,269
11
28
EPS (INR)
FY18E
12.9
34.5
27.2
36.0
35.0
130.4
77.4
Valuation snapshot
FY19E
16.4
40.0
30.2
43.3
40.4
164.7
98.6
P/E (x)
P/B (x)
FY17 FY18E FY17 FY18E
46.8 25.6
2.9
2.7
14.7 12.6
2.7
2.4
4.7
4.5
0.8
0.7
28.4 23.0
4.5
3.8
5.4
4.8
1.0
0.9
28.8
17.8
18.8
73.2
23.1
62.3
47.2
47.1
19.5
34.3
59.5
49.3
10.8
20.4
26.9
22.3
73.3
39.2
28.5
30.1
23.8
28.9
33.8
49.1
46.8
29.5
61.3
17.9
33.6
28.0
70.6
24.9
NM
339.4
43.4
40.4
35.9
53.9
49.4
51.5
40.0
40.3
51.1
34.6
55.6
37.1
18.6
12.8
16.1
57.6
22.4
37.6
33.9
40.2
34.9
31.5
38.1
40.3
NM
17.8
24.4
17.3
53.8
36.8
20.5
28.4
19.8
28.7
30.4
36.2
32.1
21.2
35.6
14.0
20.3
20.4
43.1
21.9
31.4
31.8
34.7
32.0
26.9
49.0
44.3
42.6
37.5
36.5
44.3
31.9
47.9
32.5
3.2
2.0
3.2
9.3
4.8
1.0
7.7
25.6
1.2
6.7
8.5
9.0
1.4
3.9
3.2
1.9
6.8
7.2
-1.7
4.1
3.8
4.5
3.8
2.5
3.5
2.0
4.3
2.0
1.1
3.8
4.1
4.4
2.9
5.9
8.2
4.6
3.5
14.3
16.2
23.3
10.5
13.8
12.4
7.3
35.5
8.4
2.8
1.8
2.9
8.0
3.7
1.0
7.2
18.5
1.2
6.2
7.4
8.0
1.4
3.3
3.0
1.7
5.9
6.2
-1.8
3.7
3.3
4.0
3.5
2.4
3.5
1.9
3.8
1.7
1.1
3.2
3.8
3.8
2.7
5.1
6.8
4.1
3.2
13.7
15.0
22.0
9.0
11.1
9.6
7.1
34.4
8.3
FY17
6.4
19.7
17.9
17.4
19.9
11.8
11.7
17.2
12.7
20.6
1.6
18.0
76.4
6.2
21.2
12.4
18.2
14.9
21.2
12.2
8.6
9.3
19.8
NM
14.3
16.3
18.0
11.3
5.0
7.5
7.5
7.2
11.5
3.4
14.4
6.0
19.2
-3.2
1.8
20.2
12.0
9.7
28.5
36.9
50.4
28.4
35.8
24.6
22.2
65.6
23.5
ROE (%)
FY18E
10.9
20.2
17.0
18.2
19.1
16.2
14.5
17.7
13.9
16.5
2.7
21.9
53.4
3.4
20.5
20.7
19.8
-3.3
20.3
12.5
10.0
11.0
18.1
-8.8
13.7
17.7
14.7
11.5
6.7
11.0
9.2
11.3
13.1
5.5
17.0
9.2
18.6
9.0
17.2
21.5
13.6
11.8
28.6
35.2
53.2
26.0
33.8
24.5
22.6
72.8
25.6
FY19E
12.9
20.6
16.8
18.5
19.1
17.8
16.3
17.9
15.8
16.8
3.4
30.1
49.8
4.2
23.2
21.5
21.1
15.1
21.2
13.3
11.8
13.7
19.5
-11.0
12.9
17.5
14.9
12.8
7.1
14.2
12.2
13.1
15.1
7.2
18.6
14.7
19.1
12.3
22.6
22.6
15.7
13.7
30.6
37.2
60.3
26.3
32.2
23.0
23.0
82.5
28.9
Company
Reco
M&M Fin.
Buy
Muthoot Fin
Buy
PFC
Neutral
Repco Home
Buy
REC
Neutral
Shriram
City
Buy
Union
STF
Buy
Aggregate
Capital Goods
ABB
Sell
Bharat Elec.
Buy
BHEL
Sell
Blue Star
Neutral
CG Cons. Elec.
Buy
CG Power & Indu. Sell
Cummins
Neutral
GE T&D
Neutral
Havells
Neutral
Inox Wind
Under Review
K E C Intl
Neutral
L&T
Buy
Pennar Eng.
Not Rated
Siemens
Neutral
Solar Ind
Neutral
Suzlon Energy
Not Rated
Thermax
Sell
Va Tech Wab.
Buy
Voltas
Sell
Aggregate
Cement
Ambuja Cem.
Buy
ACC
Neutral
Birla Corp.
Buy
Dalmia Bharat
Buy
Grasim Inds.
Neutral
India Cem
Neutral
J K Cements
Buy
JK Lakshmi Ce
Buy
Ramco Cem
Buy
Orient Cem
Buy
Prism Cem
Buy
Shree Cem
Buy
Ultratech
Buy
Aggregate
Consumer
Asian Paints
Neutral
Britannia
Buy
Colgate
Buy
Dabur
Neutral
Emami
Buy
Godrej Cons.
Neutral
GSK Cons.
Sell
HUL
Buy
ITC
Buy
FY17
7.1
29.7
25.7
29.1
31.4
84.3
55.6
1,443
160
134
608
220
80
908
341
471
138
241
1,702
130
1,306
808
18
927
690
447
1,200
200
100
610
240
65
950
320
480
-
250
2,000
-
1,355
825
-
850
800
400
-17
25
-25
0
9
-19
5
-6
2
4
18
4
2
-8
16
-10
19.7
6.9
2.1
12.9
4.7
4.1
26.5
5.7
9.6
12.8
11.9
63.3
5.8
17.8
20.6
0.6
30.8
28.9
15.5
25.1
7.2
3.6
17.9
5.5
2.3
28.8
8.9
11.7
-3.2
13.6
69.6
7.5
24.3
22.0
0.9
32.7
34.9
15.6
32.2
8.1
4.7
26.6
6.6
4.5
35.5
10.6
14.2
15.5
16.8
80.1
10.0
33.3
27.5
1.0
34.0
39.8
17.6
240
283
1,578 1,521
867
998
2,377 3,162
1,217 1,234
189
210
945
1,322
492
550
680
823
142
185
118
138
16,684 23,316
3,880 4,928
18
-4
15
33
1
11
40
12
21
31
17
40
27
4.9
33.7
29.4
38.8
67.9
5.6
33.7
7.0
27.3
-1.6
0.3
384.4
96.1
6.6
49.2
40.9
66.7
86.9
9.3
46.4
11.4
31.1
4.5
3.7
480.7
121.4
7.2
63.6
58.9
87.1
114.5
12.9
59.5
20.5
37.5
6.8
5.8
621.0
159.1
1,134
3,638
1,093
290
1,069
965
5,407
1,092
312
1,210
4,050
1,180
295
1,250
975
4,380
1,215
355
7
11
8
2
17
1
-19
11
14
21.0
73.7
21.2
7.2
26.5
18.9
156.1
19.6
8.4
23.1
82.1
25.7
7.7
29.2
21.8
169.7
22.8
9.6
27.4
101.3
31.1
9.1
34.7
25.0
185.5
27.0
11.5
28 June 2017
16

Click excel icon
for detailed
valuation guide
CMP
TP % Upside
(INR)
(INR) Downside
357
390
9
308
335
9
6,604 5,715
-13
16,286 18,000
11
208
245
18
807
762
-6
7,999 8,760
10
128
-
783
830
6
2,275 2,415
6
EPS (INR)
FY18E
8.9
6.9
118.6
313.9
7.4
18.4
155.8
3.5
9.7
37.4
Valuation snapshot
FY19E
11.0
8.4
139.5
400.0
12.3
21.2
181.6
6.4
14.7
51.8
P/E (x)
P/B (x)
FY17 FY18E FY17 FY18E
31.7 39.8
5.9
6.1
49.0 44.3 17.1 14.6
56.0 55.7 21.1 19.4
68.2 51.9 27.3 21.6
57.8 28.0
2.7
2.4
48.2 43.7 12.5 10.2
55.2 51.3 45.6 36.4
36.2 36.8
1.8
1.8
90.0 80.7
9.0
8.2
85.1 60.9 17.1 11.7
46.5 41.1 12.8 11.9
23.0
24.0
26.0
17.0
31.7
37.0
33.6
16.2
36.6
16.0
16.0
17.8
71.7
29.7
18.0
32.0
20.8
35.1
21.4
23.9
17.5
41.4
29.9
37.9
15.1
17.2
28.8
75.7
18.6
NM
10.3
11.2
16.7
70.7
NM
31.9
21.3
40.3
11.6
19.1
22.7
22.9
15.2
29.3
29.0
26.8
17.9
24.8
78.2
14.0
15.8
47.5
21.3
17.7
31.6
21.4
28.3
19.8
22.1
14.1
32.7
27.5
22.2
7.9
13.8
23.8
36.4
15.7
NM
10.0
10.5
14.8
40.2
NM
26.8
30.0
28.7
8.3
4.9
5.1
8.6
4.3
4.3
8.4
3.4
3.6
3.6
1.7
4.0
3.0
15.5
2.5
3.6
5.5
3.6
7.1
5.0
4.2
2.6
18.4
3.1
2.2
2.1
2.7
3.5
16.2
4.4
1.4
1.8
0.8
2.4
7.0
3.9
8.0
7.8
5.8
1.4
4.1
4.4
6.5
3.4
3.9
6.9
3.1
3.3
3.0
1.5
3.1
2.1
18.8
2.2
3.1
5.1
3.4
5.8
4.3
3.7
2.3
14.0
3.0
2.1
1.8
2.3
3.3
11.2
3.9
1.6
1.5
0.7
2.4
6.0
4.3
7.3
6.6
5.2
1.2
FY17
21.1
36.7
39.0
40.0
5.9
28.2
45.3
5.2
10.4
21.3
27.6
23.1
23.4
37.7
28.3
13.6
24.8
10.2
23.5
9.6
11.3
24.7
20.0
21.5
8.6
22.0
17.1
18.5
22.2
25.3
17.5
12.6
50.5
10.8
5.9
12.4
16.7
12.2
24.1
25.5
-12.0
19.3
7.1
17.6
10.4
-23.5
25.0
23.7
14.3
14.0
ROE (%)
FY18E
15.1
35.5
36.4
41.6
9.1
25.6
78.9
4.9
10.7
19.3
29.0
23.6
20.8
32.3
24.8
13.3
26.1
11.5
19.2
13.3
2.0
22.4
16.4
39.7
11.0
18.9
16.3
16.3
22.5
23.5
16.6
17.2
48.6
11.1
9.9
19.4
17.8
13.7
36.5
26.2
-5.3
16.6
6.9
16.3
16.1
-7.8
27.3
23.8
18.1
15.6
FY19E
18.4
38.1
39.0
42.8
13.4
24.0
74.0
8.5
14.6
19.7
30.6
24.1
21.0
30.0
22.5
16.1
27.1
12.8
19.2
15.1
5.3
21.3
17.6
54.4
13.2
19.7
19.3
17.9
20.7
24.6
17.6
17.8
46.8
11.7
11.7
25.4
18.6
15.0
44.1
27.6
0.7
15.6
6.6
17.3
20.5
1.5
31.9
23.8
20.6
15.1
Company
Jyothy Lab
Marico
Nestle
Page Inds
Parag Milk
Pidilite Ind.
P&G Hygiene
Prabhat Dairy
United Brew
United Spirits
Aggregate
Healthcare
Alembic Phar
Alkem Lab
Ajanta Pharma
Aurobindo
Biocon
Cadila
Cipla
Divis Lab
Dr Reddy’s
Fortis Health
Glenmark
Granules
GSK Pharma
IPCA Labs
Lupin
Sanofi India
Sun Pharma
Syngene Intl
Torrent Pharma
Aggregate
Logistics
Allcargo Logistics
Blue Dart
Concor
Gateway
Distriparks
Gati
Transport Corp.
Aggregate
Media
Dish TV
D B Corp
Den Net.
Hind. Media
HT Media
Jagran Prak.
PVR
Siti Net.
Sun TV
Zee Ent.
Aggregate
Metals
Hindalco
Reco
Neutral
Neutral
Sell
Buy
Neutral
Neutral
Buy
Not Rated
Neutral
Neutral
FY17
11.2
6.3
118.0
238.7
3.6
16.7
144.9
3.5
8.7
26.7
Neutral
Neutral
Buy
Buy
Sell
Buy
Neutral
Neutral
Neutral
Buy
Neutral
Buy
Neutral
Neutral
Buy
Buy
Buy
Not Rated
Buy
496
1,820
1,517
670
323
526
534
642
2,654
165
630
129
2,466
477
1,063
4,138
544
456
1,183
640
1,900
2,028
750
300
510
500
600
2,625
240
800
200
2,700
480
1,475
4,850
650
-
1,450
29
4
34
12
-7
-3
-6
-7
-1
45
27
55
10
1
39
17
20
23
21.6
75.7
58.4
39.3
10.2
14.2
15.9
39.7
72.6
10.3
39.3
7.3
34.4
16.1
59.2
129.1
26.1
13.0
55.2
26.0
80.0
66.4
44.1
11.0
18.1
20.0
35.8
107.1
2.1
45.0
8.1
51.9
22.4
60.2
131.0
25.4
16.1
59.8
32.1
94.9
79.9
50.2
15.0
23.2
25.0
39.8
144.5
6.1
53.5
11.4
60.1
29.9
73.7
173.4
30.8
18.0
73.2
Buy
Not Rated
Neutral
Buy
Not Rated
Not Rated
172
4,249
1,134
258
126
291
228
-
1,162
310
-
-
33
2
20
9.8
102.5
38.0
6.8
8.4
16.9
12.2
129.9
41.2
11.6
15.9
21.0
14.3
163.2
45.8
14.3
23.9
25.9
Buy
Buy
Neutral
Buy
Neutral
Buy
Buy
Neutral
Neutral
Buy
75
379
78
271
83
180
1,451
29
793
492
106
460
90
360
85
225
1,666
36
860
600
42
21
15
33
3
25
15
26
8
22
1.0
20.4
-8.6
26.4
7.4
10.8
20.5
-1.8
24.9
23.1
2.1
24.1
-2.7
27.1
7.9
12.2
36.1
-0.5
29.5
16.4
3.8
28.7
0.3
29.9
8.3
14.0
54.7
0.1
38.4
19.5
Buy
188
250
33
16.2
22.6
25.9
28 June 2017
17

Click excel icon
for detailed
valuation guide
CMP
Reco
(INR)
Sell
255
Buy
117
Buy
194
Neutral
62
Under Review 104
Sell
56
Neutral
237
Neutral
510
TP % Upside
(INR) Downside
235
-8
184
57
280
44
65
4
-
30
-47
225
-5
581
14
EPS (INR)
FY18E
21.5
-16.0
19.8
3.6
12.0
-12.6
24.5
50.2
Valuation snapshot
FY19E
23.7
-2.5
22.6
4.0
12.7
0.4
27.4
66.5
P/E (x)
P/B (x)
FY17 FY18E FY17 FY18E
13.0 11.8
3.5
3.0
NM
NM
0.4
0.4
13.1
9.8
2.1
1.8
17.0 17.5
1.2
1.1
10.4
8.6
1.5
1.4
NM
NM
0.6
0.7
15.7
9.7
1.5
1.4
13.8 10.2
1.5
1.4
17.0 13.3
1.4
1.3
8.4
15.9
36.6
18.5
8.2
9.5
24.4
10.2
13.9
9.7
19.1
13.5
11.6
92.9
57.2
59.4
16.6
14.1
17.9
14.7
10.2
14.1
21.2
15.3
13.0
17.1
28.2
17.6
12.3
15.1
15.6
16.0
33.5
25.1
NM
27.8
35.3
16.4
16.7
16.3
12.1
9.5
13.1
19.5
14.6
11.0
9.3
22.5
9.4
7.8
7.8
16.5
11.8
10.6
76.4
50.3
51.9
13.3
13.6
16.0
14.3
9.1
13.1
17.3
14.2
13.1
14.6
23.4
16.8
11.8
14.8
13.1
15.7
59.2
21.4
NM
39.9
165.1
13.9
11.8
29.8
11.8
2.6
1.6
6.3
2.1
2.5
1.9
5.0
2.1
0.7
0.9
4.0
1.5
1.5
7.6
10.8
10.2
2.7
3.5
4.4
3.1
1.5
4.9
3.4
2.0
2.0
2.6
8.8
5.5
2.0
2.4
2.4
3.7
2.2
4.5
1.2
12.9
2.4
6.2
2.0
1.0
1.3
2.2
1.5
5.0
1.9
2.2
1.9
4.3
1.8
0.7
0.9
3.4
1.3
1.4
7.1
9.6
9.1
2.4
3.5
3.8
2.8
1.3
3.8
3.1
2.3
1.9
2.5
7.1
5.7
1.8
2.2
2.1
3.5
2.1
3.9
1.5
9.8
2.4
6.2
1.7
1.0
1.2
FY17
24.4
-7.9
17.3
7.2
12.4
-6.7
9.7
15.4
8.0
32.4
10.2
17.8
11.9
32.4
22.3
21.0
24.8
5.7
10.4
23.2
11.9
13.2
8.2
20.6
17.2
16.2
27.5
26.5
23.3
14.3
40.4
16.8
13.2
16.1
17.0
37.1
33.5
18.4
16.9
16.3
23.2
6.7
16.2
-1.6
126.2
6.9
37.8
11.4
6.7
11.5
ROE (%)
FY18E
27.2
-5.0
19.4
6.7
14.9
-15.2
14.8
14.5
9.7
25.1
11.7
28.5
13.7
21.2
20.2
20.6
20.5
9.3
11.7
22.4
11.8
13.4
9.3
20.2
17.6
17.8
25.4
25.3
21.4
15.6
32.8
18.9
14.0
14.8
18.1
33.7
32.4
16.7
15.5
17.2
22.6
3.7
19.4
-20.8
27.9
1.5
44.5
15.5
3.3
10.9
FY19E
25.4
-0.8
18.8
7.3
15.7
0.5
15.3
17.1
12.3
23.3
12.5
27.5
14.6
18.7
19.9
19.5
18.4
9.6
13.0
25.7
11.2
13.4
12.6
20.9
18.5
17.9
26.0
23.5
21.2
15.2
28.3
20.5
15.7
14.7
20.3
32.3
32.3
17.0
15.7
17.4
22.0
6.4
19.1
-27.4
39.1
3.9
47.0
15.0
2.8
12.3
Company
Hind. Zinc
JSPL
JSW Steel
Nalco
NMDC
SAIL
Vedanta
Tata Steel
Aggregate
Oil & Gas
BPCL
GAIL
Gujarat Gas
Gujarat St. Pet.
HPCL
IOC
IGL
MRPL
Oil India
ONGC
PLNG
Reliance Ind.
Aggregate
Retail
Jubilant Food
Titan Co.
Aggregate
Technology
Cyient
HCL Tech.
Hexaware
Infosys
KPIT Tech
L&T Infotech
Mindtree
Mphasis
NIIT Tech
Persistent Sys
Tata Elxsi
TCS
Tech Mah
Wipro
Zensar Tech
Aggregate
Telecom
Bharti Airtel
Bharti Infratel
Idea Cellular
Tata Comm
Aggregate
Utiltites
Coal India
CESC
JSW Energy
NTPC
FY17
19.7
-20.9
14.8
3.7
10.0
-6.2
15.1
37.0
Neutral
Sell
Sell
Neutral
Buy
Neutral
Neutral
Neutral
Buy
Buy
Buy
Neutral
612
360
749
163
503
390
1,053
120
269
160
435
1,436
779
357
699
171
632
457
1,067
124
363
229
546
1,264
27
-1
-7
5
26
17
1
4
35
43
26
-12
72.5
22.6
20.4
8.8
61.0
41.0
43.1
11.7
19.3
16.4
22.7
106.6
64.5
27.4
38.5
11.2
45.6
41.9
46.7
12.8
34.7
20.6
26.3
121.7
70.3
31.6
46.6
13.4
45.8
43.3
51.8
13.3
37.4
23.9
35.9
127.8
Sell
Neutral
930
516
680
505
-27
-2
10.0
9.0
12.2
10.3
17.9
12.1
Buy
Buy
Neutral
Buy
Neutral
Buy
Neutral
Neutral
Neutral
Buy
Buy
Neutral
Buy
Neutral
Buy
508
842
246
926
122
782
527
594
558
643
1,589
2,346
380
256
859
620
960
235
1,200
150
850
475
600
470
700
1,607
2,400
500
250
1,020
22
14
-4
30
23
9
-10
1
-16
9
1
2
32
-2
19
30.6
59.8
13.7
62.9
11.9
55.5
24.9
38.9
42.8
37.7
56.3
133.4
30.9
16.9
54.9
38.3
61.9
15.4
64.7
13.4
59.7
30.5
41.7
42.5
43.9
68.0
139.7
32.3
17.3
65.5
44.2
67.6
16.7
71.1
15.2
65.0
36.5
45.0
46.1
51.4
80.4
149.6
36.9
19.1
76.0
Buy
Buy
Buy
Buy
372
374
81
723
430
440
110
811
16
18
36
12
11.1
14.9
-1.1
26.0
6.3
17.5
-12.9
18.1
11.5
19.9
-13.6
36.0
Buy
Buy
Buy
Buy
245
865
63
158
290
1,040
88
198
18
20
40
26
14.9
51.9
3.9
13.0
17.6
73.4
2.1
13.4
18.6
80.6
1.8
16.2
28 June 2017
18

Click excel icon
for detailed
valuation guide
CMP
(INR)
205
81
TP % Upside
EPS (INR)
(INR) Downside FY17 FY18E FY19E
242
18
14.2
17.6
20.5
67
-17
5.2
6.7
7.0
Valuation snapshot
P/E (x)
P/B (x)
FY17 FY18E FY17 FY18E
14.4 11.6
2.2
1.9
15.7 12.0
1.9
1.7
14.3 12.7
2.2
2.0
29.1
104.8
39.4
29.7
33.4
26.0
35.7
34.9
26.5
26.5
12.7
62.7
80.1
18.5
21.6
34.1
14.6
60.3
42.9
36.7
22.0
24.2
38.7
17.9
36.9
49.7
63.0
49.3
52.4
25.5
62.7
34.0
27.8
29.5
22.6
28.5
20.9
23.6
18.6
11.4
48.5
33.2
13.5
20.4
22.0
12.2
36.4
34.8
30.0
18.1
24.1
26.9
17.3
27.9
38.2
48.9
39.3
30.7
2.6
13.1
5.2
33.6
9.0
4.5
3.8
4.8
8.6
21.8
3.9
6.0
4.6
1.6
2.9
4.4
3.9
3.8
4.0
11.1
5.5
6.8
3.7
2.8
4.8
27.0
10.0
11.7
4.8
2.4
11.4
4.7
30.1
7.4
4.1
2.6
3.9
6.9
19.3
2.8
5.5
4.1
1.5
2.6
4.8
3.2
3.5
3.8
10.4
4.6
5.6
3.4
2.5
4.3
23.0
9.0
9.6
4.3
FY17
16.2
11.2
15.3
10.3
17.9
13.9
115.2
31.1
18.2
11.1
15.1
37.7
86.2
34.8
10.2
5.9
8.6
14.8
13.6
29.8
7.3
9.9
30.4
26.8
32.8
9.8
16.6
13.7
56.8
16.5
27.4
9.5
ROE (%)
FY18E
17.5
14.6
16.1
9.8
19.4
14.5
114.1
27.7
18.9
11.3
20.7
32.3
110.2
28.8
11.9
12.5
11.7
13.4
20.5
28.6
8.8
11.1
35.9
27.8
25.4
13.0
15.1
16.1
65.0
19.4
26.9
14.8
FY19E
17.8
13.6
16.8
13.5
23.3
15.9
106.8
29.6
21.7
11.5
24.3
31.6
129.8
25.9
12.3
16.2
14.8
13.7
25.4
27.6
13.1
14.6
39.6
28.2
23.8
16.4
17.0
18.2
66.3
22.2
28.8
17.5
Company
Power Grid
Tata Power
Aggregate
Others
Arvind
Avenue
Supermarts
Bata India
Castrol India
Century Ply.
Coromandel Intl
Delta Corp
Dynamatic Tech
Eveready Inds.
Interglobe
Indo Count
Info Edge
Inox Leisure
Jain Irrigation
Just Dial
Kaveri Seed
Kitex Garm.
Manpasand
MCX
Monsanto
Navneet
Education
PI Inds.
Piramal Enterp.
SRF
S H Kelkar
Symphony
TTK Prestige
V-Guard
Wonderla
Reco
Buy
Sell
Neutral
Neutral
Under Review
Buy
Neutral
Under Review
Buy
Buy
Buy
Neutral
Buy
Buy
Sell
Under Review
Neutral
Buy
Buy
Buy
Buy
Buy
Buy
Buy
Buy
Buy
Buy
Sell
Neutral
Neutral
Buy
360
804
530
405
290
415
150
2,363
341
1,218
166
983
267
103
376
649
270
765
1,064
2,678
171
807
2,805
1,537
268
1,341
6,737
176
367
362
804
-
531
323
-
229
3,334
368
1,234
229
1,050
240
-
465
653
394
900
1,300
2,841
226
952
3,044
1,816
367
1,288
5,281
167
393
1
0
31
11
52
41
8
1
38
7
-10
24
1
46
18
22
6
32
18
9
18
37
-4
-22
-5
7
12.4
7.7
13.5
13.6
8.7
16.0
4.2
67.6
12.9
46.0
13.0
15.7
3.3
5.5
17.5
19.1
18.6
12.7
24.8
72.9
7.8
33.4
72.6
85.9
7.2
27.0
106.9
3.6
7.0
14.1
12.8
15.6
14.6
9.8
18.3
5.3
112.9
14.4
65.6
14.6
20.3
8.0
7.6
18.5
29.5
22.1
21.0
30.5
89.3
9.4
33.4
104.1
89.0
9.6
35.1
137.7
4.5
11.9
21.2
17.9
19.3
15.2
12.9
23.6
7.1
166.7
17.5
88.2
17.6
22.9
12.0
10.0
21.1
36.3
26.2
30.0
42.9
109.3
11.3
38.1
144.6
111.5
12.2
42.9
176.0
6.0
16.0
28 June 2017
19

MOSL Universe stock performance
Company
Automobiles
Amara Raja
Ashok Ley.
Bajaj Auto
Bharat Forge
Bosch
CEAT
Eicher Mot.
Endurance Tech.
Escorts
Exide Ind
Hero Moto
M&M
Mahindra CIE
Maruti Suzuki
Tata Motors
TVS Motor
Banks - Private
Axis Bank
DCB Bank
Equitas Hold.
Federal Bank
HDFC Bank
ICICI Bank
IDFC Bank
IndusInd
J&K Bank
Kotak Mah. Bk
RBL Bank
South Indian
Yes Bank
Banks - PSU
BOB
BOI
Canara
IDBI Bk
Indian Bk
OBC
PNB
SBI
Union Bk
NBFCs
Bajaj Fin.
Bharat Fin.
Cholaman.Inv.&Fn
Dewan Hsg.
GRUH Fin.
HDFC
Indiabulls Hsg
LIC Hsg Fin
Manappuram
M&M Fin.
Muthoot Fin
PFC
Repco Home
REC
STF
Shriram City Union
1 Day (%)
-0.3
-1.4
-1.6
-1.7
-2.3
-1.4
-1.9
1.7
-4.1
-1.7
1.0
-0.4
-0.5
-0.6
-0.3
-0.6
-2.3
-3.0
-1.1
-2.1
-0.6
-1.2
-1.7
-0.1
-1.1
-1.1
0.4
-2.1
-1.5
-3.6
-0.3
-4.5
-1.7
-4.5
-3.1
-4.7
-3.3
-2.8
-3.6
-0.4
1.6
-3.1
-2.5
0.0
-2.2
-0.6
-1.4
0.2
-2.3
-0.6
-1.9
-4.0
2.3
0.3
1M (%)
-3.5
-0.8
-1.3
-3.7
-1.4
5.9
-5.9
10.1
1.1
-8.6
2.2
2.2
-5.7
1.7
-8.2
-0.2
-3.6
0.1
-1.7
0.0
2.6
-1.5
-4.4
0.8
6.5
1.1
-1.8
2.2
-5.2
-13.9
-10.1
-9.9
-11.9
-15.3
-9.2
-9.2
-3.1
-11.6
2.5
-4.3
6.7
3.6
7.7
6.7
-0.4
6.3
3.0
6.0
9.4
-15.4
5.9
-17.2
0.2
7.8
12M (%)
-1.6
-6.5
4.8
46.5
11.2
124.2
42.6
198.4
27.2
21.0
-1.4
29.0
78.4
-1.6
79.5
-4.2
102.3
-12.3
101.3
44.0
36.1
24.2
37.9
31.3
31.9
53.3
31.5
1.9
35.2
55.1
-18.3
97.0
31.1
31.6
28.7
13.7
75.9
2.5
12.9
117.2
58.6
35.7
64.0
55.3
42.3
5.6
55.3
49.2
6.1
103.8
-14.6
51.1
Company
Capital Goods
ABB
Bharat Elec.
BHEL
Blue Star
CG Cons. Elec.
CG Power & Inds Sol.
Cummins
GE T&D
Havells
Inox Wind
K E C Intl
L&T
Pennar Eng.
Siemens
Solar Ind
Suzlon Energy
Thermax
Va Tech Wab.
Voltas
Cement
Ambuja Cem.
ACC
Birla Corp.
Dalmia Bharat
Grasim Inds.
India Cem
J K Cements
JK Lakshmi Ce
Ramco Cem
Orient Cem
Prism Cem
Shree Cem
Ultratech
Consumer
Asian Paints
Britannia
Colgate
Dabur
Emami
Godrej Cons.
GSK Cons.
HUL
ITC
Jyothy Lab
Marico
Nestle
Page Inds
Parag Milk
Pidilite Ind.
P&G Hygiene
Prabhat Dairy
United Brew
United Spirits
Healthcare
Alembic Phar
Alkem Lab
Ajanta Pharma
Aurobindo
1 Day (%)
0.2
-2.6
-0.6
-1.3
0.5
-1.8
0.3
-0.3
1.6
-1.3
-1.5
-1.2
-3.8
-1.8
-0.6
-1.4
-1.0
-1.6
-1.7
-1.2
-3.5
-1.5
-4.0
3.9
-6.1
-2.2
0.5
-0.3
-1.5
-0.7
-1.4
-3.0
-1.7
-0.3
-1.1
0.4
-2.2
0.9
0.5
-0.4
0.3
-2.6
-1.2
-0.2
-0.2
-1.8
-2.6
-0.7
-3.0
0.3
1.3
-2.3
-0.3
0.3
-0.2
1M (%)
-2.4
-8.3
-15.4
-5.8
-2.0
-14.4
-4.6
-5.3
-0.2
-2.0
-5.1
-4.8
-5.8
-5.9
-3.2
-8.6
-8.5
1.9
-10.4
-0.2
-3.1
12.1
-3.4
9.8
-4.8
-13.6
2.3
-1.7
-8.1
-2.5
-5.6
-6.6
0.2
6.6
9.5
7.2
-2.0
5.4
1.9
4.9
1.0
-3.8
-2.5
-0.5
13.6
-16.3
5.7
6.3
11.3
-0.6
10.5
-11.2
-2.5
-5.0
25.7
12M (%)
19.1
27.4
12.5
45.5
62.7
11.4
12.7
-1.4
31.1
-39.7
77.7
16.0
-10.9
4.1
34.8
6.5
17.0
18.9
43.7
-5.5
-1.4
58.6
118.4
38.8
83.6
44.8
27.8
21.0
-14.1
23.0
15.5
14.2
16.4
35.5
23.5
-8.9
-2.7
26.4
-8.0
27.0
30.2
20.8
19.8
2.5
19.9
-20.3
14.2
28.2
29.2
8.1
-5.2
-9.1
31.7
2.8
-7.3
28 June 2017
20

MOSL Universe stock performance
Company
Biocon
Cadila
Cipla
Divis Lab
Dr Reddy’s
Fortis Health
Glenmark
Granules
GSK Pharma
IPCA Labs
Lupin
Sanofi India
Sun Pharma
Syngene Intl
Torrent Pharma
Logistics
Allcargo Logistics
Blue Dart
Concor
Gateway Distriparks
Gati
Transport Corp.
Media
Dish TV
D B Corp
Den Net.
Hind. Media
HT Media
Jagran Prak.
PVR
Siti Net.
Sun TV
Zee Ent.
Metals
Hindalco
Hind. Zinc
JSPL
JSW Steel
Nalco
NMDC
SAIL
Vedanta
Tata Steel
Oil & Gas
BPCL
GAIL
Gujarat Gas
Gujarat St. Pet.
HPCL
IOC
IGL
MRPL
Oil India
ONGC
PLNG
Reliance Ind.
Retail
Jubilant Food
Titan Co.
1 Day (%)
-2.0
0.1
-1.2
0.6
0.4
-4.2
0.3
-4.9
0.0
0.6
0.2
-0.4
-0.1
-0.5
0.5
-1.0
0.4
-2.6
-0.1
-2.2
-1.3
1.1
-0.7
-3.3
-1.0
-0.8
-0.2
-3.8
-1.2
-2.1
-3.4
-0.6
1.6
-1.2
-0.8
1.3
-3.0
-1.7
0.1
0.6
-3.0
1.6
-1.4
2.4
-1.1
1.8
-1.5
1.5
-2.3
1.2
-0.7
0.1
1.0
0.8
1M (%)
3.1
18.4
8.7
17.5
10.1
-18.6
1.5
-5.3
4.2
-5.4
-4.4
3.2
-4.4
-1.4
-3.3
-3.8
-3.2
-6.0
5.4
1.0
11.3
-14.2
2.9
-12.7
-1.7
1.0
0.2
-1.5
-9.4
-1.9
-5.5
-5.5
5.5
-6.1
-2.5
-8.6
-10.8
-4.6
-2.2
-0.3
-18.4
-10.3
-0.7
-4.4
-11.4
-8.5
2.5
-11.0
-13.4
-9.0
-1.7
7.5
-6.3
9.0
12M (%)
28.0
64.2
9.3
-41.6
-18.1
5.7
-19.2
-5.9
-29.0
1.4
-28.1
-2.1
-29.8
12.0
-11.1
-4.3
-26.9
4.7
-16.3
-25.9
53.8
-20.1
0.8
-11.3
-0.8
5.4
5.8
52.6
-23.3
123.8
11.4
56.9
51.6
83.8
39.9
49.6
14.7
32.2
93.9
64.5
17.9
26.2
43.4
22.0
54.9
85.3
73.9
81.6
3.0
14.3
50.9
50.2
-11.3
32.1
Company
Technology
Cyient
HCL Tech.
Hexaware
Infosys
KPIT Tech
L&T Infotech
Mindtree
Mphasis
NIIT Tech
Persistent Sys
Tata Elxsi
TCS
Tech Mah
Wipro
Zensar Tech
Telecom
Bharti Airtel
Bharti Infratel
Idea Cellular
Tata Comm
Utiltites
Coal India
CESC
JSW Energy
NTPC
Power Grid
Tata Power
Others
Arvind
Avenue Super.
Bata India
Castrol India
Century Ply.
Coromandel Intl
Delta Corp
Dynamatic Tech
Eveready Inds.
Interglobe
Indo Count
Info Edge
Inox Leisure
Jain Irrigation
Just Dial
Kaveri Seed
Kitex Garm.
Manpasand
MCX
Monsanto
Navneet Educat.
PI Inds.
Piramal Enterp.
SRF
S H Kelkar
Symphony
TTK Prestige
V-Guard
Wonderla
1 Day (%)
-1.0
-1.1
-0.5
-1.8
1.8
-3.0
-0.9
0.3
-0.7
-2.6
-1.1
-0.6
-0.2
-0.3
-0.8
1.6
0.3
2.3
0.0
-0.3
-0.5
-0.2
-0.1
-0.1
-0.4
-2.5
0.6
1.7
-0.7
-3.3
-2.4
-1.2
-0.9
-2.6
-1.9
-5.9
-0.5
-2.3
-2.8
-3.8
2.5
-3.6
-1.7
-1.7
0.2
-4.0
-0.2
-0.5
-3.3
-1.1
0.9
0.7
-1.8
-1.7
1M (%)
0.7
-2.0
-2.6
-7.0
2.3
-1.8
-1.4
2.0
11.7
10.0
16.9
-9.0
-11.5
-5.0
-2.7
-0.5
1.0
1.9
10.3
-8.8
-3.7
-2.3
1.0
1.1
0.1
-5.3
12.0
-1.2
-3.8
11.9
8.1
-2.5
-12.0
6.1
11.6
-4.7
13.6
-9.2
4.0
-19.0
14.0
-3.1
-9.4
7.1
-3.0
1.7
-1.7
3.0
-7.6
-4.8
0.6
4.4
-2.3
-1.0
12M (%)
5.1
14.5
6.1
-20.6
-31.0
-19.0
-0.6
10.9
-8.8
-6.2
-6.0
-24.6
-6.8
-10.9
5.9
14.0
-19.1
60.8
-20.7
49.2
-21.3
5.7
33.0
12.3
11.5
1.0
8.5
52.8
62.1
68.4
-5.6
31.1
19.3
-11.8
23.4
20.4
42.3
-39.7
47.3
-23.3
40.6
11.0
4.9
87.3
15.6
101.1
21.3
24.8
8.1
42.4
81.5
-7.7
28 June 2017
21

NOTES
28 June 2017
22

THEMATIC/STRATEGY RESEARCH GALLERY

REPORT GALLERY
RECENT INITIATING COVERAGE REPORTS
Rs

DIFFERENTIATED PRODUCT GALLERY

Disclosures
This document has been prepared by Motilal Oswal Securities Limited (hereinafter referred to as Most) to provide information about the company (ies) and/sector(s), if any, covered in the report and may be distributed by it and/or its
affiliated company(ies). This report is for personal information of the selected recipient/s and does not construe to be any investment, legal or taxation advice to you. This research report does not constitute an offer, invitation or
inducement to invest in securities or other investments and Motilal Oswal Securities Limited (hereinafter referred as MOSt) is not soliciting any action based upon it. This report is not for public distribution and has been furnished to
you solely for your general information and should not be reproduced or redistributed to any other person in any form. This report does not constitute a personal recommendation or take into account the particular investment
objectives, financial situations, or needs of individual clients. Before acting on any advice or recommendation in this material, investors should consider whether it is suitable for their particular circumstances and, if necessary, seek
professional advice. The price and value of the investments referred to in this material and the income from them may go down as well as up, and investors may realize losses on any investments. Past performance is not a guide for
future performance, future returns are not guaranteed and a loss of original capital may occur.
MOSt and its affiliates are a full-service, integrated investment banking, investment management, brokerage and financing group. We and our affiliates have investment banking and other business relationships with a some
companies covered by our Research Department. Our research professionals may provide input into our investment banking and other business selection processes. Investors should assume that MOSt and/or its affiliates are
seeking or will seek investment banking or other business from the company or companies that are the subject of this material and that the research professionals who were involved in preparing this material may educate investors
on investments in such business . The research professionals responsible for the preparation of this document may interact with trading desk personnel, sales personnel and other parties for the purpose of gathering, applying and
interpreting information. Our research professionals are paid on twin parameters of performance & profitability of MOSt.
MOSt generally prohibits its analysts, persons reporting to analysts, and members of their households from maintaining a financial interest in the securities or derivatives of any companies that the analysts cover. Additionally, MOSt
generally prohibits its analysts and persons reporting to analysts from serving as an officer, director, or advisory board member of any companies that the analysts cover. Our salespeople, traders, and other professionals or affiliates
may provide oral or written market commentary or trading strategies to our clients that reflect opinions that are contrary to the opinions expressed herein, and our proprietary trading and investing businesses may make investment
decisions that are inconsistent with the recommendations expressed herein. In reviewing these materials, you should be aware that any or all of the foregoingamong other things, may give rise to real or potential conflicts of interest.
MOSt and its affiliated company(ies), their directors and employees and their relatives may; (a) from time to time, have a long or short position in, act as principal in, and buy or sell the securities or derivatives thereof of companies
mentioned herein. (b) be engaged in any other transaction involving such securities and earn brokerage or other compensation or act as a market maker in the financial instruments of the company(ies) discussed herein or act as an
advisor or lender/borrower to such company(ies) or may have any other potential conflict of interests with respect to any recommendation and other related information and opinions.; however the same shall have no bearing
whatsoever on the specific recommendations made by the analyst(s), as the recommendations made by the analyst(s) are completely independent of the views of the affiliates of MOSt even though there might exist an inherent
conflict of interest in some of the stocks mentioned in the research report Reports based on technical and derivative analysis center on studying charts company's price movement, outstanding positions and trading volume, as
opposed to focusing on a company's fundamentals and, as such, may not match with a report on a company's fundamental analysis. In addition MOST has different business segments / Divisions with independent research
separated by Chinese walls catering to different set of customers having various objectives, risk profiles, investment horizon, etc, and therefore may at times have different contrary views on stocks sectors and markets.
Unauthorized disclosure, use, dissemination or copying (either whole or partial) of this information, is prohibited. The person accessing this information specifically agrees to exempt MOSt or any of its affiliates or employees from,
any and all responsibility/liability arising from such misuse and agrees not to hold MOSt or any of its affiliates or employees responsible for any such misuse and further agrees to hold MOSt or any of its affiliates or employees free
and harmless from all losses, costs, damages, expenses that may be suffered by the person accessing this information due to any errors and delays. The information contained herein is based on publicly available data or other
sources believed to be reliable. Any statements contained in this report attributed to a third party represent MOSt’s interpretation of the data, information and/or opinions provided by that third party either publicly or through a
subscription service, and such use and interpretation have not been reviewed by the third party. This Report is not intended to be a complete statement or summary of the securities, markets or developments referred to in the
document. While we would endeavor to update the information herein on reasonable basis, MOSt and/or its affiliates are under no obligation to update the information. Also there may be regulatory, compliance, or other reasons that
may prevent MOSt and/or its affiliates from doing so. MOSt or any of its affiliates or employees shall not be in any way responsible and liable for any loss or damage that may arise to any person from any inadvertent error in the
information contained in this report. MOSt or any of its affiliates or employees do not provide, at any time, any express or implied warranty of any kind, regarding any matter pertaining to this report, including without limitation the
implied warranties of merchantability, fitness for a particular purpose, and non-infringement. The recipients of this report should rely on their own investigations.
This report is intended for distribution to institutional investors. Recipients who are not institutional investors should seek advice of their independent financial advisor prior to taking any investment decision based on this report or for
any necessary explanation of its contents.
Most and it’s associates may have managed or co-managed public offering of securities, may have received compensation for investment banking or merchant banking or brokerage services, may have received any compensation
for products or services other than investment banking or merchant banking or brokerage services from the subject company in the past 12 months.
Most and it’s associates have not received any compensation or other benefits from the subject company or third party in connection with the research report.
Subject Company may have been a client of Most or its associates during twelve months preceding the date of distribution of the research report
MOSt and/or its affiliates and/or employees may have interests/positions, financial or otherwise of over 1 % at the end of the month immediately preceding the date of publication of the research in the securities mentioned in this
report. To enhance transparency, MOSt has incorporated a Disclosure of Interest Statement in this document. This should, however, not be treated as endorsement of the views expressed in the report.
Motilal Oswal Securities Limited is registered as a Research Analyst under SEBI (Research Analyst) Regulations, 2014. SEBI Reg. No. INH000000412
Pending Regulatory inspections against Motilal Oswal Securities Limited:
SEBI pursuant to a complaint from client Shri C.R. Mohanraj alleging unauthorized trading, issued a letter dated 29th April 2014 to MOSL notifying appointment of an Adjudicating Officer as per SEBI regulations to hold inquiry and
adjudge violation of SEBI Regulations; MOSL replied to the Show Cause Notice whereby SEBI granted us an opportunity of Inspection of Documents. Since all the documents requested by us were not covered we have requested to
SEBI vide our letter dated June 23, 2015 to provide pending list of documents for inspection.
List of associate companies of Motilal Oswal Securities Limited -Click
here to access detailed report
Analyst Certification
The views expressed in this research report accurately reflect the personal views of the analyst(s) about the subject securities or issues, and no part of the compensation of the research analyst(s) was, is, or will be directly or
indirectly related to the specific recommendations and views expressed by research analyst(s) in this report. The research analysts, strategists, or research associates principally responsible for preparation of MOSt research receive
compensation based upon various factors, including quality of research, investor client feedback, stock picking, competitive factors and firm revenues
Disclosure of Interest Statement
Analyst ownership of the stock
Served as an officer, director or employee
Companies where there is interest
No
No
A graph of daily closing prices of securities is available at www.nseindia.com and http://economictimes.indiatimes.com/markets/stocks/stock-quotes
Regional Disclosures (outside India)
This report is not directed or intended for distribution to or use by any person or entity resident in a state, country or any jurisdiction, where such distribution, publication, availability or use would be contrary to law, regulation or which
would subject MOSt& its group companies to registration or licensing requirements within such jurisdictions.
For Hong Kong:
This report is distributed in Hong Kong by Motilal Oswal capital Markets (Hong Kong) Private Limited, a licensed corporation (CE AYY-301) licensed and regulated by the Hong Kong Securities and Futures
Commission (SFC) pursuant to the Securities and Futures Ordinance (Chapter 571 of the Laws of Hong Kong) “SFO”. As per SEBI (Research Analyst Regulations) 2014 Motilal Oswal Securities (SEBI Reg No. INH000000412) has
an agreement with Motilal Oswal capital Markets (Hong Kong) Private Limited for distribution of research report in Kong Kong. This report is intended for distribution only to “Professional Investors” as defined in Part I of Schedule 1 to
SFO. Any investment or investment activity to which this document relates is only available to professional investor and will be engaged only with professional investors.” Nothing here is an offer or solicitation of these securities,
products and services in any jurisdiction where their offer or sale is not qualified or exempt from registration. The Indian Analyst(s) who compile this report is/are not located in Hong Kong & are not conducting Research Analysis in
Hong Kong.
Motilal Oswal Securities Limited (MOSL) is not a registered broker - dealer under the U.S. Securities Exchange Act of 1934, as amended (the"1934 act") and under applicable state laws in the United States. In addition MOSL is not a
registered investment adviser under the U.S. Investment Advisers Act of 1940, as amended (the "Advisers Act" and together with the 1934 Act, the "Acts), and under applicable state laws in the United States. Accordingly, in the
absence of specific exemption under the Acts, any brokerage and investment services provided by MOSL, including the products and services described herein are not available to or intended for U.S. persons.
This report is intended for distribution only to "Major Institutional Investors" as defined by Rule 15a-6(b)(4) of the Exchange Act and interpretations thereof by SEC (henceforth referred to as "major institutional investors"). This
document must not be acted on or relied on by persons who are not major institutional investors. Any investment or investment activity to which this document relates is only available to major institutional investors and will be
engaged in only with major institutional investors. In reliance on the exemption from registration provided by Rule 15a-6 of the U.S. Securities Exchange Act of 1934, as amended (the "Exchange Act") and interpretations thereof by
the U.S. Securities and Exchange Commission ("SEC") in order to conduct business with Institutional Investors based in the U.S., MOSL has entered into a chaperoning agreement with a U.S. registered broker-dealer, Motilal Oswal
Securities International Private Limited. ("MOSIPL"). Any business interaction pursuant to this report will have to be executed within the provisions of this chaperoning agreement.
The Research Analysts contributing to the report may not be registered /qualified as research analyst with FINRA. Such research analyst may not be associated persons of the U.S. registered broker-dealer, MOSIPL, and therefore,
may not be subject to NASD rule 2711 and NYSE Rule 472 restrictions on communication with a subject company, public appearances and trading securities held by a research analyst account.
For Singapore
Motilal Oswal Capital Markets Singapore Pte Limited is acting as an exempt financial advisor under section 23(1)(f) of the Financial Advisers Act(FAA) read with regulation 17(1)(d) of the Financial Advisors Regulations and is a
subsidiary of Motilal Oswal Securities Limited in India. This research is distributed in Singapore by Motilal Oswal Capital Markets Singapore Pte Limited and it is only directed in Singapore to accredited investors, as defined in the
Financial Advisers Regulations and the Securities and Futures Act (Chapter 289), as amended from time to time.
In respect of any matter arising from or in connection with the research you could contact the following representatives of Motilal Oswal Capital Markets Singapore Pte Limited:
Varun Kumar
Varun.kumar@motilaloswal.com
Contact : (+65) 68189232
Office Address:21 (Suite 31),16 CollyerQuay,Singapore 04931
For U.S
13 December 2016
Motilal Oswal Tower, Level 9, Sayani Road, Prabhadevi, Mumbai 400 025
Phone: +91 22 3982 5500 E-mail: reports@motilaloswal.com
Motilal Oswal Securities Ltd
20