30 June 2017
Update
| Sector:
Oil & Gas
ONGC
Buy
BSE SENSEX
30,858
S&P CNX
9,504
CMP: INR158
TP: INR195 (+24%)
Lowering crude oil price estimates
Stock price correction provides an opportunity to buy
Crude oil prices decline despite production cut extension
Stock Info
Bloomberg
Equity Shares (m)
52-Week Range (INR)
1, 6, 12 Rel. Per (%)
M.Cap. (INR b)
M.Cap. (USD b)
Avg Val, INRm
Free float (%)
ONGC IN
12,833
212 / 141
-9/-33/-5
2,335.7
34.4
1453
31.9
Financials Snapshot (INR b)
Y/E Mar
FY17 FY18E
1421
1561
Sales
471
606
EBITDA
211
230
NP
16.4
17.9
EPS (Rs)
20.8
8.9
EPS Gr. (%)
172
179
BV/Sh. (Rs)
10.4
10.2
RoE (%)
8.5
8.9
RoCE (%)
9.6
8.8
P/E (x)
0.9
0.9
P/BV (x)
EV/EBITDA (x)
4.8
3.8
Div. Yield (%)
3.8
6.3
FY19E
1771
703
259
20.1
12.6
186
11.1
9.5
7.8
0.8
3.3
7.1
On 25 May 2017, OPEC and non-OPEC countries agreed to extend oil
production cut until March 2018 in a bid to boost oil prices.
Despite this, oil prices have declined due to rising production from Nigeria and
Libya – the two OPEC members exempt from the cut.
In May 2017, oil production in Libya increased by more than 240kbpd to
780kbpd and in Nigeria by 140kbpd to 1.52mbpd.
The increased shale drilling and the revival in oil production from
Libya/Nigeria are expected to lead to higher-than-expected slowdown in
inventory draws in 2017. It presents a risk of inventory normalization not
being achieved by the time the OPEC cut ends in March next year.
We expect crude oil prices to hover near USD50/bbl until there is evidence of
a decline in the US rig count, an increase in inventory draws or additional
OPEC production cut. Thus, we reduce our crude oil price estimates to
USD50/55/bbl for FY18/19 v/s USD55/60/bbl earlier.
Management’s conscious efforts on cost efficiencies through lower workover
and water injection have resulted in opex coming down from USD7.4/boe in
FY16 to USD6.3/boe in FY17. We expect this cost efficiency to sustain.
ONGC is expected to witness gas production growth of 10-15% annually for
the next five years, led by the Daman, C26, S1, Vashishta and Bassein fields.
Also, oil production is expected to increase from the nominated fields like
WO16, Vasai East and Ratna & R-series.
We do not expect any subsidy burden to be levied on ONGC as long as oil
prices are below USD65/bbl. However, realization may be capped if oil prices
move above that level.
Crude oil prices have declined sharply due to short-term imbalance in the
global oil market. We expect crude oil prices to increase as the market
rebalances, and note that ONGC is a direct play on crude oil price.
With OPEC and non-OPEC agreeing to extend oil production cut until March
2018, we expect stability in crude oil prices and also in the company’s
realizations. For FY18/19, we model Brent of USD50/55/bbl and expect EPS of
INR17.9/20.1.
ONGC’s stock price has declined ~11% in June, led by a fall in crude price and
INR appreciation. This correction is an opportunity to buy, in our view.
We value the stock at INR195 using SOTP valuation. The stock trading at 7.8x
FY19E EPS of INR20.1 and at EV of 3.3x FY19E EBITDA. Maintain
Buy.
ONGC is well placed
Shareholding pattern (%)
As On
Mar-17 Dec-16 Mar-16
Promoter
68.1
68.9
68.9
DII
12.0
11.7
11.9
FII
6.3
5.8
5.6
Others
13.7
13.6
13.6
Note: FII Includes depository receipts
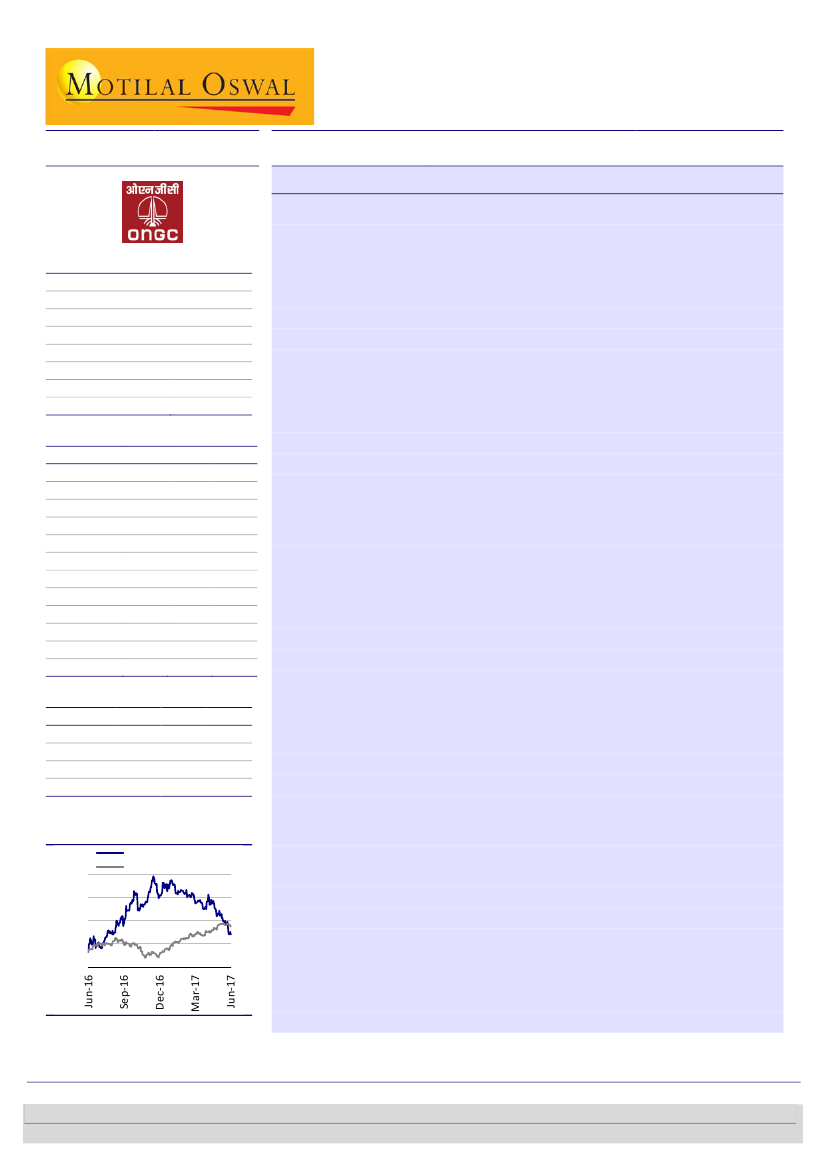
Stock Performance (1-year)
ONGC
Sensex - Rebased
210
190
170
150
130
Stock price correction provides an opportunity to buy
Swarnendu Bhushan
(Swarnendu.Bhushan@MotilalOswal.com); +91 22 6129 1529
Abhinil Dahiwale
(Abhinil.Dahiwale@MotilalOswal.com); +91 22 6129 1566
Investors are advised to refer through important disclosures made at the last page of the Research Report.
Motilal Oswal research is available on www.motilaloswal.com/Institutional-Equities, Bloomberg, Thomson Reuters, Factset and S&P Capital.

ONGC
Crude oil price to hover around USD50/bbl
Exhibit 1: Crude oil production from OPEC was flat YoY (up MoM) at 32.1mbpd in May 2017
Crude Oil Production, OPEC Total (mbpd)
7%
33.3
6%
3%
3%
2%
32.6
2%
32.7
2%
32.9
32.6
2%
32.6
3%
2%
0%
32.0
32.2
32.2
4%
YoY (%)
33.1
4%
32.2
32.1
31.6
-1%
31.7
0%
-1%
32.0
0%
32.3
31.9
Jan-16 Feb-16 Mar-16 Apr-16 May-16 Jun-16 Jul-16 Aug-16 Sep-16 Oct-16 Nov-16 Dec-16 Jan-17 Feb-17 Mar-17 Apr-17 May-17
Source: EIA, MOSL
Exhibit 2: Libyan oil production increased by more than 240kbpd to 780kbpd in May v/s 540kbpd in April 2017
Crude Oil Production, Libya (mbpd)
YoY (%)
169%
0.4
0%
0.4
0%
0.3
-33%
0.3
-35%
0.3
-33%
0.3
-20%
0.3
-23%
0.3
-31%
0.3
-18%
31%
0.6
53%
68%
84%
92%
84%
64%
0.8
0.5
0.6
0.6
0.7
0.7
0.6
Jan-16 Feb-16 Mar-16 Apr-16 May-16 Jun-16 Jul-16 Aug-16 Sep-16 Oct-16 Nov-16 Dec-16 Jan-17 Feb-17 Mar-17 Apr-17 May-17
Source: EIA, MOSL
Exhibit 3: Nigerian oil production increased by more than 140kbpd to 1.52mbpd in May 2017
Crude Oil Production, Nigeria (mbpd)
2%
-1%
-9%
-10%
-24%
-12%
-25%
-18%
-31%
-28%
-18%
-19%
-18%
-12%
YoY (%)
16%
-22%
-24%
1.8
1.8
1.6
1.6
1.3
1.4
1.4
1.2
1.3
1.5
1.5
1.4
1.4
1.5
1.3
1.4
1.5
Jan-16 Feb-16 Mar-16 Apr-16 May-16 Jun-16 Jul-16 Aug-16 Sep-16 Oct-16 Nov-16 Dec-16 Jan-17 Feb-17 Mar-17 Apr-17 May-17
Source: EIA, MOSL
30 June 2017
2

ONGC
Exhibit 4: US crude oil production increased consecutively in April and May 2017 after declining in previous months
9.2
9.2
9.2
9.0
-2%
-4%
-4%
-7%
-6%
8.9
8.7
-7%
8.7
-8%
8.8
-7%
8.6
-9%
U.S. Crude Oil Production (mbpd)
YoY (%)
2%
8.8
-6%
-5%
8.9
-5%
8.8
-1%
-4%
9.1
9.1
9.2
-1%
4%
8.9
9.0
Jan-16 Feb-16 Mar-16 Apr-16 May-16 Jun-16 Jul-16 Aug-16 Sep-16 Oct-16 Nov-16 Dec-16 Jan-17 Feb-17 Mar-17 Apr-17 May-17
Source: EIA, MOSL
Exhibit 5: US shale basin rig count has been increasing; rig count increased by ~200 in 2017 YTD v/s 35 in 2016
US Shale - Rig count
YoY (%)
454
498
541
54%
-4%
19%
87%
574
619
653
149%
120%
419
352
307
281
-58%
262
-57%
274
-53%
300
-48%
333
-43%
352
367
-29%
401
-63%
-62%
-60%
-38%
-20%
Jan-16 Feb-16 Mar-16 Apr-16 May-16 Jun-16 Jul-16 Aug-16 Sep-16 Oct-16 Nov-16 Dec-16 Jan-17 Feb-17 Mar-17 Apr-17 May-17
Source: EIA, MOSL
Valuation and view
Reducing our crude oil estimates for FY18/19
ONGC is set to increase its gas production by 10-15% annually for the next five
years, according to management.
Continued improved oil recovery (IOR) and contribution of new projects to
production would also help reverse the decadal trend of negative-to-flat growth.
We expect oil prices to remain in the USD50-55/bbl range, which should provide
stability to its earnings. For FY18/19, we model Brent of USD50/55/bbl and
expect EPS of INR17.9/20.1.
ONGC’s stock price has declined by ~11% in June, led by a fall in crude price and
INR appreciation. This correction is an opportunity to buy, in our view.
We value the stock at INR195 using SOTP valuation. The stock trading at 7.8x
FY19E EPS of INR20.1 and at EV of 3.3x FY19E EBITDA. Maintain
Buy.
30 June 2017
3

ONGC
Exhibit 6: SOTP for ONGC
Valuation of ONGC
Consol. FY19 EPS
FY19 Other income (INR b)
Other income (INR/share)
FY19 EPS excluding other income (INR)
PE (x)
Valuation of ONGC consol. (INR/share)
Listed investments
Indian Oil Corporation
Petronet LNG
GAIL
MRPL
Total valuation
Valuation of Mozambique
Recoverable reserves (tcf)
Valuation of block (USD b)
ONGC's stake (%)
Discount rate (%)
Valuation for ONGC (USD b)
Value paid (USD b)
Valuation for ONGC (INR/share)
Valuation of ONGC (INR/share)
20.1
57.4
2.9
17.3
10.0
173
12
3
1
11
200
75
31
16
50
3
3
(4)
195
Source: MOSL, Company
Exhibit 7: ONGC: Key assumptions
Year End: March 31 (INRm)
Exchange Rate (INR/USD)
APM Gas Price (USD/mmbtu)
Brent crude price (USD/bbl)
Production Details (mmtoe)
Domestic Oil Prodn (mmt)
Domestic Gas Prodn (bcm)
Domestic Prodn (mmtoe)
OVL Production (mmtoe)
Group Production (mmtoe)
Subsidy Sharing (INRb)
ONGC Subsidy
Oil Price Realization (USD/bbl)
Gross
Upstream Discount
Net
FY12
47.8
4.2
114.5
26.9
25.7
52.6
8.8
61.4
445
117.4
62.4
55.0
FY13
54.4
4.2
110.6
26.1
25.3
51.5
7.3
58.7
494
110.5
62.9
47.6
FY14
60.6
4.2
107.8
26.0
24.9
50.9
8.4
59.3
564
106.7
65.8
40.9
FY15
61.4
4.9
86.0
25.9
23.5
49.5
8.9
58.3
363
86.0
40.9
45.1
FY16
65.5
4.7
47.6
25.9
22.5
48.5
8.9
57.4
17
48.6
1.8
46.8
FY17
67.1
3.1
49.0
26.4
23.5
50.0
12.8
62.8
0
50.2
0.0
50.2
FY18E
65.6
2.9
50.0
26.2
25.6
51.8
15.0
66.8
0
51.0
0.0
51.0
FY19E
67.0
3.2
55.0
26.2
29.5
55.7
15.0
70.7
0
56.1
0.0
56.1
Source: Company, MOSL
30 June 2017
4

ONGC
ONGC: Story in charts
Exhibit 8: Expect domestic production uptick in
coming years (mmt)
Domestic Oil Prodn (mmt)
52.6
51.5
25.3
50.9
24.9
49.5
23.5
Domestic Gas Prodn (bcm)
55.7
51.8
50.0
48.5
22.5
23.5
25.6
29.5
5.1
4.3
5.4
5.4
Exhibit 9: JV production to decline
JVs (mmtoe)
5.3
25.7
5.2
4.9
4.9
4.4
3.8
26.9
FY12
26.1
FY13
26.0
FY14
25.9
FY15
25.9
FY16
26.4
FY17
26.2
26.2
FY18E FY19E
FY10 FY11 FY12 FY13 FY14 FY15 FY16 FY17E FY18E FY19E
Source: Company, MOSL
Exhibit 10: OVL production to increase in FY18/19…
Domestic Prodn (mmtoe)
61.4
8.8
58.7
7.3
59.3
8.4
58.3
8.9
OVL Production (mmtoe)
70.7
66.8
62.8
57.4
15.0
15.0
12.8
8.9
Exhibit 11: …leading to increase in net realization (USD/bbl)
Net
117
111
107
86
62
63
66
41
45
FY15
49
2
55
48
FY13
41
FY14
47
FY16
50
FY17
50
0
51
51
0
56
56
0
Upstream Discount
Gross
52.6
51.5
50.9
49.5
48.5
50.0
51.8
55.7
FY12
FY13
FY14
FY15
FY16
FY17
FY18E FY19E
FY12
FY18E FY19E
Source: Company, MOSL
Exhibit 12: ONGC: 1-year forward P/E (x)
24
18
12
6
11.1
7.2
8.0
PE (x)
Peak(x)
Avg(x)
20.7
Min(x)
Source: Company, MOSL
30 June 2017
5

ONGC
Financials and Valuations
Consolidated - Income Statement
Y/E March
Total Income from Operations
Change (%)
Government Levies
Other Operating Costs
Total Expenditure
% of Sales
EBITDA
Margin (%)
Depreciation
EBIT
Int. and Finance Charges
Other Income
PBT bef. EO Exp.
EO Items
PBT after EO Exp.
Total Tax
Tax Rate (%)
Minority Interest
Reported PAT
Adjusted PAT
Change (%)
Margin (%)
FY13
1,624,032
11.0
256,886
818,387
1,075,274
66.2
548,758
33.8
231,399
317,359
4,838
54,900
367,422
0
367,422
127,519
34.7
-2,294
242,196
242,234
-6.9
14.9
FY14
1,744,771
7.4
261,893
892,607
1,154,500
66.2
590,270
33.8
250,690
339,580
6,243
68,937
402,274
2,423
404,697
127,604
31.5
1,465
275,628
262,235
8.3
15.0
FY15
1,608,897
-7.8
255,065
807,294
1,062,360
66.0
546,538
34.0
289,844
256,694
28,624
59,644
287,715
-14,011
273,704
96,974
35.4
-6,606
183,335
183,638
-30.0
11.4
FY16
1,356,642
-15.7
0
904,510
904,510
66.7
452,132
33.3
224,626
227,506
37,656
81,448
271,298
-79,433
191,865
69,507
36.2
-8,657
131,016
174,478
-5.0
12.9
FY17
1,421,490
4.8
0
950,925
950,925
66.9
470,565
33.1
226,394
244,171
29,534
79,153
293,789
5,910
299,699
95,617
31.9
-10,702
214,783
210,759
20.8
14.8
(INR Million)
FY18E
1,560,537
9.8
0
954,176
954,176
61.1
606,362
38.9
261,372
344,989
38,905
56,130
362,215
0
362,215
128,117
35.4
4,555
229,543
229,543
8.9
14.7
FY19E
1,770,575
13.5
0
1,067,792
1,067,792
60.3
702,783
39.7
303,613
399,169
46,200
57,369
410,339
0
410,339
145,139
35.4
6,675
258,525
258,525
12.6
14.6
Consolidated - Balance Sheet
Y/E March
Equity Share Capital
Total Reserves
Net Worth
Minority Interest
Total Loans
Deferred Tax Liabilities
Capital Employed
Gross Block
Less: Accum. Deprn.
Net Fixed Assets
Goodwill on Consolidation
Capital WIP
Pre & Producing Properties
Total Investments
Curr. Assets, Loans&Adv.
Inventory
Account Receivables
Cash and Bank Balance
Loans and Advances
Curr. Liability & Prov.
Account Payables
Provisions
Net Current Assets
Appl. of Funds
E: MOSL Estimates
FY13
42,778
1,482,502
1,525,280
19,466
204,508
142,251
1,891,506
1,234,978
827,192
407,786
83,255
397,397
841,867
21,282
776,748
127,804
153,956
302,540
192,449
636,828
373,384
263,445
139,920
1,891,506
FY14
42,778
1,678,732
1,721,510
29,125
455,881
178,635
2,385,152
1,408,679
945,671
463,008
183,545
538,270
1,094,748
47,459
915,192
148,015
160,284
365,631
241,263
857,070
543,502
313,568
58,122
2,385,152
FY15
42,778
1,761,766
1,804,544
24,731
518,713
181,759
2,529,748
1,712,933
1,025,052
687,881
201,399
422,115
1,122,017
47,491
890,070
106,062
187,970
297,393
298,644
841,225
490,837
350,388
48,845
2,529,748
FY16
42,778
1,804,666
1,847,443
25,067
535,926
203,553
2,611,989
1,701,114
1,205,496
495,619
176,432
685,950
1,183,722
87,822
920,649
100,897
96,865
405,588
317,299
938,206
528,837
409,369
-17,557
2,611,989
FY17
64,166
2,147,729
2,211,895
41,243
556,819
290,991
3,100,948
2,881,281
1,281,423
1,599,858
141,737
195,730
375,963
697,096
671,644
113,641
116,926
312,422
128,654
581,079
555,163
25,916
90,564
3,100,948
(INR Million)
FY18E
64,166
2,228,211
2,292,377
45,798
740,000
290,991
3,369,166
2,174,615
1,421,569
753,046
141,737
240,711
1,346,421
697,096
847,702
121,857
110,105
475,492
140,249
657,548
574,043
83,505
190,155
3,369,166
FY19E
64,166
2,318,855
2,383,021
52,472
800,000
290,991
3,526,485
2,303,302
1,570,833
732,470
141,737
283,499
1,450,597
697,096
921,786
133,035
124,924
510,888
152,939
700,699
610,494
90,206
221,087
3,526,485
30 June 2017
6

ONGC
Financials and Valuations
Ratios
Y/E March
Basic (INR)
EPS
Cash EPS
BV/Share
DPS
Payout (%)
Valuation (x)
P/E
Cash P/E
P/BV
EV/Sales
EV/EBITDA
Dividend Yield (%)
FCF per share
Return Ratios (%)
RoE
RoCE
RoIC
Working Capital Ratios
Fixed Asset Turnover (x)
Asset Turnover (x)
Inventory (Days)
Debtor (Days)
Creditor (Days)
Leverage Ratio (x)
Current Ratio
Interest Cover Ratio
Net Debt/Equity
FY13
18.9
36.9
118.9
6.3
38.9
FY14
20.4
40.0
134.1
6.3
34.5
FY15
14.3
36.9
140.6
6.3
53.2
11.0
4.3
1.1
1.4
4.1
4.0
-0.8
10.4
9.1
10.4
0.9
0.6
24
43
111
1.1
9.0
0.1
FY16
13.6
31.1
144.0
5.7
66.8
11.6
5.1
1.1
1.6
4.8
3.6
21.2
9.6
8.4
9.1
0.8
0.5
27
26
142
1.0
6.0
0.0
FY17
16.4
34.1
172.4
6.0
43.5
9.6
4.6
0.9
1.6
4.8
3.8
3.2
10.4
8.5
10.0
0.5
0.5
29
30
143
1.2
8.3
-0.2
FY18E
17.9
38.3
178.6
9.9
64.9
8.8
4.1
0.9
1.5
3.8
6.3
9.3
10.2
8.9
11.6
0.7
0.5
29
26
134
1.3
8.9
-0.2
FY19E
20.1
43.8
185.7
11.2
64.9
7.8
3.6
0.8
1.3
3.3
7.1
10.4
11.1
9.5
12.9
0.8
0.5
27
26
126
1.3
8.6
-0.2
4.0
1.9
16.8
15.0
20.2
1.3
0.9
29
35
84
1.2
65.6
-0.1
4.0
-6.5
16.2
14.3
17.9
1.2
0.7
31
34
114
1.1
54.4
0.0
Consolidated - Cash Flow Statement
Y/E March
OP/(Loss) before Tax
Depreciation
Direct Taxes Paid
(Inc)/Dec in WC
CF from Operations
Others
CF from Operating incl EO
(Inc)/Dec in FA
Free Cash Flow
(Pur)/Sale of Investments
Others
CF from Investments
Issue of Shares
Inc/(Dec) in Debt
Dividend Paid
CF from Fin. Activity
Inc/Dec of Cash
Opening Balance
Closing Balance
FY13
367,422
120,942
-124,257
-11,710
352,397
94,606
447,003
-422,802
24,201
10,698
11,524
-400,580
2,038
-2,678
-110,021
-117,532
-71,109
373,649
302,539
FY14
394,134
233,219
-105,667
42,031
563,718
-31,014
532,704
-615,655
-82,951
-20,671
14,467
-621,859
1,782
247,223
-97,624
152,246
63,091
302,539
365,631
FY15
273,704
269,009
-90,292
-115,768
336,653
3,433
340,086
-350,957
-10,871
0
47,997
-302,960
-23
1,603
-94,953
-105,364
-68,238
365,631
297,393
FY16
273,897
307,994
-68,207
174,596
688,280
0
688,280
-416,305
271,975
-40,331
-13,220
-469,856
0
17,213
-127,442
-110,229
108,195
297,393
405,587
FY17
299,699
174,355
-95,617
-148,900
229,536
71,778
301,314
-259,754
41,560
-290,427
8,106
-542,074
0
111,342
-93,450
147,595
-93,165
405,587
312,423
(INR Million)
FY18E
362,215
261,372
-128,117
53,521
548,991
0
548,991
-430,000
118,991
0
0
-430,000
0
183,181
-149,060
44,078
163,069
312,423
475,492
FY19E
410,339
303,613
-145,139
-5,493
563,320
0
563,320
-430,000
133,320
0
0
-430,000
0
60,000
-167,881
-97,924
35,396
475,492
510,888
30 June 2017
7

Disclosures
This document has been prepared by Motilal Oswal Securities Limited (hereinafter referred to as Most) to provide information about the company (ies) and/sector(s), if any, covered in the report and may be distributed by it
and/or its affiliated company(ies). This report is for personal information of the selected recipient/s and does not construe to be any investment, legal or taxation advice to you. This research report does not constitute an
offer, invitation or inducement to invest in securities or other investments and Motilal Oswal Securities Limited (hereinafter referred as MOSt) is not soliciting any action based upon it. This report is not for public distribution
and has been furnished to you solely for your general information and should not be reproduced or redistributed to any other person in any form. This report does not constitute a personal recommendation or take into
account the particular investment objectives, financial situations, or needs of individual clients. Before acting on any advice or recommendation in this material, investors should consider whether it is suitable for their
particular circumstances and, if necessary, seek professional advice. The price and value of the investments referred to in this material and the income from them may go down as well as up, and investors may realize losses
on any investments. Past performance is not a guide for future performance, future returns are not guaranteed and a loss of original capital may occur.
MOSt and its affiliates are a full-service, integrated investment banking, investment management, brokerage and financing group. We and our affiliates have investment banking and other business relationships with a some
companies covered by our Research Department. Our research professionals may provide input into our investment banking and other business selection processes. Investors should assume that MOSt and/or its affiliates are
seeking or will seek investment banking or other business from the company or companies that are the subject of this material and that the research professionals who were involved in preparing this material may educate
investors on investments in such business . The research professionals responsible for the preparation of this document may interact with trading desk personnel, sales personnel and other parties for the purpose of
gathering, applying and interpreting information. Our research professionals are paid on twin parameters of performance & profitability of MOSt.
MOSt generally prohibits its analysts, persons reporting to analysts, and members of their households from maintaining a financial interest in the securities or derivatives of any companies that the analysts cover.
Additionally, MOSt generally prohibits its analysts and persons reporting to analysts from serving as an officer, director, or advisory board member of any companies that the analysts cover. Our salespeople, traders, and
other professionals or affiliates may provide oral or written market commentary or trading strategies to our clients that reflect opinions that are contrary to the opinions expressed herein, and our proprietary trading and
investing businesses may make investment decisions that are inconsistent with the recommendations expressed herein. In reviewing these materials, you should be aware that any or all of the foregoing among other things,
may give rise to real or potential conflicts of interest. MOSt and its affiliated company(ies), their directors and employees and their relatives may; (a) from time to time, have a long or short position in, act as principal in, and
buy or sell the securities or derivatives thereof of companies mentioned herein. (b) be engaged in any other transaction involving such securities and earn brokerage or other compensation or act as a market maker in the
financial instruments of the company(ies) discussed herein or act as an advisor or lender/borrower to such company(ies) or may have any other potential conflict of interests with respect to any recommendation and other
related information and opinions.; however the same shall have no bearing whatsoever on the specific recommendations made by the analyst(s), as the recommendations made by the analyst(s) are completely independent
of the views of the affiliates of MOSt even though there might exist an inherent conflict of interest in some of the stocks mentioned in the research report
Reports based on technical and derivative analysis center on studying charts company's price movement, outstanding positions and trading volume, as opposed to focusing on a company's fundamentals and, as such, may not match with a report on a
company's fundamental analysis. In addition MOST has different business segments / Divisions with independent research separated by Chinese walls catering to different set of customers having various objectives, risk profiles, investment horizon,
etc, and therefore may at times have different contrary views on stocks sectors and markets.
Unauthorized disclosure, use, dissemination or copying (either whole or partial) of this information, is prohibited. The person accessing this information specifically agrees to exempt MOSt or any of its affiliates or employees
from, any and all responsibility/liability arising from such misuse and agrees not to hold MOSt or any of its affiliates or employees responsible for any such misuse and further agrees to hold MOSt or any of its affiliates or
employees free and harmless from all losses, costs, damages, expenses that may be suffered by the person accessing this information due to any errors and delays. The information contained herein is based on publicly
available data or other sources believed to be reliable. Any statements contained in this report attributed to a third party represent MOSt’s interpretation of the data, information and/or opinions provided by that third party
either publicly or through a subscription service, and such use and interpretation have not been reviewed by the third party. This Report is not intended to be a complete statement or summary of the securities, markets or
developments referred to in the document. While we would endeavor to update the information herein on reasonable basis, MOSt and/or its affiliates are under no obligation to update the information. Also there may be
regulatory, compliance, or other reasons that may prevent MOSt and/or its affiliates from doing so. MOSt or any of its affiliates or employees shall not be in any way responsible and liable for any loss or damage that may
arise to any person from any inadvertent error in the information contained in this report. MOSt or any of its affiliates or employees do not provide, at any time, any express or implied warranty of any kind, regarding any
matter pertaining to this report, including without limitation the implied warranties of merchantability, fitness for a particular purpose, and non-infringement. The recipients of this report should rely on their own
investigations.
This report is intended for distribution to institutional investors. Recipients who are not institutional investors should seek advice of their independent financial advisor prior to taking any investment decision based on this
report or for any necessary explanation of its contents.
Most and it’s associates may have managed or co-managed public offering of securities, may have received compensation for investment banking or merchant banking or brokerage services, may have received any
compensation for products or services other than investment banking or merchant banking or brokerage services from the subject company in the past 12 months.
Most and it’s associates have not received any compensation or other benefits from the subject company or third party in connection with the research report.
Subject Company may have been a client of Most or its associates during twelve months preceding the date of distribution of the research report
MOSt and/or its affiliates and/or employees may have interests/positions, financial or otherwise of over 1 % at the end of the month immediately preceding the date of publication of the research in the securities mentioned
in this report. To enhance transparency, MOSt has incorporated a Disclosure of Interest Statement in this document. This should, however, not be treated as endorsement of the views expressed in the report.
Motilal Oswal Securities Limited is registered as a Research Analyst under SEBI (Research Analyst) Regulations, 2014. SEBI Reg. No. INH000000412
Pending Regulatory inspections against Motilal Oswal Securities Limited:
SEBI pursuant to a complaint from client Shri C.R. Mohanraj alleging unauthorized trading, issued a letter dated 29th April 2014 to MOSL notifying appointment of an Adjudicating Officer as per SEBI regulations to hold inquiry
and adjudge violation of SEBI Regulations; MOSL replied to the Show Cause Notice whereby SEBI granted us an opportunity of Inspection of Documents. Since all the documents requested by us were not covered we have
requested to SEBI vide our letter dated June 23, 2015 to provide pending list of documents for inspection.
List of associate companies of Motilal Oswal Securities Limited -Click
here to access detailed report
Analyst Certification
The views expressed in this research report accurately reflect the personal views of the analyst(s) about the subject securities or issues, and no part of the compensation of the research analyst(s) was, is, or will be directly or
indirectly related to the specific recommendations and views expressed by research analyst(s) in this report. The research analysts, strategists, or research associates principally responsible for preparation of MOSt research
receive compensation based upon various factors, including quality of research, investor client feedback, stock picking, competitive factors and firm revenues
ONGC
Disclosure of Interest Statement
Analyst ownership of the stock
No
Served as an officer, director or employee -
No
A graph of daily closing prices of securities is available at www.nseindia.com and http://economictimes.indiatimes.com/markets/stocks/stock-quotes
Regional Disclosures (outside India)
This report is not directed or intended for distribution to or use by any person or entity resident in a state, country or any jurisdiction, where such distribution, publication, availability or use would be contrary to law,
regulation or which would subject MOSt & its group companies to registration or licensing requirements within such jurisdictions.
For Hong Kong:
This report is distributed in Hong Kong by Motilal Oswal capital Markets (Hong Kong) Private Limited, a licensed corporation (CE AYY-301) licensed and regulated by the Hong Kong Securities and Futures
Commission (SFC) pursuant to the Securities and Futures Ordinance (Chapter 571 of the Laws of Hong Kong) “SFO”. As per SEBI (Research Analyst Regulations) 2014 Motilal Oswal Securities (SEBI Reg No. INH000000412) has
an agreement with Motilal Oswal capital Markets (Hong Kong) Private Limited for distribution of research report in Kong Kong. This report is intended for distribution only to “Professional Investors” as defined in Part I of
Schedule 1 to SFO. Any investment or investment activity to which this document relates is only available to professional investor and will be engaged only with professional investors.” Nothing here is an offer or solicitation
of these securities, products and services in any jurisdiction where their offer or sale is not qualified or exempt from registration. The Indian Analyst(s) who compile this report is/are not located in Hong Kong & are not
conducting Research Analysis in Hong Kong.
For U.S.
Motilal Oswal Securities Limited (MOSL) is not a registered broker - dealer under the U.S. Securities Exchange Act of 1934, as amended (the"1934 act") and under applicable state laws in the United States. In addition MOSL is
not a registered investment adviser under the U.S. Investment Advisers Act of 1940, as amended (the "Advisers Act" and together with the 1934 Act, the "Acts), and under applicable state laws in the United States.
Accordingly, in the absence of specific exemption under the Acts, any brokerage and investment services provided by MOSL, including the products and services described herein are not available to or intended for U.S.
persons.
This report is intended for distribution only to "Major Institutional Investors" as defined by Rule 15a-6(b)(4) of the Exchange Act and interpretations thereof by SEC (henceforth referred to as "major institutional investors").
This document must not be acted on or relied on by persons who are not major institutional investors. Any investment or investment activity to which this document relates is only available to major institutional investors
and will be engaged in only with major institutional investors. In reliance on the exemption from registration provided by Rule 15a-6 of the U.S. Securities Exchange Act of 1934, as amended (the "Exchange Act") and
interpretations thereof by the U.S. Securities and Exchange Commission ("SEC") in order to conduct business with Institutional Investors based in the U.S., MOSL has entered into a chaperoning agreement with a U.S.
registered broker-dealer, Motilal Oswal Securities International Private Limited. ("MOSIPL"). Any business interaction pursuant to this report will have to be executed within the provisions of this chaperoning agreement.
The Research Analysts contributing to the report may not be registered /qualified as research analyst with FINRA. Such research analyst may not be associated persons of the U.S. registered broker-dealer, MOSIPL, and
therefore, may not be subject to NASD rule 2711 and NYSE Rule 472 restrictions on communication with a subject company, public appearances and trading securities held by a research analyst account.
For Singapore
Motilal Oswal Capital Markets Singapore Pte Limited is acting as an exempt financial advisor under section 23(1)(f) of the Financial Advisers Act(FAA) read with regulation 17(1)(d) of the Financial Advisors Regulations and is a
subsidiary of Motilal Oswal Securities Limited in India. This research is distributed in Singapore by Motilal Oswal Capital Markets Singapore Pte Limited and it is only directed in Singapore to accredited investors, as defined in
the Financial Advisers Regulations and the Securities and Futures Act (Chapter 289), as amended from time to time.
In respect of any matter arising from or in connection with the research you could contact the following representatives of Motilal Oswal Capital Markets Singapore Pte Limited:
Varun Kumar
Varun.kumar@motilaloswal.com
Contact : (+65) 68189232
Office Address:21 (Suite 31),16 Collyer Quay,Singapore 04931
OIL & NATURAL GAS CORP
Motilal Oswal Securities Ltd
Motilal Oswal Tower, Level 9, Sayani Road, Prabhadevi, Mumbai 400 025
Phone: +91 22 3982 5500 E-mail: reports@motilaloswal.com
30 June 2017
8