11 July 2017
1QFY18 Results Update | Sector: Financials
IndusInd Bank
Buy
BSE SENSEX
31,747
Bloomberg
Equity Shares (m)
M.Cap.(INRb)/(USDb)
52-Week Range (INR)
1, 6, 12 Rel. Per (%)
Avg Val, INRm
Free float (%)
S&P CNX
9,786
IIB IN
595.8
928 / 14.4
1572 / 1038
1/9/24
1570
85.0
CMP: INR1,560
TP: INR1,800 (+15%)
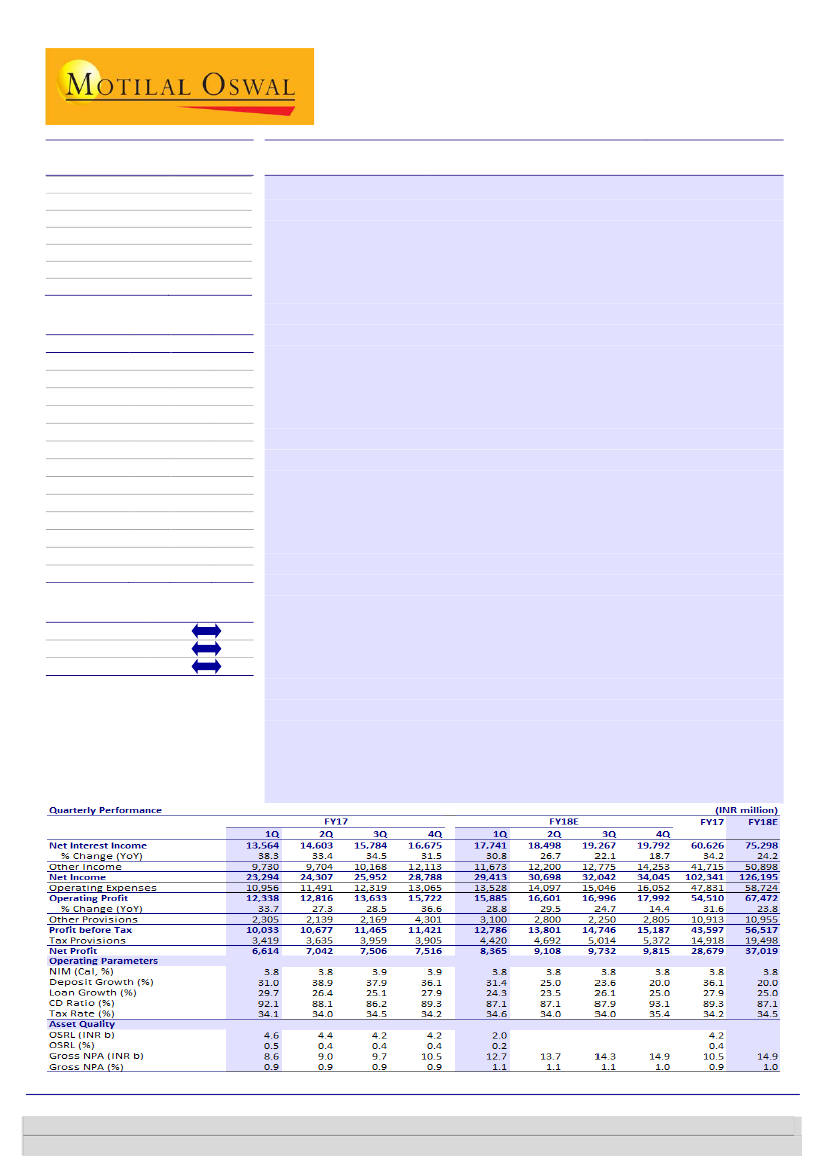
Mixed asset quality; strong operating performance
IndusInd Bank’s (IIB) 1QFY18 PAT grew 31% YoY (in-line) to INR8.4b. Strong
loan growth of 24% YoY (in line with management guidance) and steady NIM at
4% (+3bp YoY; ~10bp higher than expected) drove robust NII performance
(+31% YoY; 5% beat).
Robust NII performance, coupled with strong fee income growth of 25%+,
enabled the bank to deliver impressive core PPoP growth of 29% YoY. Opex
trailed total income growth, with continued moderation in employee expenses
(+18% YoY v/s 17% in 4Q and average of 25%+ in the previous eight quarters).
Both corporate (+26% YoY) and consumer (+22% YoY) loans exhibited healthy
growth. Lower growth in vehicle finance (+17% YoY) was compensated by
strong growth of ~40% YoY in retail non-vehicle loans.
GNPAs increased 21% QoQ to 1.1% of loans (0.9% in FY17), led by high
slippages in both CCB and CFD divisions. Slippages in CFD increased 45% QoQ
(+62% YoY) to INR2.6b. Restructured book declined to 0.17% (-20bp QoQ), led
by relapse of two accounts into NPA. There was a sale to ARC of INR570m
during the quarter.
Other highlights: (1)
Overall CASA ratio improved 90bp QoQ (+330bp YoY) to
~38%, led by robust SA mobilization (+65% YoY).
(2)
IIB has exposure of
~INR500m to three of the 12 accounts referred to NCLT for resolution. The
bank holds substantial provisions here, and incremental provisions are not
expected to exceed ~100-120m (may provide in 2QFY18).
(3)
The bank made
floating provision of ~INR750m during the quarter.
Valuation and view:
IIB’s key focus is to scale up on its retail operations, led by
higher share of non-vehicle retail loans by FY20. The bank is targeting 25-30%
loan growth, driven by continued branch expansion (800+ branch addition) and
strong customer acquisition (2x increase to 20m). Strong core profitability, an
improving CASA profile and healthy return ratios (RoA of 1.9%+ and RoE of 16-
18%) are the key positives. We largely maintain estimates. Maintain
Buy
with a
target price of INR1,800 (3.8x June 2019E BV).
Financials & Valuations (INR b)
Y/E MARCH
2018E 2019E
NII
75.3
94.0
OP
67.5
83.5
NP
37.0
45.9
NIM (%)
4.3
4.4
EPS (INR)
61.9
76.8
EPS Gr. (%)
29.1
24.1
BV/Sh. (INR)
383 446.4
ABV/Sh. (INR)
377 444.5
RoE (%)
17.3
18.5
RoA (%)
1.9
1.9
P/E (X)
25.2
20.3
P/BV (X)
4.1
3.5
P/ABV (X)
4.1
3.5
2020E
114.1
100.4
54.8
4.3
91.7
19.4
522.0
522.4
18.9
1.9
17.0
3.0
3.0
Estimate change
TP change
Rating change
Alpesh Mehta
(Alpesh.Mehta@MotilalOswal.com); +91 22 6129 1526
Subham Banka
(Subham.Banka@MotilalOswal.com); +91 22 6129 1567
Investors are advised to refer through important disclosures made at the last page of the Research Report.
Motilal Oswal research is available on www.motilaloswal.com/Institutional-Equities, Bloomberg, Thomson Reuters, Factset and S&P Capital.

Indusind Bank
Exhibit 1: Quarterly Performance v/s expectation
Y/E March
Net Interest Income
% Change (Y-o-Y)
Other Income
Net Income
Operating Expenses
Operating Profit
% Change (Y-o-Y)
Other Provisions
Profit before Tax
Tax Provisions
Net Profit
% Change (Y-o-Y)
4QFY17E
16962
25
11340
28302
13097
15205
23
2800
12405
4218
8187
24
4QFY17A V/S our Est. Comments
17,741
5
NIMs higher than expectations
31
11,673
3
Largely in line; fee income growth remains robust
29,413
4
13,528
15,885
29
3,100
12,786
4,420
8,365
26
3
4
11
3
5
2
Marginal beat led by a robust NII performance
High slippages along with focus to increase PCR
Largely in line with estimates
Source: Company, MOSL
Impressive NIM
performance on the back of
strong loan growth (+24%)
and CASA mobilization
Strong loan growth and continued CASA traction lead to impressive NIMs
Reported NIM was stable sequentially and increased 3bp YoY to 4.0%. This was
driven by strong loan growth and continued traction in CASA deposits.
CASA deposits grew 8% QoQ and 44% YoY, led by strong mobilization of SA
deposits (+55/17% YoY/QoQ).
Cost of funds increased 13bp sequentially (although declined 35bp YoY) to 5.3%.
Yield on funds increased 13bp QoQ to 9.3%
Yields in the corporate book increased 40bp QoQ as 4QFY17 was impacted by
interest income reversals on the cement account. On the other hand, yields in
the consumer finance book remained largely stable at 14.48%.
Focus of the bank on higher share of retail loans would have a positive impact
on margins. C-D ratio declined 220bp in this quarter to 87%, leaving further
room to expand margins.
CFD slippages up nearly
45% QoQ (annualized
slippage ratio of 2.7%)
GNPAs increased 21% owing to high corporate slippages and rise in
slippages in CFD segment
GNPA in % terms increased to 1.1% of loans v/s 0.9% in FY17. Computed PCR
increased 160bp QoQ to 60%. Resultantly, NNPA% remained largely stable
(0.4%) on a sequential basis.
Slippages in the corporate portfolio moderated v/s 4QFY17, but still remained
high at INR3.5b (2.6% slippage ratio). Slippages in the consumer finance
portfolio spiked up to INR2.6b v/s INR1.8b in 4QFY17 and INR1.6b in 1QFY17.
During the quarter, there was a sale to ARC of INR570m. Outstanding SR book
remained largely stable at INR3.57b.
Segmental GNPAs increased across the CFD division with CV, Utility, LAP and
tractors all showing uptick in GNPAs.
Restructured loans declined 20bp to 0.17%, with two accounts slipping to NPA
during the quarter
11 July 2017
2

Indusind Bank
Exhibit 2: GNPAs in the CFD segment increased to 1.25% v/s 1.12% in 4QFY17 (%)
CV
Utility
CE
3W
2W
Cars
LAP/HL/PL
Cards
1QFY15 2QFY15 3QFY15 4QFY15 1QFY16 2QFY16 3QFY16 4QFY16 1QFY17 2QFY17 3QFY17 4QFY17 1QFY18
1.4
1.4
1.4
1.3
1.2
1.1
1.1
1.0
1.1
1.1
1.0
1.0
1.1
0.8
0.8
1.0
1.1
1.1
1.0
1.0
1.2
1.3
1.2
1.1
1.1
1.4
1.6
1.6
1.6
1.4
1.5
1.6
1.5
1.3
1.4
1.4
1.2
1.2
1.1
0.8
0.8
0.9
0.9
1.0
0.8
0.8
1.0
1.1
1.0
0.8
0.9
1.3
2.5
2.5
2.4
2.5
2.7
2.8
3.0
3.0
3.2
3.6
3.6
3.5
3.6
0.5
0.5
0.5
0.6
0.6
0.4
0.4
0.5
0.5
0.5
0.8
0.7
0.7
0.5
0.5
0.3
0.3
0.5
0.4
0.6
0.7
0.7
0.7
0.8
0.9
1.0
1.5
1.5
1.5
1.2
1.3
1.4
1.5
1.5
1.7
1.7
1.6
1.3
1.2
Source: MOSL, Company
3 party distribution fees
increased on the back of
continued strong flows into
mutual funds
rd
Other highlights
Growth in fee income (+25% YoY) was broad-based with strong growth in third-
party distribution fees (+54% YoY), investment banking fees (+53% YoY) and
forex fees (+31% YoY). Processing fees were muted in this quarter (-19/9%
QoQ/YoY).
Operating expenses growth remained well under control at 23% YoY, trailing
total income growth of 26% YoY. This was led by continued moderation in
employee expenses due to robust digital initiatives taken by the bank.
The bank has been focused on working capital loans to higher-rated corporates.
RWA to total assets moderated to 76% v/s 80% in 4QFY17. RoRWA came in at
2.3% for the quarter, well within reach of management’s 2.4% target laid in its
Vision 2020 agenda.
Exhibit 3: Fees grew 25% YoY, led by strong traction in third-party distribution, investment
banking and forex fees
Trade related
Processing fees
Forex - Clients
Third Party Product
Investment banking
General banking
Fee income
1QFY18
1,310
1,960
1,980
2,100
1,750
640
9,740
4QFY17
1,210
2,430
1,700
2,410
1,590
620
9,960
1QFY17
1,093
2,151
1,510
1,367
1,143
555
7,819
QoQ (%)
8
-19
16
-13
10
3
-2
YoY (%)
20
-9
31
54
53
15
25
Source: MOSL, Company
Exhibit 4: RWA to assets moderated to ~76%
% of Total Assets
Credit Risk
7
3
72
7
3
75
Market Risk
6
4
75
7
4
72
Operational Risk
8
4
71
8
3
72
5
2
64
6
3
63
6
4
66
6
3
67
6
3
67
7
3
67
7
4
70
8
4
68
7
3
71
7
4
69
7
3
69
8
4
68
8
4
64
Source: MOSL, Company
11 July 2017
3

Indusind Bank
1QFY18 conference call highlights
Asset quality related
The bank has exposure of ~INR500m to three of the 12 accounts referred to
NCLT for resolution; provisions already held against Jyoti account. The bank has
made substantial provisions in relation to these three accounts, and no
substantial incremental provisions are to be taken further in these accounts;
may need to provide ~100-120m on these accounts in 2QFY18.
IIB’s exposure in Telecom stands at ~2.1% (down from 3.5% in FY17 owing to
repayment of exposure). The bank has exposure in the top three groups in
telecom—none of its exposures are rated below A. The bank has taken a hit of
~INR80m on account of the RBI’s norm regarding higher provisioning on telecom
sector.
GNPAs in MFI stood at INR310m; the bank has taken ~INR280m provisioning
against it. MFI PAR stood at ~INR500m; will come down to ~INR250m at end of
2QFY18; may have to provide ~INR80-100m more in 2QFY18.
Two accounts slipped from the restructured book into NPA.
Outstanding SR book stood at INR3.57b. During the quarter, the bank sold
INR570m (a CV portfolio and some small accounts), but recovered a similar
amount, and so the net book remained flat.
Credit costs have remained at ~35-40bp in LAP.
Balance sheet related
Overall industry loan growth continues to be moderate at 6%: negative growth
in corporate loans. Strong shift towards bond markets (+20% growth).
GST and BS4 impacted vehicle finance growth – particularly MHCV growth.
Management expects more robust growth in 2HFY18. Management believes
GST is positive for the transport operators and will be beneficial in the long
term.
The bank is gaining 85,000-90,000 new-to-bank customers every month;
average ticket size in SA has increased to ~INR60,000 from INR40,000 a few
quarters ago, signaling deepening relationships.
The bank has witnessed strong growth in working capital loans in the corporate
segment.
LRD business is seeing very competitive pricing, and the bank does not wish to
grow aggressively in this segment.
~40-45% of the overall loan book linked to MCLR rates.
Cost of savings less than 6%. 50% of CA deposits are retail. CA/branch in retail
has moved up to INR70m; will go up to INR80-90m.
Inorganic growth will be considered only if it is RoA/RoE accretive from day 1, or
if it provides a leadership position.
P/L related
The bank has prudently not recognized reversal of provision of INR1.22b from JP
account slipped in FY17: INR700m has been used to create floating provision,
INR330m has been held as standard provisioning, INR100m in SR and balance
~100m provided in MFI portfolio. High provisioning this quarter has enabled PCR
to cross 60% this quarter.
11 July 2017
4

Indusind Bank
Targets to reduce C/I by ~2% over the next three years. Headcount has
remained largely stable, led by digital enablers, due to which the bank is only
seeing moderate employee expense growth. Cost initiatives are being taken to
reduce costs. The bank has brought down branch area to 1,200sqft in metros
compared to 2,000-2,500sqft earlier.
Rating profile of corporate book has improved. Corporate yields were
compressed in 4QFY17 due to interest income reversal on JP account.
Maintain Buy with a TP of
INR1,400 (3.8x June 2019
BV)
Valuation and view
Strong core profitability (3%+ of average assets v/s private banks average of
2.5% and HDFCB of 2.7%), improving CASA ratio (best amongst mid-sized private
banks), healthy return ratios (ROA of 1.9%+ and ROE of 15-17% and
capitalization (CET1 ratio of ~14.7%) are key positives. We expect IIB to report
strong 25%+ loan CAGR driven by multi products, new product addition and
market share gains.
Performance on the first three planning cycle under the leadership of Mr Sobti
has been extremely impressive. Bank communicated its next three-year strategy
in the 4
th
stage Planning Cycle (2017-20) today with a clear focus on strong
growth with profitability and increasing the granularity of balance sheet. IIB is
targeting strong growth (25-30%), higher share of non-vehicle retail loans (25%
by FY20 v/s 18% currently), strengthened liability franchise (CASA ratio of 40%
v/s 38% currently), return on risk weighted assets >2.4%, continued branch
expansion (2,000 by FY20 v/s 1,200 currently) and customer acquisition (2x
increase to 20m+).
Overall, we expect underlying growth in consumer finance division product to
show continued revival with broad-based growth in vehicle finance division and
new product additions. IIB is already witnessing healthy growth in LAP and
credit cards. Corporate loan growth is likely to be opportunistic (based on
spreads available. IIB has levers like less sell-down of loans, selectively doing
project loan, etc.
NIMs are expected to be largely stable to improving, led by higher share of retail
liabilities, expected improvement in loan mix toward high-yielding CFD, benefit
of falling interest rate cycle and higher share of fixed rate loans. Close-to-
customer business model of CV financing helped the bank maintain strong asset
quality performance, despite tough times. In our view, CV cycle has bottomed
out, which would help reduce concerns over asset quality.
Overall superior margins, focused fee income strategy and control over C/I ratio
will keep earnings momentum healthy (~23% CAGR over FY17-20). Capitalization
remains one of the best in the industry at 14.3% CET1 ratio. Maintain
Buy
with a
target price of INR1,800 (3.8x June 2019 BV based on RI model). Key
assumptions in our RI model are a) Cost of equity of 13.1%, b) extended forecast
average growth of 17% for 17 years and c) Terminal growth of 5%.
11 July 2017
5

Indusind Bank
Exhibit 5: We largely maintain our earnings estimates
INR B
Net Interest Income
Other Income
Total Income
Operating Expenses
Operating Profits
Provisions
PBT
Tax
PAT
Margins (%)
Credit Cost (%)
RoA (%)
RoE (%)
Old Estimates
FY18
FY19
FY20
76.3
94.4
114.5
49.5
59.0
70.4
125.8 153.3 184.9
57.4
69.2
83.5
68.4
84.1
101.4
11.2
13.5
16.9
57.3
70.6
84.5
19.5
24.0
28.7
37.8
46.6
55.8
4.33
4.40
4.31
0.75
0.75
0.75
1.9
2.0
1.9
17.3
18.4
18.9
New estimates
FY18
FY19
FY20
75.3
94.0
114.1
50.9
60.4
71.8
126.2 154.3 185.8
58.7
70.8
85.4
67.5
83.5
100.4
11.0
13.9
17.3
56.5
69.6
83.1
19.5
23.7
28.3
37.0
45.9
54.8
4.27
4.37
4.29
0.75
0.75
0.75
1.9
1.9
1.9
17.3
18.5
18.9
Variation (%)
FY18
FY19
FY20
-1.3
-0.4
-0.4
2.8
2.4
2.0
0.3
0.7
0.5
2.3
2.3
2.3
-1.4
-0.7
-0.9
-1.8
2.6
2.6
-1.3
-1.3
-1.6
0.1
-1.3
-1.6
-2.1
-1.3
-1.6
Source: Company, MOSL
Exhibit 6: One-year forward P/B
4.3
3.3
2.3
1.3
0.3
0.6
2.4
PB (x)
Median(x)
Peak(x)
Min(x)
2.5
Avg(x)
3.7
3.7
Exhibit 7: One-year forward P/E
40
30
20
10
0
3.7
16.4
15.8
PE (x)
Median(x)
Peak(x)
Min(x)
Avg(x)
34.4
23.6
Source: MOSL, Company
FY16
3.55
2.2
5.75
2.88
50.1
0.97
1.91
2.87
2.59
0.38
3.25
0.53
0.39
0.13
2.72
0.93
34.1
1.80
9.2
16.6
FY17
3.77
2.2
5.94
2.98
50.1
0.95
2.03
2.97
2.59
0.42
3.39
0.68
0.44
0.24
2.71
0.93
34.2
1.78
8.7
15.4
FY18E
3.86
2.2
6.04
3.01
49.8
0.92
2.09
3.03
2.61
0.43
3.46
0.56
0.49
0.07
2.90
1.00
34.5
1.90
9.1
17.3
FY19E
3.98
2.19
6.17
3.00
48.7
0.93
2.07
3.17
2.56
0.37
3.54
0.59
0.51
0.08
2.95
1.00
34.0
1.95
9.5
18.5
FY20E
3.92
2.14
6.06
2.93
48.40
0.92
2.02
3.13
2.46
0.32
3.45
0.59
0.51
0.08
2.85
0.97
34.00
1.88
10.05
18.94
Exhibit 8: DuPont Analysis: Improved profitability to continue to drive RoE higher
Y/E March
Net Interest Income
Core Fee Income
Core Income
Operating Expenses
Cost to Core Income
Employee cost
Others
Core operating Profits
Non Interest income
Trading and others
Operating Profits
Provisions
NPA
Others
PBT
Tax
Tax Rate
RoA
Leverage (x)
RoE
FY13
3.41
1.9
5.31
2.68
50.6
1.01
1.67
2.62
2.08
0.19
2.81
0.40
0.34
0.07
2.41
0.79
32.7
1.62
11.0
17.8
FY14
3.61
2.0
5.61
2.73
48.6
1.01
1.72
2.89
2.36
0.35
3.24
0.58
0.39
0.19
2.65
0.90
33.8
1.76
10.0
17.5
FY15
3.44
2.2
5.68
2.89
50.8
0.99
1.90
2.80
2.56
0.32
3.12
0.39
0.34
0.05
2.73
0.92
33.8
1.80
10.5
19.0
Source: MOSL, Company
11 July 2017
6

Indusind Bank
Exhibit 9: DuPont Analysis: RoA remained healthy at ~1.8%+
NII
Fee income
Core Income
Operating costs
- Emp Costs
- Other Expenses
Cost to Core Income
Ratio
Core Operating Profit
Trading and others
Operating Profit
Provisions
Tax
ROAA
Leverage (x)
ROAE
1QFY15 2QFY15 3QFY15 4QFY15 1QFY16 2QFY16 3QFY16 4QFY16 1QFY17 2QFY17 3QFY17 4QFY17 1QFY18
3.61
3.65
3.58
3.54
3.51
3.68
3.69
3.74
3.80
3.85
3.89
3.86
3.84
2.19
2.39
2.33
2.33
2.28
2.27
2.28
2.29
2.19
2.18
2.18
2.30
2.11
5.81
6.04
5.92
5.87
5.79
5.95
5.98
6.03
5.99
6.02
6.06
6.16
5.95
2.96
3.08
3.06
2.96
2.93
2.93
2.99
3.04
3.07
3.03
3.03
3.02
2.93
0.99
1.05
1.06
1.02
0.97
1.01
1.03
0.99
1.00
0.99
0.97
0.91
0.91
1.97
2.03
2.00
1.94
1.96
1.92
1.97
2.05
2.07
2.04
2.06
2.11
2.02
51.1
2.84
0.54
3.38
0.50
0.98
1.90
9.6
18.2
51.0
2.96
0.21
3.17
0.32
0.97
1.88
9.4
17.7
51.8
2.85
0.37
3.22
0.41
0.95
1.86
9.5
17.6
50.4
2.91
0.34
3.25
0.41
0.95
1.89
9.9
18.8
50.7
2.85
0.45
3.30
0.44
0.98
1.88
10.2
19.3
49.3
3.02
0.37
3.39
0.53
0.97
1.88
8.5
16.0
50.1
2.98
0.36
3.34
0.56
0.95
1.83
7.4
13.6
50.4
2.99
0.41
3.40
0.63
0.94
1.83
7.7
14.2
51.2
2.92
0.53
3.45
0.65
0.96
1.85
7.9
14.7
50.3
3.00
0.38
3.38
0.56
0.96
1.86
8.1
15.0
50.0
3.03
0.32
3.36
0.53
0.97
1.85
8.3
15.4
49.1
3.14
0.50
3.64
1.00
0.90
1.74
8.5
14.8
49.2
3.02
0.42
3.44
0.67
0.96
1.81
8.8
15.9
Source: MOSL, Company
11 July 2017
7

Indusind Bank
Story in charts
Exhibit 10: NIMs stable QoQ at 4% (+3bp YoY)
3.9
3.9
4.0
4.0 4.0 4.0 4.0
Exhibit 11: Fee income to average assets remains strong
Fee Inc to avg. assets
3.9
3.8
3.7
3.7
3.6
3.7 3.7 3.7
Source: MOSL, Company
Exhibit 12: Deposit growth remains strong, led by CASA
Deposits (INR b)
YoY Gr (%)
31
39 38 36
31
Exhibit 13: SA deposits grew by 65% YoY
CASA Ratio
YoY CASA Gr (%)
24 23
15
10 12
23
25
22 22 25
Source: MOSL, Company
Exhibit 14: Loan growth strong at ~24% (%)
Loans (INR b)
31
24 24 24 22
22
25
23
YoY Gr (%)
29
29
30
26
25
28
24
Exhibit 15: Share of CCB remains largely stable QoQ
CFD (% of loans)
CCB (% of loans)
53 55 57 57 58 59 58 59 58 59 59 59 58 60 60
47 45 43 43 42 41 42 41 42 41 41 41 42 40 40
Source: MOSL, Company
11 July 2017
8

Indusind Bank
Exhibit 16: Slippage ratio rises in CFD (%)
5.0
4.0
3.0
2.0
1.0
0.0
Overall
CFD
C&IB
Exhibit 17: PCR ratio improves 160bp QoQ to 60%
GNPA (%)
NNPA (%)
PCR (%)
Source: MOSL, Company
Exhibit 18: Two accounts slipped from restructured book (%)
Exhibit 19: Credit costs elevated led by high slippages and
focus on increasing PCR
Credit Cost (annualized in bp)
68
53
41
52
70 70
95
75
63 63 60
51 54
60
64
Source: MOSL, Company
Exhibit 20: Strong tier-1 capital ratio (%)
Exhibit 21: The bank added 10 branches during the quarter
(%)
Source: MOSL, Company
11 July 2017
9

Indusind Bank
Exhibit 22: Quarterly Snapshot (INR b)
FY16
1Q
Profit and Loss
Net Interest Income
Other Income
Trading profits
Others (Ex non core)
Total Income
Operating Expenses
Employee
Others
Operating Profits
Provisions
PBT
Taxes
PAT
Asset Quality
GNPA
NNPA
GNPA (%)
NNPA (%)
PCR (Calculated, %)
Ratios (%)
Fees to Total Income
Cost to Core Income
Tax Rate
CASA (Reported)
Loan/Deposit
CAR
Tier I
RoA
RoE
Margins (%) - Calculated
Yield on loans
Yield On Investments
Yield on funds
Cost of funds
Spreads
Margins
Margins (%) - Reported
Yield on loans
Cost of deposits
Margins
Balance Sheet (INR b)
Loans
Investments
Deposits
CASA Deposits
of which Savings
Current
Borrowings
Total Assets
Risk Weighted Assets
9,807
7,616
1,254
6,362
17,423
8,196
2,723
5,473
9,227
1,233
7,994
2,744
5,250
5,701
2,248
0.8
0.3
60.6
36.5
50.7
34.3
34.7
93.0
12.4
11.6
1.9
20.4
11.9
7.1
11.2
7.2
4.0
3.9
12.7
7.6
3.7
722
236
777
269
140
129
214
1,144
906
2Q
10,943
7,835
1,102
6,733
18,778
8,713
3,007
5,706
10,065
1,581
8,484
2,884
5,600
6,021
2,408
0.8
0.3
60.0
35.9
49.3
34.0
34.7
96.8
16.5
15.7
1.9
16.7
11.8
7.1
10.7
6.8
3.9
4.1
12.4
7.4
3.9
783
268
808
281
150
130
211
1,233
1,016
3Q
11,734
8,390
1,131
7,259
20,124
9,514
3,267
6,247
10,610
1,771
8,839
3,029
5,810
6,811
2,733
0.8
0.3
59.9
36.1
50.1
34.3
35.0
95.1
16.4
15.6
1.9
14.1
11.8
6.3
10.5
6.7
3.8
4.1
12.1
7.2
3.9
822
277
864
302
161
141
205
1,309
1,064
4Q
12,682
9,128
1,386
7,742
21,810
10,298
3,364
6,934
11,512
2,137
9,375
3,172
6,204
7,768
3,218
0.9
0.4
58.6
35.5
50.4
33.8
35.2
95.1
15.5
14.9
1.9
14.6
12.0
6.6
10.5
6.7
3.8
4.2
12.0
7.1
3.9
884
312
930
327
172
155
222
1,401
1,163
1Q
13,564
9,730
1,911
7,819
23,294
10,956
3,569
7,387
12,338
2,305
10,033
3,419
6,614
8,606
3,555
0.9
0.4
58.7
33.6
51.2
34.1
34.4
92.1
15.4
14.8
1.9
15.1
11.8
7.0
10.5
6.6
3.8
4.3
12.1
6.9
4.0
937
287
1,018
350
191
160
172
1,458
1,216
2Q
14,603
9,704
1,449
8,256
24,307
11,491
3,758
7,733
12,816
2,139
10,677
3,635
7,042
8,990
3,692
0.9
0.4
58.9
34.0
50.3
34.0
36.5
88.1
15.3
14.7
1.9
15.4
11.7
7.1
10.4
6.5
3.9
4.3
11.9
6.6
4.0
989
365
1,123
410
206
205
191
1,578
1,274
FY17
3Q
15,784
10,168
1,320
8,848
25,952
12,319
3,940
8,378
13,633
2,169
11,465
3,959
7,506
9,716
4,007
0.9
0.4
58.8
34.1
50.0
34.5
37.0
86.2
15.3
14.7
1.9
15.7
11.9
6.9
10.4
6.3
4.1
4.3
11.7
6.4
4.0
1,028
353
1,192
442
252
190
203
1,671
1,318
4Q
16,675
12,113
2,150
9,963
28,788
13,065
3,943
9,122
15,722
4,301
11,421
3,905
7,516
10,549
4,389
0.9
0.4
58.4
34.6
49.0
34.2
36.9
89.3
1,531.0
1,472.0
1.7
15.1
11.1
7.2
10.2
6.0
4.2
4.3
11.4
6.1
4.0
1,131
367
1,266
466
270
196
225
1,786
1,435
FY18
1Q
17,741
11,673
1,930
9,743
29,413
13,528
4,222
9,306
15,885
3,100
12,786
4,420
8,365
12,717
5,083
1.1
0.4
60.0
33.1
49.2
34.6
37.8
87.1
16.2
15.7
0.0
0.0
11.4
7.4
10.3
6.1
4.2
4.3
11.5
6.2
4.0
1,164
421
1,337
505
316
189
274
1,907
1,452
32
21
7
10
-3
-2
12
7
0
3
15
6
8
17
-3
22
7
1
-38
34
-20
-52
32
-1
-54
-78
3
24
47
31
44
65
19
60
31
19
Variation (%)
QoQ
YoY
6
-4
-10
-2
2
4
7
2
1
-28
12
13
11
21
16
16
5
164
31
20
1
25
26
23
18
26
29
34
27
29
26
48
43
18
6
134
Source: MOSL, Company
11 July 2017
10

Indusind Bank
Financials and Valuations
Income Statement
Y/E March
Net Interest Income
Change (%)
Non Interest Income
Net Income
Change (%)
Operating Expenses
Pre Provision Profits
Change (%)
Provisions (excl tax)
PBT
Tax
Tax Rate (%)
PAT
Change (%)
Equity Dividend (Incl tax)
Core PPP*
Change (%)
*Core PPP is (NII+Fee income-Opex)
Balance Sheet
Y/E March
Equity Share Capital
Reserves & Surplus
Net Worth
Deposits
Change (%)
of which CASA Dep
Change (%)
Borrowings
Other Liabilities & Prov.
Total Liabilities
Current Assets
Investments
Change (%)
Loans
Change (%)
Fixed Assets
Other Assets
Total Assets
Asset Quality
GNPA (INR m)
NNPA (INR m)
GNPA Ratio
NNPA Ratio
PCR (Excl Tech. write off)
E: MOSL Estimates
2013
5,229
71,074
76,303
541,167
27.7
158,674
37.2
94,596
21,000
733,065
68,487
196,542
34.9
443,206
26.4
7,561
17,269
733,065
2014
5,256
85,173
90,430
605,023
11.8
196,909
24.1
147,620
27,187
870,259
67,694
215,630
9.7
551,018
24.3
10,164
25,753
870,259
2015
5,295
101,151
106,445
741,344
22.5
252,996
28.5
206,181
63,904
1,117,874
107,791
228,783
6.1
687,882
24.8
11,576
81,841
1,117,874
2016
5,950
171,010
176,960
930,003
25.4
327,243
29.3
249,959
72,048
1,428,970
101,119
340,543
48.8
884,193
28.5
12,553
90,561
1,428,970
2017
5,981
196,280
202,261
1,265,722
36.1
466,458
42.5
224,537
93,964
1,786,484
186,283
367,021
7.8
1,130,805
27.9
13,352
89,023
1,786,484
2018E
5,981
226,768
232,749
1,518,867
20.0
596,592
27.9
250,404
112,567
2,114,587
139,917
440,426
20.0
1,413,506
25.0
13,911
106,827
2,114,587
1837%
14,878
5,658
1.0
0.4
62.0
2013
22,329
31.0
13,630
35,958
32.4
17,564
18,395
34.0
2,631
15,764
5,152
32.7
10,612
32.2
1,838
17,325
36.6
2014
28,907
29.5
18,905
47,812
33.0
21,853
25,960
41.1
4,676
21,283
7,203
33.8
14,080
32.7
2,154
23,327
34.6
2015
34,203
18.3
25,480
59,683
24.8
28,701
30,982
19.3
3,891
27,092
9,155
33.8
17,937
27.4
2,552
28,232
21.0
2016
45,166
32.1
32,969
78,135
30.9
36,721
41,414
33.7
6,722
34,693
11,828
34.1
22,864
27.5
3,522
36,541
29.4
2017
60,626
34.2
41,715
102,341
31.0
47,831
54,510
31.6
10,913
43,597
14,918
34.2
28,679
25.4
4,176
47,681
30.5
2018E
75,298
24.2
50,898
126,195
23.3
58,724
67,472
23.8
10,955
56,517
19,498
34.5
37,019
29.1
6,469
59,143
24.0
(INR Million)
2019E
2020E
93,960
114,066
24.8
21.4
60,381
71,779
154,341
185,845
22.3
20.4
70,827
85,431
83,514
100,414
23.8
20.2
13,893
17,317
69,620
83,098
23,671
28,253
34.0
34.0
45,949
54,844
24.1
19.4
8,030
9,584
74,685
91,085
26.3
22.0
(INR Million)
2019E
5,981
264,626
270,607
1,944,149
28.0
772,776
29.5
252,162
134,962
2,601,880
163,790
528,511
20.0
1,766,883
25.0
14,504
128,193
2,601,880
2304%
14,780
1,734
0.8
0.1
88.3
2020E
5,981
309,824
315,806
2,469,070
27.0
990,845
28.2
275,378
161,923
3,222,177
210,432
634,213
20.0
2,208,604
25.0
15,097
153,831
3,222,177
2384%
(%)
17,520
-307
0.8
0.0
101.8
4,578
1,368
1.0
0.3
70.1
6,208
1,841
1.1
0.3
70.4
5,629
2,105
0.8
0.3
62.6
7,768
3,218
0.9
0.4
58.6
10,549
4,389
0.9
0.4
58.4
11 July 2017
11

Indusind Bank
Financials and Valuations
Ratios
Y/E March
Spreads Analysis (%)
Avg. Yield-Earning Assets
Avg. Yield on loans
Avg. Yield on Investments
Avg. Cost-Int. Bear. Liab.
Avg. Cost of Deposits
Interest Spread
Net Interest Margin
Profitability Ratios (%)
RoE
RoA
Int. Expense/Int.Income
Fee Income/Net Income
Non Int. Inc./Net Income
Efficiency Ratios (%)
Cost/Income*
Empl. Cost/Op. Exps.
Busi. per Empl. (INR m)
NP per Empl. (INR lac)
* ex treasury and RWO
Asset-Liability Profile (%)
Loans/Deposit Ratio
CASA Ratio
Investment/Deposit Ratio
G-Sec/Investment Ratio
CAR
Tier 1
Valuations
Book Value (INR)
Change (%)
Price-BV (x)
Adjusted BV (INR)
Price-ABV (x)
EPS (INR)
Change (%)
Price-Earnings (x)
Dividend Per Share (INR)
Dividend Yield (%)
E: MOSL Estimates
2013
11.7
14.1
7.5
8.3
8.3
3.4
3.7
2014
11.3
13.3
7.2
7.7
7.6
3.5
3.9
2015
10.9
12.5
7.1
7.4
7.7
3.5
3.9
2016
10.5
11.8
7.3
6.9
6.8
3.6
4.0
2017
10.0
11.4
7.0
6.2
6.3
3.7
4.2
2018E
9.9
11.0
7.6
6.1
6.0
3.8
4.3
2019E
9.7
10.7
6.4
5.7
5.4
3.9
4.4
2020E
9.6
10.7
6.3
5.8
5.5
3.9
4.3
17.8
1.6
68.0
34.5
37.9
17.5
1.8
65.0
33.7
39.5
19.0
1.8
64.7
37.4
42.7
16.6
1.8
62.0
36.0
42.2
15.4
1.8
57.9
34.1
40.8
17.3
1.9
57.1
33.7
40.3
18.5
1.9
54.7
33.4
39.1
18.9
1.9
55.5
33.6
38.6
50.6
37.7
84.3
1.0
48.6
37.0
79.0
1.0
50.8
34.2
74.5
1.0
50.1
33.7
76.9
1.1
50.1
31.8
86.6
1.2
49.8
30.6
96.9
1.3
48.7
30.9
102.8
1.4
48.4
31.3
112.1
1.5
81.9
29.3
36.3
71.8
15.4
13.8
91.1
32.5
35.6
71.3
13.8
12.7
92.8
34.1
30.9
78.3
12.1
11.2
95.1
35.2
36.6
82.5
15.5
14.9
89.3
36.9
29.0
85.7
15.3
14.7
93.1
39.3
29.0
82.2
14.9
13.9
90.9
39.7
27.2
84.1
13.9
13.0
89.5
40.1
25.7
85.1
12.9
12.2
141.9
46.7
11.0
140.2
11.1
20.3
18.3
76.9
3.0
0.2
164.5
15.9
9.5
162.2
9.6
26.8
32.0
58.2
3.5
0.2
193.7
17.7
8.1
191.1
8.2
33.9
26.5
46.0
4.0
0.3
291.0
50.3
5.4
287.5
5.4
38.4
13.4
40.6
4.5
0.3
331.9
14.0
4.7
327.1
4.8
47.9
24.8
32.5
6.0
0.4
383.0
15.4
4.1
376.8
4.1
61.9
29.1
25.2
9.3
0.6
446.4
16.6
3.5
444.5
3.5
76.8
24.1
20.3
11.5
0.7
522.0
17.0
3.0
522.4
3.0
91.7
19.4
17.0
13.8
0.9
11 July 2017
12

Indusind Bank
Corporate profile
Company description
IndusInd Bank (IIB) is one of the ten new private
sector banks which were awarded license in 1994.
The bank has pan-India presence with 1,004
branches and 1,885 ATMs as on June 20, 2016. It also
has one representative office each in Dubai and
London. Current management team, led by
Managing Director Mr Romesh Sobti, took charge in
February 2008 and has since been effecting
structural and operational changes to improve
productivity and efficiency, leading to strong
improvement in core operating performance.
Exhibit 2: Shareholding pattern (%)
Promoter
DII
FII
Others
Mar-17
15.0
12.3
54.2
18.6
Dec-16
15.0
12.5
54.0
18.6
Mar-16
14.9
11.4
54.2
19.5
Exhibit 1: Sensex rebased
Source: MOSL/Bloomberg
Exhibit 3: Top holders
Holder Name
Bridge India Fund
Afrin Dia
Icici Prudential Life Insurance Company
Limited
Tybourne Equity Master Fund
Franklin Templeton Investment Funds
% Holding
3.5
1.5
1.3
1.2
1.1
Source: Capitaline
Note: FII Includes depository receipts
Source: Capitaline
Exhibit 4: Top management
Name
R Seshasayee
Romesh Sobti
Haresh Gajwani
Designation
Part Time Chairman
Managing Director & CEO
Company Secretary
Exhibit 5: Directors
Name
R Seshasayee
Romesh Sobti
Vijay Vaid*
Ashok Kini*
Name
Kanchan Chitale*
Yashodhan M Kale
Ranbir Singh Butola
T Anantha Narayanan
Source: Capitaline
*Independent
Exhibit 6: Auditors
Name
Bhandari & Associates
BSR & Co LLP
BSR & Co LLP
Type
Secretarial Audit
Independent
Statutory
Exhibit 7: MOSL forecast v/s consensus
EPS
(INR)
FY18
FY19
MOSL
forecast
61.9
76.8
Consensus
forecast
60.8
75.6
Variation
(%)
1.8
1.6
Source: Bloomberg
Source: Capitaline
11 July 2017
13

Disclosures
This document has been prepared by Motilal Oswal Securities Limited (hereinafter referred to as Most) to provide information about the company (ies) and/sector(s), if any, covered in the report and may be distributed
Bank
Indusind
by it and/or
its affiliated company(ies). This report is for personal information of the selected recipient/s and does not construe to be any investment, legal or taxation advice to you. This research report does not constitute an offer, invitation or
inducement to invest in securities or other investments and Motilal Oswal Securities Limited (hereinafter referred as MOSt) is not soliciting any action based upon it. This report is not for public distribution and has been furnished to
you solely for your general information and should not be reproduced or redistributed to any other person in any form. This report does not constitute a personal recommendation or take into account the particular investment
objectives, financial situations, or needs of individual clients. Before acting on any advice or recommendation in this material, investors should consider whether it is suitable for their particular circumstances and, if necessary, seek
professional advice. The price and value of the investments referred to in this material and the income from them may go down as well as up, and investors may realize losses on any investments. Past performance is not a guide
for future performance, future returns are not guaranteed and a loss of original capital may occur.
MOSt and its affiliates are a full-service, integrated investment banking, investment management, brokerage and financing group. We and our affiliates have investment banking and other business relationships with a some
companies covered by our Research Department. Our research professionals may provide input into our investment banking and other business selection processes. Investors should assume that MOSt and/or its affiliates are
seeking or will seek investment banking or other business from the company or companies that are the subject of this material and that the research professionals who were involved in preparing this material may educate
investors on investments in such business . The research professionals responsible for the preparation of this document may interact with trading desk personnel, sales personnel and other parties for the purpose of gathering,
applying and interpreting information. Our research professionals are paid on twin parameters of performance & profitability of MOSt.
MOSt generally prohibits its analysts, persons reporting to analysts, and members of their households from maintaining a financial interest in the securities or derivatives of any companies that the analysts cover. Additionally,
MOSt generally prohibits its analysts and persons reporting to analysts from serving as an officer, director, or advisory board member of any companies that the analysts cover. Our salespeople, traders, and other professionals or
affiliates may provide oral or written market commentary or trading strategies to our clients that reflect opinions that are contrary to the opinions expressed herein, and our proprietary trading and investing businesses may make
investment decisions that are inconsistent with the recommendations expressed herein. In reviewing these materials, you should be aware that any or all of the foregoing among other things, may give rise to real or potential
conflicts of interest. MOSt and its affiliated company(ies), their directors and employees and their relatives may; (a) from time to time, have a long or short position in, act as principal in, and buy or sell the securities or derivatives
thereof of companies mentioned herein. (b) be engaged in any other transaction involving such securities and earn brokerage or other compensation or act as a market maker in the financial instruments of the company(ies)
discussed herein or act as an advisor or lender/borrower to such company(ies) or may have any other potential conflict of interests with respect to any recommendation and other related information and opinions.; however the
same shall have no bearing whatsoever on the specific recommendations made by the analyst(s), as the recommendations made by the analyst(s) are completely independent of the views of the affiliates of MOSt even though
there might exist an inherent conflict of interest in some of the stocks mentioned in the research report
Reports based on technical and derivative analysis center on studying charts company's price movement, outstanding positions and trading volume, as opposed to focusing on a company's fundamentals and, as such, may not
match with a report on a company's fundamental analysis. In addition MOST has different business segments / Divisions with independent research separated by Chinese walls catering to different set of customers having various
objectives, risk profiles, investment horizon, etc, and therefore may at times have different contrary views on stocks sectors and markets.
Unauthorized disclosure, use, dissemination or copying (either whole or partial) of this information, is prohibited. The person accessing this information specifically agrees to exempt MOSt or any of its affiliates or employees from,
any and all responsibility/liability arising from such misuse and agrees not to hold MOSt or any of its affiliates or employees responsible for any such misuse and further agrees to hold MOSt or any of its affiliates or employees free
and harmless from all losses, costs, damages, expenses that may be suffered by the person accessing this information due to any errors and delays. The information contained herein is based on publicly available data or other
sources believed to be reliable. Any statements contained in this report attributed to a third party represent MOSt’s interpretation of the data, information and/or opinions provided by that third party either publicly or through a
subscription service, and such use and interpretation have not been reviewed by the third party. This Report is not intended to be a complete statement or summary of the securities, markets or developments referred to in the
document. While we would endeavor to update the information herein on reasonable basis, MOSt and/or its affiliates are under no obligation to update the information. Also there may be regulatory, compliance, or other reasons
that may prevent MOSt and/or its affiliates from doing so. MOSt or any of its affiliates or employees shall not be in any way responsible and liable for any loss or damage that may arise to any person from any inadvertent error in
the information contained in this report. MOSt or any of its affiliates or employees do not provide, at any time, any express or implied warranty of any kind, regarding any matter pertaining to this report, including without limitation
the implied warranties of merchantability, fitness for a particular purpose, and non-infringement. The recipients of this report should rely on their own investigations.
This report is intended for distribution to institutional investors. Recipients who are not institutional investors should seek advice of their independent financial advisor prior to taking any investment decision based on this report or
for any necessary explanation of its contents.
Most and it’s associates may have managed or co-managed public offering of securities, may have received compensation for investment banking or merchant banking or brokerage services, may have received any compensation
for products or services other than investment banking or merchant banking or brokerage services from the subject company in the past 12 months.
Most and it’s associates have not received any compensation or other benefits from the subject company or third party in connection with the research report.
Subject Company may have been a client of Most or its associates during twelve months preceding the date of distribution of the research report
MOSt and/or its affiliates and/or employees may have interests/positions, financial or otherwise of over 1 % at the end of the month immediately preceding the date of publication of the research in the securities mentioned in this
report. To enhance transparency, MOSt has incorporated a Disclosure of Interest Statement in this document. This should, however, not be treated as endorsement of the views expressed in the report.
Motilal Oswal Securities Limited is registered as a Research Analyst under SEBI (Research Analyst) Regulations, 2014. SEBI Reg. No. INH000000412
Pending Regulatory inspections against Motilal Oswal Securities Limited:
SEBI pursuant to a complaint from client Shri C.R. Mohanraj alleging unauthorized trading, issued a letter dated 29th April 2014 to MOSL notifying appointment of an Adjudicating Officer as per SEBI regulations to hold inquiry and
adjudge violation of SEBI Regulations; MOSL replied to the Show Cause Notice whereby SEBI granted us an opportunity of Inspection of Documents. Since all the documents requested by us were not covered we have requested
to SEBI vide our letter dated June 23, 2015 to provide pending list of documents for inspection.
List of associate companies of Motilal Oswal Securities Limited -
Click here to access detailed report
Analyst Certification
The views expressed in this research report accurately reflect the personal views of the analyst(s) about the subject securities or issues, and no part of the compensation of the research analyst(s) was, is, or will be directly or
indirectly related to the specific recommendations and views expressed by research analyst(s) in this report. The research analysts, strategists, or research associates principally responsible for preparation of MOSt research
receive compensation based upon various factors, including quality of research, investor client feedback, stock picking, competitive factors and firm revenues
Disclosure of Interest Statement
Analyst ownership of the stock
Served as an officer, director or employee -
INDUSIND BANK
No
No
A graph of daily closing prices of securities is available at www.nseindia.com and http://economictimes.indiatimes.com/markets/stocks/stock-quotes
Regional Disclosures (outside India)
This report is not directed or intended for distribution to or use by any person or entity resident in a state, country or any jurisdiction, where such distribution, publication, availability or use would be contrary to law, regulation or
which would subject MOSt & its group companies to registration or licensing requirements within such jurisdictions.
For Hong Kong:
This report is distributed in Hong Kong by Motilal Oswal capital Markets (Hong Kong) Private Limited, a licensed corporation (CE AYY-301) licensed and regulated by the Hong Kong Securities and Futures
Commission (SFC) pursuant to the Securities and Futures Ordinance (Chapter 571 of the Laws of Hong Kong) “SFO”. As per SEBI (Research Analyst Regulations) 2014 Motilal Oswal Securities (SEBI Reg No. INH000000412)
has an agreement with Motilal Oswal capital Markets (Hong Kong) Private Limited for distribution of research report in Kong Kong. This report is intended for distribution only to “Professional Investors” as defined in Part I of
Schedule 1 to SFO. Any investment or investment activity to which this document relates is only available to professional investor and will be engaged only with professional investors.” Nothing here is an offer or solicitation of
these securities, products and services in any jurisdiction where their offer or sale is not qualified or exempt from registration. The Indian Analyst(s) who compile this report is/are not located in Hong Kong & are not conducting
Research Analysis in Hong Kong.
For U.S.
Motilal Oswal Securities Limited (MOSL) is not a registered broker - dealer under the U.S. Securities Exchange Act of 1934, as amended (the"1934 act") and under applicable state laws in the United States. In addition MOSL is
not a registered investment adviser under the U.S. Investment Advisers Act of 1940, as amended (the "Advisers Act" and together with the 1934 Act, the "Acts), and under applicable state laws in the United States. Accordingly, in
the absence of specific exemption under the Acts, any brokerage and investment services provided by MOSL, including the products and services described herein are not available to or intended for U.S. persons.
This report is intended for distribution only to "Major Institutional Investors" as defined by Rule 15a-6(b)(4) of the Exchange Act and interpretations thereof by SEC (henceforth referred to as "major institutional investors"). This
document must not be acted on or relied on by persons who are not major institutional investors. Any investment or investment activity to which this document relates is only available to major institutional investors and will be
engaged in only with major institutional investors. In reliance on the exemption from registration provided by Rule 15a-6 of the U.S. Securities Exchange Act of 1934, as amended (the "Exchange Act") and interpretations thereof by
the U.S. Securities and Exchange Commission ("SEC") in order to conduct business with Institutional Investors based in the U.S., MOSL has entered into a chaperoning agreement with a U.S. registered broker-dealer, Motilal
Oswal Securities International Private Limited. ("MOSIPL"). Any business interaction pursuant to this report will have to be executed within the provisions of this chaperoning agreement.
The Research Analysts contributing to the report may not be registered /qualified as research analyst with FINRA. Such research analyst may not be associated persons of the U.S. registered broker-dealer, MOSIPL, and
therefore, may not be subject to NASD rule 2711 and NYSE Rule 472 restrictions on communication with a subject company, public appearances and trading securities held by a research analyst account.
For Singapore
Motilal Oswal Capital Markets Singapore Pte Limited is acting as an exempt financial advisor under section 23(1)(f) of the Financial Advisers Act(FAA) read with regulation 17(1)(d) of the Financial Advisors Regulations and is a
subsidiary of Motilal Oswal Securities Limited in India. This research is distributed in Singapore by Motilal Oswal Capital Markets Singapore Pte Limited and it is only directed in Singapore to accredited investors, as defined in the
Financial Advisers Regulations and the Securities and Futures Act (Chapter 289), as amended from time to time.
In respect of any matter arising from or in connection with the research you could contact the following representatives of Motilal Oswal Capital Markets Singapore Pte Limited:
Varun Kumar
Varun.kumar@motilaloswal.com
Contact : (+65) 68189232
Office Address:21 (Suite 31),16 Collyer Quay,Singapore 04931
11 July 2017
Motilal Oswal Tower, Level 9, Sayani Road, Prabhadevi, Mumbai 400 025
Phone: +91 22 3982 5500 E-mail: reports@motilaloswal.com
Motilal Oswal Securities Ltd
14