South Indian Bank
BSE SENSEX
31,805
S&P CNX
9,816
12 July 2017
1QFY18 Results Update | Sector: Financials
CMP: INR28
n
TP: INR34 (+21%)
Buy
Motilal Oswal values your support in
the Asiamoney Brokers Poll 2017 for
India Research, Sales and Trading
team. We
request your ballot.
PPoP growth marred by provisions; balance sheet clean-up accelerates
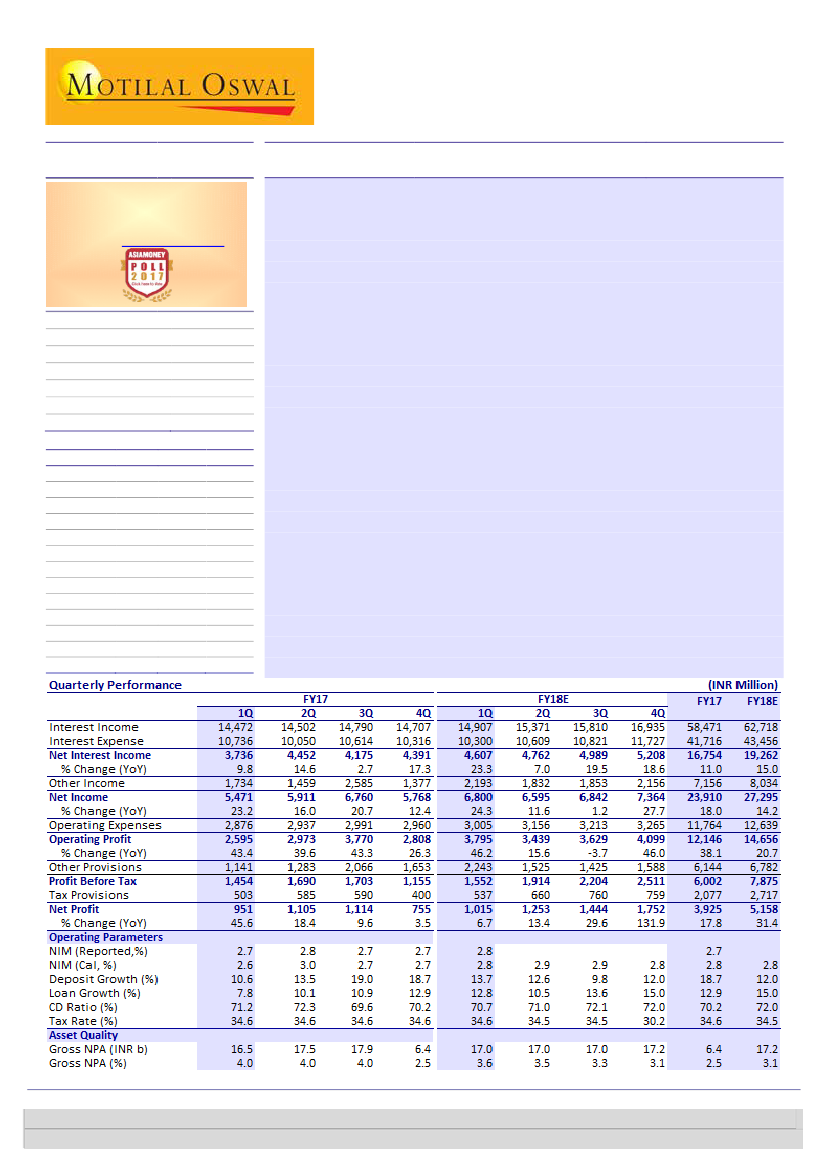
South Indian Bank (SIB) reported PAT growth of 34%/7% QoQ/YoY. PPoP
growth stood at 35%/46% QoQ/YoY, led by high trading gains (~44% of total
other income – second highest in 13 quarters, barring 3QFY17). However,
provisions soared 36%/97% QoQ/YoY, restricting YoY PAT growth.
NII grew 5%/23% QoQ/YoY on the back of advances growth of 0%/13%
QoQ/YoY and NIM expansion of 6bp QoQ/YoY to 2.8%. Opex growth was
controlled at 2%/4% QoQ/YoY. CI ratio declined to 44.2%. The bank has guided
to CI ratio of 47%-48% for FY18.
Loan growth of 0%/13% QoQ/YoY was led by robust growth in retail (+4%/20%
QoQ/YoY) and SME/agri (+1%/+11% QoQ/YoY) loans, while corporate book
grew -2%/10% QoQ/YoY, as per the bank's retail-focused strategy.
Asset quality deteriorated as the bank's absolute GNPA/NNPA soared 48%/75%
QoQ to INR17b/INR11.8b (3.61%/2.54%, +116bp/+109bp QoQ). However, the
bank recognized its entire watch-list (INR6.1b at end-4QFY17) as NPA, leading
to a clean balance sheet with no watch-list. Total net stressed assets of the
bank stood at 3.06% (v/s 3.43% in 4QFY17).
Valuation and view:
Management is focused on building a low-ticket loan book
with steady balance sheet clean-up, which will help improve asset quality
substantially. In view of continued reduction in net stressed assets,
comfortable capital position and improved profitability, we maintain our
Buy
rating with a TP of INR34.3 (1.1x June 2019E BV, slight increase over earlier
multiple of 1.0x Mar 2019E BV in view of significantly improved visibility of
asset quality/profitability).
n
SIB IN
1343.9
50.1/0.6
30 / 17
-1/30/24
277
100.0
Financials & Valuation (INR Billion)
Y/E Mar
2018E 2019E 2020E
NII
19.3
21.8
25.0
OP
14.7
16.4
19.1
NP
5.2
6.6
7.6
NIM (%)
2.7
2.7
2.7
EPS (INR)
2.9
3.7
4.2
EPS Gr. (%)
31.4
28.9
13.7
BV/Sh (INR)
27.6
30.4
33.5
ABV (INR)
24.7
28.6
32.5
RoE (%)
10.8
12.7
13.1
RoA (%)
0.7
0.7
0.7
P/E (x)
9.9
7.7
6.7
P/BV (x)
1.0
0.9
0.8
Div. Yield (%)
2.2
2.9
3.3
Bloomberg
Equity Shares (m)
M.Cap. (INR b)/(USD b)
52-Week Range (INR)
1, 6, 12 Rel. Per (%)
12M Avg Val (INR M)
Free float (%)
n
n
n
Investors are advised to refer through important disclosures made at the last page of the Research Report.
Motilal Oswal research is available on www.motilaloswal.com/Institutional-Equities, Bloomberg, Thomson Reuters, Factset and S&P Capital.
Alpesh Mehta
(Alpesh.Mehta@MotilalOswal.com); +91 22 6129 1526
Subham Banka
(Subham.Banka@MotilalOswal.com)
/ Anirvan Sarkar
(Anirvan.Sarkar@MotilalOswal.com);

South Indian Bank
Other highlights
n
n
n
n
Retail/SME & agri/corporate loan books grew at 4%/1%/-2% QoQ and
20%/11%/10% YoY. Retail book grew to 25% (24% in 1QFY17) of the total book,
while corporate book declined to 37% of the book (38% in 1QFY17).
Strong CASA accretion continued with 5%/23% QoQ/YoY growth, driven by
4%/20% QoQ/YoY SA growth and 11%/40% QoQ/YoY CA growth. CASA ratio
grew 140bp/200bp QoQ/YoY to 25.2%, along with 9bp/74bp QoQ/YoY drop in
cost of deposits.
GNPA/NNPA rose to 3.61%/2.54% as the company recognized the entire watch-
list of INR6.1b as NPA, leading to elevated NPAs but a clean balance sheet with
no watch-list. Recoveries and upgrades of INR470m and write-offs of INR920m
led to NNPA of INR11.8b (+48%/+3% QoQ/YoY). Total net stressed loans (NNPA,
net OSRL, SDR) came in at 3.06%, down from 3.4% in 4QFY17.
Fresh slippages as a % of advances in the corporate segment soared to 3.51%
(2.37% in 4QFY17); retail/SME slippages came in at 0.61%/0.85% (v/s
0.86%/0.64% in 4Q); and agriculture slippages fell to 0.27% v/s 0.9% in 4QFY17.
1QFY18 conference call highlights
Asset quality
n
n
n
n
n
n
n
n
The bank recognized the entire watch-list (INR6.06b at end of 4QFY17) as NPA
as part of the balance sheet clean-up exercise.
Expect substantially lower slippages going ahead (INR10b per quarter, should
recover significant amount of ~INR500-600m per quarter); no slippages
expected from large corporates.
The bank has completely migrated to system-driven NPA recognition on daily
basis, which contributed to a spike in NPA in 1QFY18.
NPA movement
--- slippages of INR6.84b (additional drawdown of INR20m),
cash recoveries of INR130m, upgrade of INR340m, write-offs of INR920m. There
was no sale to ARCs during the quarter.
There are no outstanding SDR/S4A accounts. SR book stands at INR12.75b.
Under 5:25, it has two accounts of INR3b, of which the entire amount is
standard.
There are no provisions against SR book.
IBC account exposure details – has one account of INR1.4b, which is now an NPA
and has been provided for to the extent of 15%.
One write-off involving a fraud account from FY17 is providing recoveries; some
more can be recovered.
Balance sheet related
n
n
n
Expect 18-20% loan growth in FY18 (2,000cr was sold in 4QFY17, excluding
which loan growth was 17% for FY17).
Target 20-22% post FY18.
Expect 2.85% NIM for FY18.
P/L related
n
PSLC sales contributed INR196.1m to core fee income (total INR 530-550m for
FY18, remaining to be booked over FY18).
2
16 May 2017

South Indian Bank
n
n
n
Expect CI ratio to be 47-48% for FY18.
Expect 10%-12% opex growth in FY18.
Income from forex remittance tie-ups should be gradual, but growth from sale
of third-party insurance should be significant.
Other highlights
n
n
n
n
Will add 25 branches and 25 extension counters in FY18.
Retail hub people are being selected from existing employee base.
New employees have been hired mostly for marketing.
Received board approval to raise INR5b of Tier 2 bonds.
Valuation and view
n
n
n
n
n
We have largely maintained our FY18E/FY19E PAT estimates as we believe that
elevated provisions from accelerated balance sheet clean-up should be offset by
recoveries and strong traction in fee income, which, along with strong opex
control, which should boost profitability.
We build in 21% PAT CAGR over FY18-FY20E.
Advances growth is picking up, led by low-risk retail loans as the bank steadily
shifts its loan mix to retail; corporate now forms 37% of the book compared to
38% in 1QFY17. We like management’s focus on granular low-ticket retail/SME
loans, improving C/I ratio and a steady approach to balance sheet clean-up,
which will help improve asset quality substantially.
The bank has been remarkably proactive in asset quality stress recognition and
provided for the same. Based on the small remaining quantum of stress on the
books and the amount of provisioning already done, we believe that
slippages/credit costs should be controlled from here. We thus arrive at
FY18E/FY19E/FY20E RoA of 0.65%/0.74%/0.75% and RoE of 10.8%/12.7%/13.1%.
In view of continued reduction in net stressed assets, comfortable capital
position and improved profitability, we maintain our
Buy
rating on the stock
with a TP of INR34.3 (1.1x June 19E BV, slight increase in multiple over earlier
multiple of 1.0x Mar ’19 book in view of significantly improved visibility of asset
quality and profitability).
Old Est
FY19
22.3
7.4
29.7
14.4
15.3
5.4
9.8
3.3
6.5
614
844
2.78
0.80
0.7
12.2
Revised Est
FY19
21.8
8.6
30.4
14.0
16.4
6.3
10.2
3.5
6.6
614
844
2.71
1.00
0.7
12.7
Variation (%)
FY19
-2.4
16.8
2.4
-3.1
7.5
15.4
3.2
4.7
2.4
0.0
0.0
Exhibit 1: We largely maintain our estimates across FY18-20
INR B
Net Interest Income
Other Income
Total Income
Operating Expenses
Operating Profits
Provisions
PBT
Tax
PAT
Loans
Deposits
Margins
Credit Cost
RoA
RoE
16 May 2017
FY18
19.8
6.8
26.6
13.0
13.7
5.8
7.8
2.7
5.2
533
741
2.79
1.10
0.7
10.6
FY20
25.7
8.3
33.9
15.9
18.0
6.4
11.6
3.9
7.7
706
962
2.82
0.70
0.8
13.1
FY18
19.3
8.0
27.3
12.6
14.7
6.8
7.9
2.7
5.2
533
741
2.72
1.25
0.7
10.8
FY20
25.0
9.5
34.5
15.4
19.1
7.6
11.5
4.0
7.6
706
962
2.75
1.00
0.7
13.1
FY18
-2.7
17.8
2.5
-2.5
7.3
16.4
0.5
2.0
-0.3
0.0
0.0
FY20
-2.5
15.1
1.8
-3.3
6.3
18.7
-0.5
1.0
-1.2
0.0
0.0
3

South Indian Bank
Exhibit 2: One year forward P/BV
1.8
1.3
0.9
0.8
0.3
0.9
0.3
PB (x)
Median(x)
Peak(x)
Min(x)
Avg(x)
1.5
1.0
5
0
6.4
Exhibit 3: One year forward P/E
15
10
PE (x)
Median(x)
Peak(x)
Min(x)
Avg(x)
12.3
9.1
6.7
2.1
Source: MOSL, Company
FY15
9.27
6.87
2.39
0.58
2.98
1.72
57.7
1.11
0.61
1.26
0.29
1.55
0.80
0.39
0.41
0.74
0.28
37.8
0.46
17.1
7.9
FY16
9.09
6.62
2.47
0.62
3.09
1.88
60.7
1.13
0.75
1.21
0.22
1.44
0.60
0.66
-0.06
0.83
0.29
34.6
0.55
17.1
9.3
FY17
8.51
6.07
2.44
0.67
3.11
1.71
55.0
0.98
0.73
1.40
0.37
1.77
0.89
0.97
-0.08
0.87
0.30
34.6
0.57
16.6
9.5
FY18E
7.94
5.50
2.44
0.70
3.14
1.60
51.0
0.92
0.68
1.54
0.32
1.86
0.86
0.79
0.07
1.00
0.34
34.5
0.65
16.5
10.8
FY19E
7.58
5.15
2.44
0.74
3.18
1.56
49.2
0.90
0.67
1.62
0.22
1.84
0.70
0.64
0.06
1.14
0.39
34.5
0.74
17.1
12.7
FY20E
7.60
5.13
2.47
0.78
3.25
1.52
46.8
0.87
0.65
1.73
0.16
1.88
0.75
0.65
0.10
1.14
0.39
34.5
0.75
17.6
13.1
Exhibit 4: DuPont Analysis: Controlled opex and provisioning to enhance RoA/RoE (%)
Interest income
Interest expense
Net interest income
Fee income
Core income
Operating costs
Cost to core income ratio
Employee Costs
Other Expenses
Core Operating Profit
Treasury Income
Operating Profit
Provisions
NPA Provisions
Other provisions
PBT
Tax
Tax Rate
ROA
Leverage (x)
ROE
FY12
9.79
7.00
2.79
0.56
3.36
1.69
50.3
1.02
0.66
1.67
0.11
1.78
0.22
0.06
0.16
1.56
0.47
29.8
1.10
19.7
21.6
FY13
9.84
6.99
2.84
0.61
3.46
1.70
49.2
1.05
0.65
1.75
0.13
1.88
0.43
0.29
0.13
1.45
0.34
23.4
1.11
18.4
20.5
FY14
9.57
6.90
2.67
0.57
3.24
1.69
52.0
1.01
0.68
1.55
0.13
1.69
0.30
0.26
0.04
1.39
0.42
30.4
0.97
17.2
16.6
Source: MOSL, Company
16 May 2017
4

South Indian Bank
Story in charts
Exhibit 5: Loan book growth picking up
13
15 14
Loans (INR b)
10
11
9
3
YoY Loan Growth (%)
12 12
10 10
8
10 11
13
14
11
Exhibit 6: CASA ratio improved ~140bp QoQ to 23.8%
CASA Deposits (INR b)
YoY Growth (%)
9
14
17
18
17
15
13
CASA Ratio (%)
34
26
23
8
Source: Company, MOSL
Exhibit 7: Reported margins improved 6bp QoQ/YoY
2.9
2.7
2.5
2.7
2.5
2.7
NIM (%)
2.8 2.7 2.7 2.8
2.7 2.7
2.8
Exhibit 8: Fee income growth picking up
Fee income (INR m)
43
25 18
(15)
6
2
16
(1)
9
YoY growth (%)
52
20 14 20
32
12
Source: Company, MOSL
Exhibit 9: Slippages remain elevated
Slippage Ratio (%)
9.0
5.9
1.4
1.2 1.0
0.6
2.0 1.8 2.0 2.5
4.0
1.3
2.3 2.0
11.2
Exhibit 10: PCR declines ~1050bp sequentially
40
GNPA (%)
42 43 45
35
NNPA (%)
38
35
24
Calc. PCR (%)
41
38
31
30
28
29
35
Source: Company, MOSL
16 May 2017
5

South Indian Bank
Exhibit 11: Quarterly Snapshot (INR m)
FY16
1Q
Profit and Loss (INR m)
Net Interest Income
Other Income
Trading profits
Forex Income
Others
Total Income
Operating Expenses
Employee
Others
Operating Profits
Provisions
NPA provisions
Provisions on Invst.
Others
PBT
Taxes
PAT
Asset Quality
GNPA
NNPA
GNPA (%)
NNPA (%)
PCR (Calculated, %)
Credit Cost (bp)
Ratios (%)
Non Int. to Total Income
Cost to Core Income
Tax Rate
Loan/Deposit
CASA Reported
CAR
Tier I
Reported NIMs (%) -
Cumulative
Yield on loans
Cost of Deposits
Margins
Balance Sheet (INR B)
Gross Advances
Deposits
3,404
1,038
141
87
810
4,442
2,633
1,574
1,059
1,809
795
412
203
180
1,014
361
653
7,138
4,640
1.9
1.2
35
44
23.4
62.5
35.6
73.6
22.3
11.4
10.0
2Q
3,884
1,212
420
40
752
5,096
2,965
1,787
1,178
2,130
675
891
-32
-184
1,456
522
934
3Q
4,067
1,533
500
220
813
5,600
2,970
1,846
1,124
2,631
1,064
839
122
103
1,567
551
1,016
4Q
3,743
1,391
300
100
991
5,134
2,911
1,716
1,195
2,223
1,163
1,911
5
-754
1,060
331
730
1Q
3,736
1,734
570
240
924
5,471
2,876
1,676
1,200
2,595
1,141
911
-34
264
1,454
503
951
2Q
4,452
1,459
510
50
899
5,911
2,937
1,676
1,262
2,973
1,283
1,636
-276
-77
1,690
585
1,105
FY17
3Q
4,175
2,585
1,270
80
1,235
6,760
2,991
1,752
1,239
3,770
2,066
1,740
58
268
1,703
590
1,114
4Q
4,391
1,377
180
90
1,107
5,768
2,960
1,662
1,298
2,808
1,653
2,395
-79
-663
1,155
400
755
1Q
4,607
2,193
890
80
1,223
6,800
3,005
1,670
1,336
3,795
2,243
1,844
261
138
1,552
537
1,015
FY18E
2Q
3Q
4,762
1,832
600
130
1,102
6,595
3,156
1,801
1,355
3,439
1,525
1,600
-150
75
1,914
660
1,253
4,989
1,853
500
150
1,203
6,842
3,213
1,883
1,330
3,629
1,425
1,400
-50
75
2,204
760
1,444
4Q
5,208
2,156
510
163
1,483
7,364
3,265
1,919
1,346
4,099
1,588
1,390
39
160
2,511
759
1,752
Variation (%)
QoQ
YoY
5
59
394
-11
10
18
2
0
3
35
36
-23
NM
NM
34
34
34
23
26
56
-67
32
24
4
0
11
46
97
102
-1,680
-12
7
7
7
3
-1
-35
-35
243
8,923 11,080 15,624 16,516 17,453 17,870 11,490 16,957 17,049 17,040 16,678 48
5,496 7,160 11,853 11,918 12,064 11,157 6,746 11,825 10,229 9,372 8,197
75
2.2
2.8
3.8
4.0
4.0
4.0
2.5
3.6
3.5
3.3
3.1
116
1.4
1.8
2.9
2.9
2.8
2.5
1.5
2.5
2.1
1.9
1.5
109
38
35
24
28
31
38
41
30
40
45
51
-1,103
92
84
189
89
154
159
211
159
135
114
107
23.8
64.0
35.8
75.2
22.8
11.9
9.6
27.4
60.8
35.1
75.4
23.0
11.7
9.4
27.1
61.5
31.2
74.4
22.2
11.8
9.8
31.7
61.7
34.6
72.0
23.2
11.7
9.9
24.7
54.9
34.6
73.2
22.8
11.1
9.5
38.2
55.3
34.6
70.6
25.9
11.1
9.4
23.9
53.8
34.6
70.9
23.8
12.4
10.9
32.3
51.5
34.6
71.5
25.2
12.1
10.8
27.8
53.8
34.5
72.0
0.0
0.0
0.0
27.1
51.9
34.5
73.2
0.0
0.0
0.0
29.3
48.8
30.2
73.2
0.0
0.0
0.0
11.5
7.9
2.5
385
523
11.4
7.7
2.7
399
530
11.4
7.6
2.8
403
534
11.2
7.5
2.7
415
557
10.9
7.0
2.7
417
579
10.7
6.9
2.8
441
602
10.6
6.8
2.7
449
636
10.0
6.3
2.7
469
661
10.1
6.2
2.8
470
658
0.0
0.0
0.0
488
678
0.0
0.0
0.0
511
698
0.0
0.0
0.0
542
741
9
-9
6
0
0
-83
-74
6
13
14
Source: MOSL, Company
16 May 2017
6

South Indian Bank
Financials and valuations
Income Statement
Y/E March
Interest Income
Interest Expense
Net Interest Income
Change (%)
Non Interest Income
Net Income
Change (%)
Operating Expenses
Pre Provision Profits
Change (%)
Provisions (excl tax)
PBT
Tax
Tax Rate (%)
Extra Ordinary Item
Profits Post EO
Change (%)
Equity Dividend (Incl tax)
Core PPP*
Change (%)
*Core PPP is (NII+Fee income-Opex)
2012
35,834
25,617
10,217
29.2
2,471
12,688
28.4
6,173
6,515
24.0
792
5,723
1,707
29.8
0
4,017
37.3
791
6,107
25.7
2013
44,343
31,535
12,808
25.4
3,349
16,158
27.3
7,672
8,486
30.2
1,927
6,559
1,536
23.4
0
5,023
25.1
1,094
7,909
29.5
2014
50,151
36,163
13,988
9.2
3,685
17,672
9.4
8,829
8,843
4.2
1,554
7,289
2,214
30.4
0
5,075
1.0
1,258
8,145
3.0
2015
52,862
39,200
13,662
-2.3
4,971
18,633
5.4
9,813
8,820
-0.3
4,570
4,250
1,608
37.8
-430
3,072
-39.5
980
7,180
-11.8
2016
55,572
40,475
15,097
10.5
5,174
20,271
8.8
11,478
8,793
-0.3
3,696
5,097
1,764
34.6
0
3,333
8.5
813
7,427
3.4
2017
58,471
41,716
16,754
11.0
7,156
23,910
18.0
11,764
12,146
38.1
6,144
6,002
2,077
34.6
0
3,925
17.8
868
9,621
29.5
2018E
62,718
43,456
19,262
15.0
8,034
27,295
14.2
12,639
14,656
20.7
6,782
7,875
2,717
34.5
0
5,158
31.4
1,322
12,156
26.4
(INR Million)
2019E
2020E
67,733
77,096
45,970
52,081
21,763
25,015
13.0
14.9
8,614
9,507
30,377
34,522
11.3
13.6
13,950
15,404
16,427
19,118
12.1
16.4
6,275
7,571
10,152
11,546
3,502
3,984
34.5
34.5
0
0
6,650
7,563
28.9
13.7
1,704
1,938
14,427
17,518
18.7
21.4
(INR Million)
2019E
2020E
1,803
1,803
0
0
55,356
60,980
57,158
62,783
8,44,188 9,62,374
14.0
14.0
2,07,988 2,44,476
17.5
17.5
31,512
35,279
17,048
18,747
9,49,906 10,79,183
53,238
63,325
2,30,825 2,53,907
10.0
10.0
6,13,501 7,05,526
15.0
15.0
7,561
8,061
44,782
48,364
9,49,906 10,79,183
(%)
18,911
2,599
2.68
0.37
86.3
Balance Sheet
Y/E March
Equity Share Capital
Preference Share Capital
Reserves & Surplus
Net Worth
Deposits
Change (%)
of which CASA Dep
Change (%)
Borrowings
Other Liabilities & Prov.
Total Liabilities
Current Assets
Investments
Change (%)
Loans
Change (%)
Fixed Assets
Other Assets
Total Assets
2012
1,134
0
20,570
21,704
3,65,005
22.8
71,793
12.1
5,882
11,109
4,03,701
26,405
93,999
5.3
2,72,807
33.1
3,775
6,714
4,03,701
2013
1,339
0
28,724
30,062
4,42,623
21.3
82,328
14.7
12,846
12,420
4,97,950
43,359
1,25,235
33.2
3,18,155
16.6
3,961
7,240
4,97,950
2014
1,344
0
32,360
33,704
4,74,911
7.3
98,249
19.3
27,308
13,937
5,49,860
32,179
1,43,518
14.6
3,62,299
13.9
4,122
7,742
5,49,860
2015
1,350
0
34,544
35,894
5,19,125
9.3
1,06,863
8.8
22,325
13,819
5,91,163
35,951
1,40,861
-1.9
3,73,916
3.2
4,790
35,644
5,91,163
2016
1,350
0
37,106
38,456
5,57,207
7.3
1,24,590
16.6
23,150
12,936
6,31,749
30,995
1,46,189
3.8
4,10,857
9.9
4,870
38,837
6,31,749
2017
1,803
0
46,574
48,377
6,61,175
18.7
1,57,470
26.4
19,578
13,990
7,43,120
38,877
1,94,297
32.9
4,63,895
12.9
6,561
39,490
7,43,120
2018E
1,803
0
50,410
52,213
7,40,516
12.0
1,76,961
12.4
27,951
15,514
8,36,194
44,349
2,09,840
8.0
5,33,479
15.0
7,061
41,465
8,36,194
Asset Quality
GNPA (INR m)
NNPA (INR m)
GNPA Ratio
NNPA Ratio
PCR (Excl Tech. write off)
E: MOSL Estimates
2,672
765
0.97
0.28
71.4
4,339
2,495
1.36
0.78
42.5
4,326
2,817
1.19
0.78
34.9
6,435
3,602
1.71
0.96
44.0
15,624
11,853
3.77
2.88
24.1
11,494
6,746
2.45
1.45
41.3
16,679
8,197
3.13
1.54
50.9
17,178
4,961
2.80
0.81
71.1
16 May 2017
7

South Indian Bank
Financials and valuations
Ratios
Y/E March
Spreads Analysis (%)
Avg. Yield-Earning Assets
Avg. Yield on loans
Avg. Yield on Investments
Avg. Cost-Int. Bear. Liab.
Avg. Cost of Deposits
Interest Spread
Net Interest Margin
Profitability Ratios (%)
RoE
RoA
Int. Expense/Int.Income
Fee Income/Net Income
Non Int. Inc./Net Income
Efficiency Ratios (%)
Cost/Income*
Empl. Cost/Op. Exps.
Busi. per Empl. (INR m)
NP per Empl. (INR lac)
* ex treasury and recoveries
Asset-Liability Profile (%)
Loans/Deposit Ratio
CASA Ratio
Investment/Deposit Ratio
G-Sec/Investment Ratio
CAR
Tier 1
2012
10.6
12.0
6.8
7.6
7.6
2.9
3.0
2013
10.5
12.1
6.8
7.6
7.6
2.8
3.0
2014
10.2
11.6
7.1
7.6
7.5
2.6
2.8
2015
10.1
11.3
6.7
7.5
7.4
2.6
2.6
2016
10.2
11.1
7.0
7.2
7.1
3.0
2.8
2017
9.5
10.2
7.2
6.6
6.5
2.9
2.7
2018E
8.9
9.5
6.6
6.0
5.9
2.9
2.7
2019E
8.4
9.0
6.3
5.6
5.5
2.9
2.7
2020E
8.5
9.0
6.3
5.6
5.5
2.9
2.7
21.6
1.1
71.5
16.3
19.5
20.5
1.1
71.1
17.2
20.7
16.6
1.0
72.1
16.9
20.8
7.9
0.5
74.2
17.9
26.7
9.3
0.5
72.8
18.8
25.5
9.5
0.6
71.3
19.4
29.9
10.8
0.7
69.3
20.3
29.4
12.7
0.7
67.9
21.8
28.4
13.1
0.7
67.6
22.9
27.5
50.3
60.6
96.9
6.8
49.2
61.6
109.6
7.9
52.0
59.9
112.4
7.1
57.7
64.6
116.9
4.2
60.7
60.3
119.6
4.3
55.0
57.5
150.0
5.6
51.0
57.5
158.7
6.8
49.2
57.3
171.2
8.3
46.8
57.1
186.0
9.0
74.7
19.7
25.8
87.4
14.0
11.5
71.9
18.6
28.3
79.7
14.0
12.1
76.3
20.7
30.2
80.2
12.2
11.0
72.0
20.6
27.1
87.7
11.8
10.7
73.7
22.4
26.2
94.7
11.5
9.8
70.2
23.8
29.4
87.7
13.4
11.7
72.0
23.9
28.3
84.7
12.9
11.3
72.7
24.6
27.3
87.8
12.4
10.9
73.3
25.4
26.4
91.0
12.0
10.6
Valuation
Book Value (INR)
Change (%)
Price-BV (x)
Adjusted BV (INR)
Price-ABV (x)
EPS (INR)
Change (%)
Price-Earnings (x)
Dividend Per Share (INR)
Dividend Yield (%)
E: MOSL Estimates
17.9
19.1
1.6
17.4
1.6
3.5
36.8
8.0
0.6
2.1
21.4
19.9
1.3
20.2
1.4
3.8
5.9
7.5
0.7
2.5
24.1
12.5
1.2
22.7
1.2
3.8
0.6
7.5
0.8
2.8
25.6
6.1
1.1
23.8
1.2
2.3
-39.7
12.4
0.6
2.1
27.5
7.6
1.0
21.8
1.3
2.5
8.5
11.4
0.5
1.8
25.5
-7.3
1.1
23.0
1.2
2.2
-11.8
13.0
0.4
1.4
27.6
8.4
1.0
24.7
1.1
2.9
31.4
9.9
0.6
2.2
30.4
9.9
0.9
28.6
1.0
3.7
28.9
7.7
0.8
2.9
33.5
10.3
0.8
32.5
0.9
4.2
13.7
6.7
0.9
3.3
16 May 2017
8

South Indian Bank
Corporate profile: South India Bank
Company description
One of the earliest banks in Southern part of India,
South Indian Bank (SIB) was incorporated in 1928
at Thrissur in Kerala. Under the RBI Act, SIB was the
first private sector bank in Kerala to become a
Scheduled Commercial Bank in 1946. Currently, the
bank is led by Mr. V. G. Mathew, MD & CEO. The
bank has a strong presence in South India (80%+
branches). As on June 2016, the bank had a
network of 838 branches and 1,291 ATMs.
Exhibit 1: Sensex rebased
Exhibit 12: Shareholding pattern (%)
Mar-17
Promoter
DII
FII
Others
0.0
13.8
35.4
50.8
Dec-16
0.0
15.5
34.8
49.6
Mar-16
0.0
18.7
33.0
48.4
Exhibit 13: Top holders
Holder Name
CINNAMON CAPITAL LIMITED
ICICI PRUDENTIAL SENSEX IWIN ETF
GOVERNMENT OF SINGAPORE
ICICI PRUDENTIAL LIFE INSURANCE
FRANKLIN INDIA MONTHLY INCOME PLAN
% Holding
4.4
1.9
1.6
1.5
1.4
COMPANY
Note: FII Includes depository receipts
Exhibit 14: Top management
Name
Salim Gangadharan
V G Mathew
Designation
Part Time Chairman
Managing Director & CEO
Exhibit 15: Directors
Name
Cheryan Varkey
Francis Alapatt
John Joseph Alapatt
Name
K Thomas Jacob
Mohan Alapatt
Parayil George John Tharakan
Ranjana Salgaocar
*Independent
Exhibit 16: Auditors
Name
Deloitte Haskins & Sells
Type
Statutory
Exhibit 17: MOSL forecast v/s consensus
EPS
(INR)
FY18
FY19
MOSL
forecast
2.9
3.7
Consensus
forecast
3.0
3.5
Variation
(%)
-3.0
4.7
16 May 2017
9

Disclosures
This document has been prepared by Motilal Oswal Securities Limited (hereinafter referred to as Most) to provide information about the company (ies) and/sector(s), if any, covered in the report and may be distributed by it and/or
South Indian Bank
its affiliated company(ies). This report is for personal information of the selected recipient/s and does not construe to be any investment, legal or taxation advice to you. This research report does not constitute an offer, invitation or
inducement to invest in securities or other investments and Motilal Oswal Securities Limited (hereinafter referred as MOSt) is not soliciting any action based upon it. This report is not for public distribution and has been furnished to
you solely for your general information and should not be reproduced or redistributed to any other person in any form. This report does not constitute a personal recommendation or take into account the particular investment
objectives, financial situations, or needs of individual clients. Before acting on any advice or recommendation in this material, investors should consider whether it is suitable for their particular circumstances and, if necessary, seek
professional advice. The price and value of the investments referred to in this material and the income from them may go down as well as up, and investors may realize losses on any investments. Past performance is not a guide
for future performance, future returns are not guaranteed and a loss of original capital may occur.
MOSt and its affiliates are a full-service, integrated investment banking, investment management, brokerage and financing group. We and our affiliates have investment banking and other business relationships with a some
companies covered by our Research Department. Our research professionals may provide input into our investment banking and other business selection processes. Investors should assume that MOSt and/or its affiliates are
seeking or will seek investment banking or other business from the company or companies that are the subject of this material and that the research professionals who were involved in preparing this material may educate
investors on investments in such business . The research professionals responsible for the preparation of this document may interact with trading desk personnel, sales personnel and other parties for the purpose of gathering,
applying and interpreting information. Our research professionals are paid on twin parameters of performance & profitability of MOSt.
MOSt generally prohibits its analysts, persons reporting to analysts, and members of their households from maintaining a financial interest in the securities or derivatives of any companies that the analysts cover. Additionally,
MOSt generally prohibits its analysts and persons reporting to analysts from serving as an officer, director, or advisory board member of any companies that the analysts cover. Our salespeople, traders, and other professionals or
affiliates may provide oral or written market commentary or trading strategies to our clients that reflect opinions that are contrary to the opinions expressed herein, and our proprietary trading and investing businesses may make
investment decisions that are inconsistent with the recommendations expressed herein. In reviewing these materials, you should be aware that any or all of the foregoing among other things, may give rise to real or potential
conflicts of interest. MOSt and its affiliated company(ies), their directors and employees and their relatives may; (a) from time to time, have a long or short position in, act as principal in, and buy or sell the securities or derivatives
thereof of companies mentioned herein. (b) be engaged in any other transaction involving such securities and earn brokerage or other compensation or act as a market maker in the financial instruments of the company(ies)
discussed herein or act as an advisor or lender/borrower to such company(ies) or may have any other potential conflict of interests with respect to any recommendation and other related information and opinions.; however the
same shall have no bearing whatsoever on the specific recommendations made by the analyst(s), as the recommendations made by the analyst(s) are completely independent of the views of the affiliates of MOSt even though
there might exist an inherent conflict of interest in some of the stocks mentioned in the research report
Reports based on technical and derivative analysis center on studying charts company's price movement, outstanding positions and trading volume, as opposed to focusing on a company's fundamentals and, as such, may not
match with a report on a company's fundamental analysis. In addition MOST has different business segments / Divisions with independent research separated by Chinese walls catering to different set of customers having various
objectives, risk profiles, investment horizon, etc, and therefore may at times have different contrary views on stocks sectors and markets.
Unauthorized disclosure, use, dissemination or copying (either whole or partial) of this information, is prohibited. The person accessing this information specifically agrees to exempt MOSt or any of its affiliates or employees from,
any and all responsibility/liability arising from such misuse and agrees not to hold MOSt or any of its affiliates or employees responsible for any such misuse and further agrees to hold MOSt or any of its affiliates or employees free
and harmless from all losses, costs, damages, expenses that may be suffered by the person accessing this information due to any errors and delays. The information contained herein is based on publicly available data or other
sources believed to be reliable. Any statements contained in this report attributed to a third party represent MOSt’s interpretation of the data, information and/or opinions provided by that third party either publicly or through a
subscription service, and such use and interpretation have not been reviewed by the third party. This Report is not intended to be a complete statement or summary of the securities, markets or developments referred to in the
document. While we would endeavor to update the information herein on reasonable basis, MOSt and/or its affiliates are under no obligation to update the information. Also there may be regulatory, compliance, or other reasons
that may prevent MOSt and/or its affiliates from doing so. MOSt or any of its affiliates or employees shall not be in any way responsible and liable for any loss or damage that may arise to any person from any inadvertent error in
the information contained in this report. MOSt or any of its affiliates or employees do not provide, at any time, any express or implied warranty of any kind, regarding any matter pertaining to this report, including without limitation
the implied warranties of merchantability, fitness for a particular purpose, and non-infringement. The recipients of this report should rely on their own investigations.
This report is intended for distribution to institutional investors. Recipients who are not institutional investors should seek advice of their independent financial advisor prior to taking any investment decision based on this report or
for any necessary explanation of its contents.
Most and it’s associates may have managed or co-managed public offering of securities, may have received compensation for investment banking or merchant banking or brokerage services, may have received any compensation
for products or services other than investment banking or merchant banking or brokerage services from the subject company in the past 12 months.
Most and it’s associates have not received any compensation or other benefits from the subject company or third party in connection with the research report.
Subject Company may have been a client of Most or its associates during twelve months preceding the date of distribution of the research report
MOSt and/or its affiliates and/or employees may have interests/positions, financial or otherwise of over 1 % at the end of the month immediately preceding the date of publication of the research in the securities mentioned in this
report. To enhance transparency, MOSt has incorporated a Disclosure of Interest Statement in this document. This should, however, not be treated as endorsement of the views expressed in the report.
Motilal Oswal Securities Limited is registered as a Research Analyst under SEBI (Research Analyst) Regulations, 2014. SEBI Reg. No. INH000000412
Pending Regulatory inspections against Motilal Oswal Securities Limited:
SEBI pursuant to a complaint from client Shri C.R. Mohanraj alleging unauthorized trading, issued a letter dated 29th April 2014 to MOSL notifying appointment of an Adjudicating Officer as per SEBI regulations to hold inquiry and
adjudge violation of SEBI Regulations; MOSL replied to the Show Cause Notice whereby SEBI granted us an opportunity of Inspection of Documents. Since all the documents requested by us were not covered we have requested
to SEBI vide our letter dated June 23, 2015 to provide pending list of documents for inspection.
List of associate companies of Motilal Oswal Securities Limited -
Click here to access detailed report
Analyst Certification
The views expressed in this research report accurately reflect the personal views of the analyst(s) about the subject securities or issues, and no part of the compensation of the research analyst(s) was, is, or will be directly or
indirectly related to the specific recommendations and views expressed by research analyst(s) in this report. The research analysts, strategists, or research associates principally responsible for preparation of MOSt research
receive compensation based upon various factors, including quality of research, investor client feedback, stock picking, competitive factors and firm revenues
Disclosure of Interest Statement
§
Analyst ownership of the stock
§
Served as an officer, director or employee -
South Indian Bank
No
No
A graph of daily closing prices of securities is available at www.nseindia.com and http://economictimes.indiatimes.com/markets/stocks/stock-quotes
Regional Disclosures (outside India)
This report is not directed or intended for distribution to or use by any person or entity resident in a state, country or any jurisdiction, where such distribution, publication, availability or use would be contrary to law, regulation or
which would subject MOSt & its group companies to registration or licensing requirements within such jurisdictions.
For Hong Kong:
This report is distributed in Hong Kong by Motilal Oswal capital Markets (Hong Kong) Private Limited, a licensed corporation (CE AYY-301) licensed and regulated by the Hong Kong Securities and Futures
Commission (SFC) pursuant to the Securities and Futures Ordinance (Chapter 571 of the Laws of Hong Kong) “SFO”. As per SEBI (Research Analyst Regulations) 2014 Motilal Oswal Securities (SEBI Reg No. INH000000412)
has an agreement with Motilal Oswal capital Markets (Hong Kong) Private Limited for distribution of research report in Kong Kong. This report is intended for distribution only to “Professional Investors” as defined in Part I of
Schedule 1 to SFO. Any investment or investment activity to which this document relates is only available to professional investor and will be engaged only with professional investors.” Nothing here is an offer or solicitation of
these securities, products and services in any jurisdiction where their offer or sale is not qualified or exempt from registration. The Indian Analyst(s) who compile this report is/are not located in Hong Kong & are not conducting
Research Analysis in Hong Kong.
For U.S.
Motilal Oswal Securities Limited (MOSL) is not a registered broker - dealer under the U.S. Securities Exchange Act of 1934, as amended (the"1934 act") and under applicable state laws in the United States. In addition MOSL is
not a registered investment adviser under the U.S. Investment Advisers Act of 1940, as amended (the "Advisers Act" and together with the 1934 Act, the "Acts), and under applicable state laws in the United States. Accordingly, in
the absence of specific exemption under the Acts, any brokerage and investment services provided by MOSL, including the products and services described herein are not available to or intended for U.S. persons.
This report is intended for distribution only to "Major Institutional Investors" as defined by Rule 15a-6(b)(4) of the Exchange Act and interpretations thereof by SEC (henceforth referred to as "major institutional investors"). This
document must not be acted on or relied on by persons who are not major institutional investors. Any investment or investment activity to which this document relates is only available to major institutional investors and will be
engaged in only with major institutional investors. In reliance on the exemption from registration provided by Rule 15a-6 of the U.S. Securities Exchange Act of 1934, as amended (the "Exchange Act") and interpretations thereof by
the U.S. Securities and Exchange Commission ("SEC") in order to conduct business with Institutional Investors based in the U.S., MOSL has entered into a chaperoning agreement with a U.S. registered broker-dealer, Motilal
Oswal Securities International Private Limited. ("MOSIPL"). Any business interaction pursuant to this report will have to be executed within the provisions of this chaperoning agreement.
The Research Analysts contributing to the report may not be registered /qualified as research analyst with FINRA. Such research analyst may not be associated persons of the U.S. registered broker-dealer, MOSIPL, and
therefore, may not be subject to NASD rule 2711 and NYSE Rule 472 restrictions on communication with a subject company, public appearances and trading securities held by a research analyst account.
For Singapore
Motilal Oswal Capital Markets Singapore Pte Limited is acting as an exempt financial advisor under section 23(1)(f) of the Financial Advisers Act(FAA) read with regulation 17(1)(d) of the Financial Advisors Regulations and is a
subsidiary of Motilal Oswal Securities Limited in India. This research is distributed in Singapore by Motilal Oswal Capital Markets Singapore Pte Limited and it is only directed in Singapore to accredited investors, as defined in the
Financial Advisers Regulations and the Securities and Futures Act (Chapter 289), as amended from time to time.
In respect of any matter arising from or in connection with the research you could contact the following representatives of Motilal Oswal Capital Markets Singapore Pte Limited:
Varun Kumar
Varun.kumar@motilaloswal.com
Contact : (+65) 68189232
Office Address:21 (Suite 31),16 Collyer Quay,Singapore 04931
16 May 2017
Motilal Oswal Tower, Level 9, Sayani Road, Prabhadevi, Mumbai 400 025
Phone: +91 22 3982 5500 E-mail: reports@motilaloswal.com
Motilal Oswal Securities Ltd
10