Hindustan Unilever
BSE SENSEX
31,711
S&P CNX
9,827
18 July 2017
1QFY18 Results Update | Sector: Consumer
CMP: INR1,158 TP: INR1,285(+11%)
Buy
Motilal Oswal values your support in
the Asiamoney Brokers Poll 2017 for
India Research, Sales and Trading
team. We
request your ballot.
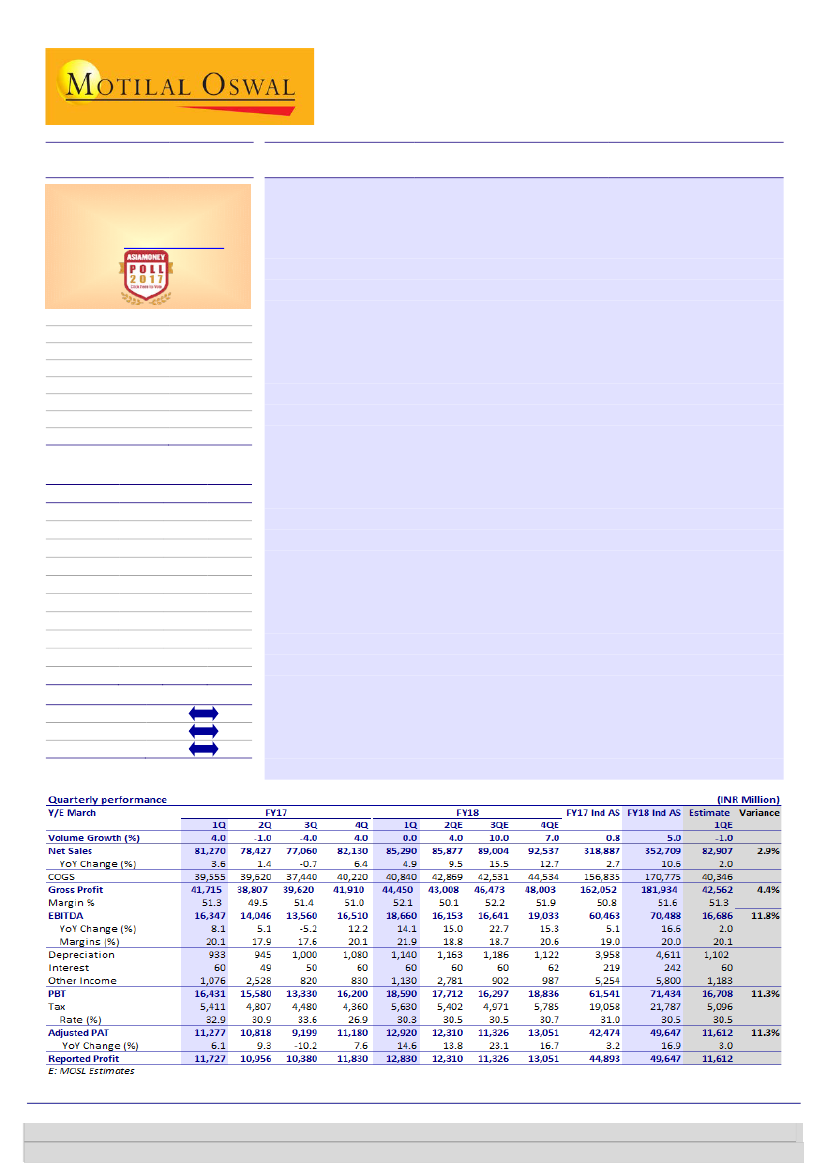
Decent sales/margins performance in a quarter affected by destocking
Hindustan Unilever’s (HUVR) 1QFY18 net sales increased 4.9% YoY
(est. of
+2%) to INR85.3b. Domestic consumer business grew 6% YoY, with flat volumes
(est. -1%). EBITDA increased 14.1% YoY to INR18.7b (12% above estimate) and
PAT (bei) rose 14.6% YoY to INR12.9b (11% above estimate).
Home care revenues were up 5.9% YoY, while personal care witnessed 3.5%
YoY growth in sales. Foods business sales were up 4.3% YoY, while refreshment
sales increased 10.8% YoY. Home care EBIT margin expanded by 230bp YoY and
personal care margin by 50bp YoY. Among the smaller segments, foods margin
expanded by 820bp YoY (off a very low base) and refreshment margin by
310bp YoY.
Gross margin expanded 80bp YoY to 52.1%.
EBITDA margin expanded 180bp
YoY to 21.9%, aided by gross margin improvement, and a decline of 30bp
YoY in staff costs, 20bp YoY in adspend and 40bp YoY in other expenses.
EBITDA increased 14.1% YoY to INR18.66b, higher than our estimate of
INR16.69b. PAT (bei) rose 14.6% YoY to INR12.92b.
Concall highlights:
(1) Absence of CSD offtake from the beginning of June
affected sales by 2% for the quarter. (2) Management expects a gradual
recovery in rural demand. (3) Company aims to attain significant savings in
each cost item over the next few years.
Valuation and view:
HUL has all the levers in place to drive earnings revival,
including good monsoon, benefits of low base of preceding years, return of
price part of sales growth, lower promotion spends, continuing premiumization
and various government schemes (DBT implementation, 24% increase in rural
outlay in the budget, farm loan waiver in Uttar Pradesh, etc.). Consequently,
we expect EPS CAGR of 18% over FY17-19, well above 3-year/5-year/10-year
EPS CAGR of 6.1%/10.6%/10.1%. Return ratios and dividend yield are best-of-
breed. We maintain our target multiple of 45x FY19E June-19 EPS (5% premium
to 3-year average), resulting in a target price of INR1,285. Maintain
Buy.
Bloomberg
Equity Shares (m)
M.Cap.(INRb)/(USDb)
52-Week Range (INR)
1, 6, 12 Rel. Per (%)
Avg Val, INRm/ Vol m
Free float (%)
HUVR IN
2,164.3
2,159.4 / 33.7
1190 / 783
4/18/12
1226
32.8
Financials & Valuations (INR b)
Y/E Mar
2017 2018E 2019E
Net Sales
313.0 346.2 392.7
EBITDA
60.5
70.5
83.5
PAT
42.5
49.6
59.2
EPS (INR)
19.6
22.9
27.3
Gr. (%)
1.9
16.8
19.2
BV/Sh (INR)
30.8
31.9
34.1
RoE (%)
65.6
73.1
82.8
RoCE (%)
87.3
97.0
110.1
P/E (x)
59.0
50.5
42.3
P/BV (x)
37.6
36.3
34.0
Estimate change
TP change
Rating change
Investors are advised to refer through important disclosures made at the last page of the Research Report.
Motilal Oswal research is available on www.motilaloswal.com/Institutional-Equities, Bloomberg, Thomson Reuters, Factset and S&P Capital.
Krishnan Sambamoorthy
(Krishnan.Sambamoorthy@MotilalOswal.com); +91 22 3982 5428
Vishal Punmiya
(Vishal.Punmiya@MotilalOswal.com); +91 22 3980 4261

Hindustan Unilever
Key Quarterly Charts
Exhibit 1:
Realization growth seen at 6% in 1QFY18
Pricing growth %
6.0
Underlying volume growth (%)
51.8
3.0 6.0
4.0 0.0
50.3
49.6
Exhibit 2:
Gross margin expanded 80bp YoY
Gross margin (%)
52.1
51.0
5.0
51.2
51.3
49.5
51.4
7.4 5.4
7.0 6.0
6.0
4.6 3.0 6.0
4.0 4.0 3.0 4.0 4.0
(1.0) (2.0) (2.7) (0.4)
0.0
(1.0)
(4.0)
Source: Company, MOSL
Exhibit 3: Destocking impacts domestic growth in 1QFY18…
Domestic FMCG Sales Growth (%)
Source: Company, MOSL
Exhibit 4: …led by flattish volumes YoY
Underlying volume growth (%)
Source: Company, MOSL
Exhibit 5:
A&P spends down 20bp YoY…
Advertising & promotion (%)
11.9
11.4
11.9
11.2
10.8
10.9
10.4
Exhibit 6: …employee expenses down 30bp..
Staff Cost (%)
4.6
10.6
4.9
5.1
5.7
5.2
5.0
5.3
4.7
4.9
11.5
Source: Company, MOSL
9 May 2016
2

Hindustan Unilever
Exhibit 7: …other expenses were also down 40bp YoY…
Other expenditure (%)
16.4
15.1
15.5
15.2
15.1
17.0
15.7
15.8
14.7
19.3
17.3
18.4
Exhibit 8:
..which led to EBITDA margin expansion of 180bp
EBITDA margin (%)
19.1
20.1
17.9
17.6
20.1
21.9
Source: Company, MOSL
Exhibit 9: Segmental growth
Segmental Reported Sales Growth (%)
Home care
Personal care
Refreshment
Foods
Domestic Consumer
1QFY17
7.0
2.0
5.0
4.0
4.0
2QFY17
4.0
(1.0)
8.0
2.0
2.0
3QFY17
1.0
(3.0)
8.0
1.0
0.0
4QFY17
8.0
8.0
11.0
2.0
8.0
1QFY18
6.0
3.0
11.0
4.0
6.0
Note: Sales growth=Segment t/o growth excluding other operational income; Excludes impact of A&D
Source: Company, MOSL
Exhibit 10: Segmental EBIT
Segmental EBIT margin (%)
- Home Care
- Personal Care
- Foods
- Refreshments
- Others (includes Exports, Infant & Feminine Care Products, etc)
Total
1QFY17
12.4
24.2
6.2
15.8
(4.6)
17.9
2QFY17
10.1
22.9
4.9
14.8
4.2
16.5
3QFY17
8.7
23.1
9.4
14.7
(8.5)
16.1
4QFY17
12.9
24.1
9.5
16.8
(2.0)
18.2
1QFY18
14.7
24.7
14.4
18.9
(3.6)
19.7
YoY
change
2.3
0.5
8.2
3.1
1.1
1.8
QoQ
change
1.8
0.6
4.9
2.1
(1.6)
1.5
Source: Company, MOSL
Exhibit 11: Innovations in the portfolio during the quarter
Source: Company, MOSL
9 May 2016
3

Hindustan Unilever
Concall highlights
GST impact
GST implementation from the company’s side was very smooth from 1 July.
Personal Care and Foods were affected by absence of CSD offtake.
Absence of CSD offtake from the beginning of June affected sales by 2% for the
quarter.
CSD offtake has not improved so far this month as well. However, it is gradually
picking up in a few depots; management expects further pick-up over the next
few days.
Trade pipeline remains thin, particularly on wholesale channel and small
retailers – while the latter won’t be affected as they are not under purview of
GST in terms of scale, there is substantial confusion which has affected their
operations, something that the company is looking to clear up soon.
GST accounting – GST will be netted off from sales. This will lead to lower sales,
but EBITDA will remain the same. Operating margins will therefore be higher.
Pipeline thinning was partly deliberate ahead of GST implementation in
products where they were likely to take price reductions (viz., soaps,
toothpastes, detergent bars and hair oils).
Like demonetization, North and Central India taking longer to recover due to
higher wholesale presence.
Good progress being made on direct reach to pick-up slack from wholesale
slowdown.
Management expectations
Expect gradual improvement in rural demand. This is due to:
Water table improvement recently compared to preceding years.
Demonetization had affected agri realizations last year, resulting in a weak
base last year.
Government schemes to boost rural growth.
Employment generation likely due to implementation of affordable housing.
Expect input costs to remain stable.
Expect up-stocking in the next few months. Pick-up already being witnessed in
non-wholesale channel.
Expect organized wholesale players like Walmart and Metro to be much larger
going forward as they pick up some slack from challenges facing wholesale.
Price growth extent will moderate, and volume growth will increase.
Margins
Expect end-to-end savings of 6% of turnover; partly already being witnessed;
will use part of it to fund growth.
Aiming to attain significant savings in each cost item over the next few years.
Margin growth and volume-led sale growth will both be in tandem and not at
the cost of each other.
New launches/re-launches/ product highlights
Fair and Lovely re-launch very well received.
Launched 12 SKUs under new herbal care brand ‘Citra’ under the face care
category
9 May 2016
4

Hindustan Unilever
Lever Ayush now being rolled out nationally.
Extending Axe into the male grooming segment, with shaving gels and shaving
creams.
Wheel did well during the quarter.
Bars as proportion of wash category is still ~40%.
Oral care performance was subdued. Its CSD relevance is also high, affecting
sales.
Valuation and view
HUL has all the levers in place for earnings revival, especially when the ongoing
good monsoon is allied with benefits of low base of preceding years, return of
price part of sales growth, lower promotion spends, continuing premiumization
and various government schemes (DBT implementation, 24% increase in rural
outlay in the budget, farm loan waiver in Uttar Pradesh, etc.).
Consequently, we expect EPS CAGR of 18% over FY17-FY19, well above 3-year/5-
year/10-year EPS CAGR of 6.1%/10.6%/10.1%. Return ratios and dividend yield
are best-of-breed.
We maintain target multiple of 45x FY19E June 2019 EPS (5% premium to 3-year
average), resulting in a target price of INR1,285. Maintain
Buy.
Exhibit 12: We change our estimates upward by ~1% for FY18/FY19
New
Sales
EBITDA
PAT
FY18E
352,709
70,488
49,647
FY19E
399,818
83,513
59,182
FY18E
354,778
69,997
49,312
Old
FY19E
402,179
82,323
58,367
FY18E
-0.6%
0.7%
0.7%
Change
FY19E
-0.6%
1.4%
1.4%
Source: Company, MOSL
Exhibit 13: HUVR P/E (x)
55.0
45.0
35.0
25.0
15.0
18.7
31.9
PE (x)
Peak(x)
Avg(x)
49.4
Min(x)
45.4
Exhibit 14: Significant P/E premium v/s Sensex
200
150
100
50
0
-50
86.8
Hind. Unilever PE Relative to Sensex PE (%)
LPA (%)
143.2
Source: Bloomberg, Company, MOSL
9 May 2016
5

Hindustan Unilever
Exhibit 15: Valuation Matrix
Company
Consumer
Asian Paints
Britannia Inds.
Colgate-Palm.
Dabur India
Emami
Godrej Cons.
Hind. Unilever
ITC
Jyothy Lab.
Marico
Nestle India
P & G Hygiene
Page Industries
Pidilite Inds.
United Spirits
Retail
Jubilant Food.
Titan Company
Sell
1,326
850
545
-36
3
84
473
1.3
7.3
-32.1
18.5
48.0
13.8
40.0
18.2
132.5
58.4
89.5
51.4
64.0
43.4
8.2
20.6
0.2
0.5
Neutral 528
Neutral 1,146
Buy
Buy
Buy
3,743
1,073
1,060
5,429
1,158
1,240
4,450
1,335
315
1,265
930
4,500
1,285
280
405
360
5,990
9,082
240
835
850
2,415
8
19
24
5
19
-3
-17
11
-2
10
9
-13
13
14
2
2
4
-12
1,080
443
291
533
243
658
231
2,494
3,957
66
421
662
261
189
20
414
217
400
16.8
6.9
4.5
8.3
3.8
10.2
3.6
38.8
61.5
1.0
6.6
10.3
4.1
2.9
0.3
6.4
3.4
6.2
8.7
7.3
-5.7
1.9
4.5
12.4
0.9
1.9
9.4
175.7
12.1
-1.6
11.5
15.0
-46.4
6.7
-23.0
87.1
10.0
16.0
20.8
6.7
6.6
15.4
6.5
16.8
10.4
-20.4
10.5
0.6
7.5
32.8
106.4
10.2
11.6
39.7
18.6
23.3
21.1
18.3
20.0
14.6
9.3
19.2
11.4
22.4
21.1
17.6
16.6
26.2
64.7
14.8
51.9
38.7
54.5
50.8
50.5
41.5
40.0
50.6
34.8
59.0
33.9
32.9
52.3
58.2
55.3
70.5
65.3
48.7
94.4
102.2
49.6
43.8
41.8
38.9
37.5
43.8
32.6
50.5
30.7
41.3
47.4
57.8
51.4
53.1
31.7
44.2
84.6
73.1
41.8
35.5
34.5
32.9
31.3
38.3
29.8
42.3
27.5
33.7
39.1
49.2
44.1
42.1
19.2
38.5
55.7
52.7
28.5
36.9
50.4
28.4
35.8
24.6
22.2
65.6
23.5
21.1
36.7
39.0
45.3
40.0
5.9
28.2
10.4
21.3
1.0
0.6
0.9
0.8
0.8
0.6
1.0
1.5
2.0
1.6
0.9
0.9
4.5
0.5
0.0
0.6
0.1
0.0
Reco
CMP
(INR)
Target
Price
Mkt Cap
(INR) Upside (%) INR B USD B
EPS Growth YoY (%)
FY17 FY18E FY19E FY17
P/E (x)
FY18E
FY19E
RoE
(%)
FY17
Div.
(%)
FY17
Neutral 301
Neutral 956
Buy
GlaxoSmith C H L Sell
Neutral 285
Neutral 369
Neutral 329
Sell
Buy
Buy
6,862
8,010
16,825 19,125
Parag Milk Foods Neutral 235
Neutral 815
Neutral 2,731
United Breweries Neutral 821
Source: Company, MOSL
9 May 2016
6

Hindustan Unilever
Financials and valuations
Income Statement
Y/E March
Net Sales
Other Oper. Income
Total Revenue
Change (%)
COGS
Gross Profit
Gros Margin (%)
Operating Exp
% of sales
EBIDTA
Change (%)
Margin (%)
Depreciation
Int. and Fin. Charges
Other Income - Recurring
Profit before Taxes
Change (%)
Margin (%)
Tax
Deferred Tax
Tax Rate (%)
Profit after Taxes
Change (%)
Margin (%)
Non-rec. (Exp)/Income
Reported PAT
FY14
274,083
6,108
280,191
8.6
143,436
136,755
48.8
92,003
32.8
44,753
11.8
16.0
2,606
360
6,210
47,997
10.4
17.5
12,196
248
25.9
35,553
11.5
13.0
3,122
38,675
FY15
301,705
6,351
308,056
9.9
156,236
151,821
49.3
99,738
32.4
52,082
16.4
16.9
2,867
168
6,184
55,231
15.1
18.3
19,060
-338
33.9
36,510
2.7
12.1
6,643
43,153
FY16
304,990
5,619
310,609
0.8
153,053
157,556
50.7
100,070
32.2
57,487
10.4
18.5
3,208
150
5,640
59,769
8.2
19.6
18,160
-70
30.3
41,679
14.2
13.7
-310
41,369
FY17
312,980
5,920
318,900
2.7
156,850
162,050
50.8
101,580
31.9
60,470
5.2
19.0
3,960
220
5,260
61,550
3.0
19.7
18,650
410
31.0
42,490
1.9
13.6
2,410
44,900
FY18E
346,197
6,512
352,709
10.6
170,775
181,934
51.6
111,447
31.6
70,488
16.6
20.0
4,611
242
5,800
71,434
16.1
20.6
21,287
500
30.5
49,647
16.8
14.3
0
49,647
(INR Million)
FY19E
392,655
7,163
399,818
13.4
190,791
209,028
52.3
125,514
31.4
83,513
18.5
20.9
4,818
242
6,700
85,154
19.2
21.7
25,376
596
30.5
59,182
19.2
15.1
0
59,182
FY20E
445,579
7,880
453,458
13.4
214,336
239,123
52.7
141,929
31.3
97,194
16.4
21.4
4,958
242
7,308
99,302
16.6
22.3
29,592
695
30.5
69,015
16.6
15.5
0
69,015
Balance Sheet
Y/E March
Share Capital
Reserves
Net Worth
Capital Employed
Gross Block
Less: Accum. Depn.
Net Fixed Assets
Capital WIP
Investment in Subsidiaries
Current Investments
Deferred Charges
Curr. Assets, L&A
Inventory
Account Receivables
Cash and Bank Balance
Others
Curr. Liab. and Prov.
Account Payables
Other Liabilities
Provisions
Net Current Assets
Application of Funds
E: MOSL Estimates
9 May 2016
FY14
2,163
30,608
32,771
32,771
41,706
-17,409
24,298
3,121
6,362
24,580
1,617
70,007
27,475
8,164
22,210
12,158
97,214
49,115
30,558
17,540
-27,206
32,771
0
(INR Million)
FY15
2,164
35,084
37,248
37,248
44,306
-19,731
24,575
4,790
6,541
26,238
1,960
72,236
26,027
7,829
25,376
13,005
99,093
48,515
29,828
20,749
-26,857
37,248
0
FY16
2,164
60,627
62,791
62,791
50,774
-21,627
29,147
3,860
3,190
24,606
1,680
76,509
25,284
10,645
27,590
12,990
76,201
54,980
12,381
8,840
308
62,791
0
FY17
2,164
64,489
66,653
66,653
65,827
-25,587
40,240
2,030
2,540
35,190
1,600
65,130
23,620
9,280
16,710
15,520
80,077
60,060
11,297
8,720
-14,947
66,653
0
FY18E
2,164
66,960
69,124
69,124
67,827
-30,198
37,629
2,030
2,540
35,690
1,600
72,587
29,589
12,257
14,721
16,020
82,952
60,851
12,427
9,674
-10,365
69,124
0
FY19E
2,164
71,645
73,809
73,809
69,827
-35,016
34,811
2,030
2,540
37,690
1,600
94,879
30,979
13,902
30,340
19,658
99,740
75,229
13,669
10,842
-4,862
73,809
0
FY20E
2,164
81,164
83,328
83,328
71,827
-39,974
31,853
2,030
2,540
39,690
1,600
112,130
35,154
15,776
40,879
20,321
106,516
79,382
15,036
12,098
5,614
83,327
0
7

Hindustan Unilever
Financials and valuations
Ratios
Y/E March
Basic (INR)
EPS
Cash EPS
BV/Share
DPS
Payout %
Valuation (x)
P/E
Cash P/E
EV/Sales
EV/EBITDA
P/BV
Dividend Yield (%)
Return Ratios (%)
RoE
RoCE
RoIC
Working Capital Ratios
Debtor (Days)
Asset Turnover (x)
Leverage Ratio
Debt/Equity (x)
FY14
16.4
17.6
15.2
13.0
79.1
439
FY15
16.9
18.2
17.2
15.0
88.9
501
FY16
19.3
20.7
29.0
16.0
83.1
511
FY17
19.6
21.5
30.8
17.0
86.6
597
FY18E
22.9
25.1
31.9
19.5
85.0
711
FY19E
27.3
29.6
34.1
23.5
85.9
829
FY20E
31.9
34.2
38.5
23.5
73.7
70.5
65.6
9.0
55.3
76.4
1.1
68.6
63.6
8.2
47.5
67.3
1.3
60.1
55.8
8.1
43.1
39.9
1.4
59.0
54.0
7.9
41.1
37.6
1.5
50.5
46.2
7.2
35.3
36.3
1.7
42.3
39.2
6.3
29.6
34.0
2.0
36.3
33.9
5.5
25.3
30.1
2.0
119.5
141.6
1,947.5
11
8.4
104.3
140.6
4,018.2
9
8.1
83.3
108.5
263.8
13
4.9
65.6
87.3
106.1
11
4.7
73.1
97.0
96.2
13
5.0
82.8
110.1
123.3
13
5.3
87.8
117.4
167.0
13
5.3
0.0
0.0
0.0
0.0
0.0
0.0
0.0
Cash Flow Statement
Y/E March
OP/(loss) before Tax
Int./Div. Received
Depreciation
Interest Paid
Direct Taxes Paid
(Incr)/Decr in WC
CF from Operations
Extraordinary Items
(Incr)/Decr in FA
Free Cash Flow
(Pur)/Sale of Investments
CF from Invest.
Change in Networth
change in equity
change in reserves
Dividend Paid
Others
CF from Fin. Activity
Incr/Decr of Cash
Add: Opening Balance
Closing Balance
E: MOSL Estimates
FY14
47,997
-6,210
2,606
360
-12,196
8,638
41,195
3,122
-3,981
37,213
-7,635
-8,494
85
0
85
-32,730
5,075
-27,570
5,131
17,079
22,210
FY15
55,231
-6,184
2,867
168
-19,060
2,816
35,839
6,643
-4,269
31,569
-1,838
536
137
1
136
-38,812
5,467
-33,208
3,166
22,210
25,376
FY16
59,769
-5,640
3,208
150
-18,160
-24,950
14,377
-310
-5,537
8,839
4,983
-864
25,752
0
25,752
-41,578
4,528
-11,298
2,214
25,376
27,590
FY17
61,550
-5,260
3,960
220
-18,650
4,375
46,195
2,410
-13,223
32,972
-9,934
-20,747
2,002
0
2,002
-43,040
4,710
-36,328
-10,880
27,590
16,710
FY18E
71,434
-5,800
4,611
242
-21,287
-6,571
42,629
0
-2,000
40,629
-500
-2,500
2,193
0
2,193
-49,369
5,058
-42,118
-1,989
16,710
14,721
(INR Million)
FY19E
85,154
-6,700
4,818
242
-25,376
10,116
68,254
0
-2,000
66,254
-2,000
-4,000
5,000
0
5,000
-59,496
5,862
-48,634
15,619
14,721
30,340
FY20E
99,302
-7,308
4,958
242
-29,592
63
67,665
0
-2,000
65,665
-2,000
-4,000
0
0
0
-59,496
6,370
-53,126
10,539
30,340
40,879
9 May 2016
8

Hindustan Unilever
Corporate profile
Company description
HUL is the largest company in the FMCG industry,
with market leadership in soaps, detergents and
personal care categories. The
company is a
subsidiary of Anglo Dutch FMCG giant Unilever. It
has over 35 brand spanning 20 distinct categories;
the company is a part of the everyday life of
millions of consumers across India. It has strong
brands, with market leadership in most of the
categories it operates in. It has a large distribution
network with direct reach of over 1m retail outlets.
Exhibit 1: Sensex rebased
Source: MOSL/Bloomberg
Exhibit 2: Shareholding pattern (%)
Mar-17
Promoter
DII
FII
Others
67.2
5.7
13.3
13.9
Dec-16
67.2
5.8
13.1
13.9
Mar-16
67.2
4.8
14.2
13.8
Source: Capitaline
Exhibit 3: Top holders
Holder Name
LIC of India
NA
NA
NA
NA
% Holding
1.9
0.0
0.0
0.0
0.0
Source: Capitaline
Note: FII Includes depository receipts
Exhibit 4: Top management
Name
Harish Manwani
Sanjiv Mehta
P B Balaji
Dev Bajpai
Designation
Chairman
Managing Director & CEO
ED (Finance & IT) and CFO
Company Secretary
Exhibit 5: Directors
Name
Aditya Narayan
O P Bhatt
Sanjiv Misra
Name
Kalpana Morparia
S Ramadorai
Pradeep Banerjee
Source: Capitaline
*Independent
Exhibit 6: Auditors
Name
BSR & Co LLP
RA & Co
Type
Statutory
Cost Auditor
Exhibit 7: MOSL forecast v/s consensus
EPS
(INR)
FY18
FY19
FY20
MOSL
forecast
22.9
27.3
31.9
Consensus
forecast
23.0
26.4
31.0
Variation (%)
-0.5
3.3
2.8
Source: Bloomberg
Source: Capitaline
9 May 2016
9

Disclosures
This document has been prepared by Motilal Oswal Securities Limited (hereinafter referred to as Most) to provide information about the company (ies) and/sector(s), if any, covered in the report and may be distributed by it
and/or its affiliated company(ies). This report is for personal information of the selected recipient/s and does not construe to be any investment, legal or taxation advice to you. This research report does not constitute an
offer, invitation or inducement to invest in securities or other investments and Motilal Oswal Securities Limited (hereinafter referred as MOSt) is not soliciting any action based upon it. This report is not for public distribution
and has been furnished to you solely for your general information and should not be reproduced or redistributed to any other person in any form. This report does not constitute a personal recommendation or take into
account the particular investment objectives, financial situations, or needs of individual clients. Before acting on any advice or recommendation in this material, investors should consider whether it is suitable for their
particular circumstances and, if necessary, seek professional advice. The price and value of the investments referred to in this material and the income from them may go down as well as up, and investors may realize losses
on any investments. Past performance is not a guide for future performance, future returns are not guaranteed and a loss of original capital may occur.
MOSt and its affiliates are a full-service, integrated investment banking, investment management, brokerage and financing group. We and our affiliates have investment banking and other business relationships with a some
companies covered by our Research Department. Our research professionals may provide input into our investment banking and other business selection processes. Investors should assume that MOSt and/or its affiliates are
seeking or will seek investment banking or other business from the company or companies that are the subject of this material and that the research professionals who were involved in preparing this material may educate
investors on investments in such business . The research professionals responsible for the preparation of this document may interact with trading desk personnel, sales personnel and other parties for the purpose of
gathering, applying and interpreting information. Our research professionals are paid on twin parameters of performance & profitability of MOSt.
MOSt generally prohibits its analysts, persons reporting to analysts, and members of their households from maintaining a financial interest in the securities or derivatives of any companies that the analysts cover.
Additionally, MOSt generally prohibits its analysts and persons reporting to analysts from serving as an officer, director, or advisory board member of any companies that the analysts cover. Our salespeople, traders, and
other professionals or affiliates may provide oral or written market commentary or trading strategies to our clients that reflect opinions that are contrary to the opinions expressed herein, and our proprietary trading and
investing businesses may make investment decisions that are inconsistent with the recommendations expressed herein. In reviewing these materials, you should be aware that any or all of the foregoing among other things,
may give rise to real or potential conflicts of interest. MOSt and its affiliated company(ies), their directors and employees and their relatives may; (a) from time to time, have a long or short position in, act as principal in, and
buy or sell the securities or derivatives thereof of companies mentioned herein. (b) be engaged in any other transaction involving such securities and earn brokerage or other compensation or act as a market maker in the
financial instruments of the company(ies) discussed herein or act as an advisor or lender/borrower to such company(ies) or may have any other potential conflict of interests with respect to any recommendation and other
related information and opinions.; however the same shall have no bearing whatsoever on the specific recommendations made by the analyst(s), as the recommendations made by the analyst(s) are completely independent
of the views of the affiliates of MOSt even though there might exist an inherent conflict of interest in some of the stocks mentioned in the research report
Reports based on technical and derivative analysis center on studying charts company's price movement, outstanding positions and trading volume, as opposed to focusing on a company's fundamentals and, as such, may not match with a report on a
company's fundamental analysis. In addition MOST has different business segments / Divisions with independent research separated by Chinese walls catering to different set of customers having various objectives, risk profiles, investment horizon,
etc, and therefore may at times have different contrary views on stocks sectors and markets.
Unauthorized disclosure, use, dissemination or copying (either whole or partial) of this information, is prohibited. The person accessing this information specifically agrees to exempt MOSt or any of its affiliates or employees
from, any and all responsibility/liability arising from such misuse and agrees not to hold MOSt or any of its affiliates or employees responsible for any such misuse and further agrees to hold MOSt or any of its affiliates or
employees free and harmless from all losses, costs, damages, expenses that may be suffered by the person accessing this information due to any errors and delays. The information contained herein is based on publicly
available data or other sources believed to be reliable. Any statements contained in this report attributed to a third party represent MOSt’s interpretation of the data, information and/or opinions provided by that third party
either publicly or through a subscription service, and such use and interpretation have not been reviewed by the third party. This Report is not intended to be a complete statement or summary of the securities, markets or
developments referred to in the document. While we would endeavor to update the information herein on reasonable basis, MOSt and/or its affiliates are under no obligation to update the information. Also there may be
regulatory, compliance, or other reasons that may prevent MOSt and/or its affiliates from doing so. MOSt or any of its affiliates or employees shall not be in any way responsible and liable for any loss or damage that may
arise to any person from any inadvertent error in the information contained in this report. MOSt or any of its affiliates or employees do not provide, at any time, any express or implied warranty of any kind, regarding any
matter pertaining to this report, including without limitation the implied warranties of merchantability, fitness for a particular purpose, and non-infringement. The recipients of this report should rely on their own
investigations.
This report is intended for distribution to institutional investors. Recipients who are not institutional investors should seek advice of their independent financial advisor prior to taking any investment decision based on this
report or for any necessary explanation of its contents.
Most and it’s associates may have managed or co-managed public offering of securities, may have received compensation for investment banking or merchant banking or brokerage services, may have received any
compensation for products or services other than investment banking or merchant banking or brokerage services from the subject company in the past 12 months.
Most and it’s associates have not received any compensation or other benefits from the subject company or third party in connection with the research report.
Subject Company may have been a client of Most or its associates during twelve months preceding the date of distribution of the research report
MOSt and/or its affiliates and/or employees may have interests/positions, financial or otherwise of over 1 % at the end of the month immediately preceding the date of publication of the research in the securities mentioned
in this report. To enhance transparency, MOSt has incorporated a Disclosure of Interest Statement in this document. This should, however, not be treated as endorsement of the views expressed in the report.
Motilal Oswal Securities Limited is registered as a Research Analyst under SEBI (Research Analyst) Regulations, 2014. SEBI Reg. No. INH000000412
Pending Regulatory inspections against Motilal Oswal Securities Limited:
SEBI pursuant to a complaint from client Shri C.R. Mohanraj alleging unauthorized trading, issued a letter dated 29th April 2014 to MOSL notifying appointment of an Adjudicating Officer as per SEBI regulations to hold inquiry
and adjudge violation of SEBI Regulations; MOSL replied to the Show Cause Notice whereby SEBI granted us an opportunity of Inspection of Documents. Since all the documents requested by us were not covered we have
requested to SEBI vide our letter dated June 23, 2015 to provide pending list of documents for inspection.
List of associate companies of Motilal Oswal Securities Limited -Click
here to access detailed report
Analyst Certification
The views expressed in this research report accurately reflect the personal views of the analyst(s) about the subject securities or issues, and no part of the compensation of the research analyst(s) was, is, or will be directly or
indirectly related to the specific recommendations and views expressed by research analyst(s) in this report. The research analysts, strategists, or research associates principally responsible for preparation of MOSt research
receive compensation based upon various factors, including quality of research, investor client feedback, stock picking, competitive factors and firm revenues
Hindustan Unilever
Disclosure of Interest Statement
Analyst ownership of the stock
Served as an officer, director or employee -
HINDUSTAN UNILEVER
No
No
A graph of daily closing prices of securities is available at www.nseindia.com and http://economictimes.indiatimes.com/markets/stocks/stock-quotes
Regional Disclosures (outside India)
This report is not directed or intended for distribution to or use by any person or entity resident in a state, country or any jurisdiction, where such distribution, publication, availability or use would be contrary to law,
regulation or which would subject MOSt & its group companies to registration or licensing requirements within such jurisdictions.
For Hong Kong:
This report is distributed in Hong Kong by Motilal Oswal capital Markets (Hong Kong) Private Limited, a licensed corporation (CE AYY-301) licensed and regulated by the Hong Kong Securities and Futures
Commission (SFC) pursuant to the Securities and Futures Ordinance (Chapter 571 of the Laws of Hong Kong) “SFO”. As per SEBI (Research Analyst Regulations) 2014 Motilal Oswal Securities (SEBI Reg No. INH000000412) has
an agreement with Motilal Oswal capital Markets (Hong Kong) Private Limited for distribution of research report in Kong Kong. This report is intended for distribution only to “Professional Investors” as defined in Part I of
Schedule 1 to SFO. Any investment or investment activity to which this document relates is only available to professional investor and will be engaged only with professional investors.” Nothing here is an offer or solicitation
of these securities, products and services in any jurisdiction where their offer or sale is not qualified or exempt from registration. The Indian Analyst(s) who compile this report is/are not located in Hong Kong & are not
conducting Research Analysis in Hong Kong.
For U.S.
Motilal Oswal Securities Limited (MOSL) is not a registered broker - dealer under the U.S. Securities Exchange Act of 1934, as amended (the"1934 act") and under applicable state laws in the United States. In addition MOSL is
not a registered investment adviser under the U.S. Investment Advisers Act of 1940, as amended (the "Advisers Act" and together with the 1934 Act, the "Acts), and under applicable state laws in the United States.
Accordingly, in the absence of specific exemption under the Acts, any brokerage and investment services provided by MOSL, including the products and services described herein are not available to or intended for U.S.
persons.
This report is intended for distribution only to "Major Institutional Investors" as defined by Rule 15a-6(b)(4) of the Exchange Act and interpretations thereof by SEC (henceforth referred to as "major institutional investors").
This document must not be acted on or relied on by persons who are not major institutional investors. Any investment or investment activity to which this document relates is only available to major institutional investors
and will be engaged in only with major institutional investors. In reliance on the exemption from registration provided by Rule 15a-6 of the U.S. Securities Exchange Act of 1934, as amended (the "Exchange Act") and
interpretations thereof by the U.S. Securities and Exchange Commission ("SEC") in order to conduct business with Institutional Investors based in the U.S., MOSL has entered into a chaperoning agreement with a U.S.
registered broker-dealer, Motilal Oswal Securities International Private Limited. ("MOSIPL"). Any business interaction pursuant to this report will have to be executed within the provisions of this chaperoning agreement.
The Research Analysts contributing to the report may not be registered /qualified as research analyst with FINRA. Such research analyst may not be associated persons of the U.S. registered broker-dealer, MOSIPL, and
therefore, may not be subject to NASD rule 2711 and NYSE Rule 472 restrictions on communication with a subject company, public appearances and trading securities held by a research analyst account.
For Singapore
Motilal Oswal Capital Markets Singapore Pte Limited is acting as an exempt financial advisor under section 23(1)(f) of the Financial Advisers Act(FAA) read with regulation 17(1)(d) of the Financial Advisors Regulations and is a
subsidiary of Motilal Oswal Securities Limited in India. This research is distributed in Singapore by Motilal Oswal Capital Markets Singapore Pte Limited and it is only directed in Singapore to accredited investors, as defined in
the Financial Advisers Regulations and the Securities and Futures Act (Chapter 289), as amended from time to time.
In respect of any matter arising from or in connection with the research you could contact the following representatives of Motilal Oswal Capital Markets Singapore Pte Limited:
Varun Kumar
Varun.kumar@motilaloswal.com
Contact : (+65) 68189232
Office Address:21 (Suite 31),16 Collyer Quay,Singapore 04931
Motilal Oswal Securities Ltd
9 May 2016
Motilal Oswal Tower, Level 9, Sayani Road, Prabhadevi, Mumbai 400 025
Phone: +91 22 3982 5500 E-mail: reports@motilaloswal.com
10