19 July 2017
1QFY18 Results Update | Sector: Media
HT Media
Neutral
BSE SENSEX
31,955
S&P CNX
9,900
CMP: INR88
TP: INR90 (+2%)
Motilal Oswal values your support in the
Asiamoney Brokers Poll 2017 for India
Research, Sales and Trading team. We
request your ballot.
GST impacts ad growth, cost efficiencies lead to margin beat
Maintain EPS estimates and TP
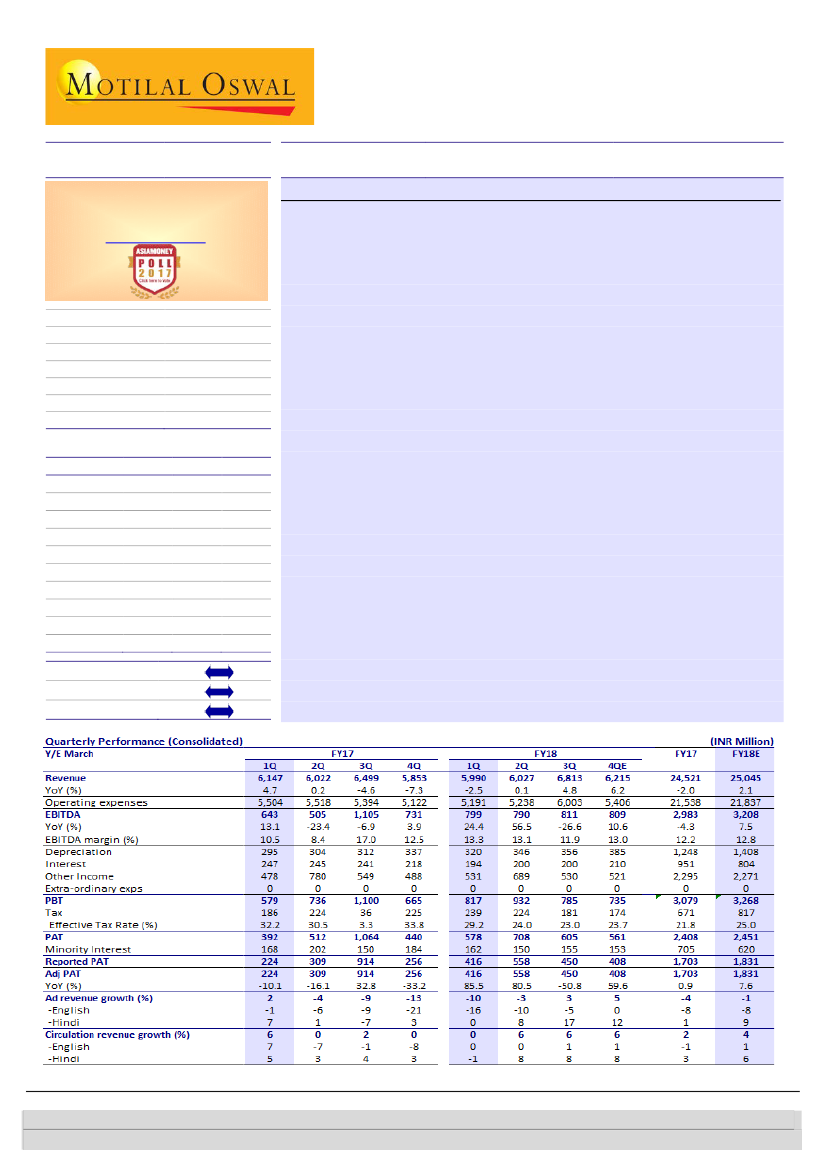
EBITDA up 24%, above estimate; PAT nearly doubles:
EBITDA rose 24% YoY
to INR799m, 21% above our estimate of INR657m, despite the revenue
disappointment, as HT Media’s cost-efficiency efforts bore fruit. Opex levers
more than cushioned the impact of subdued ad/circulation performance.
PAT grew 86% YoY to INR416m, significantly above our estimate of
INR236m, largely due to EBITDA beat flowing through.
Print ad and circulation growth disappoints:
Revenue fell 3% YoY to
INR5.99b (est. of INR6.24b). Ad revenue declined 10% YoY to INR4.07b (est.
of INR4.5b) as volumes were impacted in the month leading to GST roll-out.
English ad revenue fell 16% YoY to INR2.29b, while Hindi ad revenue
remained flat YoY at INR1.78b (4% miss). Circulation revenue remained flat
YoY at INR770m (est. of INR800m). Radio revenue grew 30% YoY to
INR430m (est. of INR398m), mainly on increased inventory sale from new
radio station launches and also growth in existing stations. Like-to-like radio
business growth fell 7% YoY (new stations contributed INR120m in 1Q).
EBITDA margin expands ~290bp YoY, significant beat:
Despite the GST
impact (which put brakes on ad/circulation growth), HTML more than
salvaged margins (+290bp YoY) to 13.3% (est. of 10.5%), as its cost-efficiency
drive across all opex items helped it report healthy margin expansion.
Valuation and view:
While 1Q profitability remained healthy due to cost
efficiencies, the ad pain continues (66% of revenue). While we remain
positive on the regional business, sluggish English ad growth and low
dividend payout remain the key concerns. We maintain our earnings
estimates and
Neutral
stance with a target price of INR90 (11x FY19E EPS).
Bloomberg
Equity Shares (m)
M.Cap.(INRb)/(USDb)
52-Week Range (INR)
1, 6, 12 Rel. Per (%)
Avg Val, INRm
Free float (%)
Financials & Valuations (INR b)
2017 2018E
Y/E Mar
Net Sales
24.5
25.0
EBITDA
3.0
3.2
PAT
1.7
1.8
EPS (INR)
7.4
7.9
Gr. (%)
2.1
7.0
BV/Sh (INR)
109.8
120.1
RoE (%)
7.1
6.9
RoCE (%)
8.5
8.2
P/E (x)
11.9
11.1
P/BV (x)
0.8
0.7
HTML IN
233
19.2 / 0.3
96 / 70
5/-10/-5
23
30.5
2019E
26.3
3.1
1.9
8.1
1.5
130.4
6.4
8.1
11.0
0.7
Estimate change
TP change
Rating change
Investors are advised to refer through important disclosures made at the last page of the Research Report.
Motilal Oswal research is available on www.motilaloswal.com/Institutional-Equities, Bloomberg, Thomson Reuters, Factset and S&P Capital.
Jay Gandhi
(Jay.Gandhi@MotilalOswal.com); +91 22 6129 1546
Aliasgar Shakir
(Aliasgar.Shakir@motilaloswal.com); +91 022 3982 5423