20 July 2017
Motilal Oswal values your support in the
Asiamoney Brokers Poll 2017 for India
Research, Sales and Trading team.
We
request your ballot.
Today’s top research idea
L&T Finance (Initiating Coverage): Focused approach
Strong execution toward stated goals to boost profitability; Buy with TP of
INR180, 20% Upside
v
LTFH is a quintessential turnaround story, in our view. From a company with
20+ product lines and sub-standard return ratios, it is gradually transforming
itself to a focused financier with eight product lines across three verticals,
with a target to achieve 18-20% RoE by FY20 (~12% in FY17).
v
LTFH is one of the market leaders in many of the segments it operates in. A
well-diversified book, strong growth, and a decline in expense ratio and credit
costs should elevate RoA/RoE from 1.5%/12.4% in FY17 to 2.3%/19.2% in
FY20. While the stock has re-rated well over the past year due to strong
execution by management, we expect re-rating to continue. We thus initiate
coverage on LTHF with a Buy rating and TP of INR180 (3.0x FY19E BVPS).
Market snapshot
Equities - India
Close
Chg .%
Sensex
31,955
0.8
Nifty-50
9,900
0.7
Nifty-M 100
18,344
0.7
Equities-Global
Close
Chg .%
S&P 500
2,474
0.5
Nasdaq
6,385
0.6
FTSE 100
7,431
0.6
DAX
12,452
0.2
Hang Seng
10,861
1.0
Nikkei 225
20,021
0.1
Commodities
Close
Chg .%
Brent (US$/Bbl)
49
2.1
Gold ($/OZ)
1,240
0.2
Cu (US$/MT)
5,930
-0.7
Almn (US$/MT)
1,894
-0.6
Currency
Close
Chg .%
USD/INR
64.3
0.0
USD/EUR
1.2
-0.3
USD/JPY
112.1
-0.2
YIELD (%)
Close
1MChg
10 Yrs G-Sec
6.4
0.0
10 Yrs AAA Corp
7.5
0.0
Flows (USD b)
19-Jul
MTD
FIIs
0.2
0.2
DIIs
0.0
0.5
Volumes (INRb)
19-Jul
MTD*
Cash
325
281
F&O
5,448
5,145
Note: YTD is calendar year, *Avg
YTD.%
20.0
20.9
27.8
YTD.%
10.5
18.6
4.0
8.5
15.6
4.7
YTD.%
-11.3
6.9
7.4
11.2
YTD.%
-5.2
9.3
-4.3
YTDchg
-0.1
-0.1
YTD
8.7
3.7
YTD*
285
4,933
Research covered
Cos/Sector
L&T Finance
Tata Steel
Bajaj Finance
UltraTech Cement
Aurobindo Pharma
Havells India
Canara Bank
Sanofi India
Mindtree
KPIT Tech
H T Media
Hindustan Media
Key Highlights
Focused approach; Buy with TP of INR180, 20% Upside
EBITDA growth was offset by WC in FY17
Getting better by the day
Volumes disappointment offset by better pricing
Launch of niche product bodes well for near-term growth
Results meaningfully below estimates
Slippages remain elevated; One off gains help PPoP
Weak results; margin improvement is key
Dragged by acquisitions, top clients and standalone margins
Revenue beat led by one-time license fees; Margin disappoints
GST impacts ad growth, cost efficiencies lead to margin beat
GST-led pain impacts ad growth
ABB | Alembic Pharma | Bajaj Auto | DB Corp | Hind.Zinc | Kotak Mah.
Results Expectation
Bank | NIIT Tech | RBL Bank | Reliance Inds | Wipro | Zensar Tech
Piping hot news
Cabinet clears HPCL stake sale to ONGC, but combo entity falls short of
mega scale
v
State-run hydrocarbon producer ONGC will buy the government’s 51.1% stake
in public-sector oil refiner-cum-marketer HPCL ...
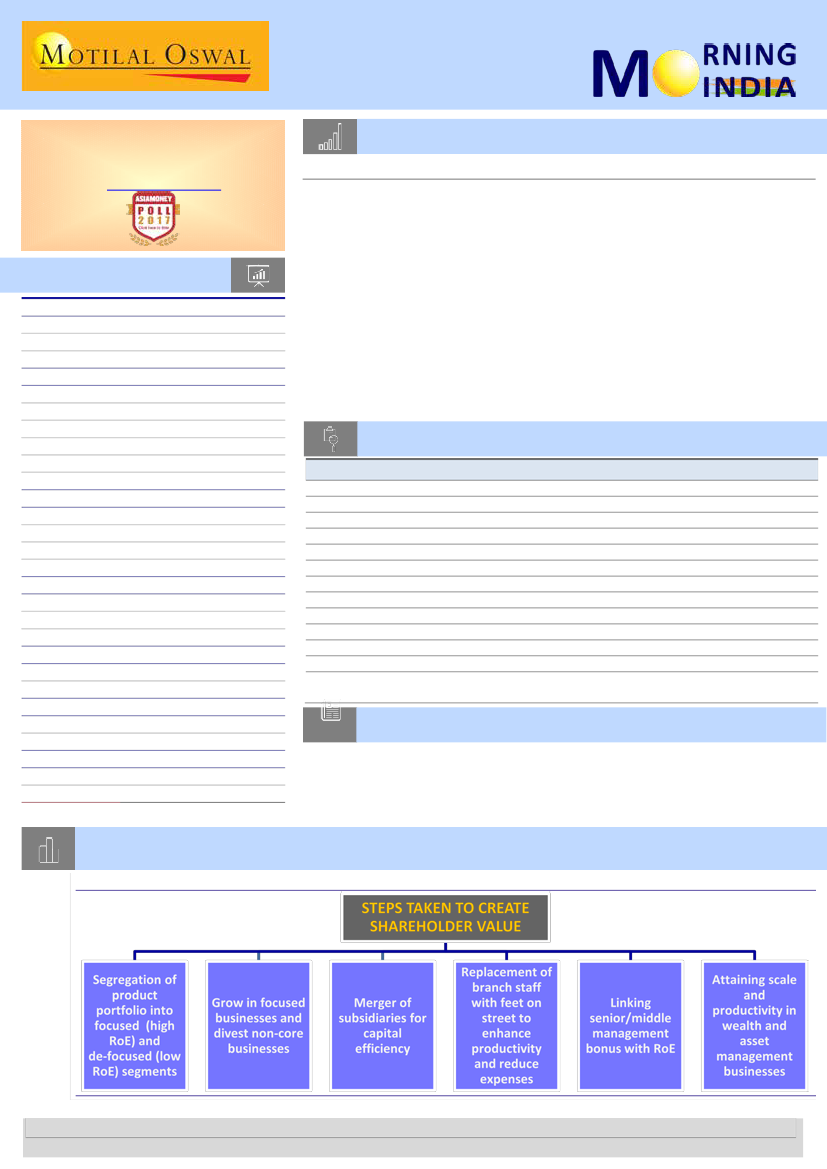
Chart of the Day: L&T Finance Holdings: Key changes introduced to drive shareholder value
Steps taken to enhancing shareholder value
Research Team (Gautam.Duggad@MotilalOswal.com)
Motilal Oswal research is available on www.motilaloswal.com/Institutional-Equities, Bloomberg, Thomson Reuters, Factset and S&P Capital.
Investors are advised to refer through important disclosures made at the last page of the Research Report.

In the news today
Kindly click on textbox for the detailed news link
1
Tata group is said to mull
moving most tech ops under
TCS
Tata group, the Indian
conglomerate that manages more
than 100 operating companies, is
weighing a plan to streamline its
technology and infrastructure
businesses, people with
knowledge of the matter said. …
2
Banks may have to take a haircut of Rs 2.4 lakh crore in order to resolve
the 50 largest stressed assets in the system, according to a report by Crisil.
These 50 assets have a cumulative debt of over Rs4.3 lakh crore and account
for about half the gross non-performing assets (NPAs) of the banking
sector. “The analysis shows these 50 large stressed assets may have to
take haircuts of ~60% at an aggregate level, to arrive at sustainable level of
debt,” the ratings agency said in the report on Wednesday...
Bad loans crisis: In shocking revelation, banks may take Rs 2.4 lakh
crore haircut just to resolve 50 top NPA accounts
3
The promoters of InterGlobe
Aviation Pvt. Ltd, which runs
IndiGo airlines, will reduce their
stake in the airline operator to
meet regulatory norms on
minimum public shareholding, the
company said on Wednesday…
IndiGo to pare promoter stake
to meet minimum public
shareholding norms
4
Bhushan Steel, Bhushan Power
insolvency cases: NCLT
reserves order; bench
questions need for RBI to step
in
5
Trai in undue haste to decide
on IUC: COAI
Telecom operators’ body Cellular
Operators Association of India
(COAI) has said the Telecom
Regulatory Authority of India
(Trai) is showing “undue haste” in
concluding the review of the
interconnect usage charge (IUC), a
key component of mobile tariffs,
and has urged the regulator to
provide the operators with the
past and current models used in
calculating the mobile termination
charges…
The New Delhi bench of the
National Company Law Tribunal
(NCLT) on Wednesday reserved
orders on two separate insolvency
petitions — State Bank of India
(SBI) versus Bhushan Steel and
Punjab National Bank…
6
The Tata group has informally
sought details on the planned
privatisation of Air India, a
government official said, reflecting
the group’s interest in the airline it
founded in 1932…
7
Chennai Metro Rail: Big boost
for Tamil Nadu infrastructure,
state to take up Rs 89,000 cr
phase II project
Tata group said to have sought
details of Air India
disinvestment
In what could be a big boost to the
state’s infrastructure, the Tamil
Nadu government has decided to
take up phase II of the Chennai
Metro Rail project, envisaging a
cost of Rs 88,897 crore...
20 July 2017
2

L&T Finance Holdings
BSE Sensex
31,955
S&P CNX
9,900
Initiating Coverage | Sector: Financials - NBFC
CMP: INR150
TP: INR180 (+20%)
Buy
Focused approach
Strong execution toward stated goals to boost profitability
n
L&T Finance Holdings (LTFH) is a quintessential turnaround story, in our view.
From a company with 20+ product lines and sub-standard return ratios, it is
gradually transforming itself to a focused financier with eight product lines across
three verticals, with a target to achieve 18-20% RoE by FY20 (~12% in FY17).
Stock Info
Bloomberg
Equity Shares (m)
52-Week Range (INR)
1, 6, 12 Rel. Per (%)
M.Cap. (INR b)
M.Cap. (USD b)
12M Avg Val (INR M)
Free float (%)
LTFH IN
1817.2
153/74
-1/38/85
272.6
4.1
644
33.4
n
The company has identified three segments to focus on – wholesale, housing and
rural finance, which comprise 62%, 19% and 15% of the total loan book,
respectively. While the rural and housing segments have already achieved 20%+
RoE, going forward, wholesale financing (RoE- FY17: 11%, FY20E: 16%) will be the
key driver of profitability improvement.
Financial Snapshot (INR b)
Y/E March
2017 2018E 2019E
NII
31.4
35.7 40.5
PPP
26.7
35.3 40.5
PAT
9.2
13.0 17.4
EPS (INR)
5.2
7.2
9.6
BV/Sh. INR
44.3
50.8 59.0
RoAA (%)
1.5
1.8
2.0
RoE (%)
12.4
15.3 17.5
Payout (%)
19.8
15.2 14.9
Valuation
P/E (x)
28.6
20.9 15.6
P/BV (x)
3.4
3.0
2.5
Div. Yld (%)
0.6
0.6
0.8
Shareholding pattern (%)
As On
Mar-17 Dec-16 Mar-16
66.6
66.7
66.7
Promoter
3.7
3.6
1.8
DII
11.3
10.1
8.8
FII
18.4
19.7
22.7
Others
FII Includes depository receipts
n
Strong growth and a decline in expense ratio and credit costs should elevate
RoA/RoE from 1.5%/12.4% in FY17 to 2.3%/19.2% in FY20. While the stock has re-
rated well over the past year on account of strong execution by management, we
expect re-rating to continue. We thus initiate coverage on LTHF with a Buy rating
and a target price of INR180 (3.0x FY19E BVPS).
Primary focus on achieving top-quartile RoE
After the appointment of Mr Dubhashi as MD & CEO in July 2016, LTFH’s primary
goal has been to generate top-quartile RoE for its shareholders. In order to
achieve this, LTFH has identified three key segments (rural, housing and
wholesale finance) to focus on, and is running-down the de-focused businesses.
It has focused on cost-cutting measures, and is also investing in technology in a
big way. While credit costs on the wholesale finance business were elevated
over the past few years due to legacy asset quality issues, they are expected to
moderate going forward due to better underwriting post 2012. We believe LTFH
is on track to achieve 35% PAT CAGR over FY17-20, with RoE of 19% by FY20.
Wholesale finance – Significant RoE improvement ahead
Wholesale finance has traditionally been the key business for LTFH. The loan
book stands at INR414b, with the product suite comprising infrastructure
finance (thermal, renewables and operating roads), structured finance and
supply chain finance. LTFH is the second largest renewable energy financier in
the country, and has consolidated its position led by its quick and skillful project
appraisal skills. While this segment has legacy asset quality issues, the loan book
written post 2012 has nil NPLs. The key focus in this segment is to generate and
sell-down loans in order to generate strong fee income. Loan growth is expected
to be in the range of 10-15%. With improving fee income, coupled with lower
incremental credit costs, this segment is poised to generate 15-16% RoE FY19
onward, in our view.
L&T Finance Holdings
Focused approach
Piran Engineer
+
91 22 3980 4393
Piran.Engineer@motilaloswal.com
20 July 2017
3

Stock Performance (1-year)
Housing finance – Diverse product suite; 20%+ CAGR ahead
LTFH has a housing finance book of INR125b with a diversified product suite,
comprising home loans, LAP, construction finance and LRD. Home loans and LAP
constitute 60% of the overall book, while corporate loans account for the remaining.
The company conducts business from its 24 branches in the top 6-7 cities. Over the
past few quarters, LTFH has shifted its focus toward the self-employed non-
professional (SENP) segment for home loans. It has also stopped disbursing DSA-
sourced salaried loans due to the lack of profitability. LTFH’s biggest competitive
advantage in this segment is the strong relationships that its peer group companies
– L&T Realty and L&T ECC – enjoy in the industry. We expect the segment to grow at
20%+ CAGR over the medium term, with 18-19% run-rate RoE.
Rural Finance – Well-diversified; Top 3 player in tractor finance
LTFH has a rural finance book of INR100b, comprising three key products –
microfinance, two-wheeler finance and tractor finance. The company has a
differentiated model in microfinance, wherein, unlike peers, there is no concept of a
group leader. Also, most of the loans are for a tenure of two years, which reduces
the EMI burden. LTFH does not disburse loans to borrowers not producing their
Aadhar Card. LTFH entered the 2W financing business via the acquisition of Family
Credit. The business has ramped up well over the years, and the company now
finances 350,000 two-wheelers per year (implying 7% market share). The company
is one of the top three players in tractor financing, with estimated market share of
8-9%. It has tie-ups with several leading OEMs like TAFE, Mahindra and Sonalika.
Overall, rural financing is the most profitable segment for LTFH, with RoE of ~22%.
Management intends to allocate maximum capital to this segment to grow the
business.
Improving return ratios, strong growth; Initiating with Buy
We believe LTFH is well poised to deliver 16% loan book CAGR over FY17-20E, driven
by 20%/25% growth in rural/housing finance. We believe that the company is well
capitalized to achieve this growth and would not require any dilution. RoA/RoE are
expected to improve to 2.3%/19.2% by FY20E. Asset management and wealth
management subsidiaries have recently turned around and gaining scale – we
expect them to be the key value contributors over the medium term. We value the
company at 3.0x FY19E BV, based on the residual income model. Our key
assumptions are Rf of 7.0%, CoE of 13% and a terminal growth rate of 5%. We thus
initiate coverage with a
Buy rating and a target price of INR180.
Exhibit 1:
Peer comparison
Company
LTFH
CIFC
SHTF
MMFS
BAF
SCUF
Price
150
1,148
975
357
1,544
2,290
Market Cap
(INR b)
274
180
220
203
848
153
AUM
(INR b)
FY17
660
342
788
468
602
231
FY17-20E
AUM
CAGR
16
19
13
16
33
19
RoA (%)
FY17 FY20E
1.7
2.3
2.6
3
2
2.5
1
1.8
3.3
3.6
2.7
3.9
RoE (%)
FY17 FY20E
12.4
19.2
18.1
20.3
11.7
16.3
6.4
14.2
21.7
27.7
11.8
18.1
P/B
FY18E FY19E
3.0
2.5
3.6
3.0
1.7
1.5
2.9
2.7
7.1
5.7
2.7
2.3
P/E
FY18E FY19E
20.9
15.6
20.9
17.3
12.4
9.9
26.3
21.8
32.0
23.9
17.5
13.6
Source: Company, MOSL
20 July 2017
4

Tata Steel
BSE SENSEX
31,955
S&P CNX
9,900
19 July 2017
Update
| Sector:
Metals
CMP: INR571
TP: INR583(+2%)
Neutral
Annual report: EBITDA growth was offset by WC in FY17
Ind-AS revaluation depresses return ratios, net-debt- to-EBITDA
Analysis of Tata Steel’s (TATA) FY17 is of particular significance because of Ind-AS
introduction. Comparison of re-stated FY16 Ind-AS financials with previously reported
IGAAP brings out many insights.
Stock Info
Bloomberg
Equity Shares (m)
52-Week Range (INR)
1, 6, 12 Rel. Per (%)
M.Cap. (INR b)
M.Cap. (USD b)
Avg Val ( INRm)/Vol m
Free float (%)
TATA IN
971.2
572 / 349
11/5/39
546.6
8.6
3013 / 6.8
68.7
Financials Snapshot (INR b)
Y/E Mar
2017 2018E
Net Sales
1,123 1,214
EBITDA
170
186
PAT
37
48
EPS (INR)
37.9
49.6
Gr. (%)
394.2
30.8
BV/Sh (INR)
330
362
RoE (%)
15.7
14.3
RoCE (%)
9.4
9.9
P/E (x)
15.1
11.5
P/BV (x)
1.7
1.6
2019E
1,232
203
64
65.6
32.2
418
16.8
10.5
8.7
1.4
Shareholding pattern (%)
Jun-17 Mar-17 Jun-16
As On
Promoter
DII
FII
Others
31.9
30.8
13.9
23.4
31.4
30.6
14.1
23.9
31.4
27.2
13.3
28.2
FII Includes depository receipts
Standalone EBITDA for FY16 is boosted by INR3.4b, as long-term power supply
arrangement is now finance lease, which has increased debt by INR16.9b.
n
EPCG benefits are now deferred income; this has increased gross block (hence
depreciation) and non-cash EBITDA (INR3.4b in FY17).
n
TSE-LP disposal:
Ind-AS FY16 financials have excluded disposed assets, which
contributed loss of INR1.8b to EBITDA. TATA received
negative consideration
of INR19.6b,
which was over and above INR4b net working capital.
n
TSE turnaround is largely attributable to reduction in repair & maintenance,
GBP depreciation, and some expansion in spreads in FY17.
n
Accounting of JVs on equity method has reduced net debt by INR54b and
EBITDA by just INR2b, thereby benefitting EV/EBITDA.
n
Book value is inflated by INR132/share to INR425/share on fair valuation of
assets and goodwill is trimmed by INR100/share to INR42/share in FY16.
n
All the
return ratios (RoE, RoCE, RoIC, asset turn) have declined under Ind-AS.
Net-debt-to-equity declined sharply. On the other hand, EBITDA margin has
improved under Ind-AS for TATA.
n
Working capital ate away EBITDA growth in FY17:
Despite a strong growth in
EBITDA from INR80b in FY16 to INR170b in FY17, operating cash flows actually
dipped due to major swing in working capital. Disposal of assets was associated
with INR10.8b cash outflow. TATA had to borrow INR27b incrementally, though
net debt increase is lower at INR13b on translation gain.
Expect strong operating performance on strong steel pricing and spreads
n
Fair valuation of assets under Ind-AS has rendered traditional tools of valuation
(e.g. P/BV) and leverage (e.g. debt/equity) useless. We need to now rely solely
on cash generation potential, even for the cyclical steel industry.
n
TATA witnessed strong growth in EBITDA, though FCF was still negative in FY17.
We expect stronger operating performance but still do not expect FCF
generation because of pending BRPL acquisition and BPS payouts in FY18.
However, we expect FCF generation and reduction in net debt in FY19.
n
The global steel market has been stronger than our expectation, as Chinese
steel demand has surprised positively so far in CY17. It is difficult for China to
sustain high demand growth at such a high base, in our view. Therefore, we are
cautious on the steel price outlook.
n
TATA operates in India and Europe, where the markets are protected against
dumping. More protection is expected in Europe by October. This may drive
upgrades for TSE. Protection does help in the short term, but is never water
tight, in our view. We maintain
Neutral.
n
20 July 2017
5

19 July 2017
1QFY18 Results Update | Sector: Financials
Bajaj Finance
Buy
BSE SENSEX
31,955
Bloomberg
Equity Shares (m)
M.Cap.(INR b)/(USD b)
52-Week Range (INR)
1, 6, 12 Rel. Per (%)
Avg Val, (INR m)
Free float (%)
S&P CNX
9,900
BAF IN
546.9
843.8/13.1
1578 / 762
7/50/63
1518
42.1
CMP: INR1,543
Getting better by the day
n
TP: INR1,800 (+17%)
n
Financials & Valuations (INR b)
Y/E March
2017 2018E 2019E
NII
54.7 77.4 99.8
PPP
36.4 52.5 68.2
PAT
18.4 26.0 34.4
EPS (INR)
33.6 47.6 62.9
EPS Gr. (%)
40.7 41.8 32.1
BV/Sh. (INR)
175.6 216.2 269.9
RoA on AUM (%)
3.3
3.5
3.5
RoE (%)
21.7 24.3 25.9
Payout (%)
14.0 14.0 14.0
Valuations
P/E (x)
45.9 32.4 24.5
P/BV (x)
8.8
7.1
5.7
Div. Yield (%)
0.2
0.2
0.3
n
n
n
Bajaj Finance’s (BAF) 1QFY18 PAT increased 42% YoY to INR6b (4% beat).
However, this belies its strong operating performance – PPoP grew 46% YoY
(6% beat), driven by robust AUM growth of 39% YoY, and margins expanded
strongly by 90bp YoY to 12.9%.
AUM continued its robust growth trajectory (+39% YoY, +4.4% QoQ) to reach
INR688b, led by impressive growth in consumer finance (+43% YoY) and
commercial business (+68%). Within consumer business, personal cross-sell
loans grew 59% YoY to INR69.6b (tenth consecutive quarter of 50%+ AUM
growth), while salaried home loans rose 83% YoY. The company’s penetration
of Bajaj 2Ws remained at 37%.
Management is bullish on the prospects of REMI card financing and mobile
financing, going forward. Also, according to management, there are over 40m
people with a prime CIBIL score, of which only 25-30% are BAF’s customers.
The company plans to further penetrate in this segment.
GNPLs remained stable at 1.7% in 1QFY18 (at 90dpd). The company took
provisions of INR240m due to asset quality problems in the 2W portfolio and
INR180m on legacy infrastructure lending NPLs. Management has guided that
there will be another hit of ~INR300-400m for the 2W portfolio over the next
two quarters.
Valuation and view:
BAF – a dominant player in the consumer durables
financing segment – continues to reap the benefits of healthy consumer
demand, increasing its market share in consumer and also other businesses.
At the same time, it is proactive in detecting early warning signals with regard
to asset quality. We raise FY18E/19E EPS by 1/2%, and increase TP to INR1,800
(6.6x FY19E BVPS).
Buy.
20 July 2017
6

Ultratech Cement
BSE SENSEX
31,955
Bloomberg
Equity Shares (m)
M.Cap.(INRb)/(USDb)
52-Week Range (INR)
1, 6, 12 Rel. Per (%)
Avg Val, INRm
Free float (%)
S&P CNX
9,900
UTCEM IN
274.4
1,157.5 / 17.9
4531 / 3052
-1/5/5
1156
37.8
20 July 2017
1QFY18 Results Update | Sector: Cement
CMP: INR4206
n
TP: INR4,936 (+17%)
Buy
Volumes disappointment offset by better pricing
Domestic volumes decline 1% YoY:
1QFY18 revenue increased 6% YoY to
INR66.26b, lower than our estimate of INR67.55b due to volumes
disappointment. Volumes (including white cement and putty) were flat at
13.2mt (est. of 13.7mt) as domestic grey cement volumes declined 1% YoY.
This was partially offset by higher exports (+30% YoY).
EBITDA beat led by margin expansion:
Blended realization increased 7% QoQ
to INR5,025/t, led by healthy pricing in its focus markets. Grey cement
realization rose 9% YoY to INR4,481/ton due to improved pricing across most
markets. Power & fuel cost/t increased 32% YoY due to the impact of higher
petcoke prices. Freight cost rose 3% YoY due to ~9% YoY increase in diesel
prices, partially offset by efficiency improvements. EBITDA thus increased 10%
YoY to INR15.6b (higher than our estimate of INR14.7b due to better pricing),
translating into EBITDA/ton of INR1183 (+INR274/t QoQ; +INR105/t YoY) and
margin of 23.5% (+0.7pp YoY; +4pp QoQ).
Management commentary:
1) JPA assets are operating at utilization of less
than 15%, which is likely to go up to 60% by 1QFY19 and 70% by end-FY19. 2)
Present EBITDA/t of JPA assets is ~INR400, even at 15% utilization, led by
incentives. 3) EBITDA/ton is likely to be impacted in 2QFY18 due to
expenditure on integration of new assets and rebranding activities.
Valuation view:
While the acquisition of JPA would be earnings-dilutive in the
short term, we believe addition of ~31% of the present capacity at virtually
zero lead time is critical for a large-scale player like UTCEM to retain market
share. The expanded capacity would give it an edge when there is an upturn.
We value the stock at FY20E EV/EBITDA of 14x. Our target price of INR4,936
implies 17% upside.
(INR Million)
FY18E
58.2
19.1
4,988
4.7
297,000
61,581
20.7
16,789
13,643
4,750
35,899
10,770
30.0
25,130
25,130
-4.7
FY17
2Q
3Q
10.87
11.40
0.6
-0.6
4,827
4,781
-2.9
-0.1
2.2
-0.9
53,966 56,091
10,938 11,135
20.3
19.9
3,139
3,156
1,367
1,293
2,335
970
8,767
7,655
2,757
2,021
31.4
26.4
6,011
5,634
6,011
5,634
31.4
6.7
4Q
13.68
-0.2
4,689
3.2
-1.9
65,953
12,782
19.4
3,357
1,529
2,401
10,297
3,276
32.2
6,883
6,976
-10.7
1Q
12.90
-0.1
5,025
6.4
7.2
66,265
15,601
23.5
3,098
1,285
1,652
12,870
3,963
30.8
8,906
8,906
14.9
FY18
2QE
3QE
12.78
14.72
17.5
29.1
4,907
5,038
1.7
5.4
-2.4
2.7
64,283 75,926
11,630 14,406
18.1
19.0
4,500
4,550
4,060
4,060
1,200
1,300
4,270
7,096
1,759
2,900
41.2
40.9
2,511
4,196
2,511
4,196
-58.2
-25.5
FY17
4QE
17.81
30.2
4,978
6.2
-1.2
90,527
19,944
22.0
4,641
4,238
598
11,664
2,148
18.4
9,516
9,516
36.4
48.9
1.6
4,762
-0.8
238,914
49,690
20.8
12,679
5,714
6,600
37,896
11,482
30.4
26,277
26,372
11.3
Financials & Valuations (INR b)
Y/E Mar
2017 2018E 2019E
Net Sales
238.9 297.0 374.4
EBITDA
49.7
61.6
82.3
PAT
26.4
25.1
38.1
EPS (INR)
96.1
91.5 138.8
Gr. (%)
11.3
-4.7
51.6
BV/Sh (INR)
872.1 943.6 1,036.6
RoE (%)
11.6
10.1
14.0
RoCE (%)
9.7
8.5
9.9
P/E (x)
41.8
43.9
29.0
P/BV (x)
4.6
4.3
3.9
n
n
n
Quarterly Performance
Y/E March
Sales (m ton)
YoY Change (%)
Blended Realn.(INR/ton) *
YoY Change (%)
QoQ Change (%)
Net Sales
EBITDA
Margins (%)
Depreciation
Interest
Other Income
PBT before EO expense
Tax
Rate (%)
Reported PAT
Adj PAT
YoY Change (%)
1Q
12.91
6.3
4,723
-1.5
3.9
62,295
14,225
22.8
3,027
1,525
1,504
11,177
3,428
30.7
7,749
7,749
28.3
20 July 2017
7

Aurobindo Pharma
BSE SENSEX
31,955
S&P CNX
9,900
19 July 2017
Update
| Sector:
Healthcare
CMP: INR767
TP: INR850(+11%)
Buy
Launch of niche product bodes well for near-term growth
Stock Info
Bloomberg
Equity Shares (m)
52-Week Range (INR)
1, 6, 12 Rel. Per (%)
M.Cap. (INR b)
M.Cap. (USD b)
Avg Val, INRm
Free float (%)
ARBP IN
585.2
895 / 504
15/-10/-14
397.3
6.1
1824
48.1
Financials Snapshot (INR b)
2017 2018E 2019E
Y/E Mar
Net Sales
150.9 171.2 189.3
EBITDA
34.3
40.9
44.7
PAT
23.0
26.7
29.3
EPS (INR)
39.3
45.7
50.0
Gr. (%)
13.6
16.2
9.5
BV/Sh (INR)
157.4 200.6 248.2
RoE (%)
28.3
25.5
22.3
RoCE (%)
19.1
19.5
18.2
P/E (x)
19.5
16.8
15.3
P/BV (x)
4.9
3.8
3.1
Shareholding pattern (%)
As On
Jun-17 Mar-17 Jun-16
Promoter
51.9
51.9
53.8
DII
14.2
12.8
8.0
FII
19.6
21.0
26.1
Others
14.3
14.4
12.1
FII Includes depository receipts
Stock Performance (1-year)
Aurobindo Pharma
Sensex - Rebased
900
800
700
600
500
Key catalysts in place to drive medium-term earnings too
n
Receives approval for Renvela in US:
ARBP has received final USFDA approval
to manufacture sevelamer carbonate tablet 800mg (brand name – Renvela;
innovator – Genzyme) in the US. Notably, ARBP is the first generic player to
receive approval for Renvela, which is indicated for the control of serum
phosphorus in patients with chronic kidney disease on dialysis.
n
Only player in the USD800m market:
According to the IMS, the estimated
market size of this product is USD1.9b for the 12 months ended May 2017.
Primary sales booked by the innovator for Renvela/Renagel stood at ~USD1b
(estimated market for Renvela expected to be ~USD800m) in CY16. ARBP has
already received approval for sevelamer carbonate oral suspension from the
US FDA in June-17 (IMS estimates market size of USD140m).
n
Limited-competition product:
Although there are at least eight generic filers
for Renvela (ARBP, Cipla, Mylan, Sandoz, DRRD, Lupin, Impax and Glenmark),
only ARBP has received approval by now. ARBP was one of the late filers for
this product, but since most other players have received CRLs (due to
complexity at API level), Renvela may remain a limited-competition product in
near term. Impax expects to launch the product by late 2017/early 2018, while
Cipla guides for launch by 3QFY18. LPC/GNP may not be able to launch in FY18.
n
Renvela sales will explain 12-14% of FY18 PAT:
We expect ARBP to generate
~USD120-140m of sales on annualized basis (~USD100-120m in FY18),
assuming that 2-3 more players are able to launch in FY18. Ranvela will help
explain >12-13% of FY18E PAT for ARBP. However, in FY19, the contribution
will come down significantly due to competition from at least 7-8 players.
n
Pricing risk lowest among peers:
No single product for ARBP contributes more
than 3% of sales (unlike SUNP, LPC and DRRD, where the top-3 products
account for >20-25% of sales). Also, no single ANDA has any meaningful
disproportionate contribution to margins, as ARBP has a matured product
basket with all ~200 launched ANDAs facing competition from multiple players
(typically 4-5 or more).
n
R&D expense to remain range bound in near term:
We expect ARBP to file 35-
40 ANDAs in FY18 (including 6-7 controlled substance and 10-15 oncology &
hormones). Oncology & hormones-related R&D expense will be entirely borne
by Eugia JV. We expect R&D expense for ARBP to not inch up beyond 5.5% in
FY18 and 7% in FY19.
n
Maintain Buy:
We expect ARBP’s share price to remain range bound in the
near term as it has moved up ~50% in less than two months. However, the key
catalysts in 2HFY18 (e.g., launch of Fondaparinux, Toprol XL, DTG combination,
injectables business ramp-up, and EU business margins improvement) will help
drive growth in the medium term. ARBP remains one of our top picks in the
sector, with a target price of INR850 @ 17x FY19E PER (v/s INR750 @ 15x
FY19E earlier). We have increased our target multiple due to enhanced
visibility of growth and FCF generation.
20 July 2017
8

19 July 2017
1QFY18 Results Update | Sector: Capital Goods
Havells India
Neutral
BSE SENSEX
31,955
Bloomberg
Equity Shares (m)
M.Cap.(INR b)/(USD b)
52-Week Range (INR)
1, 6, 12 Rel. Per (%)
Avg Val. (INR m)
Free float (%)
S&P CNX
9,900
HAVL IN
624.6
321.0 / 4.7
525 / 304
-8/4/15
623
38.4
CMP: INR467
n
TP: INR455 (-3%)
Results meaningfully below estimates
Financials & Valuations (INR b)
2017 2018E 2019E
Y/E Mar
Net Sales
61.4
84.2 100.3
EBITDA
8.2
10.2
13.1
Adj PAT
6.0
6.8
8.6
Adj EPS (INR)
9.6
10.9
13.8
EPS Gr. (%)
17.1
14.4
26.0
BV/Sh(INR)
52.4
58.7
66.6
RoE (%)
18.2
18.6
20.7
RoCE (%)
18.2
18.5
21.1
P/E (x)
48.9
42.7
33.9
P/BV (x)
8.9
8.0
7.0
Estimate change
TP change
Rating change
n
n
n
n
Operating performance meaningfully below expectations:
Revenues grew
26.8% YoY to INR18.5b in 1QFY18, in line with our estimate. Operating profit of
INR1.7b (-14% YoY) was meaningfully below our estimate of INR2.5b – this
includes INR130m of non-recurring charge for the Lloyd acquisition. PAT of
INR1.2b (-16.6% YoY) too missed our estimate of INR1.7b.
Core business (ex-Lloyd) grows at muted 9% YoY due to GST impact:
Although
core business revenue of INR17.2b was in line with our estimate, there was a
stark difference in the product mix. Barring the cables & wires segment
(+19.5% YoY), all other segments witnessed a significant decline in primary off-
take by channel partners on account of GST implementation. Operating profit
declined 20% YoY to INR1.6b, and adjusted EBIDTA margin shrunk 360bp YoY to
10% due to adverse product mix, higher ad spend (3.5% v/s 3.3% in 1QFY17),
delayed pass-through of higher raw material costs and higher employee cost.
Net profit declined 22% YoY to INR1.1b.
Newly acquired Lloyd’s consumer business grows 20% YoY:
The newly
acquired Lloyd business recorded revenue of INR2.7b (+20% YoY). Operating
profit stood at INR128m and EBIDTA margin at 4.8%. HAVL had completed the
Lloyd acquisition by 8 May 2017, and thus this new business reflects financials
of 50 days. Management indicated that Lloyd’s quarterly performance has
been in line with its initial plans on growth and margins.
Working capital cycle at multi-year low:
Core net working capital cycle
contracted to -19 days from 6 days in 4QFY17. Creditor days were up to 107
from 63 in 4QFY17 due to extended credit cycle provided by Lloyd’s vendors.
Valuation and view:
We cut our earnings estimate for FY18/19 by 9/5% to
factor in weaker-than-estimated Lloyd’s sales and pressure on operating
margins (due to higher ad spend and employee cost). Maintain
Neutral
with a
revised TP of INR455, ascribing 33x P/E (20% premium to five-year average)
multiple on its FY19E EPS of INR13.8.
FY17
2Q
3Q
4Q
14,522 15,060 17,102
8.7
13.2
17.2
2,034 1,907 2,296
7.6
4.0
3.5
14.0
12.7
13.4
308
301
308
19
15
71
253
264
419
0.0 189.5 (768)
2,030 1,877 2,337
572
537
622
28.2
28.6
26.6
1,458 1,530
947
22.0
27.6 -74.1
1,409 1,135 1,715
17.0
-4.0
5.0
FY18
FY17 FY18E MOSL
2QE
3QE
4QE
1QE
20,131 21,044 26,456 61,353 86,211 18,528
38.6
39.7
54.7
6.2
40.5
26.3
2,587 2,733 4,162 8,241 11,207 2,545
27.2
43.3
81.3
9.2
36.0
27.0
12.8
13.0
15.7
13.4
13.0
13.7
380
400
1 1,196 1,117
350
20
20
47
122
121
40
140
150
-45 1,343
593
200
-
-
-
0.0
2,327 2,463 4,069 8,266 10,561 2,355
651
677 1,118 2,298 2,936
659
28.0
27.5
27.5
27.8
27.8
28.0
1,675 1,786 2,951 5,969 7,626 1,695
14.9
16.7 211.6 -34.2
27.8
16.5
1,675 1,786 2,951 5,969 7,626 1,695
18.9
57.3
72.1
16.9
27.8
16.9
Quarterly Performance (Standalone)
Y/E March
Sales
Change (%)
Adj. EBITDA
Change (%)
Adj. EBITDA margin (%)
Depreciation
Interest
Other Income
Extra-ordinary Items
PBT
Tax
Effective Tax Rate (%)
Reported PAT
Change (%)
Adj. PAT
Change (%)
E: MOSL Estimates
1Q
14,668
17.1
2,004
23.7
13.7
280
16
314
-
2,022
567
28.0
1,456
36.3
1,456
22.2
(INR Million)
Var.
0.4%
-32.2%
1QE
18,605
26.8
1,724
-14.0
9.3
336
34
348
-
1,703
489
28.7
1,214
-16.6
1,214
-16.6
-27.7%
-28.4%
-28.4%
20 July 2017
9

19 July 2017
1QFY18 Results Update | Sector: Financials
Canara Bank
Neutral
BSE SENSEX
31,955
Bloomberg
Equity Shares (m)
M.Cap.(INRb)/(USDb)
52-Week Range (INR)
1, 6, 12 Rel. Per (%)
Avg. Val, INRm
Free float (%)
S&P CNX
9,900
CBK IN
543.0
148.0/2.2
415 / 231
2/16/32
1192
33.7
CMP: INR371
n
TP: INR360 (-3%)
Slippages remain elevated; One off gains help PPoP
Canara Bank’s (CBK) PBT declined 18% YoY to INR2.7b, missing our estimate by
~68% due to elevated provisions of INR22.0b (94% higher than our estimate).
Loan growth stood muted at 8% YoY due to 11% YoY decline in infra loans (13%
of advances), despite retail/SME loans growing 8%/12% YoY.
Reported NIM expanded 11bps QoQ to 2.34% (domestic NIM at 2.56%). NII
grew 0%/18% QoQ/YoY. Adjusting for INR1.25b of interest on IT refund in
4QFY17, NII grew 5% QoQ. 1QFY18 NII had INR800-900m of interest reversals.
Gross slippages of INR55b (+78% QoQ) had INR7.92b contribution from
demonetization moratorium and ~INR27.2b from 3-4 bulky corporate accounts.
Absolute GNPA increased 10% QoQ to INR377b, while GNPA/NNPA stood at
10.56%/7.09% (+93bp/+76bp QoQ). Total stressed book stood at 14% of
advances.
Other highlights:
(a) Non-interest income grew 33% YoY, aided by gain on
CARE stake sale and INR1.3b of PSLC sales income. (b) CET1 ratio/tier 1
ratio/CAR stood at 8.72%/9.57%/12.61%.
Valuation and view:
Net stress addition has increased after a few quarters of
decline. Given the weak operating environment, we would wait and watch
developments in asset quality. Our SOTP-based target price stands at INR360
(0.5x June 2019E BV + INR70 for other investments); we have lowered our
valuation multiple slightly from 0.6x FY19E BV last quarter due to prolonged
provisioning pressure. Maintain
Neutral.
n
Financials & Valuations (INR b)
Y/E March
2018E 2019E 2020E
NII
113.0 124.5 144.1
OP
93.4
99.7 116.3
NP
18.0
28.1
37.2
EPS (INR)
30.1
47.0
62.3
EPS Gr. (%)
60.1
56.4
32.5
BV/Sh. (INR)
498
540
595
RoE (%)
6.2
9.1
11.0
RoA (%)
0.3
0.4
0.5
P/E (x)
12.3
7.9
6.0
P/BV (x)
0.7
0.7
0.6
n
n
n
20 July 2017
10

19 July 2017
Q2CY17 Results Update | Sector: Healthcare
Sanofi India
Buy
BSE SENSEX
31,955
Bloomberg
Equity Shares (m)
M.Cap.(INRb)/(USDb)
52-Week Range (INR)
1, 6, 12 Rel. Per (%)
Avg Val, INRm
Free float (%)
S&P CNX
9,900
SANL IN
23
96.9 / 1.5
4930 / 3990
1/-16/-21
43
39.6
CMP: INR4,209
n
TP: INR4,820(+15%)
Weak results; margin improvement is key
Sanofi India (SANL) reported weak 2QCY17 results. Revenue declined 1.2% YoY
to INR6b (~10.6% miss). EBITDA declined ~21% YoY to INR1.2b (18.4% miss),
with the margin coming in at 19.2% v/s 24% in the year-ago period. PAT too fell
13.6% YoY to INR737m (~16% miss). The muted operational performance can
mainly be ascribed to down-stocking in trade channel in anticipation of GST
implementation.
Low-single-digit revenue decline coupled with weak margins:
SANL’s sales
declined 1.2% YoY in 2QCY17. According to AIOCD, secondary sales growth for
the company stood at ~14% YoY, higher than average industry growth of 7.6%.
We expect SANL’s revenue growth to sustain at 11% over CY16-18E, in line with
industry growth. High growth of brands like Lantus, Combiflam, Allegra and
Amaryl M, along with new product launches, should drive SANL’s revenue
growth.
Lower margins attributed to high other expenses:
EBITDA margin contracted
to ~19.2% in 2QCY17, lower than our estimate of 21%, mainly on account of
high other expenses (+870bp YoY as % of sales), offsetting lower raw material
costs (-510bp YoY as % of sales). We expect EBITDA margin to normalize at 21-
22% over CY16-18E (22.3% in CY16).
Margin improvement is key; maintain Buy:
We model an increase of 11% in
sales, 9% in EBITDA and 12% in earnings over CY16-18E. We maintain our
Buy
rating with a target price of INR4,820 @ 30x CY18E earnings (v/s INR4,850 @
28x CY18E earnings). We have cut our CY18E EPS by 8% as we build in slower
margin improvement.
4Q
5,920
4.1
1,073
18.1
412
4
152
809
0
809
304
37.6
505
505
-28.3
8.5
1Q
5,529
1.6
1,015
18.4
253
4
159
917
0
917
317
34.6
600
600
-25.6
10.9
CY17E
2Q
6,006
-1.2
1,154
19.2
255
0
284
1,183
0
1,183
446
37.7
737
737
-13.6
12.3
CY16
3QE
6,911
10.7
1,513
21.9
300
4
200
1,409
0
1,409
520
36.9
889
889
10.3
12.9
4QE
7,433
25.6
1,576
21.2
296
7
-53
1,220
0
1,220
372
30.5
848
848
67.9
11.4
23,686
8.0
5,281
22.3
1,313
15
708
4,661
0
4,661
1,691
36.3
2,970
2,970
24.9
12.5
CY17E
25,879
9.3
5,258
20.3
1,104
15
590
4,729
0
4,729
1,655
35.0
3,074
3,074
3.5
11.9
Est.
2Q
6,718
7.6
1,414
21.0
260
4
200
1,350
0
1,350
470
34.8
880
880
3.2
13.1
Var.
vs Est
-10.6%
-18.4%
Financials & Valuations (INR b)
Y/E Dec
2016 2017E 2018E
n
Net Sales
23.7
25.9
29.2
EBITDA
5.3
5.3
6.3
PAT
3.0
3.1
3.7
EPS (INR)
129.1 133.6 160.6
Gr. (%)
24.9
3.5
20.2
BV/Sh (INR)
754.5 806.9 886.3
RoE (%)
17.1
16.6
18.1
RoCE (%)
16.5
16.2
18.1
n
P/E (x)
32.6
31.5
26.2
P/BV (x)
5.6
5.2
4.7
Estimate change
TP change
Rating change
n
Quarterly Performance (Consolidated)
Y/E December
Net Sales
YoY Change (%)
EBITDA
Margins (%)
Depreciation
Interest
Other Income
PBT before EO Items
Extra-Ord Expense
PBT after EO Items
Tax
Effective tax Rate (%)
Reported PAT
Adj PAT
YoY Change (%)
Margins (%)
E: MOSL Estimates
1Q
5,444
11.4
1,291
23.7
301
1
256
1,245
0
1,245
439
35.3
806
806
66.5
14.8
CY16
2Q
3Q
6,080 6,242
10.6
6.6
1,458 1,447
24.0
23.2
300
300
7
3
164
148
1,315 1,292
0
0
1,315 1,292
462
486
35.1
37.6
853
806
853
806
32.9
11.2
14.0
12.9
-12.4%
-12.4%
-16.3%
-16.3%
20 July 2017
11

MindTree Consulting
BSE SENSEX
31,955
Bloomberg
Equity Shares (m)
M.Cap.(INRb)/(USDb)
52-Week Range (INR)
1, 6, 12 Rel. Per (%)
Avg Val, INRm
Free float (%)
S&P CNX
9,900
MTCL IN
Dragged by acquisitions, top clients and standalone margins
168
85.2 / 1.3
Downgrade to Sell
621 / 400
n
1Q miss reflects elevated pressures:
MTCL’s 1QFY18 revenue grew 1.2%
-4/-12/-25
QoQ CC versus our estimate of +3% QoQ, dragged by acquired companies’
343
performance: QoQ decline of 19% in Bluefin and 13% in Magnet360
86.3
19 July 2017
1QFY18 Results Update | Sector: Technology
CMP: INR507
TP: INR450(-11%)
Downgrade to Sell
Financials & Valuations (INR b)
2017
2018E
Y/E Mar
52.4
54.4
Net Sales
7.2
6.7
EBITDA
4.2
4.5
PAT
24.9
28.7
EPS (INR)
-30.6
15.4
Gr. (%)
153.0
156.1
BV/Sh (INR)
16.8
17.3
RoE (%)
20.1
18.2
RoCE (%)
20.4
17.6
P/E (x)
3.3
3.2
P/BV (x)
2019E
61.7
8.4
5.4
32.9
14.6
170.9
20.1
23.5
15.4
3.0
n
n
Estimate change
TP change
Rating change
n
Quarterly Performance (Consolidated)
Y/E March
Revenue (USD m)
QoQ (%)
Revenue (INR m)
YoY (%)
GPM (%)
SGA (%)
EBITDA
EBITDA Margin (%)
EBIT Ma rgi n (%)
Othe r i ncome
ETR (%)
Adj. PAT
QoQ (%)
YoY (%)
EPS (INR)
Headcount
Uti l i ncl . tra i ne e s (%)
Attri ti on (%)
Offs hore re v. (%)
Fi xe d Pri ce (%)
1Q
199
2.1
13,276
35.8
37.0
22.3
1,951
14.7
10.8
198
24.2
1,235
-7.1
-3.7
7.4
16,110
71.4
16.5
40.5
48.7
(negative impact of 1.4pp on growth). This, combined with visa costs (140bp
impact) and a stronger INR (90bp), drove ~300bp EBITDA margin contraction
to 11%, well below our estimate of 13.9%. Adj. PAT declined 5% QoQ to
INR925m, missing our estimate of INR1,244m, led by operating miss.
Downgrades revenue growth outlook:
MTCL revised its FY18 revenue
growth outlook to high-single-digits from low-double-digits earlier, following
a slow start and lack of predictability in segments such as Salesforce and
Bluefin. Also, it had earlier expected margin expansion in FY18 excluding the
impact from a stronger INR, which will now likely happen only in the
standalone segment and consolidated margins will likely be lower.
Trend in some key metrics disconcerting:
Since 2QFY16, MTCL’s absolute
IFRS EBIT has declined 45% from INR1,783m to INR979m, and acquisitions
are only partly responsible for the trend. Likewise, since 3QFY16, revenue
from the top 2-5 accounts is down 24% and that from the top 6-10 accounts
is down 12%. MTCL’s revenue and margin outlook does not imply a swift fix
to the multitude of challenges facing the company.
Valuation view – downgrade to Sell:
MTCL downgraded its revenue and
margin outlook for FY18, which drives 12/9% cut in our FY18/19E EPS. MTCL
trades at 15.2x FY19E EPS. We note that MTCL’s challenges are not only
limited to the performance of its acquired entities (only ~7% of revenues),
but also span across standalone profitability and revenues from the top
accounts. Our TP of INR450 discounts forward earnings by 13x and implies
11% downside to CMP. Led by the uncomfortable duality of expensive
valuation multiple and series of challenges, we downgrade MTCL to
Sell.
4Q
196
1.8
13,181
-0.2
34.0
19.8
1,869
14.2
10.3
-95
22.8
972
-5.7
-26.9
5.8
16,470
70.9
15.1
39.5
52.8
1Q
200
2.3
12,895
-2.9
34.9
23.8
1,435
11.1
7.3
368
28.6
931
-4.2
-24.6
7.2
16,561
73.2
14.0
42.0
52.9
FY18E
2Q
3Q
207
211
3.2
2.3
13,425
13,846
3.6
6.9
34.2
34.0
22.0
21.2
1,642
1,769
12.2
12.8
8.5
9.2
336
263
24.0
24.0
1,127
1,163
21.1
3.2
18.9
12.8
6.9
7.1
17,011
17,611
74.0
72.0
42.1
41.5
FY17
4Q
216
2.2
14,261
8.2
34.2
21.0
1,884
13.2
9.6
249
24.0
1,234
6.1
27.0
7.5
17,911
72.0
41.2
780
9.0
52,364
11.7
34.8
21.1
7,181
13.7
9.8
417
24.6
4,186
-30.6
24.9
16,470
71.3
40.2
FY18E
834
7.0
54,426
3.9
34.3
22.0
6,730
12.4
8.7
1,216
25.0
4,455
6.4
34.6
17,911
72.8
41.7
Est. Var. (% /
1QFY18
bp)
204
-1.8
4.2 -188bp
13,133
-1.8
-1.1 -179bp
33.9
104bp
20.0
378bp
1,821
-21.2
13.9
-274bp
9.9 -268bp
353
4.3
25.0
1,244
-25.1
27.9 -3217bp
0.7 -2532bp
7.4
16,870
-1.8
73.0
20bp
40.3
169bp
FY17
2Q
3Q
193
192
-3.0
-0.4
12,954 12,953
10.8
6.7
34.2
34.1
21.7
20.7
1,621 1,740
12.5
13.4
8.6
9.5
170
144
26.0
25.2
948 1,031
-23.2
8.8
-40.1 -31.7
5.6
6.1
16,219 16,099
71.4
71.3
16.4
16.1
40.8
39.8
50.6
52.5
20 July 2017
12

RESULTS
FLASH
BSE SENSEX
31,955
S&P CNX
9,900
KPIT Technologies
Neutral
19 July 2017
Results Flash | Sector: Technology
CMP: INR134
n
TP: INR150(+12%)
We will revisit our estimates
post earnings call/management
interaction.
Revenue beat led by one-time license fees; Margin disappoints
KPIT’s 1QFY18 CC revenue grew 3.5% QoQ, above our estimate of +1.3%. This
however, included one-time non-recurring license fee revenue of USD2m,
adjusted for which, CC revenue growth of 1.9% would be closer to our
estimate.
EBITDA margin shrunk 100bp QoQ to 9.1%, significantly below our estimate of
11.1%. With significant expansion room for utilization and wage hikes effective
from only in 2Q, we had expected 100bp margin expansion despite a strong
INR.
However, with 225-250bp headwind from wage hikes effective in 2Q, we
see significant cut to our FY18 EBITDA margin estimate of 11.7%.
PAT stood at INR555m (+3.3% QoQ), above our estimate of INR529m, mainly
due to higher other income of INR121m (estimate of INR10m).
Conference Call Details
Date:
20 July 2017
Time:
04:00pm IST
Dial-in details:
+91-22-3960 0734
th
n
Financials & Valuations (INR b)
2017
2018E
Y/E Mar
Net Sales
33.2
35.0
EBITDA
3.5
3.3
NP
2.1
2.2
EPS (INR)
11.9
10.8
EPS Gr. (%)
-15.3
-9.5
BV/Sh. (INR)
79.2
85.8
RoE (%)
14.3
13.2
RoCE (%)
15.9
14.0
Payout (%)
16.8
18.5
Div. Yield
1.5
1.5
n
2019E
37.8
Key highlights
3.7
2.4
n
While management retained its full-year guidance of 6-8% revenue growth
aided by healthy 1Q growth (including one-off revenue) and cross-currency
11.4
6.0
benefits, it expects to achieve the higher end of the same.
97.3
n
KPIT demonstrated sanguine cash generation during the quarter, with
12.5
operating cash flow at INR941m and free cash flow at INR492m. Its net cash at
14.4
the end of the quarter stood at INR1,344m.
17.5
1.5
n
Only E&U had any material growth in 1Q (+28% QoQ). Automotive was flat and
n
Manufacturing and Others declined.
Growth during the quarter was led by smaller geographies of Europe (+13.9%
QoQ) and RoW (+12.3% QoQ).
Quarterly Performance
Valuation and view:
We will revisit our estimates post the earnings call. Outlook on
growth recovery and margin resurrection will be keenly sought. Maintain
Neutral.
20 July 2017
13

19 July 2017
1QFY18 Results Update | Sector: Media
HT Media
Neutral
BSE SENSEX
31,955
Bloomberg
Equity Shares (m)
M.Cap.(INRb)/(USDb)
52-Week Range (INR)
1, 6, 12 Rel. Per (%)
Avg Val, INRm
Free float (%)
S&P CNX
9,900
HTML IN
GST impacts ad growth, cost efficiencies lead to margin beat
233
Maintain EPS estimates and TP
19.2 / 0.3
96 / 70
n
EBITDA up 24%, above estimate; PAT nearly doubles:
EBITDA rose 24% YoY to
INR799m, 21% above our estimate of INR657m, despite the revenue
5/-10/-5
23
disappointment, as HT Media’s cost-efficiency efforts bore fruit. Opex levers
30.5
CMP: INR88
TP: INR90 (+2%)
Financials & Valuations (INR b)
2017 2018E
Y/E Mar
Net Sales
24.5
25.0
EBITDA
3.0
3.2
PAT
1.7
1.8
EPS (INR)
7.4
7.9
Gr. (%)
2.1
7.0
BV/Sh (INR)
109.8 120.1
RoE (%)
7.1
6.9
RoCE (%)
8.5
8.2
P/E (x)
11.9
11.1
P/BV (x)
0.8
0.7
2019E
26.3
3.1
1.9
8.1
1.5
130.4
6.4
8.1
11.0
0.7
n
Estimate change
TP change
Rating change
n
n
more than cushioned the impact of subdued ad/circulation performance. PAT
grew 86% YoY to INR416m, significantly above our estimate of INR236m,
largely due to EBITDA beat flowing through.
Print ad and circulation growth disappoints:
Revenue fell 3% YoY to INR5.99b
(est. of INR6.24b). Ad revenue declined 10% YoY to INR4.07b (est. of INR4.5b)
as volumes were impacted in the month leading to GST roll-out. English ad
revenue fell 16% YoY to INR2.29b, while Hindi ad revenue remained flat YoY at
INR1.78b (4% miss). Circulation revenue remained flat YoY at INR770m (est. of
INR800m). Radio revenue grew 30% YoY to INR430m (est. of INR398m), mainly
on increased inventory sale from new radio station launches and also growth in
existing stations. Like-to-like radio business growth fell 7% YoY (new stations
contributed INR120m in 1Q).
EBITDA margin expands ~290bp YoY, significant beat:
Despite the GST impact
(which put brakes on ad/circulation growth), HTML more than salvaged
margins (+290bp YoY) to 13.3% (est. of 10.5%), as its cost-efficiency drive
across all opex items helped it report healthy margin expansion.
Valuation and view:
While 1Q profitability remained healthy due to cost
efficiencies, the ad pain continues (66% of revenue). While we remain positive
on the regional business, sluggish English ad growth and low dividend payout
remain the key concerns. We maintain our earnings estimates and
Neutral
stance with a target price of INR90 (11x FY19E EPS).
20 July 2017
14

Hindustan Media Ventures
BSE SENSEX
31,955
Bloomberg
Equity Shares (m)
M.Cap.(INRb)/(USDb)
52-Week Range (INR)
1, 6, 12 Rel. Per (%)
Avg. Val, INRm
Free float (%)
S&P CNX
9,900
HMVL IN
GST-led pain impacts ad growth
73.4
19.6 / 0.3
n
EBITDA misses estimate led by unfavorable operating leverage:
HMVL’s
314 / 253
1QFY18 EBITDA declined 10% YoY to INR510m (est. of INR651m) due to GST-
-2/-15/-14
led ad pain. The base quarter does not include charges pertaining to HTDSL
10
(HTML’s multimedia digital content arm) carve-out, and thus, financials are
25.7
19 July 2017
1QFY18 Results Update | Sector: Media
CMP: INR274
TP: INR350(28%)
Buy
Financials & Valuations (INR b)
Y/E Mar
2017 2018E 2019E
Net Sales
9.33 10.08 10.93
EBITDA
2.06
2.38
2.76
PAT
1.90
2.20
2.58
EPS (INR)
25.9
28.3
33.6
Gr. (%)
5.2
9.5
18.4
BV/Sh (INR)
149.1 177.5 211.0
RoE (%)
19.0
17.3
17.3
RoCE (%)
17.8
15.8
16.3
P/E (x)
10.6
9.7
8.2
P/BV (x)
1.8
1.5
1.3
n
n
Estimate change
TP change
Rating change
n
Quarterly Performance
Y/E March
Ad revenue
YoY (%)
Circulation revenue
YoY (%)
Revenue
YoY (%)
Operating expenses
EBITDA
YoY (%)
EBITDA margin (%)
Depreciation
Interest
Other Income
PBT
Tax
Effective Tax Rate (%)
Adjusted net profit
1Q
1,777
6.9
563
5.4
2,392
6.9
1,823
569
4
23.8
50
47
201
673
186
27.6
487
strictly not comparable. Like-to-like comparison is not disclosed. Reported PAT
declined 8% YoY to INR448m (est. of INR559m).
Teething days of GST implementation hit ad growth:
Ad volumes dipped ~6%
with advertisers tightening their budgets in the month leading to GST
implementation. With ad budget cuts leading to volumes decline across
categories, ad revenues remained flat YoY at INR1.78b in 1QFY18. However,
HMVL did manage to offset the decline through 6% yield improvement.
Flat circulation revenues miss expectations:
Circulation revenues remained
flat YoY at INR560m (est. of INR591m), largely led by lower realization/copy.
HMVL took a cut in cover price in the quarter to protect its turf in select UP and
Bihar markets.
Valuation and view:
We cut our EPS estimates 5%/6% in FY18/FY19 to factor in
higher-than-expected operating costs. We expect EPS CAGR of 14% over FY17-
19, led by CAGR of 9%/6% in ad/circulation revenue. HMVL trades at 9.7x
FY18E EPS/8.2x FY19E EPS. Maintain
Buy
with a TP of INR350 (earlier 360)
based on 10x FY19E EPS.
(INR Million)
3Q
1,688
-6.8
561
7.3
2,303
-4.2
1,894
409
-32
17.8
50
39
215
536
98
18.2
438
4Q
1,745
3.0
552
3.4
2,343
3.1
1,770
573
10
24.4
50
34
167
655
191
29.1
424
1Q
1,780
0.2
560
-0.5
2,368
-1.0
1,858
510
-10
21.5
53
25
251
683
203
29.7
448
FY18
2QE
1,837
8.0
581
8.0
2,477
8.0
1,957
521
3
21.0
54
26
200
641
151
23.5
490
FY17
3QE
1,975
17.0
606
8.0
2,638
14.6
1,969
669
64
25.4
52
27
200
790
186
23.5
604
4QE
1,955
12.0
596
8.0
2,599
10.9
1,915
685
20
26.3
53
29
219
821
194
23.7
597
6,912
1.1
2,213
3.2
9,333
1.6
7,277
2,055
-5.6
22.0
202
161
884
2,575
676
26.3
1,777
FY18E
7,547
9.2
2,343
5.9
10,083
8.0
7,699
2,385
16.0
23.6
213
106
869
2,934
734
25.0
2,201
FY17
2Q
1,701
0.9
538
3.1
2,295
1.4
1,791
504
-4
22.0
52
41
338
749
202
27.0
547
20 July 2017
15

June 2017 Results Preview | Sector: Capital Goods
ABB
Bloomberg
Equity Shares (m)
M. Cap. (INR b)/(USD b)
52-Week Range (INR)
1,6,12 Rel Perf. (%)
ABB IN
211.9
307 / 5
1619 / 950
0 / 23 / 4
CMP: INR1,450 TP: INR1,201 (-17%)
n
n
Sell
Financial Snapshot (INR b)
Y/E Dec
2016 2017E 2018E 2019E
Net Sales
EBITDA
Adj. PAT
Adj. EPS (INR)
EPS Gr (%)
BV/Sh (INR)
RoE (%)
RoCE (%)
Payout (%)
Valuations
P/E (x)
P/BV (x)
EV/EBITDA (x)
Div. Yield (%)
73.8
9.4
32.4
0.3
58.0
8.1
24.9
0.4
45.2
7.1
18.9
0.5
37.1
6.2
14.2
0.6
86.6
7.9
3.7
19.7
25.0
154.9
12.7
18.3
19.9
100.8
10.2
5.3
25.1
27.2
180.0
13.9
21.3
22.5
111.9
12.5
6.8
32.2
28.3
203.7
15.8
23.7
22.5
126.0
14.8
8.3
39.2
21.8
232.7
16.8
25.4
22.5
n
n
n
ABB has received a substation order worth INR1.8b from Power
Grid of Bangladesh to add 535MWof transmission capacity.
ABB India during the quarter has set-up new remote service center
for its energy saving solutions. It also added a new production line
for digitalized low-voltage drives.
During the quarter, ABB has launched new microgrid technology
that combines solar power and enables battery storage. This
product will target to provide electricity to remote villages that are
not connected to main grid.
ABB continues to focus on increased localization and cost
optimization. Its direct RM costs have declined to 64.5% of revenue
from a peak of 81% in 4QCY10, well below its internal target of
65%. This has aided margins, despite negative operating leverage.
We expect revenue to grow 13% YoY, led by execution ramp-up in
the projects segment. Operating margin is likely to improve 130bp
YoY to 9.4%. Net profit should grow 36% YoY to INR1.05b.
Sell.
Management commentary suggests cautious optimism. Continued focus
on exports and services to be an important driver of projected strong
double-digit revenue and profit growth.
Key issues to watch
Ø
Ø
Continued preference for cash generation vis-à-vis profits.
Quarterly Performance
Y/E December
Sales
Change (%)
EBITDA
Change (%)
As % of Sales
Depreciation
Interest
Other Income
PBT
Tax
Effective Tax Rate (%)
Reported PAT
Adj. PAT
Change (%)
1Q
20,035
10.4
1,808
25.9
9.0
359
223
149
1,376
442
32.1
854
934
72.0
CY16
2Q
3Q
21,015
20,550
8.8
4.4
1,701
1,516
5.6
-2.7
8.1
7.4
357
406
180
178
44
44
1,208
976
434
427
35.9
43.8
774
811
774
871
13.1
48.2
4Q
24,915
2.7
2,819
7.1
11.3
389
285
95
2,241
773
34.5
1,468
1,468
13.4
1Q
21,689
8.3
1,715
-5.2
7.9
376
212
186
1,312
428
32.6
884
884
-5.3
CY17
2Q
23,833
13.4
2,236
31.5
9.4
393
285
40
1,598
542
33.9
1,056
1,056
36.4
CY16
3Q
24,383
18.7
2,533
67.1
10.4
393
327
100
1,913
648
33.9
1,264
1,264
45.2
4Q
30,864
23.9
3,680
30.5
11.9
410
345
53
2,977
871
29.3
2,106
2,106
43.5
85,318
6.4
7,901
5.8
9.3
1510
919
658
6,131
1,957
31.9
3,687
4,175
25.0
CY17E
99,401
16.5
10,164
28.6
10.2
1573
1,169
378
7,800
2,489
31.9
5,311
5,311
27.2
20 July 2017
16

June 2017 Results Preview | Sector: Healthcare
Alembic Pharma
Bloomberg
Equity Shares (m)
M. Cap. (INR b)/(USD b)
52-Week Range (INR)
1,6,12 Rel Perf. (%)
Financial Snapshot (INR Billion)
Y/E March
2017 2018E
Sales
EBITDA
NP
EPS (INR)
EPS Gro. (%)
BV/Sh. (INR)
RoE (%)
RoCE (%)
Valuations
P/E (x)
P/BV (x)
EV/EBITDA (x)
EV/Sales (x)
D. Yield (%)
23.7
5.1
15.7
3.1
1.0
20.5
4.3
13.4
2.6
1.0
16.8
3.5
10.8
2.2
1.0
14.2
2.9
8.7
1.8
1.0
31.0
6.1
4.0
21.6
-43.5
100.8
23.0
22.1
35.4
6.9
4.7
24.9
15.5
119.8
22.6
22.0
ALPM IN
188.5
96 / 1
709 / 492
-5 / -33 / -26
CMP: INR512
n
TP:INR640(+25%)
Neutral
2019E
41.2
8.5
5.8
30.5
22.4
144.3
23.1
22.7
2020E
47.4
10.0
6.8
36.1
18.3
174.4
22.7
28.8
n
n
n
In 1QFY18, we expect Alembic Pharma (ALPM) to post modest 5%
YoY growth in reported sales to INR7.6b. International business is
expected to decline 4.4% YoY owing to lower contribution from
gAbilify, partially offset by new launches, including Pristiq generic
launch. India business is expected to grow 14% YoY to INR3.4b.
Reported EBITDA is likely to decrease ~9% YoY to INR1.4b, with
EBITDA margin contracting 280bpYoY, primarily on account of lower
gAbilify sales in 1QFY18 numbers.
We expect reported PAT to decline 9.3% YoY to INR92m.
We believe intensifying competition in Abilify, coupled with high
R&D expense and a rise in depreciation due to planned capex of
INR7b, will keep profit growth under check. We maintain Neutral
with a TP of INR640 @20x FY19E EPS.
Key issues to watch out
Ø
Contribution of chronic portfolio and growth strategy.
Ø
Performance of US operations amid market pressure.
Ø
Outlook on future ANDA launches/filings.
Quarterly Performance
Y/E March
Net Sales
YoY Change (%)
Total Expenditure
EBITDA
Margins (%)
Depreciation
Interest
Other Income
PBT
Tax
Rate (%)
Minority Interest & Profit/Loss of Asso. Cos.
Adj. PAT
YoY Change (%)
Margins (%)
E: MOSL Estimates
1Q
7,270
24.6
5,711.2
1,559
21.4
193.8
10.7
14.1
1,369
332.7
24.3
16.1
1,020
46.2
14.0
FY17
2Q
8,716
-13.1
6,945
1,771
20.3
206
10
12
1,567
332
21.2
49
1,187
-58.8
13.6
3Q
7,699
-16.4
6,253
1,446
18.8
211
8
10
1,237
393
31.8
-17
861
-68.0
11.2
4Q
7,367
17.8
6,032
1,335
18.1
218
18
20
1,118
165
14.7
23
930
2.2
12.6
1QE
7,636
5.0
6,216
1,420
18.6
225.0
18.0
9
1,186
261.0
22.0
0
925
-9.3
12.1
FY18E
2QE
3QE
8,443 8,823
-3.1
14.6
6,788 7,006
1,655 1,818
19.6
20.6
225
225
14
14
9
9
1,425 1,588
313
349
22.0
22.0
0
0
1,111 1,238
-6.4
43.8
13.2
14.0
4QE
10,474
42.2
8,433
2,041
19.5
228
-4
8
1,825
402
22.0
0
1,424
53.0
13.6
(INR Million)
FY17
31,013
-1.4
24,904
6,109
19.7
830
51
62
5,290
1,222
23.1
38
4,029
-45.3
13.0
FY18E
35,377
14.1
28,443
6,934
19.6
903
42
35
6,024
1,325
22.0
0
4,699
16.6
13.3
20 July 2017
17

June 2017 Results Preview | Sector: Automobiles
Bajaj Auto
Bloomberg
Equity Shares (m)
M. Cap. (INR b)/(USD b)
52-Week Range (INR)
1,6,12 Rel Perf. (%)
BJAUT IN
289.4
802 / 12
3122 / 2510
-2 / -14 / -10
CMP: INR2,771 TP:INR3,359 (+21%)
Buy
Financial Snapshot (INR b)
Y/E MAR
2017 2018E 2019E 2020E
Sales
EBITDA
NP
Adj. EPS (INR)
EPS Gr. (%)
BV/Sh. (INR)
RoE (%)
RoCE (%)
Payout (%)
Valuations
P/E (x)
P/BV (x)
EV/EBITDA (x)
Div. Yield (%)
21.0
4.7
15.1
2.0
19.3
4.2
13.2
2.3
16.5
3.8
11.0
2.9
14.2
3.6
9.2
4.5
218
44.2
38.3
132
-2.6
589
25.3
24.6
50.0
236
47.3
41.5
143
8.5
654
23.1
22.4
54.4
264
54.5
48.6
168
17.0
721
24.4
23.6
60.0
298
62.7
56.5
195
16.2
770
26.2
34.4
75.0
n
Overall volume declined ~10.7% YoY (grew 12.8% QoQ) to 888k
units due to ~23.3% YoY decline in domestic volume, while
exports grew 10.5% YoY. The decline in domestic volume was due
to pre-buy impact and postponement in purchases due to GST.
n
We expect realization to grow 1.9% YoY (decline 5% QoQ), led by
improvement in mix product mix. As a result, net revenues is
likely to decline ~8.9% YoY.
n
EBITDA margin is likely to contract 130bp YoY (expand 64bp QoQ)
to 19.1% due to higher commodity prices and other expenses. We
expect ~10bp impact of lower price due to GST since 15
th
June
2017.
n
Further, we estimate ~30bp margin impact due to compensation
of input tax credit to dealers in 2QFY17.
n
PAT is likely to decline ~9.7% YoY (grow 10.2% QoQ) to INR8.8b.
n
We have lowered our total volume estimates by 2.8% for FY18
and 4.5% for FY19, resulting in EPS cut of 4.6% for FY18 and 5.8%
for FY19.
n
The stock trades at 19.3x FY18E and 16.5x FY19E EPS; maintain
Buy.
Key issues to watch
Ø
Update on demand for new launches, channel inventory post
BS-IV; outlook for FY18.
Ø
Export demand outlook and pricing in key exports markets.
Ø
Dealer compensation cost for ITC loss due to GST.
Ø
Comments on 3W demand recovery in domestic market.
3Q
852
-10.5
59,495
2.0
50,669
-8.7
66.8
4.8
7.9
10,439
20.6
3,193
3
772
12,858
3,612
28.1
9,246
(4.7)
4Q
788
-9.7
62,171
1.2
48,973
-8.6
67.8
4.6
9.2
9,060
18.5
2,936
2
757
11,236
3,218
28.6
8,018
(15.5)
1QE
888
-10.7
58,907
1.9
52,335
-8.9
67.4
5.3
8.3
10,017
19.1
3,200
3
775
12,440
3,608
29.0
8,832
(9.7)
FY18E
2QE
3QE
1,047
999
1.4
17.2
59,438
60,329
1.3
1.4
62,201
60,239
2.7
18.9
67.7
67.2
4.6
4.4
8.3
8.0
12,104
12,342
19.5
20.5
3,400
3,650
3
3
800
835
14,701
15,155
4,263
4,395
29.0
29.0
10,438
10,760
(7.0)
16.4
FY17
4QE
977
24.1
62,889
1.2
61,473
25.5
67.7
4.3
7.2
12,884
21.0
4,162
3
858
16,185
4,694
29.0
11,492
43.3
3,666
(5.8)
59,419
2.4
217,827
(3.6)
67.1
4.6
8.0
44,384
20.4
12,220
14
3,073
53,516
15,081
28.2
38,436
(2.2)
FY18E
3,911
6.7
60,407
1.7
236,249
8.5
67.5
4.6
8.0
47,347
20.0
14,412
10
3,268
58,481
16,960
29.0
41,522
8.0
Quarterly Performance
Y/E March (INR m)
Volumes ('000 units)
Growth YoY (%)
Realization (INR/unit)
Growth YoY (%)
Net Sales
Change (%)
RM/Sales %
Staff cost/Sales %
Oth. Exp./Sales %
EBITDA
EBITDA Margins (%)
Other Income
Interest
Depreciation
PBT
Tax
Effective Tax Rate (%)
Adj. PAT
Change (%)
E: MOSL Estimates
1Q
995
-1.8
57,784
4.5
57,480
2.7
67.2
4.7
7.7
11,763
20.5
2,671
2
775
13,657
3,873
28.4
9,784
2.2
FY17
2Q
1,032
-2.3
58,676
2.0
60,545
-0.4
67.0
4.3
7.4
12,961
21.4
3,420
7
770
15,605
4,378
28.1
11,228
6.7
20 July 2017
18

June 2017 Results Preview | Sector: Media
D B Corp
Bloomberg
Equity Shares (m)
M. Cap. (INR b)/(USD b)
52-Week Range (INR)
1,6,12 Rel Perf. (%)
DBCL IN
183.4
70 / 1
448 / 345
1 / -15 / -16
n
n
CMP: INR381
n
TP: INR450 (+18%)
Buy
Financial Snapshot (INR Billion)
Y/E MARCH
2017 2018E 2019E 2020E
Net Sales
EBITDA
Adj. Net Profit
Adj. EPS (INR)
Adj. EPS Gr. (%)
BV/Sh (INR)
RoE (%)
RoCE (%)
Div. Payout (%)
Valuations
P/E (x)
P/BV (x)
EV/EBITDA (x)
Div. Yield (%)
18.7
4.4
10.7
2.5
16.1
3.9
9.0
2.8
13.9
3.5
7.8
3.3
12.1
3.1
6.7
3.8
22.4
6.4
3.7
20.4
25.8
86.7
25.5
23.0
55.0
24.4
7.2
4.3
23.6
16.0
25.7
24.0
55.0
26.5
8.0
5.0
27.5
16.1
26.5
24.9
55.0
28.5
8.9
5.8
31.4
14.4
26.9
25.4
55.0
n
n
n
n
97.3 109.7 123.8
Given the high base effect, DB Corp’s Print ad growth rate would be
subdued at 3% (INR3.85b). April and May ad spends were healthy;
however, there was some pain in June from FMCG, as primary sales
took a hit amidst the GST rollout frenzy.
Circulation revenue is likely to grow 8% YoY to INR1.27b.
DBCL’s aggregate revenue is likely to grow 4% YoY to INR5.94b, as
print ad revenue, which accounts for ~65% of overall revenue,
remains under pressure.
Raw material cost is expected to increase 5% YoY, largely volume-
led. Newsprint prices are expected remain flat QoQ.
We expect EBITDA margin to remain largely flat YoY at 31.1%.
We estimate net profit at INR1.12b, up 8% YoY.
We maintain our target price at INR450 (16x FY19E EPS). The stock
trades at 16.2x FY18E and 13.9x FY19E EPS. Buy.
Key things to watch for
Ø
YoY ad growth (we expect 3%).
Ø
EBITDA margin (we expect 31.1%).
Quarterly Performance
Y/E March
Sales
YoY (%)
Operating Expenses
EBITDA
YoY (%)
EBITDA margin (%)
Depreciation
Interest
Other Income
PBT
Tax
Effective Tax Rate (%)
PAT
Minority Interest
Adj PAT
YoY (%)
1Q
5,704
20.5
3,892
1,812
48.7
31.8
211
34
41
1,608
568
35.3
1,040
0
1,040
56.5
FY17
2Q
5,287
10.6
3,782
1,505
33.6
28.5
216
6
41
1,325
440
33.2
885
0
885
47.3
3Q
6,273
7.1
4,290
1,982
6.1
31.6
218
30
36
1,771
590
33.3
1,181
0
1,181
10.6
4Q
5,171
0.6
4,049
1,122
-1.7
21.7
218
5
51
950
309
32.5
641
0
641
-0.2
1Q
5,942
4.2
4,095
1,847
1.9
31.1
220
11
80
1,696
577
34.0
1,120
0
1,120
7.7
FY18
2Q
5,700
7.8
4,189
1,512
0.4
26.5
225
11
80
1,356
461
34.0
895
0
895
1.1
3Q
7,071
12.7
4,552
2,519
27.1
35.6
227
10
80
2,362
803
34.0
1,559
0
1,559
32.0
4Q
5,653
9.3
4,325
1,328
18.3
23.5
224
11
81
1,174
399
34.0
775
0
775
20.8
(INR Million)
FY17
22,435
9.4
16,013
6,422
19.9
28.6
863
74
170
5,654
1,907
33.7
3,747
0
3,747
25.9
FY18E
24,366
8.6
17,160
7,205
12.2
29.6
896
43
321
6,588
2,240
34.0
4,348
0
4,348
16.0
20 July 2017
19

June 2017 Results Preview | Sector: Metals
Hindustan Zinc
Bloomberg
Equity Shares (m)
M. Cap. (INR b)/(USD b)
52-Week Range (INR)
1,6,12 Rel Perf. (%)
HZ IN
4225.3
1231 / 19
333 / 158
-11 / 9 / 35
CMP:INR291
n
TP: INR246 (-8%)
Sell
Financial Snapshot (INR Billion)
Y/E March
2017 2018E 2019E 2020E
Sales
173.0
204
222
229
EBITDA
97.4 113.0 123.5 126.1
NP
83.2
83.1
91.6 94.1
Adj. EPS (INR)
19.7
19.7
21.7 22.3
EPS Gr(%)
-0.1
10.2
2.8
BV/Sh. (INR)
72.9
54.3
55.2 56.1
RoE (%)
24.4
30.9
39.6 40.1
RoCE (%)
29.4
37.4
56.0 55.9
Payout (%)
96.0
96.0 96.0
Valuations
P/E (x)
11.9
11.9
10.8 10.5
P/BV (x)
9.8
9.6
8.8
8.6
EV/EBITDA (x)
11.5
8.4
7.7
7.4
Div. Yield (%)
6.7
7.4
7.6
n
We estimate HZL’s EBITDA to increase ~2x YoY to INR23.6b,
driven by higher LME and normalization of volumes. LME zinc is
up 35% YoY to USD2,589/t, while lead is up 26% YoY to
USD2,159/t. 1Q of last year was impacted by phasing of mining
operations. As a result, mine production is estimated to increase
73% YoY to 220kt in 1QFY18.
We estimate PAT to increase 65% YoY to INR17b. Other income is
estimated to decline 51% YoY to INR3b on lower cash balance due
to dividend payout.
Key issues to watch for:
Ø
Decline in global zinc prices.
Ø
Production issues.
Quarterly Performance
Y/E March
Net Sales
Change (YoY %)
EBITDA
Change (YoY %)
As % of Net Sales
Finance cost
DD&A
Other Income
PBT (before EO item)
EO exp. (income)
PBT (after EO item)
Total Tax
% Tax
Reported PAT
Adjusted PAT
Change (YoY %)
E=Estimate
1Q
25,306
-30.3
11,309
-42.5
44.7
712
3,644
6,101
13,053
5
13,048
2,680
20.5
10,369
10,374
-53.4
FY17
2Q
35,257
-12.6
20,767
2.6
58.9
712
4,317
7,702
23,440
0
23,440
4,421
18.9
19,019
19,019
-11.4
3Q
49,799
45.2
27,834
88.3
55.9
451
4,589
5,882
28,676
0
28,676
5,477
19.1
23,199
23,199
28.1
4Q
62,602
99.9
37,480
186.5
59.9
142
5,321
4,811
36,829
0
36,829
6,259
17.0
30,570
30,570
42.2
1QE
44,195
74.6
23,652
109.2
53.5
90
4,955
3,012
21,619
0
21,619
4,540
21.0
17,079
17,079
64.6
FY18
2QE
50,002
41.8
27,960
34.6
55.9
0
5,004
3,149
26,105
0
26,105
5,482
21.0
20,623
20,623
8.4
3QE
53,715
7.9
30,073
8.0
56.0
0
5,054
3,349
28,368
0
28,368
5,957
21.0
22,411
22,411
-3.4
4QE
55,886
-10.7
31,308
-16.5
56.0
0
5,105
2,917
29,120
0
29,120
6,115
21.0
23,005
23,005
-24.7
(INR Million)
FY17
172,964
21.6
97,390
43.7
56.3
2,017
17,871
24,496
101,998
-5
102,003
18,837
18.5
83,166
83,161
-0.7
FY18E
203,797
17.8
112,993
16.0
55.4
90
20,119
12,427
105,212
0
105,212
22,094
21.0
83,117
83,117
-0.1
20 July 2017
20

June 2017 Results Preview | Sector: Financials - Banks
Kotak Mahindra Bank
Bloomberg
Equity Shares (m)
M. Cap. (INR b)/(USD b)
52-Week Range (INR)
1,6,12 Rel Perf. (%)
Financial Snapshot (INR b)
2017 2018E
Y/E MARCH
E
NII
81.3
92.6
OP
59.8
71.9
NP
34.1
42.2
Cons. NP
49.4
61.3
NIM (%)
4.4
4.4
Cons. EPS (INR)
26.8
32.2
EPS Gr. (%)
42.3
20.1
Cons. BV. (INR)
207
232
Cons. RoE (%)
13.8
14.9
RoA (%)
1.7
1.8
Payout (%)
4.7
4.7
Valuations
P/E(X) (Cons.)
35.7
29.8
P/BV (X) (Cons.)
4.6
4.1
Div. Yield (%)
0.1
0.1
KMB IN
1834.4
1759 / 27
1005 / 692
0 / 21 / 14
CMP: INR959
n
TP: INR1,146 (+19%)
Buy
2019E
109.6
88.7
53.4
76.8
4.4
40.4
25.2
271
16.1
2.0
4.7
23.8
3.5
0.1
2020E
132.1
110.6
66.7
94.9
4.3
49.9
23.5
319
16.9
2.0
4.7
19.2
3.0
0.1
n
n
n
n
We expect the standalone bank to report 16% loan growth and 17%
deposit growth in 1QFY18. NIM is likely to shrink ~5bp QoQ, but
improve
5bp
YoY. Overall, we expect NII growth of 16% YoY. CASA
retention would be a key driver of NII and NIM. We estimate a 5bp
benefit to NIM (4.5% in 1QFY18) from the QIP.
With strong digital initiatives, fast-paced customer acquisition and
merger synergies from eIVBL, fee income would be a key growth
driver for the bank. We factor in other income growth of 16% in 1Q,
driven mostly by healthy fee traction and expect an improving trend
in the coming quarters.
We expect asset quality to remain stable, with GNPA at ~2.65% and
NNPA at 1.2%, led by a high provision coverage ratio.
We revise FY18E/FY19E PAT upwards by 4.6%/4.3% to account for capital
raise of INR58b.
On a reported basis, we expect standalone bank earnings to grow
24% YoY. The stock trades at 3.5x FY19E consolidated BV and 23.8x
FY19E consolidated EPS. Maintain Buy.
Key issues to watch for
Ø
Guidance on balance sheet growth.
Ø
Ø
Performance on CASA, fees and growth
Performance of non-banking subsidiaries and their contribution to
overall profit.
Quarterly Performance
Y/E March
1Q
Kotak Bank (standalone)
Net Interest Income
% Change (Y-o-Y)
Operating Profit
% Change (Y-o-Y)
Net Profit
% Change (Y-o-Y)
Other Businesses
Kotak Prime
Kotak Mah. Investments
Kotak Mah. Capital Co
Kotak Securities
International subs
Kotak Mah. AMC & Trustee
Co.
Kotak Investment Advisors
Kotak OM Life Insurance
Con.adj and MI
Conso. PAT
% Change (Y-o-Y)
19,191
20.1
13,150
120.3
7,420
291.0
1,200
400
230
600
130
190
110
710
-240
10,750
108.0
FY17
2Q
19,954
18.9
14,401
37.8
8,133
42.8
1,300
530
50
960
310
70
10
630
30
12,023
27.4
3Q
20,503
16.1
15,277
26.8
8,798
38.6
1,330
480
70
850
220
160
0
680
80
12,668
33.9
4Q
21,614
16.4
17,020
42.5
9,765
40.3
1,330
560
110
1,210
210
130
0
1,010
-280
14,045
33.2
1QE
22,241
15.9
15,824
20.3
9,190
23.9
1,400
500
120
1,020
250
240
40
795
-50
13,505
25.6
FY18E
2QE
23,038
15.5
17,578
22.1
10,083
24.0
1,470
650
132
1,061
263
252
42
706
-50
14,608
21.5
FY17
3QE
23,386
14.1
18,497
21.1
10,888
23.8
1,544
700
145
1,103
276
265
44
762
-50
15,676
23.7
4QE
23,974
10.9
19,962
17.3
11,997
22.9
1,601
779
166
1,149
330
286
49
1,222
-50
17,528
24.8
81,262
17.8
59,848
48.1
34,115
63.2
5,150
1,960
460
3,610
860
560
125
3,030
-385
49,485
43.0
FY18E
92,640
14.0
71,861
20.1
42,159
23.6
6,014
2,629
563
4,333
1,118
1,042
175
3,485
-200
61,318
23.9
20 July 2017
21

June 2017 Results Preview | Sector: Technology
NIIT Technologies
Bloomberg
Equity Shares (m)
M. Cap. (INR b)/(USD b)
52-Week Range (INR)
1,6,12 Rel Perf. (%)
NITEC IN
61.2
35 / 1
595 / 370
5 / 12 / -7
n
CMP: INR565
n
TP: INR470 (-17%)
Neutral
Financial Snapshot (INR b)
y/e march
2017 2018E 2019E 2020E
Sales
27.7
28.3
30.8
33.2
EBITDA
4.6
4.6
5.1
5.4
PAT
2.7
2.5
2.9
3.2
EPS (INR)
42.8
41.0
47.3
52.7
EPS Gr. (%)
-6.5
-4.3
15.5
11.3
BV/Sh. (INR) 273.8 297.9 326.0 337.7
RoE (%)
16.1
14.3
15.2
15.9
RoCE (%)
16.4
13.9
14.8
15.3
Payout (%)
29.2
34.2
33.8
30.4
Valuations
P/E (x)
13.2
13.8
11.9
10.7
P/BV (x)
2.1
1.9
1.7
1.7
EV/EBITDA
6.1
6.5
5.5
5.0
(x) Yld (%)
Div
2.2
2.5
2.8
2.8
n
n
n
We expect 1.3% QoQ CC revenue growth for NITEC in 1QFY18. The
high base created by GIS seasonality in 4Q should put some
pressure on revenue growth.
Moreover, bookings using the start date of the month would result
in 50bp of a headwind on account of cross-currency movement,
which has been a tailwind for peers. This would lead to USD
revenue growth of 0.8% QoQ.
We expect EBITDA margin to decline by 210bp QoQ to 15.8%,
because of INR appreciation, cross-currency headwinds, visa
expenses, wage hikes and absence of seasonal strength in GIS.
Our PAT estimate is INR587m, -45.3% QoQ, driven by lower
profitability, ETR normalization, and absence of exceptional gains.
The stock trades at 13.8x FY18E and 11.9x FY19E earnings. Neutral.
Key issues to watch for
Ø
Ø
Traction in the international business.
Demand environment and update on ramp-up delays.
Ø
Deal wins.
Quarterly Performance (IFRS)
Y/E March
Revenue (USD m) Ex. forex
QoQ (%)
Revenue (INR m)
YoY (%)
GPM (%)
SGA (%)
EBITDA
EBITDA Margin (%)
EBIT Margin (%)
Other income
ETR (%)
Minority Interest
PAT
QoQ (%)
YoY (%)
EPS (INR)
Headcount
Util excl. trainees (%)
Attrition (%)
Offshore rev. (%)
Fixed Price (%)
1Q
99
-2.5
6,692
4.4
35.3
20.0
1,023
15.3
10.9
71
10.3
46.0
313
-60.4
-46.7
5.1
9,022
79.8
13.4
39.0
46.0
FY17
2Q
3Q
103
101
4.2
-2.4
6,913
6,922
2.0
2.0
35.3
36.2
19.0
19.3
1,122
1,168
16.2
16.9
12.0
12.7
27
45
24.2
24.2
54.0
48.0
596
653
90.4
9.6
-12.7
-11.9
9.7
10.6
8,868
8,809
81.0
80.0
12.9
12.9
39.0
40.0
46.0
48.0
4Q
104
3.1
7,160
4.6
36.6
18.7
1,284
17.9
14.0
44
15.9
72.0
1,073
64.3
35.8
13.1
8,853
81.0
12.7
41.0
48.0
1QE
105
0.8
6,862
2.5
34.8
19.0
1,084
15.8
11.5
80
24.0
72.0
587
-45.3
87.6
9.5
8,978
80.5
FY18E
2QE
3QE
106
108
1.5
1.4
7,012
7,130
1.4
3.0
35.0
34.6
18.8
18.6
1,134
1,140
16.2
16.0
11.9
11.7
82
87
24.0
24.0
72.0
72.0
623
628
6.0
0.9
4.5
-3.8
10.1
10.2
9,153
9,353
80.0
79.0
FY17
4QE
110
2.5
7,333
2.4
34.9
18.4
1,211
16.5
12.3
96
24.0
72.0
685
9.1
-36.1
11.1
9,553
79.5
407
0.3
27,687
3.2
35.8
19.2
4,597
16.6
12.4
187
18.7
220.0
2,635
-5.9
38.5
8,853
80.4
39.8
(INR m)
FY18E
429
5.4
28,337
2.3
34.8
18.7
4,569
16.1
11.8
344
24.0
288.0
2,523
-4.3
41.0
9,553
79.7
40.8
20 July 2017
22

June 2017 Results Preview | Sector: Financials - Banks
RBL Bank
Bloomberg
Equity Shares (m)
M. Cap. (INR b)/(USD b)
52-Week Range (INR)
1,6,12 Rel Perf. (%)
RBK IN
375.2
196 / 3
600 / 274
13/69/-
CMP: INR522
n
n
Under Review
Financial Snapshot (INR b)
Y/E March
2017 2018E 2019E 2020E
NII
12.2
16.0
21.3
28.3
OP
9.2
12.5
17.0
22.9
NP
4.5
6.8
9.1
12.0
NIM (%)
3.0
3.2
3.2
3.2
EPS (INR)
11.9
18.0
24.2
32.1
EPS Gr. (%)
32.0
51.4
34.2
32.8
BV/Sh. (INR)
113.4 128.2 148.1 174.6
ABV/Sh. (INR) 112.7 127.2 146.8 172.7
RoE (%)
12.3
14.9
17.5
19.9
RoA (%)
1.0
1.2
1.3
1.3
Valuations
P/E(X)
43.9
29.0
21.6
16.3
P/BV (X)
4.6
4.1
3.5
3.0
P/ABV (X)
4.6
4.1
3.6
3.0
Div. Yield (%)
0.3
0.5
0.7
0.9
n
n
n
Loan growth (+43% YoY) and deposit growth (+45% YoY) would be
significantly above industry average.
We expect NII to grow 53% YoY, led by strong loan growth and
stable to slightly improving NIMs, and helped by strong CASA
inflows and fall in bulk deposit rates.
Overall non-interest income is expected to grow by ~27% YoY, led
by strong growth in fee income and digital initiatives. We expect
opex growth of 34%, led by continued capacity expansion.
However, opex is expected to trail total income growth of 43%,
driving 54% YoY increase in PPoP.
Asset quality is expected to remain largely stable in 4QFY17, though
some stress could materialize, particularly in the MFI segment.
Credit costs would largely be under control.
We expect PAT growth of 9% QoQ and 46% YoY. RBK trades at 3.5x
FY19E BV and 21.6x FY19E EPS. We await management
commentary on asset quality and growth outlook, and maintain our
rating at Under Review.
Key issues to watch for
Ø
Management commentary on slippages in SME segment.
Ø
Ø
Update and commentary on balance sheet growth strategy.
CASA ratio and traction on NIMs.
Quarterly Performance
Net Interest Income
% Change (Y-o-Y)
Other Income
Net Income
Operating Expenses
Operating Profit
% Change (Y-o-Y)
Other Provisions
Profit before Tax
Tax Provisions
Net Profit
% Change (Y-o-Y)
Operating Parameters
NIM (Cal, %)
Deposit Growth (%)
Loan Growth (%)
Tax Rate (%)
Asset Quality
Gross NPA (INR b)
Gross NPA (%)
1Q
2,447
46.8
1,675
4,122
2,277
1,845
65.3
426
1,419
445
973
61.4
2.7
FY17
2Q
3,029
59.5
1,691
4,721
2,530
2,191
81.3
781
1,410
512
899
34.3
3.2
37.8
44.0
36.3
2.7
1.1
3Q
3,216
44.6
1,823
5,038
2,687
2,351
57.6
362
1,989
703
1,287
58.8
3.2
43.9
46.3
35.3
2.9
1.1
4Q
3,522
46.6
2,366
5,887
3,070
2,818
75.2
821
1,997
695
1,301
54.6
3.3
42.1
38.7
34.8
3.6
1.2
1QE
3,748
53.2
2,128
5,876
3,041
2,835
53.7
700
2,135
715
1,420
45.9
3.3
44.8
42.8
FY18E
2QE
3,888
28.3
2,498
6,386
3,233
3,153
43.9
600
2,553
855
1,698
88.9
3.2
43.0
38.1
3QE
4,045
25.8
2,602
6,647
3,468
3,179
35.2
500
2,679
897
1,781
38.4
3.1
45.2
38.6
4QE
4,288
21.8
3,088
7,376
4,073
3,303
17.2
515
2,787
934
1,853
42.4
3.1
32.0
35.0
(INR Million)
FY17
12,213
49.1
7,555
19,768
10,564
9,204
69.7
2,389
6,815
2,354
4,461
52.5
3.0
32.0
35.0
34.5
3.6
1.2
FY18
15,969
30.8
10,315
26,285
13,815
12,470
35.5
2,315
10,154
3,402
6,752
51.4
3.2
40.0
35.0
33.5
5.4
1.4
31.4
2.5
1.1
4.2
1.3
4.8
1.4
5.1
1.4
5.4
1.4
20 July 2017
23

June 2017 Results Preview | Sector: Oil &Gas
Reliance Industries
Bloomberg
Equity Shares (m)
M. Cap. (INR b)/(USD b)
52-Week Range (INR)
1,6,12 Rel Perf. (%)
Financial snapshot (INR b)
y/e march
2017 2018E
Net Sales
EBITDA
Net Profit
EPS (INR)
EPS Gr. (%)
BV/Sh. (INR)
RoE (%)
RoCE (%)
Payout (%)
Valuations
P/E (x)
P/BV (x)
EV/EBITDA
(x)
EV/Sales (x)
13.3
1.5
12.0
2.1
11.7
1.3
8.7
1.4
10.9
1.2
7.1
1.0
10.5
1.1
6.6
0.9
432.6
314.3
106.6
14.6
11.9
9.1
14.6
510.2
359.8
122.1
14.5
11.8
10.1
14.4
RIL IN
3240.0
4610 / 71
1465 / 932
8 / 16 / 30
CMP: INR1,423 TP: INR1,262 (-11%)
n
n
Neutral
We expect RIL to report GRM of USD10/bbl v/s USD11.5/bbl in
4QFY17 and 1QFY17.
RIL is expected to report a decline in its GRM in the quarter, led by
narrowing light-heavy differential and inventory losses. While we expect
subdued profitability in the refining segment, petchem profitability is
expected to increase YoY/QoQ, led by improved deltas and an increase in
petchem volumes.
2019E 2020E
538.8
386.1
131.0
7.3
11.5
10.2
14.4
522.3
399.2
135.4
3.4
10.8
9.6
14.4
n
n
n
2,420.3 3,190.8 3,740.1 3,677.1
978.1 1,082.6 1,194.7 1,310.6
We expect RIL to report EBITDA of INR118.5b v/s INR112.8b in
4QFY17 and INR108.2b in 1QFY17.
We expect RIL to report standalone PAT of INR82.9b (+10% YoY and
+2% QoQ).
RIL trades at 10.9x FY19E adjusted EPS of INR131. It new
refining/petchem projects are likely to add to earnings from
2HFY18/FY19, but the telecom business would be a drag on
profitability. Maintain Neutral.
Key issues to watch for
Ø
Ø
Ø
Ø
GRM.
Petchem margins.
Progress on core expansions.
Update on telecom venture.
Standalone - Quarterly Earning Model
Y/E March
Net Sales
YoY Change (%)
Total Expenditure
EBITDA
Margins (%)
Depreciation
Interest
Other Income
PBT
Tax
Rate (%)
Adj. PAT
YoY Change (%)
Margins (%)
Key Assumptions
Refining throughput (mmt)
GRM (USD/bbl)
Petchem EBITDA/tonne (USD/MT)
Petchem volumes (mmt)
E: MOSL Estimates
1Q
534,960
-18.7
426,790
108,170
20.2
19,500
9,240
20,330
99,760
24,280
24
75,480
19.5
14.1
16.8
11.5
303.8
1.9
FY17
2Q
3Q
595,770 618,060
-2.0
9.3
490,220 512,020
105,550 106,040
17.7
17.2
20,290 20,770
6,330
9,310
22,800 30,250
101,730 106,210
24,690 25,990
24
24
77,040 80,220
17.4
11.1
12.9
13.0
18.0
10.1
314.4
2.1
17.8
10.8
329.4
2.0
4Q
671,460
34.4
558,660
112,800
16.8
24,090
2,350
13,710
100,070
18,560
19
81,510
11.4
12.1
17.5
11.5
326.2
2.1
1QE
574,944
7.5
456,421
118,523
20.6
27,456
9,355
24,600
106,313
23,389
22
82,924
9.9
14.4
17.5
10.0
350.0
2.5
FY18E
2QE
3QE
853,386 877,941
43.2
42.0
724,216 745,171
129,169 132,770
15.1
15.1
27,456 27,456
9,355
9,355
24,600 24,600
116,959 120,560
25,731 26,523
22
22
91,228 94,037
18.4
17.2
10.7
10.7
17.5
10.0
300.0
2.9
17.5
10.0
300.0
3.0
(INR Million)
FY17
FY18E
4QE
884,481 2,420,250 3,190,752
31.7
3.8
31.8
754,789 1,987,690 2,680,598
129,692 432,560 510,154
14.7
17.9
16.0
27,456
84,650 109,824
9,355
27,230
37,418
24,600
87,090
98,401
117,482 407,770 461,313
25,846
93,520 101,489
22
23
22
91,636 314,250 359,825
12.4
14.6
14.5
10.4
13.0
11.3
17.5
10.0
280.0
3.0
70.1
11.0
318.5
8.0
70.0
10.0
307.5
11.4
20 July 2017
24

June 2017 Results Preview | Sector: Technology
Wipro
Bloomberg
Equity Shares (m)
M. Cap. (INR b)/(USD b)
52-Week Range (INR)
1,6,12 Rel Perf. (%)
WPRO IN
4925.5
1280 / 20
289 / 205
-6 / -8 / -22
n
Financial Snapshot (INR b)
Y/E Mar
2017 2018E 2019E 2020E
Sales
EBITDA
PAT
EPS (INR)
EPS Gr. (%)
BV/Sh. (INR)
RoE (%)
RoCE (%)
Payout (%)
Valuations
P/E (x)
P/BV (x)
EV/EBITDA
(x)
Div Yld (%)
15.3
2.4
9.7
0.4
15.0
2.2
9.7
2.5
13.7
2.0
8.6
2.9
12.8
1.9
9.0
3.5
550.4 558.0 605.7 646.9
108.8 111.5 123.5
83.3
16.9
-6.3
16.9
13.6
5.8
83.9
17.3
2.2
15.4
12.7
37.6
91.7
18.9
9.3
15.5
13.6
39.7
34.9
98.7
20.4
7.7
15.5
14.1
44.2
n
n
n
CMP: INR259
n
TP: INR250 (-4%)
Neutral
In the previous quarter, Wipro had guided -2% to 0% QoQ CC
growth for 1Q. The weak guidance reflected the pressure in
Healthcare vertical and sluggishness in Communications and Retail.
We expect organic growth to be at the mid-point of the guided
range at -1%. A cross-currency tailwind of 110bp would lead to USD
revenue growth of 0.1% QoQ.
We expect EBIT margin in IT Services to decline by 110bp because
of the organic revenue decline, partial wage hikes and INR
appreciation.
We expect overall EBIT margin to decline by 40bp, led by improved
profitability in the Products business.
Our PAT estimate is INR18.6b, -4% QoQ on account of the revenue
decline and dip in profitability.
The stock trades at 15x FY18E and 13.7x FY19E earnings. Neutral.
105.9 117.1 127.0 136.5
n
Key issues to watch for
Ø
Revenue growth guidance for 2QFY18.
Ø
Commentary on Healthcare, Communications and Retail verticals.
Ø
Commentary on large deal wins and ramp-up schedule.
Quarterly Performance (IFRS)
Y/E March
Revenue (USD m)
QoQ (%)
Revenue (INR m)
QoQ (%)
YoY (%)
GPM (%)
SGA (%)
IT Serv. EBIT (%)
EBIT Margin (%)
Other income
ETR (%)
PAT
QoQ (%)
YoY (%)
EPS (INR)
Headcount
Util excl. trainees (%)
Attrition (%)
Offshore rev. (%)
Fixed Price (%)
E: MOSL Estimates
1Q
1,931
2.6
135,992
-0.2
11.1
29.1
13.0
17.8
16.1
4,848
22.9
20,518
-8.2
-6.2
4.2
173,863
79.7
16.5
45.6
56
FY17
2Q
3Q
1,916
1,903
-0.8
-0.7
137,657 136,878
1.2
-0.6
10.0
6.4
28.9
29.4
13.2
13.0
17.8
18.3
15.8
16.4
4,958
5,120
22.2
23.3
20,672
21,094
0.8
2.0
-7.5
-5.6
4.3
4.4
174,238 179,129
82.8
81.9
16.6
16.3
46.1
46.5
56.4
57.7
4Q
1,955
2.7
139,875
2.2
2.6
28.0
11.9
17.7
16.1
5,328
24.2
19,340
-8.3
-13.5
4.0
181,482
84.8
16.3
47.2
58.3
1QE
1,956
0.1
134,062
-4.2
-1.4
28.4
12.7
16.6
15.7
3,189
23.0
18,566
-4.0
-9.5
3.8
180,197
82.0
46.8
FY18E
2QE
3QE
1,992
2,032
1.8
2.0
137,700 141,506
2.7
2.8
0.0
3.4
28.0
28.5
12.3
12.3
16.7
17.2
15.7
16.1
5,721
5,759
23.0
23.0
20,986
21,957
13.0
4.6
1.5
4.1
4.3
4.5
184,062 187,947
82.0
82.0
46.5
46.5
FY17
4QE
2,070
1.9
144,683
2.2
3.4
28.8
12.3
17.6
16.5
5,258
23.0
22,343
1.8
15.5
4.6
191,582
82.0
46.5
7,705
4.9
550,402
7.4
28.9
12.8
17.9
16.1
20,254
23.2
83,326
-6.3
16.9
181,482
77.4
46.4
(INR m)
FY18E
8,050
4.5
557,951
1.4
28.4
12.4
17.0
16.0
19,927
23.0
83,853
0.6
17.3
191,582
77.3
46.5
20 July 2017
25

June 2017 Results Preview | Sector: Technology
Zensar Technologies
Bloomberg
Equity Shares (m)
M. Cap. (INR b)/(USD b)
52-Week Range (INR)
1,6,12 Rel Perf. (%)
ZENT IN
45.4
37 / 1
1136 / 802
-7 / -32 / -37
n
Financial Snapshot (INR b)
y/e mar
2017 2018E 2019E 2020E
Sales
EBITDA
PAT
EPS (INR)
EPS Gr. (%)
BV/Sh. (INR)
RoE (%)
RoCE (%)
Payout (%)
Valuations
P/E (x)
P/BV (x)
EV/EBITDA (x)
Div Yld (%)
14.7
2.3
8.4
1.5
13.0
2.0
7.9
1.6
10.8
1.7
6.2
1.7
10.0
1.5
5.2
1.9
30.8
3.9
2.5
54.9
-19.9
16.3
22.3
21.8
32.3
4.1
2.8
62.0
12.8
16.3
20.6
20.9
37.3
5.0
3.3
74.2
19.7
17.1
22.5
18.6
42.1
5.5
3.6
80.7
8.7
524.5
16.4
21.8
18.9
n
n
CMP: INR 805
n
TP: INR1,020 (27%)
Buy
We expect revenue of USD118m, representing growth of 5.9% QoQ.
This would translate into 5.3% QoQ CC growth, a cross-currency
tailwind of 60bp for ZENT.
4QFY17 revenue had declined by 4.9% QoQ, as implementation of
Products got deferred. Our growth expectations for 1Q are
supported by two months’ incremental revenue from Foolproof
(1.2pp), and three months integration of Keystone (2.7pp) and
1.4pp organic growth.
We expect EBITDA margin to expand by 250bp QoQ to 11.8%, led
by the absence of some one-off expenses from 4Q, ceasing of the
revenue decline, and integration of high-margin Keystone.
Our PAT estimate is INR558m, +157% QoQ on account of the sharp
profitability improvement and higher other income.
The stock trades at 13x FY18E and 10.8x FY19E earnings. Buy.
356.9 403.7 461.7
n
Key issues to watch for
Ø
Traction in Digital, large deals and other new initiatives.
Ø
Margin outlook, given the shock in 4Q.
Ø
Progress on restructuring.
Quarterly Performance (IFRS)
Y/E March
Revenue (USD m)
QoQ (%)
Revenue (INR m)
YoY (%)
GPM (%)
SGA (%)
EBITDA
EBITDA Margin (%)
EBIT Margin (%)
Other income
ETR (%)
PAT
QoQ (%)
YoY (%)
EPS (INR)
Headcount
Utilization (%)
Offshore rev. (%)
E: MOSL Estimates
1Q
114
3.1
7,624
8.2
29.1
15.3
1,053
13.8
12.5
169
30.5
763
8.5
0.1
16.9
8,238
79.8
31.2
FY17
2Q
3Q
116
118
1.8
1.3
7,767
7,922
2.7
4.7
29.7
30.0
15.6
16.2
1,092
1,090
14.1
13.8
12.5
12.4
37
183
28.2
29.1
687
811
-10.0
18.1
-24.8
13.4
15.2
18.0
8,316
8,564
80.1
79.5
33.8
33.5
4Q
112
-4.9
7,492
0.4
28.0
18.7
697
9.3
7.7
-236
28.9
217
-73.3
-69.1
4.8
8,524
79.2
34.5
1QE
118
5.9
7,610
-0.2
28.8
17.0
896
11.8
10.4
28
29.0
558
157.2
-26.8
12.4
8,724
81.0
34.2
FY18E
2QE
123
3.9
7,994
2.9
27.6
15.5
969
12.1
10.7
159
29.0
701
25.5
2.0
15.5
8,964
82.0
34.5
FY17
3QE
125
1.9
8,209
3.6
27.6
15.0
1,031
12.6
11.2
124
29.0
718
2.5
-11.5
15.9
9,214
80.5
33.8
4QE
129
2.9
8,515
13.6
29.1
15.2
1,184
13.9
12.5
114
29.0
818
13.9
277.1
18.1
9,264
81.0
33.7
459
1.4
30,805
3.9
29.2
16.4
3,932
12.8
11.3
153
29.3
2,478
-19.9
54.9
8,524
79.7
33.2
(INR m)
FY18E
496
7.9
32,327
4.9
28.3
15.6
4,079
12.6
11.2
425
29.0
2,795
12.8
62.0
9,264
81.1
34.0
20 July 2017
26

In conversation
1. India Gate' not registered; does not fall under GST Ambit:
KRBL; Anoop Gupta, Joint MD
n
n
n
n
n
n
n
n
n
n
5% GST is on the registered brand but the brand ‘India Gate’ is not registered. So
we do not fall under any 5 percent.
Will be having zero taxability as far as India Gate brand is concerned
Company is at an advantage compared to peers and would like to increase its
market share.
Average realisation is around USD 1,200 and EBITDA > 20% for exports
Company has hardly any exposure to Europe of about Rs 30-40 crore in a topline
of Rs 4,000 crore.
Current capacity utilisation of the company is 55-60 percent.
Iran will stop importing rice from next month
Coming year season looks to be very good
Lowered the price of India Gate by 3-3.5 percent
Launching a new kind of food grain called Quinoa. It will be started in next 15
days by first week of August and the revenue expected from Quinoa in first year
is Rs 100 crore.
2. LNG prices may remain low for 5-6 years: Petronet LNG; RK
Garg, Director-Finance
n
n
n
n
n
n
n
n
Overall fundamentals are good and overall growth is on increasing trend
LNG consumption in the country during 2016 have been 19 million tonne, there
has been a growth and that growth momentum would continue.
There is an increase in the overall demand of the gas in the country
Speaking about Dahej, there is a ramp up going on due to capacity expansion to
15 million tonne. Tariff increase is a yearly phenomenon and would happen in
January 2018
Mundra terminal is getting ready by end of this year and it is in Gujarat, thought
there could be some synergy with Dahej and Mundra. That is why Petronet is
looking into the terminal
No concrete decision has been taken yet, yes we are looking into it
Kochi terminal may see a ramp up in 2019
In the next five-six years LNG prices are likely to remain low and India being a
major consumer of energy and gas, we will take advantage of this low price gas
in India
20 July 2017
27

From the think tank
1. Who cares about monetary policy?
n
The Reserve Bank of India (RBI) will announce monetary policy in less than two
weeks’ time. There is already speculation about the official rate of interest,
essentially based on information about softening of the inflation rate.
Movements in both the Consumer Price Index for all items (CPI) and Whole Price
Index (WPI) show declines much below the average inflation target of 4%. In the
circumstances, it is no wonder the chief economic adviser to the ministry of
finance (MoF), Arvind Subramanian, has strongly pitched for a rate cut. Bank of
America-Merrill Lynch strongly favours rate cuts. A number of other
commentators have taken the same position. However, the amount of rate cut
is not under any serious discussion at this point in time. Do money and asset
markets care for monetary policy announcements now? Don’t they have
solutions, digital or otherwise, to counter the different scenarios of rate cut and
constancy of the rate?
2. Indian Economy: a tale of two narratives
n
There are two competing, economic narratives on India at the moment. They sit
uneasily with each other. But both are correct. The first centres around the
dramatic improvement in macroeconomic stability. Just four years ago, India
was the poster-child of emerging market vulnerability. Double-digit inflation,
and elevated fiscal and current account deficits (CAD) drove India into a mini
balance of payments crisis in 2013. There is, however, a second—more
sobering—narrative: of a near-term slowdown that may be hard to reverse
using traditional fiscal and monetary policy. After the latest gross domestic
product (GDP) revisions, the statistics have finally caught up with the economy.
It’s clear now that growth had begun to slow well before demonetisation.
3. China’s cashless revolution is likely to spread
n
On a recent trip to Shenzhen, in southern China, I came across a subway busker
with two tip jars. The first was a cardboard box filled with coins and bills; the
second was a small QR code taped to the box that allowed passersby to leave a
tip by smartphone. On one level, this was simply smart business: Chinese made
around $5.5 trillion in e-payment transactions last year. But it also offered a
glimpse of the future. Around the developing world, QR codes are beating out
Apple Pay and other brand-name payment services for consumers and
businesses keen to go cashless. China offers a useful model for that
transformation—and a standard that others may soon be emulating. The QR
code may seem like an unlikely candidate to foster a financial revolution. It was
developed in the 1990s by Japan’s Denso Corp. after customers grew dissatisfied
with the limited amount of information that could be stored using traditional
barcodes. In solving that problem, Denso came up with new codes that could be
read 10 times more quickly than their predecessors—QR stands for “quick
response.”
20 July 2017
28

International
4. Taking charge at the G-20
n
Coming on the heels of prime minister Narendra Modi’s recent visits to Tel Aviv
and Washington, DC was the G-20 summit in Hamburg, Germany. Much of the
media attention on the two-day summit focused on US President Donald Trump,
his bilateral meetings with key heads of state, and whether the Trump
administration would use the meeting to push a narrower agenda for
globalization where protectionism and parochialism, not partnership, is
emphasized. The resultant communique revealed that current US policy runs
against the consensus among G-20 countries, particularly in areas like trade and
climate change. The communique called for new trade deals to be reciprocal
and non-discriminatory, swiftly dispensing with now seemingly archaic notions
of trade liberalization. The US aside, the other 19 countries affirmed the
importance of climate change, declaring the Paris Agreement as “irreversible”.
20 July 2017
29

Click excel icon
for detailed
valuation guide
Rs
Valuation snapshot
P/E (x)
P/B (x)
FY17 FY18E FY17 FY18E
29.8
23.3
21.4
43.9
51.5
19.8
47.5
37.5
32.7
26.7
22.3
25.5
46.5
30.4
23.2
48.8
28.7
33.9
27.7
36.0
23.9
29.8
19.7
20.7
32.9
NM
37.1
45.3
13.1
21.4
28.9
27.5
NM
19.8
37.9
11.3
NM
25.4
985.7
20.4
107.7
45.9
36.8
25.0
15.8
60.1
35.3
16.7
19.6
11.7
50.4
24.7
19.4
19.7
30.5
37.5
19.3
33.9
28.9
17.7
22.6
19.0
20.7
25.3
25.8
14.9
35.2
22.3
21.9
23.1
35.2
21.1
25.2
19.3
17.7
25.5
19.8
30.9
29.9
10.0
17.2
23.0
8.9
11.4
10.3
9.0
9.9
8.8
15.4
16.4
6.4
12.9
32.0
18.7
20.9
12.7
49.1
32.7
12.9
15.7
9.4
26.3
5.5
5.1
4.8
6.5
8.5
3.1
16.5
7.2
3.3
3.7
7.4
3.2
2.9
6.3
2.7
11.3
4.9
2.3
2.8
2.6
2.3
4.9
2.2
1.4
4.8
0.8
4.8
4.7
1.1
3.3
3.3
1.1
0.7
0.8
0.5
1.1
0.4
0.9
1.4
0.5
0.9
8.8
4.4
4.2
1.9
18.0
6.5
4.0
3.5
2.6
3.1
4.7
4.4
4.3
5.6
7.5
2.7
11.9
5.9
2.8
3.3
6.3
2.9
2.6
5.5
2.3
9.1
4.2
2.1
2.3
2.4
1.9
4.4
2.1
1.4
4.1
0.8
4.3
4.2
1.0
2.9
2.9
1.0
0.7
0.7
0.5
1.0
0.4
0.8
1.3
0.5
0.9
7.1
3.5
3.6
1.7
14.7
5.9
3.5
3.0
2.3
2.9
ROE (%)
FY17 FY18E FY19E
20.3
23.3
25.3
16.2
15.8
16.9
40.3
20.8
10.6
14.0
35.7
14.2
6.4
20.3
9.8
25.6
17.1
6.9
10.8
8.9
9.9
17.9
10.2
7.2
15.4
-27.0
13.8
12.3
9.5
18.9
11.4
4.1
-6.7
4.2
1.4
10.1
-8.4
3.6
-0.2
2.7
0.9
21.7
15.1
18.1
14.4
32.5
19.3
25.5
19.4
24.0
6.3
20.4
24.5
23.1
19.8
21.1
15.1
40.8
22.4
17.3
14.8
36.0
14.1
10.8
20.8
16.5
28.6
19.0
10.1
11.4
7.1
10.2
18.2
9.4
7.9
17.3
4.0
14.9
14.9
10.8
18.0
12.8
11.9
6.1
7.5
5.8
10.6
4.6
5.6
8.7
8.1
6.7
24.6
20.9
18.5
13.9
33.0
18.3
29.0
20.6
25.9
11.4
20.7
27.1
24.4
22.3
21.9
17.8
38.0
23.6
18.3
15.9
31.0
14.6
11.5
22.8
27.3
35.2
22.6
15.4
11.8
10.1
10.5
19.0
10.1
8.8
18.5
7.0
16.1
17.5
12.7
19.5
14.4
13.2
9.0
9.4
7.3
11.1
5.4
7.5
10.0
10.5
8.3
26.4
21.6
18.9
15.3
32.8
17.4
32.7
19.7
26.9
12.8
Company
Reco
Automobiles
Amara Raja
Buy
Ashok Ley.
Buy
Bajaj Auto
Buy
Bharat Forge
Buy
Bosch
Neutral
CEAT
Buy
Eicher Mot.
Buy
Endurance Tech. Buy
Escorts
Neutral
Exide Ind
Buy
Hero Moto
Neutral
M&M
Buy
Mahindra CIE
Not Rated
Maruti Suzuki
Buy
Tata Motors
Buy
TVS Motor
Buy
Aggregate
Banks - Private
Axis Bank
Neutral
DCB Bank
Neutral
Equitas Hold.
Buy
Federal Bank
Buy
HDFC Bank
Buy
ICICI Bank
Buy
IDFC Bank
Neutral
IndusInd
Buy
J&K Bank
Neutral
Kotak Mah. Bk
Buy
RBL Bank
Under Review
South Indian
Buy
Yes Bank
Buy
Aggregate
Banks - PSU
BOB
Buy
BOI
Neutral
Canara
Neutral
IDBI Bk
Neutral
Indian Bk
Buy
OBC
Neutral
PNB
Buy
SBI
Buy
Union Bk
Neutral
Aggregate
NBFCs
Bajaj Fin.
Buy
Bharat Fin.
Neutral
Cholaman.Inv.&Fn Buy
Dewan Hsg.
Buy
GRUH Fin.
Neutral
HDFC
Under Review
Indiabulls Hsg
Buy
LIC Hsg Fin
Neutral
Manappuram
Not Rated
M&M Fin.
Buy
CMP
(INR)
TP
% Upside
EPS (INR)
(INR) Downside FY17 FY18E FY19E
28
14
19
16
-3
13
7
16
12
31
-3
15
12
45
6
28.0
4.6
132.3
26.2
473.1
93.3
613.8
23.5
20.0
8.2
169.1
54.3
5.4
248.6
19.8
11.7
33.8
40.5
5.5
7.1
143.5 167.9
37.7
49.7
649.9 766.2
96.2 131.3
861.2 1,102.9
30.5
38.8
36.9
45.7
9.7
11.9
198.2 198.7
66.7
79.9
9.9
11.8
292.6 379.7
30.9
64.3
16.3
25.9
835
1,073
107
122
2,825 3,359
1,148 1,330
24,366 23,738
1,852 2,100
29,181 31,326
881
1,025
653
731
218
286
3,766 3,666
1,383 1,586
249
-
7,561 8,483
461
666
574
606
520
194
170
115
1,693
302
62
1,576
87
995
538
29
1,563
500
192
207
134
1,885
340
62
1,800
89
1,146
-
34
2,121
-4
-1
22
16
11
13
0
14
2
15
19
36
15.4
7.0
4.7
4.8
56.8
15.3
3.0
47.9
-31.3
26.8
11.9
2.2
73.0
23.8
8.4
4.8
5.5
67.1
15.6
3.5
61.9
4.4
32.2
18.0
2.9
90.7
40.3
10.4
7.4
6.8
79.4
17.9
4.2
76.8
8.0
40.4
24.2
3.7
114.6
164
156
371
58
330
150
158
293
156
212
147
362
49
357
150
184
362
162
29
-6
-2
-15
8
0
16
23
4
6.0
-14.8
18.8
1.5
29.3
-31.6
6.2
0.3
7.6
18.4
13.7
36.2
6.4
33.2
17.1
10.3
17.9
24.6
22.5
22.0
49.2
8.6
38.0
21.4
14.5
23.3
34.5
1,543
773
1,149
469
489
1,655
1,150
751
101
357
1,600
800
1,300
530
450
-
1,300
750
-
415
4
3
13
13
-8
13
0
16
33.6
21.0
46.0
29.6
8.1
46.8
69.0
38.2
8.6
7.1
48.3
41.3
55.0
37.0
9.9
50.7
88.9
47.9
10.8
13.6
64.4
53.0
66.4
45.4
12.1
55.9
113.9
53.8
12.5
16.4
20 July 2017
30

Company
Reco
Muthoot Fin
Buy
PFC
Neutral
Repco Home
Buy
REC
Neutral
Shriram
City
Buy
Union
STF
Buy
Aggregate
Capital Goods
ABB
Sell
Bharat Elec.
Buy
BHEL
Sell
Blue Star
Neutral
CG Cons. Elec.
Buy
CG Power & Indu. Sell
Cummins
Buy
GE T&D
Neutral
Havells
Neutral
K E C Intl
Neutral
L&T
Buy
Pennar Eng.
Not Rated
Siemens
Neutral
Solar Ind
Neutral
Suzlon Energy
Not Rated
Thermax
Sell
Va Tech Wab.
Buy
Voltas
Sell
Aggregate
Cement
Ambuja Cem.
Buy
ACC
Neutral
Birla Corp.
Buy
Dalmia Bharat
Buy
Grasim Inds.
Neutral
India Cem
Neutral
J K Cements
Buy
JK Lakshmi Ce
Buy
Ramco Cem
Buy
Orient Cem
Buy
Prism Cem
Buy
Shree Cem
Buy
Ultratech
Buy
Aggregate
Consumer
Asian Paints
Neutral
Britannia
Buy
Colgate
Buy
Dabur
Neutral
Emami
Buy
Godrej Cons.
Neutral
GSK Cons.
Sell
HUL
Buy
ITC
Neutral
Jyothy Lab
Neutral
Marico
Neutral
CMP
(INR)
471
123
813
182
2,321
971
TP
% Upside
EPS (INR)
(INR) Downside FY17 FY18E FY19E
550
17
29.5 41.0
43.3
117
-5
25.7 27.2
30.2
936
15
29.1 35.8
42.5
134
-26
31.4 35.0
40.4
2,900
1,340
25
38
84.3
55.6
132.8
78.5
171.2
98.5
P/E (x)
P/B (x)
FY17 FY18E FY17 FY18E
15.9 11.5
2.9
2.5
4.8
4.5
0.8
0.7
27.9 22.7
4.5
3.8
5.8
5.2
1.1
0.9
27.5
17.5
19.2
73.7
25.1
67.6
51.4
43.7
20.7
36.5
55.8
48.9
26.3
27.9
17.8
76.0
42.2
29.2
29.7
23.1
31.9
35.1
54.0
48.0
31.8
70.4
15.5
37.2
29.0
67.4
25.6
NM
354.5
47.5
43.8
38.6
55.0
51.7
50.5
42.3
40.4
50.8
35.0
58.7
34.7
32.5
52.6
17.5
12.4
16.1
58.0
24.2
40.8
37.2
37.3
37.2
33.1
51.5
40.0
24.3
25.1
13.9
55.7
38.4
21.0
28.1
19.2
31.7
30.7
36.4
34.8
22.8
40.9
14.7
22.4
24.2
41.2
22.4
34.5
33.3
40.1
43.9
32.3
50.0
44.5
41.8
39.7
37.9
44.0
32.9
50.3
31.4
40.8
47.6
3.0
1.9
3.3
9.4
5.2
1.1
8.4
23.8
1.3
7.2
7.9
8.9
5.0
3.3
1.8
7.1
7.7
-1.7
4.1
3.7
4.9
3.9
2.7
3.8
2.2
4.9
1.7
1.3
3.9
3.9
4.5
3.3
6.2
9.0
4.8
3.7
14.6
16.9
22.9
11.1
13.8
12.3
7.4
37.4
7.8
6.1
18.3
2.7
1.7
2.9
8.1
4.0
1.1
7.9
17.2
1.2
6.6
7.2
7.9
4.3
3.1
1.6
6.1
6.7
-1.8
3.7
3.2
4.4
3.6
2.6
3.6
2.0
4.4
1.5
1.2
3.4
3.6
3.9
3.1
5.3
7.5
4.5
3.4
14.0
15.6
21.6
9.6
11.6
9.6
7.2
36.1
7.8
6.2
15.7
FY17
19.4
17.9
17.4
19.9
11.7
11.7
17.2
12.7
20.6
1.6
18.0
76.4
6.2
21.2
12.4
18.2
21.2
12.2
10.2
9.3
19.8
NM
14.3
16.3
18.0
11.2
5.1
7.9
7.5
7.2
11.5
3.4
14.4
6.0
19.2
-3.2
1.8
20.2
11.6
9.7
28.5
36.9
50.4
28.4
35.8
24.6
22.2
65.6
23.5
21.1
36.7
ROE (%)
FY18E
23.2
17.0
18.1
19.1
16.2
14.7
18.0
13.9
16.5
2.7
21.7
53.4
3.4
20.7
14.7
19.8
19.2
12.6
11.6
11.0
18.6
-8.8
13.7
17.7
14.7
11.7
7.3
10.6
9.2
11.3
10.9
5.5
15.0
9.2
18.6
9.2
17.2
20.4
10.5
10.6
28.6
36.5
53.2
26.0
33.4
24.5
22.1
73.1
24.8
15.1
35.5
FY19E
21.4
16.8
18.2
19.1
18.1
16.3
18.1
15.8
16.8
3.4
30.1
49.8
4.2
23.5
16.4
21.1
20.9
13.4
12.6
13.7
19.9
-11.0
12.9
17.5
14.9
12.8
7.8
13.1
12.2
13.1
13.9
7.2
17.2
13.8
19.1
12.6
22.0
21.3
14.4
13.0
30.6
38.3
60.3
26.3
34.1
23.0
22.4
82.8
26.3
18.4
38.1
1,453
174
145
662
204
85
966
320
467
311
1,181
126
1,353
870
19
917
670
494
1,200
200
100
610
240
65
1,110
320
480
250
1,340
-
1,355
825
-
850
800
400
-17
15
-31
-8
17
-24
15
0
3
-20
13
0
-5
-7
19
-19
19.7
6.9
2.1
12.9
4.7
4.1
26.5
5.7
9.6
11.9
42.3
7.1
17.8
20.6
0.6
30.8
28.9
15.5
25.1
7.2
3.6
17.8
5.5
2.3
29.2
6.2
11.7
12.8
47.1
9.1
24.3
22.6
0.9
32.7
34.9
15.6
32.2
8.1
4.7
26.6
6.6
4.5
36.0
7.6
14.2
16.4
54.0
11.2
33.3
28.2
1.0
34.0
39.8
17.6
264
291
1,733 1,622
934
1,205
2,729 3,162
1,050 1,384
209
219
977
1,287
469
553
697
823
159
178
123
145
18,251 21,052
4,207 4,936
10
-6
29
16
32
5
32
18
18
12
18
15
17
4.9
7.3
36.1 49.8
29.4 40.9
38.8 66.7
67.9 71.2
5.6
9.3
33.7 40.4
7.0
11.4
27.3 31.1
-1.6
4.6
0.3
3.7
384.4 454.7
96.1 95.8
8.2
65.0
58.9
87.1
102.6
12.9
53.5
19.2
37.5
7.0
5.6
575.2
143.1
1,156
3,808
1,071
307
1,070
960
5,466
1,153
292
365
331
1,240
4,450
1,335
315
1,265
930
4,500
1,285
280
405
360
7
17
25
3
18
-3
-18
11
-4
11
9
21.0 23.1
73.7 85.5
21.2 25.7
7.2
7.7
26.5 28.3
18.9 21.8
156.1 166.3
19.6 22.9
8.4
9.3
11.2
8.9
6.3
6.9
27.4
105.4
31.1
9.1
33.9
25.0
181.9
27.3
10.3
11.0
8.4
20 July 2017
31

Company
Nestle
Page Inds
Parag Milk
Pidilite Ind.
P&G Hygiene
Prabhat Dairy
United Brew
United Spirits
Aggregate
Healthcare
Alembic Phar
Alkem Lab
Ajanta Pharma
Aurobindo
Biocon
Cadila
Cipla
Divis Lab
Dr Reddy’s
Fortis Health
Glenmark
Granules
GSK Pharma
IPCA Labs
Jubilant Life
Lupin
Sanofi India
Sun Pharma
Syngene Intl
Torrent Pharma
Aggregate
Logistics
Allcargo Logistics
Blue Dart
Concor
Gateway
Distriparks
Gati
Transport Corp.
Aggregate
Media
Dish TV
D B Corp
Den Net.
Hind. Media
HT Media
Jagran Prak.
PVR
Siti Net.
Sun TV
Zee Ent.
Aggregate
Metals
Hindalco
Hind. Zinc
Reco
Sell
Buy
Neutral
Neutral
Buy
Not Rated
Neutral
Neutral
CMP
TP
% Upside
(INR)
(INR) Downside
6,935 5,990
-14
16,887 20,195
20
245
240
-2
799
835
4
8,126 9,082
12
137
-
834
850
2
2,734 2,415
-12
FY17
118.0
238.7
3.6
16.7
144.9
3.5
8.7
26.7
EPS (INR)
FY18E FY19E
118.6 139.5
317.0 400.0
7.4
12.3
18.4
21.2
155.8 181.6
3.5
6.4
9.7
14.7
37.4
51.8
P/E (x)
P/B (x)
FY17 FY18E FY17 FY18E
58.8 58.5 22.2 20.4
70.7 53.3 28.3 22.4
68.1 33.0
3.1
2.9
47.8 43.3 12.4 10.1
56.1 52.1 46.3 37.0
38.9 39.5
1.9
1.9
95.9 86.0
9.6
8.8
102.3 73.2 20.5 14.1
46.3 41.4 12.8 11.9
25.2
23.6
25.0
19.5
40.9
38.3
35.7
19.0
38.2
14.6
18.0
20.0
74.3
29.9
19.5
19.8
32.6
22.5
37.9
23.5
25.1
18.0
44.5
31.0
39.0
15.0
19.1
29.9
83.3
18.2
NM
10.8
11.8
15.8
67.6
NM
33.6
23.5
40.0
13.2
14.2
21.8
22.4
22.1
17.4
40.2
30.6
28.5
21.3
26.1
71.4
16.5
17.7
49.2
22.5
15.3
20.3
29.5
23.3
30.6
22.9
23.4
14.6
35.2
30.1
24.7
7.9
15.4
25.4
57.8
15.7
NM
9.2
10.9
13.9
48.0
NM
29.3
34.9
29.9
9.8
12.7
5.4
5.0
8.2
4.9
5.6
8.7
3.6
4.3
3.7
1.6
4.4
3.7
16.0
2.5
3.3
4.0
5.6
3.9
7.7
5.5
4.4
2.7
19.8
3.2
2.3
2.0
3.0
3.7
17.9
4.3
1.4
1.9
0.8
2.3
6.7
3.6
8.4
9.0
5.9
1.6
3.8
4.5
4.3
6.3
3.9
5.1
7.2
3.3
3.9
3.1
1.4
3.6
2.5
19.5
2.3
2.7
3.4
5.2
3.7
6.3
4.8
3.8
2.4
15.1
3.1
2.2
1.8
2.5
3.4
13.6
3.8
1.6
1.6
0.7
2.3
5.9
3.7
7.7
7.6
5.3
1.4
4.1
FY17
39.0
40.0
5.9
28.2
45.3
5.2
10.4
21.3
27.6
23.0
23.4
37.7
28.3
13.6
24.8
10.2
23.5
9.6
11.3
24.7
21.1
21.5
8.6
18.1
22.0
17.1
18.5
22.2
25.3
17.5
12.6
50.5
10.8
5.9
12.4
16.7
12.2
24.1
25.5
-12.0
19.0
7.1
17.6
10.4
-23.5
25.0
24.7
14.7
14.0
24.4
ROE (%)
FY18E
36.4
42.0
9.1
25.6
78.9
4.9
10.7
19.3
28.7
22.6
20.7
32.2
24.8
12.6
25.7
11.5
19.0
13.2
2.0
21.6
17.7
39.7
10.5
19.5
18.2
17.5
16.1
22.5
22.4
16.4
17.2
48.6
10.6
9.1
19.4
17.8
13.4
26.8
25.7
-5.3
18.3
7.0
16.4
13.2
-2.0
26.3
23.6
17.8
15.2
31.5
FY19E
39.0
42.8
13.4
24.0
74.0
8.5
14.6
19.7
29.6
23.1
21.0
29.9
22.5
15.6
27.2
12.8
19.2
14.9
5.3
20.9
18.8
54.4
12.7
19.6
19.4
19.1
17.9
20.7
24.2
17.5
17.8
46.8
11.8
11.1
25.4
18.6
15.0
327.5
26.5
0.7
17.9
7.3
17.2
17.7
6.9
30.2
23.7
22.7
15.4
35.2
Neutral
Neutral
Buy
Buy
Sell
Buy
Neutral
Neutral
Neutral
Buy
Neutral
Buy
Neutral
Neutral
Buy
Buy
Buy
Buy
Not Rated
Buy
543
1,783
1,462
767
417
544
568
755
2,770
151
708
145
2,555
480
722
1,172
4,209
588
493
1,299
640
1,900
2,028
750
300
510
500
600
2,600
240
800
200
2,700
480
905
1,475
4,850
650
-
1,450
18
7
39
-2
-28
-6
-12
-21
-6
59
13
38
6
0
25
26
15
10
12
21.6 24.9
75.7 79.7
58.4 66.1
39.3 44.1
10.2 10.4
14.2 17.8
15.9 20.0
39.7 35.4
72.6 106.2
10.3
2.1
39.3 42.9
7.2
8.2
34.4 51.9
16.1 21.3
37.0 47.1
59.2 57.9
129.1 142.7
26.1 25.2
13.0 16.1
55.2 56.8
30.5
95.0
79.6
50.2
14.4
23.2
25.0
39.8
143.0
6.1
51.7
11.5
60.1
28.5
56.7
72.0
173.2
30.8
18.0
71.4
Buy
Not Rated
Neutral
Buy
Not Rated
Not Rated
177
4,568
1,179
265
125
323
228
-
1,236
313
-
-
29
5
18
9.8
12.2
102.5 129.9
38.0 39.2
6.8
8.4
16.9
10.7
15.9
21.0
14.3
163.2
45.8
13.6
23.9
25.9
Buy
Buy
Neutral
Buy
Neutral
Buy
Buy
Neutral
Neutral
Buy
82
371
78
278
88
171
1,389
26
836
543
105
450
90
360
90
225
1,588
32
860
585
28
21
15
29
3
32
14
22
3
8
1.0
20.4
-8.6
25.9
7.4
10.8
20.5
-1.8
24.9
23.1
1.4
23.6
-2.7
30.1
8.0
12.3
28.9
-0.1
28.5
15.6
4.0
27.5
0.3
35.3
9.2
14.0
45.1
0.5
35.9
18.6
Buy
Sell
213
280
308
246
44
-12
16.2
19.7
21.8
22.1
26.1
26.8
20 July 2017
32

Company
JSPL
JSW Steel
Nalco
NMDC
SAIL
Vedanta
Tata Steel
Aggregate
Oil & Gas
BPCL
GAIL
Gujarat Gas
Gujarat St. Pet.
HPCL
IOC
IGL
MRPL
Oil India
ONGC
PLNG
Reliance Ind.
Aggregate
Retail
Jubilant Food
Titan Co.
Aggregate
Technology
Cyient
HCL Tech.
Hexaware
Infosys
KPIT Tech
L&T Infotech
Mindtree
Mphasis
NIIT Tech
Persistent Sys
Tata Elxsi
TCS
Tech Mah
Wipro
Zensar Tech
Aggregate
Telecom
Bharti Airtel
Bharti Infratel
Idea Cellular
Tata Comm
Aggregate
Utiltites
Coal India
CESC
JSW Energy
NTPC
Power Grid
Reco
Buy
Buy
Neutral
Buy
Sell
Buy
Neutral
CMP
(INR)
143
220
71
120
64
273
571
TP
% Upside
EPS (INR)
(INR) Downside FY17 FY18E FY19E
190
33
-20.9 -17.2
2.4
281
28
14.8 19.0
22.6
70
-2
3.7
3.8
4.2
180
50
10.0 12.1
12.2
37
-42
-6.2 -10.6
-4.2
311
14
15.1 24.5
32.2
581
2
37.0 50.5
66.5
P/E (x)
P/B (x)
FY17 FY18E FY17 FY18E
NM
NM
0.4
0.5
14.8 11.6
2.3
2.0
19.3 19.0
1.3
1.3
12.1
9.9
1.7
1.6
NM
NM
0.7
0.8
18.1 11.2
1.7
1.6
15.4 11.3
1.7
1.6
19.1 14.6
1.6
1.5
9.7
16.8
37.3
19.8
9.4
8.7
26.6
8.8
14.7
9.9
18.1
14.4
11.9
129.0
58.9
64.1
17.1
14.9
18.0
15.6
11.2
14.2
20.4
14.7
12.9
17.6
29.7
18.4
12.8
16.0
14.5
16.5
37.9
27.9
NM
26.0
38.9
17.1
17.4
16.6
12.9
15.3
12.8
14.4
22.6
15.8
13.0
10.4
24.2
12.9
10.2
9.4
24.0
12.6
12.2
87.1
51.8
55.0
14.8
14.6
16.1
15.4
10.2
13.3
16.6
13.5
13.4
15.1
24.6
18.3
12.8
15.7
12.8
16.4
71.7
24.2
NM
66.1
126.8
14.5
11.5
20.3
12.5
12.4
3.0
1.7
6.4
2.2
2.9
1.7
5.4
2.3
0.8
0.9
3.8
1.6
1.6
10.6
11.2
11.0
2.8
3.7
4.4
3.2
1.7
4.9
3.3
2.0
2.0
2.7
9.3
5.5
2.1
2.6
2.2
3.8
2.5
5.0
1.4
12.1
2.7
6.5
1.8
1.0
1.4
2.3
2.6
1.6
5.2
2.0
2.5
1.6
4.6
2.0
0.7
0.9
3.4
1.4
1.5
9.7
10.2
10.1
2.5
3.7
3.8
2.9
1.4
3.9
3.0
2.3
1.8
2.6
7.5
5.9
1.9
2.3
2.0
3.7
2.4
4.3
1.6
10.2
2.7
6.4
1.6
1.0
1.3
2.0
FY17
-7.9
17.3
7.2
12.4
-6.7
9.7
15.4
8.2
32.4
9.6
17.8
11.6
32.4
21.2
21.0
31.4
5.7
10.1
23.2
11.9
13.3
8.2
20.6
17.2
16.2
27.5
26.5
22.0
14.3
40.4
16.8
13.2
16.1
17.0
37.1
32.6
18.4
16.9
16.3
22.9
6.7
16.2
-1.6
126.2
6.9
37.8
10.5
6.3
11.5
16.2
ROE (%)
FY18E
-5.4
18.7
7.0
15.0
-12.6
14.6
14.6
10.3
21.7
11.3
25.3
13.1
20.6
15.8
20.6
16.5
7.5
9.9
15.1
11.8
12.0
11.1
20.6
18.4
16.6
25.2
25.3
20.0
15.2
32.5
19.0
14.2
14.3
18.1
33.7
31.1
16.0
15.4
16.3
22.4
3.4
19.1
-15.3
16.7
2.1
44.5
14.4
4.9
10.9
17.5
FY19E
0.8
19.0
7.5
15.5
-5.5
17.9
17.0
13.2
22.3
11.8
28.0
14.0
20.0
15.8
19.6
16.9
7.8
10.8
26.4
11.5
12.4
14.0
21.6
19.2
17.3
25.8
23.5
19.8
15.3
28.4
20.3
16.1
15.2
20.8
32.3
33.5
16.9
15.5
17.1
22.2
6.1
18.7
-20.8
37.8
4.2
47.0
13.9
4.8
12.3
17.8
Neutral
Sell
Sell
Neutral
Buy
Neutral
Neutral
Neutral
Buy
Buy
Buy
Neutral
470
379
762
175
384
375
1,133
131
283
163
206
1,534
511
340
697
168
420
459
1,070
113
305
195
259
1,262
9
-10
-8
-4
9
22
-6
-14
8
20
26
-18
48.3 36.7
22.6 26.3
20.4 33.7
8.8
11.0
40.7 29.5
43.0 36.0
42.5 46.8
14.8 10.2
19.3 27.9
16.4 17.4
11.4
8.6
106.6 122.1
43.5
29.8
46.5
13.1
32.6
40.0
51.9
11.8
30.1
19.7
17.6
131.0
Sell
Neutral
1,290
532
850
545
-34
2
10.0
9.0
14.8
10.3
20.7
12.1
Buy
Buy
Neutral
Buy
Neutral
Buy
Neutral
Neutral
Neutral
Buy
Buy
Neutral
Buy
Neutral
Buy
524
895
247
980
134
787
507
574
550
662
1,672
2,450
397
271
795
600
960
235
1,200
150
850
475
600
470
740
1,607
2,350
465
250
1,020
15
7
-5
22
12
8
-6
5
-15
12
-4
-4
17
-8
28
30.6 35.4
59.8 61.4
13.7 15.4
62.9 63.7
11.9 13.0
55.5 59.1
24.9 30.5
38.9 42.3
42.8 41.0
37.7 43.9
56.3 68.0
133.4 133.6
30.9 31.0
16.9 17.3
54.9 62.0
41.9
66.7
16.7
69.5
15.2
65.1
36.2
46.2
47.3
52.3
80.4
147.7
36.2
18.9
74.2
Buy
Buy
Buy
Buy
421
415
95
675
430
440
110
811
2
6
16
20
11.1
14.9
-1.1
26.0
5.9
17.2
-9.7
10.2
10.9
19.3
-11.2
30.8
Buy
Buy
Buy
Buy
Buy
255
903
64
167
219
315
1,140
85
198
242
24
26
33
18
11
14.9
51.9
3.9
13.0
14.2
17.6
78.6
3.2
13.4
17.6
18.6
86.0
3.1
16.2
20.6
20 July 2017
33

Company
Tata Power
Aggregate
Others
Arvind
Avenue
Supermarts
Bata India
Castrol India
Century Ply.
Coromandel Intl
Delta Corp
Dynamatic Tech
Eveready Inds.
Interglobe
Indo Count
Info Edge
Inox Leisure
Jain Irrigation
Just Dial
Kaveri Seed
Kitex Garm.
Manpasand
MCX
Monsanto
Navneet
Education
PI Inds.
Piramal Enterp.
SRF
S H Kelkar
Symphony
TTK Prestige
V-Guard
Wonderla
Reco
Sell
CMP
(INR)
83
TP
% Upside
EPS (INR)
(INR) Downside FY17 FY18E FY19E
68
-18
5.2
6.4
6.7
P/E (x)
P/B (x)
FY17 FY18E FY17 FY18E
16.1 13.0
1.9
1.7
14.8 13.0
2.3
2.1
30.7
118.8
42.5
29.9
33.3
25.8
54.2
36.2
25.4
27.3
12.4
65.7
79.9
19.7
20.3
34.1
14.6
58.5
44.6
31.9
22.8
23.4
40.7
17.8
36.3
55.7
48.5
50.9
51.0
30.3
71.0
36.5
28.3
29.5
19.6
29.2
21.7
22.7
21.7
12.3
50.9
33.2
14.4
19.2
20.8
12.2
36.7
39.5
26.2
18.8
23.4
28.4
17.7
30.6
37.6
46.4
40.6
29.8
2.8
14.8
5.6
33.9
9.0
4.3
4.2
5.0
8.2
22.5
3.8
6.3
4.6
1.7
2.7
4.4
3.9
3.7
4.2
9.0
5.7
6.6
3.8
2.8
4.7
20.7
8.7
12.1
4.7
2.6
12.9
5.0
30.3
7.4
3.8
2.8
4.1
6.6
20.2
2.8
5.8
4.1
1.6
2.4
4.8
3.2
3.4
3.9
8.1
4.8
5.4
3.5
2.5
4.2
18.2
8.0
9.9
4.2
ROE (%)
FY17 FY18E FY19E
11.2 13.9
12.1
15.2 16.1
16.8
10.3
17.9
8.8
19.4
11.8
23.3
15.8
106.1
29.6
21.6
11.5
24.3
31.6
136.2
23.5
12.3
16.2
14.8
13.7
26.0
27.6
13.5
14.5
34.5
28.2
23.8
16.4
16.7
15.6
54.5
20.7
28.8
17.5
Neutral
Neutral
Under Review
Buy
Neutral
Under Review
Buy
Buy
Buy
Neutral
Buy
Buy
Sell
Under Review
Neutral
Buy
Buy
Buy
Buy
Buy
Buy
Buy
Buy
Buy
Buy
Sell
Neutral
Neutral
Buy
380
911
574
408
290
428
166
2,450
327
1,259
162
1,030
267
109
354
650
271
743
1,106
2,750
177
781
2,955
1,530
263
1,319
6,400
182
356
359
804
-
527
323
-
215
3,334
368
1,283
200
1,050
240
-
465
755
394
927
1,300
3,295
226
952
3,044
1,816
287
1,288
5,281
167
393
-5
-12
29
11
30
36
12
2
24
2
-10
31
16
45
25
18
20
28
22
3
19
9
-2
-17
-8
10
12.4
7.7
13.5
13.6
8.7
16.6
3.1
67.6
12.9
46.0
13.0
15.7
3.3
5.5
17.5
19.1
18.6
12.7
24.8
86.2
7.8
12.5
12.8
15.7
14.4
9.8
21.8
5.7
112.9
14.4
57.9
13.2
20.3
8.0
7.6
18.5
31.3
22.1
20.3
28.0
105.1
9.4
18.1
17.9
19.4
15.0
12.9
26.1
7.2
166.7
17.5
91.6
15.4
22.9
12.0
10.0
21.1
37.7
26.2
30.9
42.2
126.7
11.3
38.1
144.6
109.2
10.3
42.9
176.1
6.0
16.0
13.9 14.4
115.2 113.3
31.1 27.7
17.5 20.6
8.1
12.1
15.1 20.7
37.7 32.3
86.2 98.0
34.8 26.4
10.2 11.9
5.9
12.5
8.6
11.7
14.8 13.4
13.6 21.6
29.8 28.6
7.3
8.5
10.2 10.2
31.6 32.5
26.8
32.8
9.8
16.6
13.7
43.3
19.5
27.4
9.5
27.8
25.4
13.0
14.7
14.5
51.6
18.0
26.9
14.8
33.4 33.4
72.6 104.1
85.9 86.3
7.2
8.6
23.7 35.1
132.1 137.8
3.6
4.5
7.0
11.9
20 July 2017
34

MOSL Universe stock performance
Company
Automobiles
Amara Raja
Ashok Ley.
Bajaj Auto
Bharat Forge
Bosch
CEAT
Eicher Mot.
Endurance Tech.
Escorts
Exide Ind
Hero Moto
M&M
Mahindra CIE
Maruti Suzuki
Tata Motors
TVS Motor
Banks - Private
Axis Bank
DCB Bank
Equitas Hold.
Federal Bank
HDFC Bank
ICICI Bank
IDFC Bank
IndusInd
J&K Bank
Kotak Mah. Bk
RBL Bank
South Indian
Yes Bank
Banks - PSU
BOB
BOI
Canara
IDBI Bk
Indian Bk
OBC
PNB
SBI
Union Bk
NBFCs
Bajaj Fin.
Bharat Fin.
Cholaman.Inv.&Fn
Dewan Hsg.
GRUH Fin.
HDFC
Indiabulls Hsg
LIC Hsg Fin
Manappuram
M&M Fin.
Muthoot Fin
PFC
Repco Home
REC
STF
Shriram City Union
1 Day (%)
-1.0
1.2
0.0
0.5
-0.1
-0.5
2.1
1.0
-0.5
-1.4
-0.5
0.2
3.0
0.1
1.0
0.4
0.6
-1.5
1.7
1.8
0.6
-0.2
0.1
0.2
5.0
1.8
3.2
0.5
0.7
0.5
2.3
0.6
0.3
3.5
0.2
2.2
0.9
0.3
2.0
-1.7
2.7
2.0
-0.7
0.1
0.7
1.0
-0.3
2.3
0.5
0.4
1.9
-0.8
0.7
0.1
1M (%)
-0.2
13.5
-0.3
-2.8
-2.5
-0.1
2.5
-5.3
-7.8
-3.6
-1.6
-0.2
3.5
4.2
1.8
4.1
0.0
-7.4
9.5
-3.3
0.1
3.6
8.4
4.3
-7.3
0.5
5.6
-3.9
9.0
-2.2
12.5
4.3
1.8
7.2
0.0
7.4
1.6
2.9
10.3
9.3
5.5
2.2
11.3
0.1
1.8
-3.0
6.9
2.1
2.4
-7.4
-8.5
-3.8
-2.5
-4.5
12M (%)
-4.1
14.3
2.7
54.4
-0.2
111.1
48.2
173.3
24.3
16.6
-4.9
36.9
68.5
-7.5
90.9
-7.8
93.6
-2.1
91.6
39.0
23.4
22.2
42.4
28.3
27.9
47.1
35.5
3.7
39.6
47.4
-20.8
114.0
29.3
20.5
27.6
13.6
78.4
-1.8
18.5
116.4
65.0
23.7
61.5
47.8
34.9
10.9
71.1
19.9
2.6
84.4
-19.4
25.4
Company
Capital Goods
ABB
Bharat Elec.
BHEL
Blue Star
CG Cons. Elec.
CG Power & Inds Sol.
Cummins
GE T&D
Havells
K E C Intl
L&T
Pennar Eng.
Siemens
Solar Ind
Suzlon Energy
Thermax
Va Tech Wab.
Voltas
Cement
Ambuja Cem.
ACC
Birla Corp.
Dalmia Bharat
Grasim Inds.
India Cem
J K Cements
JK Lakshmi Ce
Ramco Cem
Orient Cem
Prism Cem
Shree Cem
Ultratech
Consumer
Asian Paints
Britannia
Colgate
Dabur
Emami
Godrej Cons.
GSK Cons.
HUL
ITC
Jyothy Lab
Marico
Nestle
Page Inds
Parag Milk
Pidilite Ind.
P&G Hygiene
Prabhat Dairy
United Brew
United Spirits
Healthcare
Alembic Phar
Alkem Lab
Ajanta Pharma
Aurobindo
Biocon
1 Day (%)
2.0
0.0
1.3
1.5
-1.8
0.1
3.5
-1.3
2.1
5.3
0.2
1.5
0.5
1.1
1.1
2.2
1.0
2.0
-0.5
-1.5
0.0
-0.3
-3.6
-0.1
0.1
0.8
0.1
0.3
1.4
-0.5
-2.5
0.9
1.7
-0.1
2.0
0.9
0.4
0.7
-0.5
2.4
-1.0
0.5
1.1
0.4
4.2
-1.9
1.4
-0.9
1.6
0.1
-1.9
2.7
-0.1
4.5
0.7
1M (%)
-3.6
3.0
5.1
-0.4
-7.1
0.3
3.9
-7.3
-3.1
23.6
1.0
-8.8
2.9
5.5
-0.3
-4.2
-8.1
4.3
11.2
5.6
2.5
7.1
12.8
-5.5
-2.2
-5.1
-0.1
6.3
7.1
3.2
2.7
0.2
6.0
-2.5
6.7
-4.1
2.0
2.1
5.2
-6.1
-3.0
6.7
2.8
0.8
12.6
-2.7
3.1
11.1
6.0
18.9
3.7
-3.9
-5.3
17.0
26.2
12M (%)
12.5
40.2
4.1
55.8
44.5
19.7
14.6
-11.5
30.1
122.7
12.6
-31.1
3.7
29.9
3.4
1.3
14.4
52.0
0.6
8.1
77.0
120.1
32.0
87.3
39.5
14.1
24.8
-7.1
18.1
12.7
20.0
12.6
37.9
13.8
-1.2
-2.6
21.8
-13.8
28.8
17.3
26.5
19.0
4.5
27.1
-23.1
10.3
26.6
42.6
5.6
12.8
-6.1
21.5
-9.1
1.0
78.8
20 July 2017
35

MOSL Universe stock performance
Company
Cadila
Cipla
Divis Lab
Dr Reddy’s
Fortis Health
Glenmark
Granules
GSK Pharma
IPCA Labs
Jubilant Life
Lupin
Sanofi India
Sun Pharma
Syngene Intl
Torrent Pharma
Logistics
Allcargo Logistics
Blue Dart
Concor
Gateway Distriparks
Gati
Transport Corp.
Media
Dish TV
D B Corp
Den Net.
Hind. Media
HT Media
Jagran Prak.
PVR
Siti Net.
Sun TV
Zee Ent.
Metals
Hindalco
Hind. Zinc
JSPL
JSW Steel
Nalco
NMDC
SAIL
Vedanta
Tata Steel
Oil & Gas
BPCL
GAIL
Gujarat Gas
Gujarat St. Pet.
HPCL
IOC
IGL
MRPL
Oil India
ONGC
PLNG
Reliance Ind.
Retail
Jubilant Food
Titan Co.
1 Day (%)
3.7
1.6
2.8
2.0
-0.4
2.3
3.9
1.3
-0.2
2.5
1.4
0.2
1.8
1.6
0.3
0.5
-0.9
-0.6
0.3
-0.1
-0.7
5.1
-0.8
0.8
0.8
-1.7
-0.6
0.5
0.8
1.1
2.5
2.9
1.0
1.9
1.6
3.6
0.5
1.5
1.9
1.5
0.2
0.4
1.4
2.1
4.1
0.9
0.4
6.3
2.3
0.8
-0.6
0.9
-2.7
0.8
1M (%)
2.5
5.4
17.0
4.3
-20.7
11.1
3.9
4.8
2.0
6.2
3.7
1.6
12.0
8.5
8.0
1.8
7.3
3.9
0.3
0.0
4.6
4.6
-0.8
-5.5
0.5
6.9
-7.4
-11.4
-10.4
-2.7
6.8
6.3
14.0
12.6
10.2
10.7
6.1
10.4
12.9
10.0
5.6
-0.3
-5.3
6.0
8.6
-7.7
5.7
2.4
-3.2
-1.8
-5.7
8.8
39.1
3.6
12M (%)
52.9
12.3
-34.7
-22.6
-12.9
-15.1
1.1
-25.2
1.6
140.4
-30.7
-6.2
-24.8
18.1
-6.8
-3.9
-23.7
2.7
-8.3
-28.7
54.2
-14.2
-1.9
-12.3
1.5
10.3
-5.1
24.6
-30.9
117.9
16.5
54.8
46.4
107.1
35.2
45.9
27.0
31.2
70.6
54.2
23.2
31.3
38.4
35.4
56.0
52.1
86.7
74.2
2.4
10.6
44.8
51.0
13.4
28.9
Company
Technology
Cyient
HCL Tech.
Hexaware
Infosys
KPIT Tech
L&T Infotech
Mindtree
Mphasis
NIIT Tech
Persistent Sys
Tata Elxsi
TCS
Tech Mah
Wipro
Zensar Tech
Telecom
Bharti Airtel
Bharti Infratel
Idea Cellular
Tata Comm
Utiltites
Coal India
CESC
JSW Energy
NTPC
Power Grid
Tata Power
Others
Arvind
Avenue Super.
Bata India
Castrol India
Century Ply.
Coromandel Intl
Delta Corp
Dynamatic Tech
Eveready Inds.
Interglobe
Indo Count
Info Edge
Inox Leisure
Jain Irrigation
Just Dial
Kaveri Seed
Kitex Garm.
Manpasand
MCX
Monsanto
Navneet Educat.
PI Inds.
Piramal Enterp.
SRF
S H Kelkar
Symphony
TTK Prestige
V-Guard
Wonderla
1 Day (%)
1.5
1.5
1.2
-0.6
3.2
0.3
-0.3
0.4
0.5
0.7
-0.5
1.9
1.4
1.0
0.2
3.2
-0.7
9.0
1.8
2.7
1.7
2.6
0.2
1.5
0.7
0.3
0.2
0.7
0.5
-0.6
1.4
0.3
2.1
-0.8
-1.3
0.0
1.9
1.0
6.3
-0.1
1.2
-0.2
-0.7
0.6
1.2
-0.4
0.1
1.0
0.3
0.6
0.2
0.3
1.2
-0.5
1M (%)
2.9
6.2
-0.7
5.4
8.3
-3.7
-1.8
-3.0
-3.7
-2.6
3.4
0.8
2.0
6.6
-8.9
14.8
10.2
19.0
-8.2
0.5
0.4
1.9
4.2
2.9
6.3
0.0
15.0
6.2
-1.0
-3.9
-0.8
0.6
-4.7
-5.6
5.1
-9.8
2.6
-7.0
1.7
-12.9
1.7
-7.9
-6.6
-1.3
-4.0
-4.6
-3.7
1.4
-6.4
-8.5
2.9
-4.1
-2.2
-5.6
12M (%)
8.6
22.5
13.6
-9.8
-0.6
-9.9
6.2
16.6
3.9
0.4
-0.5
-21.7
-1.3
-21.0
15.7
16.2
-10.7
46.2
-20.0
48.2
-21.2
7.2
31.3
17.8
20.5
1.0
0.0
31.1
79.4
84.0
-3.0
21.2
33.0
-7.4
25.3
7.5
56.1
-36.1
55.7
-22.5
6.1
10.5
11.3
86.5
6.2
87.7
14.3
15.4
9.2
34.6
84.5
-10.8
20 July 2017
36

THEMATIC/STRATEGY RESEARCH GALLERY

REPORT GALLERY
RECENT INITIATING COVERAGE REPORTS
Rs

DIFFERENTIATED PRODUCT GALLERY

Disclosures
This document has been prepared by Motilal Oswal Securities Limited (hereinafter referred to as Most) to provide information about the company (ies) and/sector(s), if any, covered in the report and may be distributed by it and/or its
affiliated company(ies). This report is for personal information of the selected recipient/s and does not construe to be any investment, legal or taxation advice to you. This research report does not constitute an offer, invitation or
inducement to invest in securities or other investments and Motilal Oswal Securities Limited (hereinafter referred as MOSt) is not soliciting any action based upon it. This report is not for public distribution and has been furnished to
you solely for your general information and should not be reproduced or redistributed to any other person in any form. This report does not constitute a personal recommendation or take into account the particular investment
objectives, financial situations, or needs of individual clients. Before acting on any advice or recommendation in this material, investors should consider whether it is suitable for their particular circumstances and, if necessary, seek
professional advice. The price and value of the investments referred to in this material and the income from them may go down as well as up, and investors may realize losses on any investments. Past performance is not a guide for
future performance, future returns are not guaranteed and a loss of original capital may occur.
MOSt and its affiliates are a full-service, integrated investment banking, investment management, brokerage and financing group. We and our affiliates have investment banking and other business relationships with a some
companies covered by our Research Department. Our research professionals may provide input into our investment banking and other business selection processes. Investors should assume that MOSt and/or its affiliates are
seeking or will seek investment banking or other business from the company or companies that are the subject of this material and that the research professionals who were involved in preparing this material may educate investors
on investments in such business . The research professionals responsible for the preparation of this document may interact with trading desk personnel, sales personnel and other parties for the purpose of gathering, applying and
interpreting information. Our research professionals are paid on twin parameters of performance & profitability of MOSt.
MOSt generally prohibits its analysts, persons reporting to analysts, and members of their households from maintaining a financial interest in the securities or derivatives of any companies that the analysts cover. Additionally, MOSt
generally prohibits its analysts and persons reporting to analysts from serving as an officer, director, or advisory board member of any companies that the analysts cover. Our salespeople, traders, and other professionals or affiliates
may provide oral or written market commentary or trading strategies to our clients that reflect opinions that are contrary to the opinions expressed herein, and our proprietary trading and investing businesses may make investment
decisions that are inconsistent with the recommendations expressed herein. In reviewing these materials, you should be aware that any or all of the foregoingamong other things, may give rise to real or potential conflicts of interest.
MOSt and its affiliated company(ies), their directors and employees and their relatives may; (a) from time to time, have a long or short position in, act as principal in, and buy or sell the securities or derivatives thereof of companies
mentioned herein. (b) be engaged in any other transaction involving such securities and earn brokerage or other compensation or act as a market maker in the financial instruments of the company(ies) discussed herein or act as an
advisor or lender/borrower to such company(ies) or may have any other potential conflict of interests with respect to any recommendation and other related information and opinions.; however the same shall have no bearing
whatsoever on the specific recommendations made by the analyst(s), as the recommendations made by the analyst(s) are completely independent of the views of the affiliates of MOSt even though there might exist an inherent
conflict of interest in some of the stocks mentioned in the research report Reports based on technical and derivative analysis center on studying charts company's price movement, outstanding positions and trading volume, as
opposed to focusing on a company's fundamentals and, as such, may not match with a report on a company's fundamental analysis. In addition MOST has different business segments / Divisions with independent research
separated by Chinese walls catering to different set of customers having various objectives, risk profiles, investment horizon, etc, and therefore may at times have different contrary views on stocks sectors and markets.
Unauthorized disclosure, use, dissemination or copying (either whole or partial) of this information, is prohibited. The person accessing this information specifically agrees to exempt MOSt or any of its affiliates or employees from,
any and all responsibility/liability arising from such misuse and agrees not to hold MOSt or any of its affiliates or employees responsible for any such misuse and further agrees to hold MOSt or any of its affiliates or employees free
and harmless from all losses, costs, damages, expenses that may be suffered by the person accessing this information due to any errors and delays. The information contained herein is based on publicly available data or other
sources believed to be reliable. Any statements contained in this report attributed to a third party represent MOSt’s interpretation of the data, information and/or opinions provided by that third party either publicly or through a
subscription service, and such use and interpretation have not been reviewed by the third party. This Report is not intended to be a complete statement or summary of the securities, markets or developments referred to in the
document. While we would endeavor to update the information herein on reasonable basis, MOSt and/or its affiliates are under no obligation to update the information. Also there may be regulatory, compliance, or other reasons that
may prevent MOSt and/or its affiliates from doing so. MOSt or any of its affiliates or employees shall not be in any way responsible and liable for any loss or damage that may arise to any person from any inadvertent error in the
information contained in this report. MOSt or any of its affiliates or employees do not provide, at any time, any express or implied warranty of any kind, regarding any matter pertaining to this report, including without limitation the
implied warranties of merchantability, fitness for a particular purpose, and non-infringement. The recipients of this report should rely on their own investigations.
This report is intended for distribution to institutional investors. Recipients who are not institutional investors should seek advice of their independent financial advisor prior to taking any investment decision based on this report or for
any necessary explanation of its contents.
Most and it’s associates may have managed or co-managed public offering of securities, may have received compensation for investment banking or merchant banking or brokerage services, may have received any compensation
for products or services other than investment banking or merchant banking or brokerage services from the subject company in the past 12 months.
Most and it’s associates have not received any compensation or other benefits from the subject company or third party in connection with the research report.
Subject Company may have been a client of Most or its associates during twelve months preceding the date of distribution of the research report
MOSt and/or its affiliates and/or employees may have interests/positions, financial or otherwise of over 1 % at the end of the month immediately preceding the date of publication of the research in the securities mentioned in this
report. To enhance transparency, MOSt has incorporated a Disclosure of Interest Statement in this document. This should, however, not be treated as endorsement of the views expressed in the report.
Motilal Oswal Securities Limited is registered as a Research Analyst under SEBI (Research Analyst) Regulations, 2014. SEBI Reg. No. INH000000412
Pending Regulatory inspections against Motilal Oswal Securities Limited:
SEBI pursuant to a complaint from client Shri C.R. Mohanraj alleging unauthorized trading, issued a letter dated 29th April 2014 to MOSL notifying appointment of an Adjudicating Officer as per SEBI regulations to hold inquiry and
adjudge violation of SEBI Regulations; MOSL replied to the Show Cause Notice whereby SEBI granted us an opportunity of Inspection of Documents. Since all the documents requested by us were not covered we have requested to
SEBI vide our letter dated June 23, 2015 to provide pending list of documents for inspection.
List of associate companies of Motilal Oswal Securities Limited -Click
here to access detailed report
Analyst Certification
The views expressed in this research report accurately reflect the personal views of the analyst(s) about the subject securities or issues, and no part of the compensation of the research analyst(s) was, is, or will be directly or
indirectly related to the specific recommendations and views expressed by research analyst(s) in this report. The research analysts, strategists, or research associates principally responsible for preparation of MOSt research receive
compensation based upon various factors, including quality of research, investor client feedback, stock picking, competitive factors and firm revenues
Disclosure of Interest Statement
Analyst ownership of the stock
Served as an officer, director or employee
Companies where there is interest
No
No
A graph of daily closing prices of securities is available at www.nseindia.com and http://economictimes.indiatimes.com/markets/stocks/stock-quotes
Regional Disclosures (outside India)
This report is not directed or intended for distribution to or use by any person or entity resident in a state, country or any jurisdiction, where such distribution, publication, availability or use would be contrary to law, regulation or which
would subject MOSt& its group companies to registration or licensing requirements within such jurisdictions.
For Hong Kong:
This report is distributed in Hong Kong by Motilal Oswal capital Markets (Hong Kong) Private Limited, a licensed corporation (CE AYY-301) licensed and regulated by the Hong Kong Securities and Futures
Commission (SFC) pursuant to the Securities and Futures Ordinance (Chapter 571 of the Laws of Hong Kong) “SFO”. As per SEBI (Research Analyst Regulations) 2014 Motilal Oswal Securities (SEBI Reg No. INH000000412) has
an agreement with Motilal Oswal capital Markets (Hong Kong) Private Limited for distribution of research report in Kong Kong. This report is intended for distribution only to “Professional Investors” as defined in Part I of Schedule 1 to
SFO. Any investment or investment activity to which this document relates is only available to professional investor and will be engaged only with professional investors.” Nothing here is an offer or solicitation of these securities,
products and services in any jurisdiction where their offer or sale is not qualified or exempt from registration. The Indian Analyst(s) who compile this report is/are not located in Hong Kong & are not conducting Research Analysis in
Hong Kong.
Motilal Oswal Securities Limited (MOSL) is not a registered broker - dealer under the U.S. Securities Exchange Act of 1934, as amended (the"1934 act") and under applicable state laws in the United States. In addition MOSL is not a
registered investment adviser under the U.S. Investment Advisers Act of 1940, as amended (the "Advisers Act" and together with the 1934 Act, the "Acts), and under applicable state laws in the United States. Accordingly, in the
absence of specific exemption under the Acts, any brokerage and investment services provided by MOSL, including the products and services described herein are not available to or intended for U.S. persons.
This report is intended for distribution only to "Major Institutional Investors" as defined by Rule 15a-6(b)(4) of the Exchange Act and interpretations thereof by SEC (henceforth referred to as "major institutional investors"). This
document must not be acted on or relied on by persons who are not major institutional investors. Any investment or investment activity to which this document relates is only available to major institutional investors and will be
engaged in only with major institutional investors. In reliance on the exemption from registration provided by Rule 15a-6 of the U.S. Securities Exchange Act of 1934, as amended (the "Exchange Act") and interpretations thereof by
the U.S. Securities and Exchange Commission ("SEC") in order to conduct business with Institutional Investors based in the U.S., MOSL has entered into a chaperoning agreement with a U.S. registered broker-dealer, Motilal Oswal
Securities International Private Limited. ("MOSIPL"). Any business interaction pursuant to this report will have to be executed within the provisions of this chaperoning agreement.
The Research Analysts contributing to the report may not be registered /qualified as research analyst with FINRA. Such research analyst may not be associated persons of the U.S. registered broker-dealer, MOSIPL, and therefore,
may not be subject to NASD rule 2711 and NYSE Rule 472 restrictions on communication with a subject company, public appearances and trading securities held by a research analyst account.
For Singapore
Motilal Oswal Capital Markets Singapore Pte Limited is acting as an exempt financial advisor under section 23(1)(f) of the Financial Advisers Act(FAA) read with regulation 17(1)(d) of the Financial Advisors Regulations and is a
subsidiary of Motilal Oswal Securities Limited in India. This research is distributed in Singapore by Motilal Oswal Capital Markets Singapore Pte Limited and it is only directed in Singapore to accredited investors, as defined in the
Financial Advisers Regulations and the Securities and Futures Act (Chapter 289), as amended from time to time.
In respect of any matter arising from or in connection with the research you could contact the following representatives of Motilal Oswal Capital Markets Singapore Pte Limited:
Varun Kumar
Varun.kumar@motilaloswal.com
Contact : (+65) 68189232
Office Address:21 (Suite 31),16 CollyerQuay,Singapore 04931
For U.S
13 December 2016
Motilal Oswal Tower, Level 9, Sayani Road, Prabhadevi, Mumbai 400 025
Phone: +91 22 3982 5500 E-mail: reports@motilaloswal.com
Motilal Oswal Securities Ltd
20