21 July 2017
Motilal Oswal values your support in the
Asiamoney Brokers Poll 2017 for India
Research, Sales and Trading team.
We
request your ballot.
Today’s top research idea
Kotak Mahindra Bank: Strong all-around performance; Merger
synergies yielding results
v
KMB's strong operating performance was marked by robust performance in
both standalone bank and its other businesses.
v
Strong presence across geographies/products and healthy capitalization (T1 of
~19%) place the bank in a sweet spot to capitalize on growth opportunities
and gain market share.
v
KMB’s premium multiples are likely to sustain, considering strong growth and
operating leverage available across businesses, and a clean loan portfolio.
v
Comfort on asset quality remains the highest, with no SDR/5:25, negligible
SMA2 (21bp) and OSRL (6bp). At our SOTP of INR1,153, KMB will trade at 4.2x
2019E consol. BV. Buy.
Market snapshot
Equities - India
Close
Chg .%
Sensex
31,904
-0.2
Nifty-50
9,873
-0.3
Nifty-M 100
18,291
-0.3
Equities-Global
Close
Chg .%
S&P 500
2,473
0.0
Nasdaq
6,390
0.1
FTSE 100
7,488
0.8
DAX
12,447
0.0
Hang Seng
10,847
-0.1
Nikkei 225
20,145
0.6
Commodities
Close
Chg .%
Brent (US$/Bbl)
49
-0.9
Gold ($/OZ)
1,237
-0.2
Cu (US$/MT)
5,925
-0.1
Almn (US$/MT)
1,892
-0.1
Currency
Close
Chg .%
USD/INR
64.4
0.2
USD/EUR
1.2
-0.2
USD/JPY
112.4
0.3
YIELD (%)
Close
1MChg
10 Yrs G-Sec
6.5
0.0
10 Yrs AAA Corp
7.5
0.0
Flows (USD b)
20-Jul
MTD
FIIs
0.0
0.2
DIIs
0.0
0.3
Volumes (INRb)
20-Jul
MTD*
Cash
297
282
F&O
9,907
5,485
Note: YTD is calendar year, *Avg
YTD.%
19.8
20.6
27.5
YTD.%
10.5
18.7
4.8
8.4
15.5
5.4
YTD.%
-12.1
6.7
7.3
11.0
YTD.%
-5.0
9.1
-4.1
YTDchg
-0.1
-0.1
YTD
8.7
3.6
YTD*
285
4,969
Research covered
Cos/Sector
Mahindra & Mahindra
Reliance Inds.
Kotak Mah. Bank
Wipro
Hind.Zinc
Bajaj Auto
ABB
Alembic Pharma
D B Corp
Zensar Tech.
NIIT Tech.
KPIT Tech
Results Expectation
Key Highlights
Getting future ready; UV segment needs push; tractor segment healthy
Standalone EBITDA/PAT largely in line; GRMs at USD11.9/bbl
Strong all-around performance; Merger synergies yielding results
Revenue beat offset by 2Q guidance
Operating performance in line
Operating performance below expectations; high RM cost hurt margins
Performance hurt by ECL provisioning; valuation premium warrants Sell
Weak results; GST implementation impacts domestic growth
In-line operational performance; ad performance healthier than expected
Miss led by top client weakness; Quarterly performance misses estimates
In-line performance; navigating client-specific challenges
Profitability resurrection pushed further ahead
Ashok Leyland | Dewan Housing | Indian Bank | MRPL | Persistent System
Piping hot news
Under Vikram Limaye, NSE applies to settle co-location case with Sebi
v
The National Stock Exchange of India Ltd (NSE) on Thursday sought a
settlement with the markets regulator over allegations that it had provided
unfair access to its high-frequency trading systems to some brokers.
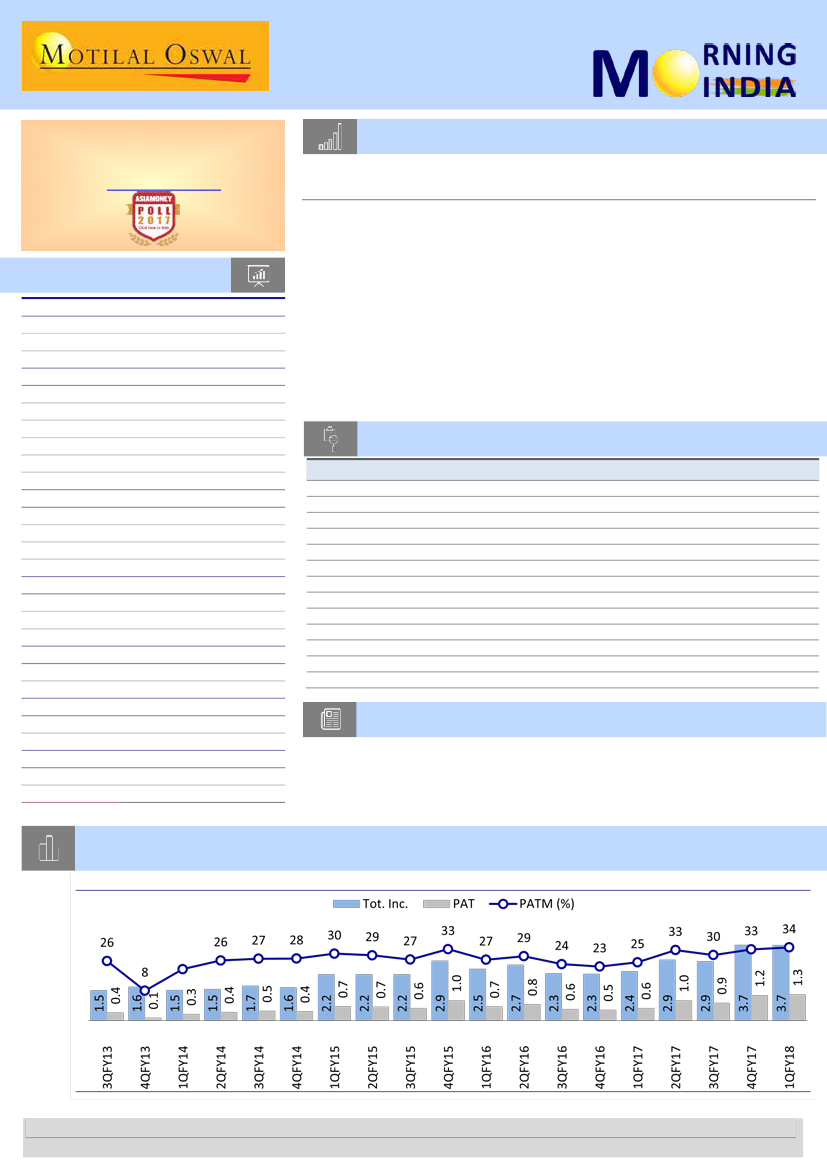
Chart of the Day: Kotak Mahindra Bank: Strong all-around performance; Merger synergies
yielding results
Steps taken to enhancing shareholder value
Research Team (Gautam.Duggad@MotilalOswal.com)
Motilal Oswal research is available on www.motilaloswal.com/Institutional-Equities, Bloomberg, Thomson Reuters, Factset and S&P Capital.
Investors are advised to refer through important disclosures made at the last page of the Research Report.

In the news today
Kindly click on textbox for the detailed news link
1
Reliance Industries to buy 25
pct stake in Ekta Kapoor led
Balaji Telefilms for Rs 413 cr
Reliance Industries will buy a
24.92% stake in the Ekta Kapoor-
promoted Balaji Telefilms, a listed
media and entertainment firm, for
around Rs 413 crore…
2
Unilever said softening commodity costs and the new Goods and Services
Tax regime in India will moderate the Anglo-Dutch consumer goods
major’s price growth by 30 basis points at the global level. “We expect
price growth to moderate,” Graeme Pitkethly, CFO at Unilever, said on
Thursday. “There are two reasons for this. First of all, a little less pressure
from commodity cost increases in the second half, and secondly, tax
benefits from the introduction of GST in India will be passed onto
consumers with an impact at the global Unilever level of around 28 to 30
basis points on price in the second half...
GST to moderate price growth, says Unilever CEO Graeme Pitkethly
3
Wipro buyback worth Rs
10,000 cr announced; if
successful, India Inc buybacks
to hit Rs 40,000 cr mark,
highest ever
4
Package for textiles sector
unveiled by Centre misses
target, enrolls just 41,000 in
EPF scheme
5
Private insurers reap a windfall
from crop cover scheme
Farmers’ distress is likely to cause
yet more trouble to the
government. Contrary to
Agricultural Minister Radha
Mohan Singh’s claim that
insurance companies, mostly in
the private domain, have not
unduly benefited from the
Pradhan Mantri Fasal Bima Yojana
(PMFBY), official data shows that
they would have made a windfall
of over ₹16,700 crore in 2016-17…
Software major Wipro on
Thursday announced a proposal to
buy back 34.37 crore shares for Rs
11,000 crore. In June 2016, the
Bengaluru-based company had
completed a buyback of shares
worth Rs 2,500 crore…
Despite the special package for
the textile and garment sector
unveiled by the Modi government
in June last year, fresh employee
registrations from the sector
under the employees provident
fund (EPF) scheme have been just
40,800 so far…
6
Tata group to sell biotech unit
Advinus Therapeutics to
Eurofins Scientific
The Tata group on Thursday said it
had agreed to sell its
pharmaceuticals and biotech
research unit Advinus
Therapeutics to Eurofins Scientific,
a Luxembourg-based group of
laboratories. Group holding
company Tata Sons Ltd…
7
Debt-ridden ABG Shipyard Ltd on
Thursday admitted before the
Ahmedabad bench of the National
Company Law Tribunal (NCLT) that
it had defaulted on loan
repayments and agreed for
bankruptcy proceedings to be
initiated against it...
ABG Shipyard agrees to
insolvency proceedings
21 July 2017
2

Mahindra & Mahindra
BSE SENSEX
31,955
S&P CNX
9,900
20 July 2017
Annual Report Update | Sector: Automobiles
CMP: INR1,383
TP: INR1,625 (+17%)
Getting future ready
UV segment needs push; tractor segment healthy
Buy
Mahindra & Mahindra’s (MM) FY17 annual report highlights the company’s focus on
technologically advanced new products in the farm segment, continuous improvement in
the UV segment to comply with the new emission/regulatory norms, and market share
increase in the CV segment.
Farm segment : Focus on technological prowess
Stock Info
Bloomberg
Equity Shares (m)
52-Week Range (INR)
1, 6, 12 Rel. Per (%)
M.Cap. (INR b)
M.Cap. (USD b)
Avg Val, INRm
Free float (%)
MM IN
592.6
1,509/1,142
-3/-3/-20
819.9
12.7
1555.0
74.8
Financials Snapshot (INR b)
2018E 2019E 2020E
Y/E Mar
Sales
490.5 561.0 631.4
EBITDA
55.0
64.1
73.3
NP*
40.4
47.2
53.0
EPS (INR)*
67.4
78.9
88.6
EPS Gr. (%)
7.8
17.0
12.3
Cons.EPS (INR)
66.7
79.9
87.3
BV/Sh. (INR)
476.3 529.4 592.2
RoE (%)
14.1
14.6
14.8
RoCE (%)
13.1
13.6
13.9
Sales
490.5 561.0 631.4
P/E (x)
20.5
17.5
15.6
Cons. P/E (x)
20.7
17.3
15.9
P/BV (x)
2.9
2.6
2.3
* incl. MVML
Shareholding pattern (%)
As On
Mar-17 Dec-16 Mar-16
Promoter
25.3
25.3
25.4
DII
20.1
19.1
18.1
FII
39.8
41.0
42.9
Others
14.8
14.6
13.5
FII Includes depository receipts
Right products drive growth and market share
n
Strong tractor segment growth of ~23% in FY17 was supported by the good
performance of YUVO, which has helped the company gain market share in the
30-50 HP segment (covers 70-80% of industry). YUVO, an all-new tractor
platform launched in April 2016, was highly successful in strengthening the
technology leadership of Mahindra tractors in FY17.
n
MM, in April 2017, also launched its third new tractor platform, JIVO, a new-
age small tractor platform in the sub-25 HP category (covers only 5% of
industry), which is an ideal choice for the growing segments of horticulture and
row crop farming.
Strategy: Farming 3.0 (a holistic view by MM)
n
Farming 3.0 is a comprehensive ecosystem, with offerings across the value
chain for the farmer. It provides access to smart machinery, precision farming
practices, digital platforms and ecosystem connect with an aim to help farmers
improve their crop yields and double their farm income.
n
With increasing labor cost and its scarcity, greater adoption of various forms of
mechanization is the way forward, in our view. Against this backdrop, MM
believes that the market for tractors and other farm equipment should grow
over the long term.
n
MM’s objective is to strengthen its global footprint and bring modern
technologies in farm mechanization into India. It also plans to leverage its
partnerships with MAM (Japan) and Sampo Rosenlew (Finland).
Outlook
n
According to MM, tractor industry growth in FY18 is expected to be driven by
positive rural sentiment, driven by normal monsoon and good agri income.
Auto segment: Challenges remain, but confident of sailing through
Losing market share in UVs; CV segment remains healthy
n
In the UV segment, MM lost market share from 37.9% to 29.2% in FY17, led by
intensifying competition and rural slowdown due to the impact of
demonetization. However, its bread and butter segment (Bolero, Scorpio, etc)
is gradually recovering, and should do well, led by likely good monsoon and
higher agri income.
21 July 2017
3

In February 2016, MM launched Blazo series of HCVs (trucks) with Fuelsmart
technology, leading to ~18% volume growth to 6,715 units in FY17.
Consequently, its market share in the HCV segment expanded to 4% from 3.4%
in the previous year.
n
In the LCV<2T segment, volumes grew ~8%, led by the success of Jeeto. MM’s
market share in this segment increased from 23.9% in FY16 to 25.7% in FY17.
n
To maintain its leadership position in goods LCVs in the 2-3.5t segment (market
share: 65.8%), the company launched Supro Minitruck and Supro Cargo Van in
February 2017.
Strategy
n
The company has strategized to strengthen the product portfolio and
refresh/update existing products. Also, MM is pursuing a strategy to introduce
petrol engines across the product range – the share of diesel variant in total PV
sales declined to 40% in FY17 from 58% in FY13.
Healthy outlook
n
For FY18, SIAM forecasts good growth for the industry: +7-9% for PVs, +5-7% for
LCV goods, +4-6% for CVs, double-digit for 3Ws, and 9-11% for 2Ws.
Focus on EVs to stay ahead of market
n
MM is focusing on development of the electric vehicle (EV) market and
upgradation of EV technology capabilities. MM’s EV portfolio comprises E20
electric car, e-Verito car and the Supro EV cargo and van. It sold 973 units in
FY17, up from 870 units in FY16. The plan is to increase capacity from 1,000
units in phase-1 to 5,000 units in phase-2 over the next 2-3 years.
Regulatory changes to increase investment/capex
n
The new safety regulations will be rolled out under the name of Bharat New
Vehicle Safety Assessment Program (BNVSAP), which will be applicable from
FY19 for new vehicles and from FY20 for existing vehicles. Similarly, emission
norms will be changed to BS-VI with effect from 1 April 2020 on a pan-India
basis. MM believes that conforming to the next stage of regulations will call for
the use of advanced technologies and will have an impact on costs. At the same
time, it is geared-up and confident of meeting these regulations.
n
Reduction of losses of key subsidiaries
n
n
Ssangyong reported PAT of INR2.3b in FY17 as against loss of INR1.6b in FY16.
Overall, the key subsidiaries reported reduction in losses this year (Refer
Exhibit
8).
MM is working toward containing 2W losses (FY17: INR4.7b) by adopting an
efficiency-focused approach and cost management. The company will focus on
improving sales of Mojo, and expects to bring a few Mojo variants in FY18.
Mahindra Two Wheelers’ (MTWL) past business strategy was focused on
addressing the mass 2W market. However, given the market response, MTWL
has decided to make a strategy shift by focusing on niche premium 2Ws.
Valuation and view
We estimate ~17% consolidated EPS CAGR over FY17-20 (v/s ~9% compounded
annual decline over FY14-17). Recovery in rural markets improves visibility of
volume revival in both its core businesses. MM is one of the cheapest large-cap auto
stocks, with valuation of 17.5x/15.6x FY19/20E consolidated EPS and 14.1/12.4x
core EPS (adjusted for value in subsidiaries after 20% holding discount). Maintain
Buy
with an SOTP-based target price of ~INR1,625.
21 July 2017
4

RESULTS
FLASH
BSE SENSEX
31,904
S&P CNX
9,873
20 July 2017
Results Flash | Sector: Oil & Gas
Reliance Industries
CMP: INR1,529
Under Review
We will revisit our estimates
post analyst meet/management
interaction.
Financials & Valuations (INR b)
Y/E March
Standalone EBITDA/PAT largely in line; GRMs at USD11.9/bbl
Reliance Industries’ (RIL) 1QFY18 standalone EBITDA rose 7% YoY (+3% QoQ) to
INR116b, largely in line with our estimate of INR118.5b. Reported PAT rose 9% YoY (flat
QoQ) to INR81.9b, in line with estimate of INR82.9b. Reported GRM stood at
USD11.9/bbl (est. of USD10) and refining throughput at 17.3mmt (est. of 17.5mmt).
n
Refining segment:
Refining EBIT stood at INR63.7b (-3% YoY, +2% QoQ) in
2017 2018E 2019E
2,420.3 3,257.4 3,739.4
432.6
314.3
96.7
14.6
11.6
9.1
13.3
15.8
1.6
13.8
2.5
507.0
354.1
108.9
12.7
11.7
9.9
14.4
14.0
1.4
10.2
1.6
538.3
386.1
118.8
9.1
11.5
10.2
14.4
Net Sales
EBITDA
Net Profit
EPS (INR)
EPS Gr. (%)
BV/Sh. (INR)
RoE (%)
RoCE (%)
Payout (%)
Valuations
P/E (x)
P/BV (x)
EV/EBITDA(x)
EV/Sales (x)
n
974.5 1,076.9 1,188.6
n
12.9
1.3
8.6
1.2
n
n
n
Standalone - Quarterly Earning Model
Y/E March
Net Sales
YoY Change (%)
Total Expenditure
EBITDA
Margins (%)
Depreciation
Interest
Other Income
PBT
Tax
Rate (%)
Adj PAT
YoY Change (%)
Margins (%)
Key Assumptions
Refining throughput (mmt)
GRM (USD/bbl)
1Q
534,960
-18.7
426,790
108,170
20.2
19,500
9,240
20,330
99,760
24,280
24.3
75,480
19.5
14.1
16.8
11.5
1QFY18. Reported GRM increased 3% YoY/QoQ to USD11.9/bbl v/s Reuters
SG GRM of USD6.4/bbl. Refining throughput stood at 17.3mmt (+3% YoY, -1%
QoQ) and exports at 10mmt.
Petrochemical segment:
Petrochemical EBIT stood at INR39.8b (+37% YoY,
+15% QoQ), with margin of 17% coming in above 14% in 4QFY17, primarily
due to an increase in polymer deltas. Petrochemical production – PP/PE/PVC
at 980tmt (-14% YoY, -8% QoQ), POY at 590tmt (+15% YoY, +2% QoQ) and
PX/PTA/MEG at 2.1mmt (+37% YoY, +11% QoQ). RIL successfully
commissioned the last crystallization train (Train 3) of the PX complex at
Jamnagar in June 2017.
E&P segment:
E&P EBIT stood at -INR2.3b v/s INR480m in 1QFY17 and -
INR780m in 4QFY17. KG-D6 gas production stood at 6.4mmscmd (-27% YoY, -
14% QoQ). Panna-Mukta gas production stood at 4.6mmscmd (-12% YoY, flat
QoQ). Shale gas production was down 11% QoQ due to shut-in at several
wells at Eagle Ford led by completion activity in adjacent pads.
Retail segment:
Retail EBIT stood at INR2.9b (+97% YoY, +20% QoQ), with the
margin at 2.5%. Reliance Retail added 18 stores during the quarter to reach a
a total of 3,634 stores across 703 cities. It commissioned 17 petro retail
outlets in 1QFY18 and now operates 465 outlets under Reliance Retail.
At the end of 1QFY18, consolidated outstanding debt stood at INR2,006b (v/s
INR1,966b at end-FY17) and cash & cash equivalents stood at INR721b (v/s
INR772b at end-FY17).
Valuation view:
On FY19E, the stock trades at 12.9x standalone EPS of INR119
and EV/EBITDA of 8.6x. We will revisit our estimates post the analyst meet.
3Q
618,060
9.3
512,020
106,040
17.2
20,770
9,310
30,250
106,210
25,990
24.5
80,220
11.1
13.0
17.8
10.8
4Q
671,460
34.4
558,660
112,800
16.8
24,090
2,350
13,710
100,070
18,560
18.5
81,510
11.4
12.1
17.5
11.5
1QE
574,944
7.5
456,421
118,523
20.6
27,456
9,355
24,600
106,313
23,389
22.0
82,924
9.9
14.4
17.5
10.0
1QAct
642,170
20.0
526,280
115,890
18.0
21,580
7,880
19,180
105,610
23,650
22.4
81,960
8.6
12.8
17.3
11.9
FY18
Var (%)
12%
15%
-2%
-21%
-16%
-22%
-1%
1%
-1%
FY17
2Q
595,770
-2.0
490,220
105,550
17.7
20,290
6,330
22,800
101,730
24,690
24.3
77,040
17.4
12.9
18.0
10.1
(INR Million)
QoQ (%)
-4%
-6%
3%
-10%
235%
40%
6%
27%
1%
YoY (%)
20%
23%
7%
11%
-15%
-6%
6%
-3%
9%
-1%
19%
3%
3%
-1%
3%
21 July 2017
5

Kotak Mahindra Bank
BSE SENSEX
31,904
Bloomberg
Equity Shares (m)
M.Cap.(INRb)/(USDb
52-Week
Range
1, 6, 12 Rel. Per (%)
Avg Val, INRm
Free float (%)
S&P CNX
9,873
KMB IN
1,839
1,366.3 / 20.0
1019 / 692
-3/18/11
2001
69.9
20 July 2017
1QFY18 Results Update | Sector: Financials
CMP: INR980
TP: INR1,153(+18%)
Buy
n
Standalone results:
PAT grew 30% YoY to INR9.1b (in-line). Core operating
profit grew strongly by 30% YoY, led by healthy NII growth (17% YoY; NIMs
strong at 4.5%), acceleration in fee income (+43% YoY) and pristine asset
quality (stable GNPAs at 2.6%). KMB holds more than requisite provisioning in
relation to its exposure of INR2.36b to the 12 accounts identified by the RBI for
bankruptcy proceedings under NCLT (four accounts inherited from ING Vysya
Bank). Loan growth came in at 18% YoY (+6% QoQ; +15% in 4QFY17), led by
Financials & Valuations (INR b)
robust growth in CV (+6% QoQ, 35% YoY), corporate banking (+21/8%
Y/E March
2018E 2019E 2020E
YoY/QoQ) and unsecured loans (+24/5% YoY/QoQ).
NII
93.9 112.1 135.3
n
Other highlights:
a) CASA ratio remained stable QoQ at 44%, despite
OP
72.7 90.6 113.2
moderation in CA deposits, led by robust SA mobilization (+44/6% YoY/QoQ).
Cons. NP
61.7 78.1
96.6
b) SMA2 increased 11bp QoQ to 0.21%; OSRL fell 21% to 6bp.
Cons. EPS (INR) 32.4 41.0
50.8
n
Other businesses:
a) Profitability at its capital market business improved to
EPS Gr. (%)
20.9 26.5
23.7
INR1.3b (+57% YoY), led by 108% YoY PAT growth of K-Sec to INR1.25b. b) K-
Cons. BV. (INR)
232
272
321
Sec market share declined 30bp QoQ to 1.9%. c) Overall AUM increased 8%
Cons. RoE (%)
15.0 16.3
17.1
QoQ (+37% YoY), led by strong inflows in equity AUM (+92% YoY).
RoA (%)
1.8
2.0
2.0
P/E(X) (Cons.)
30.2 23.9
19.3
n
Valuation and view:
With the completion of merger integration with eIVBL,
P/BV (X) (Cons.) 4.2
3.6
3.1
synergies are likely to flow in. Strong presence across geographies/products
and healthy capitalization (T1 of ~19%) place the bank in a sweet spot to
capitalize on growth opportunities and gain market share. KMB’s premium
multiples are likely to sustain, considering strong growth and operating
leverage available across businesses, and a clean loan portfolio. Comfort on
asset quality remains the highest, with no SDR/5:25, negligible SMA2 (21bp)
and OSRL (6bp). At our SOTP of INR1,153, KMB will trade at 4.2x 2019E consol.
BV.
Buy.
Strong all-around performance; Merger synergies yielding results
21 July 2017
6

20 July 2017
Q1FY18 Results Update | Sector: Technology
Wipro
Neutral
BSE SENSEX
31,904
Bloomberg
Equity Shares (m)
M.Cap.(INRb)/(USDb)
52-Week Range (INR)
1, 6, 12 Rel. Per (%)
Avg Val, INRm
Free float (%)
S&P CNX
9,873
CMP: INR269
TP: INR270(+0%)
WPRO IN
Announces INR110b buyback
4,866
1,309.1 / 20.3
n
Revenue exceeds estimate and guidance:
1QFY18 CC revenue growth stood at 0.3%
QoQ, ahead of our estimate of -1% QoQ and also marginally exceeded the company’s
284 / 205
guidance of -2% to 0% QoQ. However, growth was lopsided and came from
4/-5/-14
India/ME/APAC/Emerging markets, while the core markets of the US (flat) and Europe
865
26.8
(decline) were relatively muted. IT Services EBIT margin shrunk 90bp QoQ to 16.8%, in
Revenue beat offset by 2Q guidance
Financials & Valuations (INR b)
2017 2018E 2019E
Y/E Mar
550.4 562.0 611.5
Net Sales
108.8 110.9 122.8
EBITDA
83.3
81.7
86.0
PAT
16.9
18.1
19.1
EPS (INR)
-6.3
7.1
5.4
Gr. (%)
105.9 109.2 128.3
BV/Sh (INR)
16.9
16.1
16.1
RoE (%)
13.6
13.5
14.7
RoCE (%)
15.9
14.8
14.1
P/E (x)
2.5
2.5
2.1
P/BV (x)
n
n
Estimate change
TP change
Rating change
n
line with our estimate, but with slightly higher currency realization of INR66.1 v/s our
assumed rate of INR65.5. PAT rose 7.4% QoQ to INR20.8b, above our estimate of
INR18.6b, led by above-estimate revenues and other income.
2QFY18 guidance offsets 1Q beat:
For 2QFY18, WPRO expects revenue of USD1,962-
2,001m, implying QoQ CC growth between -0.5% and +1.5%. This is below our 2QFY18
growth estimate of 1.8% QoQ, offsetting the 1Q beat. The larger geographies of Europe
and the US are expected to chip in. However, it expects to catch up with the industry
by 4QFY18. WPRO expects to contain margins in a narrow band of 17.5-18%, which it
achieved in FY17.
Announces INR110b buyback:
WPRO announced buyback of 343.75m equity shares
(7.06% of paid up equity) at INR320 per share – totaling to INR110b. This amounts to
more than 50% of net cash if we include short-term loans and borrowings amounting
to INR123b. The promoters have also expressed their intention to participate in the
proposed buyback.
Valuation view:
Our operating estimates are largely unchanged, and the 4.8% earnings
upgrade for FY18 comes from the 1Q PAT beat led by higher other income. While
WPRO’s outlook for industry-matching growth is encouraging, the guidance tells a
different story – YoY CC revenue guidance at the midpoint for 2Q is 3.1%, implying fifth
consecutive quarter of deceleration. Similarly, WPRO’s comments on freeing up senior
resources by automating L2 tickets raise hope for the company and industry, but do
not reflect in any form of margin strength just yet. WPRO trades at 14.8x/14.1x
FY18E/FY19E EPS. We expect revenue and earnings CAGR of 5.7% over FY17-19E. Our
price target of INR270 discounts FY19E EPS by 14x, and implies no upside to CMP.
Maintain
Neutral.
FY18E
4Q
1Q
2Q
3Q
1,955
1,972
1,997
2,032
2.7
0.9
1.3
1.8
139,875 136,261 138,446 141,951
2.2
-2.6
1.6
2.5
2.6
0.2
0.6
3.7
28.0
28.7
27.9
28.4
11.9
12.8
12.2
12.2
17.7
16.8
16.5
17.0
16.1
16.0
15.7
16.2
5,328
5,079
4,392
3,330
24.2
22.3
22.3
22.3
19,340 20,765 20,272 20,424
-8.3
7.4
-2.4
0.8
-13.5
1.2
-1.9
-3.2
4.0
4.3
4.2
4.5
181,482 166,790 169,655 173,040
84.8
82.1
82.1
82.1
16.3
15.9
47.2
46.4
46.2
46.1
1941
1955
58.3
58.2
FY17
4Q
2,074
2.0
145,380
2.4
3.9
28.8
12.2
17.5
16.6
1,959
22.3
20,194
-1.1
4.4
4.5
176,675
82.1
46.1
7,705
4.9
550,402
7.4
28.9
12.8
17.9
16.1
20,254
23.2
83,326
-6.3
16.9
181,482
77.4
46.4
FY18E
8,075
4.8
562,038
2.1
28.5
12.3
17.0
16.1
14,760
22.3
81,655
-2.0
18.1
176,675
77.4
46.2
FY19E
8,662
7.3
611,462
8.8
28.7
12.1
17.5
16.6
11,337
23.5
86,037
5.4
19.1
190,425
77.2
46.0
Est.
Var.
1QFY18 (% / bp)
1,956
0.8
0.1
81bp
134,062
1.6
-4.2
157bp
-1.4
162bp
28.4
38bp
12.7
12bp
16.6
25bp
15.7
26bp
3,189
59.3
23.0
-65bp
18,566
11.8
-4.0 1137bp
-9.5 1072bp
3.8
180,197
-7.4
82.0
10bp
46.8
-40bp
Quarterly Performance (Consolidated)
Y/E March
IT Services Revenue (USD m)
QoQ (%)
Overall Revenue (INR m)
QoQ (%)
YoY (%)
GPM (%)
SGA (%)
IT Se rv. EBIT (%)
EBIT Ma rgi n (%)
Othe r i ncome
ETR (%)
PAT
QoQ (%)
YoY (%)
EPS (INR)
Headcount
Uti l e xcl . tra i ne e s (%)
Attri ti on (%)
Offs hore re v. (%)
Re v Gui da nce (USDm)
Fi xe d Pri ce (%)
FY17
1Q
2Q
3Q
1,931
1,916
1,903
2.6
-0.8
-0.7
135,992 137,657 136,878
-0.2
1.2
-0.6
11.1
10.0
6.4
29.1
28.9
29.4
13.0
13.2
13.0
17.8
17.8
18.3
16.1
15.8
16.4
4,848
4,958
5,120
22.9
22.2
23.3
20,518 20,672 21,094
-8.2
0.8
2.0
-6.2
-7.5
-5.6
4.2
4.3
4.4
173,863 174,238 179,129
79.7
82.8
81.9
16.5
16.6
16.3
45.6
46.1
46.5
1950
1950
1955
56
56.4
57.7
21 July 2017
7

20 July 2017
1QFY18 Results Update | Sector: Metals
Hindustan Zinc
Neutral
BSE SENSEX
31,904
Bloomberg
Equity Shares (m)
M.Cap.(INRb)/(USDb)
52-Week Range (INR)
1, 6, 12 Rel. Per (%)
Avg Val, INRm
Free float (%)
S&P CNX
9,873
HZ IN
4,225
1,187.5 / 18.4
305 / 172
12/-20/31
694
35.1
CMP: INR281
TP: INR301(+7%)
Operating performance in line
Zinc price outlook remains bullish; Maintain Neutral
Financials & Valuations (INR b)
Y/E March
2017 2018E 2019E
Net Sales
173.0 215.1 233.4
EBITDA
97.4 122.8 133.4
NP
83.2
91.0 100.2
EPS (INR)
19.7
21.5
23.7
EPS Gr. (%)
-0.6
9.5
10.0
BV/Sh. (INR)
72.6
85.7 101.0
RoE (%)
24.4
27.2
25.4
RoCE (%)
28.3
31.8
30.1
Payout (%)
180.4
39.2
35.7
EV/EBITDA (x)
10.7
8.1
7.1
Estimate change
TP change
Rating change
1QFY18 operating performance was in line
n
Hindustan Zinc’s (HZL) EBITDA increased 111% YoY to INR23.8b (in-line) in
1QFY18, driven by 85% growth in mine production to 233kt and a 35% increase
in LME for zinc. Mine production was lower last year due to famine phase.
n
Zinc volumes were 7% ahead of estimates at 194kt (+90% YoY).
n
Cost of production increased 2% YoY (+18% QoQ) to INR62,698/t due to rising
commodity prices and mine mix (higher stripping ratio in open cast mines) and
lower average grade.
n
PBT at INR24.2b was 12% ahead of estimate, led by lower DDA and higher
other income (net of finance cost).
Mine development running aggressively; eying higher volumes beyond FY20E
n
Mine development is progressing well at 8,828 meters (+82% YoY, +28% QoQ).
n
Vertical shaft at RA in on track to start production by 2HFY19. SK mine vertical
shaft and expansion of mill to 5.8mtpa too will be completed in 1HFY19E.
Zawar mine expansion to 2.7mtpa too will be completed.
n
Targeting aggressive production expansion beyond FY20E (mine 1.5mtpa).
Zinc price outlook remains bullish; Maintain Neutral
n
Zinc supply is getting tighter due to strong demand and a lag in supply
response. The pricing outlook has turned more bullish.
n
We had recently raised the LME assumption by USD400 to USD3,200/t, and the
rating to
Neutral
with a target price of INR301/share.
INR million
4Q
217
47
135
2,777
62,602
99.9
37,480
186.5
59.9
142
5,321
4,811
36,829
0
36,829
6,259
17.0
30,570
30,570
42.2
1Q
194
35
115
2,589
45760
98.1
23,840
110.8
47.6
1,370
3,600
5,300
24,170
0
24,170
5,410
22.4
18,760
18,760
80.8
FY18
2QE
3QE
189
203
37
39
112
120
2,800 3,200
50,002 61,025
41.8
22.5
27,960 36,432
34.6
30.9
55.9
59.7
0
0
5,004 5,054
3,206 3,407
26,162 34,785
0
0
26,162 34,785
5,494 7,305
21.0
21.0
20,668 27,480
20,668 27,480
8.7
18.5
4QE
209
41
124
3,200
63,490
1.4
37,924
1.2
59.7
0
5,105
3,069
35,889
0
35,889
7,537
21.0
28,352
28,352
-7.3
FY17
696
138
447
2,366
172,964
21.6
97,390
43.7
56.3
2,017
17,871
24,496
101,998
-5
102,003
18,837
18.5
83,166
83,161
-0.7
FY18E
795
152
470
2,947
224,646
29.9
126,157
29.5
56.2
1,370
18,764
14,982
121,005
0
121,005
25,745
21.3
95,260
95,260
14.5
1QE
181
35
107
2,589
44,195
74.6
23,652
109.2
53.5
90
4,955
3,012
21,619
0
21,619
4,540
21.0
17,079
17,079
64.6
vs Est.
%
7
-1
7
0
4
1
Quarterly Performance
Y/E March
Zinc refined (kt)
Lead refined (kt)
Silver (tonnes)
Zinc LME (USD/t)
Net Sales
Change (YoY %)
EBITDA
Change (YoY %)
As % of Net Sales
Finance cost
DD&A
Other Income
PBT (before EO item)
EO exp. (income)
PBT (after EO item)
Total Tax
% Tax
Reported PAT
Adjusted PAT
Change (YoY %)
1Q
120
23
88
1,918
25,306
-30.3
11,309
-42.5
44.7
712
3,644
6,101
13,053
5
13,048
2,680
20.5
10,369
10,374
-53.4
FY17
2Q
3Q
148
211
32
36
107
117
2,252 2,518
35,257 49,799
-12.6
45.2
20,767 27,834
2.6
88.3
58.9
55.9
712
451
4,317 4,589
7,702 5,882
23,440 28,676
0
0
23,440 28,676
4,421 5,477
18.9
19.1
19,019 23,199
19,019 23,199
-11.4
28.1
-27
76
12
12
19
10
10
25.1
21 July 2017
8

RESULTS
FLASH
BSE SENSEX
31,904
S&P CNX
9,873
20 July 2017
Results Flash | Sector: Automobiles
Bajaj Auto
BUY
CMP: INR2,819
n
TP: INR3,359
We will revisit our estimates
post earnings call/management
interaction.
Operating performance below expectations; high RM cost hurt margins
Net sales declined 5.3% YoY (grew 11.1% QoQ) to INR54.4b (our estimate:
INR52.3b), as volume fell 10.7% YoY (grew 12.8% QoQ). In the domestic
market, factors like reduced stocks within channel and postponement of
purchases by customers impacted wholesale numbers. Billing for June 2017
was ~108k units v/s retails of ~155k units. However, ~6% YoY increase (1.5%
QoQ decline) in realization to INR61,258/unit aided revenue.
n
Export revenue grew 20.5% YoY to INR24.8b, led by 12% YoY volume growth
and 7.5% YoY realization growth. Realization per dollar was lower at INR66.8
v/s INR67.1 in 4QFY17 and 1QFY17.
n
RM cost was higher by 280bp YoY (220bp QoQ) due to commodity cost
inflation. Consequently, EBITDA margin declined 322bp YoY (126bp QoQ) to
17.2% (our estimate: 19.1%). Automotive business EBIT margin shrank 375bp
YoY (235bp QoQ) to 15.9%, led by operating deleverage due to lower volumes.
n
Exceptional cost of INR320m is one-time compensation to dealers as a part of
transition to GST. It indicated loss of INR1,400 per vehicle due to same.
n
Other income grew 71% YoY to INR4.6b due to likely dividend from KTM.
n
KTM’s domestic volume increased 52.8% YoY, led by healthy response to
recently-launched KTM 250 (sold ~2,300 units) and KTM 390, which has wait
list in the domestic market. BJAUT indicated strong response to KTM in future.
Key questions for the management
n
Outlook on export demand, especially in key markets like Nigeria, Sri Lanka.
n
Commodity inflation impact in 1QFY18.
Valuation and view:
We will revisit our estimates post earnings call. The stock
trades at 19.6x/16.8x FY18E/19E EPS. Maintain
Buy
with a TP of INR3,359.
FY17
2Q
3Q
4Q
1,032
852
788
-2.3
-10.5
-9.7
58,676 59,495 62,171
2.0
2.0
1.2
60,545 50,669 48,973
-0.4
-8.7
-8.6
67.0
66.8
67.8
4.3
4.8
4.6
7.4
7.9
9.2
12,961 10,439 9,060
21.4
20.6
18.5
3,420 3,193 2,936
7
3
2
770
772
757
15,605 12,858 11,236
4,378 3,612 3,218
28.1
28.1
28.6
11,228 9,246 8,018
6.7
(4.7) (15.5)
FY18
2Q
3Q
1,047
999
1.4
17.2
61,809 62,736
5.3
5.4
64,683 62,642
6.8
23.6
67.7
67.2
4.4
4.2
8.3
8.0
12,698 12,937
19.6
20.7
3,400 3,650
3
3
800
835
15,296 15,750
4,436 4,567
29.0
29.0
10,860 11,182
(3.3)
20.9
Conference Call Details
Date:
21 July 2017
Time:
10:00am IST
Dial-in details:
+91-22-3960 0663
st
Financials & Valuations (INR b)
2018E 2019E
Y/E Mar
236.2 264.0
Net Sales
47.3
54.5
EBITDA
41.5
48.6
NP
143
168
EPS (INR)
8.5
17.0
EPS Gr. (%)
654
721
BV/Sh. (INR)
23.1
24.4
RoE (%)
22.4
23.6
RoCE (%)
P/E (x)
19.6
16.8
P/BV (x)
4.3
3.9
2020E
298.1
62.7
56.5
195
16.2
770
26.2
34.4
14.4
3.7
Quarterly Performance
Y/E March
Volumes ('000 units)
Growth YoY (%)
Realization (INR/unit)
Growth YoY (%)
Net Sales
Change (%)
RM/Sales %
Staff cost/Sales %
Oth. Exp./Sales %
EBITDA
EBITDA Margins (%)
Other Income
Interest
Depreciation
PBT
Tax
Effective Tax Rate (%)
Adj. PAT
Change (%)
E: MOSL Estimates
1Q
995
-1.8
57,784
4.5
57,480
2.7
67.2
4.7
7.7
11,763
20.5
2,671
2
775
13,657
3,873
28.4
9,784
2.2
INR Million)
FY17
4Q
977
24.1
55,754
-10.3
54,499
11.3
65.1
4.8
7.5
12,328
22.6
2,789
3
880
14,234
4,314
30.3
9,920
23.7
FY18E
3,666
3,911
(5.8)
6.7
59,419 60,407
2.4
1.7
217,827 236,249
(3.6)
8.5
67.1
67.7
4.6
4.6
8.0
8.0
44,384 46,803
20.4
19.8
12,220 14,412
14
10
3,073
3,268
53,516 57,937
15,081 16,960
28.2
29.3
38,436 41,522
(2.2)
8.0
Est.
Var.
1Q
(%)
888.4
0.0
(10.7)
58,907
4.0
1.9
52,335
4.0
-8.9
67.4
5.3
8.3
10,017
-6.3
19.1 -190bp
3,200
3
775
12,440
3.5
3,608
29.0
8,832
7.2
-9.7
1Q
888
-10.7
61,258
6.0
54,424
-5.3
70.0
5.0
7.8
9,384
17.2
4,573
2
753
12,881
3,642
28.3
9,469
(3.2)
21 July 2017
9

20 July 2017
2QCY17 Results Update | Sector: Capital Goods
ABB
Sell
BSE SENSEX
31,904
Bloomberg
Equity Shares (m)
M.Cap.(INRb)/(USDb)
52-Week Range (INR)
1, 6, 12 Rel. Per (%)
Avg. Val, INRm
Free float (%)
S&P CNX
9,873
ABB IN
211.9
313.4 / 4.9
1619 / 950
-5/11/-2
126
25.0
CMP: INR1,459
n
TP: INR1,180 (-20%)
Performance hurt by ECL provisioning; valuation premium warrants Sell
Operational performance below expectations:
2QCY17 revenue rose 6% YoY
to INR22.3b, missing our estimate of INR23.8b by 7%. EBIDTA margin of 6.6%
(+120bp YoY) too was below our estimate of 9.7%. EBITDA rose 30% YoY to
INR1.5b, but came in below our estimate of INR2.2b due to ECL provisioning
done under Ind-AS accounting system and expenses incurred on developing
new products. PAT of INR0.8b too missed our estimate of INR1.1b.
Gross margin improves 160bp YoY to 36% – near-all time high:
Gross margin
improved 160bp YoY to 35.9%, driven by initiatives undertaken over the past 3-
4 years toward increased localization, rationalization of supply chain, improving
efficiency, better project management capabilities and lower raw material
prices. EBITDA margin improved 120bp YoY to 6.6%.
2Q order inflow up 13% YoY; order backlog increases 56% YoY:
Order inflow
increased 13% YoY to INR23.0b in 2QCY17, driven by finalization of base
orders. Large-ticket orders did not materialize during the quarter, given the
cautious approach adopted by clients in the run-up to GST implementation.
Key sectors driving base orders were utilities, transmission and infrastructure,
while industrial companies continued to incur operational capex. Order backlog
stands at INR121b (+56% YoY), providing revenue visibility of 1.4x its CY16
revenue.
Valuation view:
Management is optimistic on the demand scenario, driven by
government capex. It continues to remain focused on margin expansion via its
efforts toward operational efficiency and localization. We cut our estimates for
CY17/18 by 11/2% to factor in margin compression on account of ECL
provisioning, and maintain our
Sell rating
given premium valuations. We
maintain our price target of INR1,180 (35x Mar’19 EPS of INR33).
(INR Million)
CY17
2Q
3Q
22,237 23,383
6.2
13.8
1,473
1,533
29.7
1.1
6.6
6.6
383
393
231
327
326
100
1,185
913
435
309
36.7
33.9
751
603
751
603
34.9
-30.7
CY16
4Q
30,173
21.1
5,230
85.5
17.3
420
399
-233
4,177
1,249
29.9
2,928
2,928
99.4
85,318
6.4
7,901
5.8
9.3
1510
919
658
6,131
1,957
31.9
3,687
4,175
25.0
CY17E
96,113
12.7
9,951
25.9
10.4
1573
1,169
378
7,587
2,421
31.9
5,166
5,166
23.7
MOSL
1Q
23,833
13.4
2,236
31.5
9.4
393
285
40
1,598
542
33.9
1,056
1,056
36.4
Var.
(%)
-6.7%
-34.1%
Financials & Valuations (INR b)
Y/E Dec
2016 2017E 2018E
Net Sales
86.6
97.5 113.1
EBITDA
7.9
10.0
12.6
Adj. PAT
3.7
5.2
6.9
Adj. EPS (INR)
19.7
24.4
32.5
EPS Gr (%)
25.0
23.7
33.2
BV/Sh (INR)
154.9 179.3 203.3
RoE (%)
12.7
13.6
16.0
RoCE (%)
18.3
20.9
24.0
P/E (x)
75.8
61.2
46.0
P/BV (x)
9.6
8.3
7.3
n
n
Estimate change
TP change
Rating change
n
Quarterly Performance
Y/E December
Sales
Change (%)
EBITDA
Change (%)
As % of Sales
Depreciation
Interest
Other Income
PBT
Tax
Effective Tax Rate (%)
Repoted PAT
Adj. PAT
Change (%)
1Q
20,035
10.4
1,808
25.9
9.0
359
223
149
1,376
442
32.1
854
934
72.0
CY16
2Q
3Q
20,947 20,550
8.4
4.4
1,136
1,516
-29.5
-2.7
5.4
7.4
357
406
197
178
299
299
881
1,231
324
427
36.8
34.7
556
811
556
871
-18.7
48.2
4Q
24,915
2.7
2,819
7.1
11.3
389
285
95
2,241
773
34.5
1,468
1,468
13.4
1Q
21,689
8.3
1,715
-5.2
7.9
376
212
186
1,312
428
32.6
884
884
-5.3
-25.8%
-28.9%
-28.9%
21 July 2017
10

Alembic Pharmaceuticals
BSE SENSEX
31,904
Bloomberg
Equity Shares (m)
M.Cap.(INRb)/(USDb)
52-Week Range (INR)
1, 6, 12 Rel. Per (%)
Avg. Val, INRm
Free float (%)
S&P CNX
9,873
ALPM IN
189
105.2 / 1.6
709 / 492
5/-24/-20
58
27.3
20 July 2017
1QFY18 Results Update | Sector: Healthcare
CMP: INR558
n
TP: INR510 (-9%)
Neutral
Weak results; GST implementation impacts domestic growth
1Q results below expectations:
Sales declined 11% YoY to INR6.5b (~15% below
estimate) in 1QFY18 due to muted growth in India business (-21% YoY). EBITDA
margin contracted ~580bp YoY to 15.6% due to lower domestic sales and high
R&D expense (14% of sales). PAT declined 35% YoY to INR667m due to weak
operating profit. We expect a recovery in 2QFY18, driven by channel refilling in
the domestic markets (post GST implementation) and ramp-up in US sales (on
the back of Pristiq launch).
n
GST impacts domestic business; US business up sequentially:
Domestic
business declined 21% YoY, primarily due to channel destocking in the run up
to GST implementation. Industry has lost almost one month of sales due to
inventory destocking at the channel partner level. Although a recovery is
expected in the coming quarters, it would be key to watch if channel partners
refill inventory to old levels. International business sales declined 9% YoY – US
business fell ~5% YoY (+>10%QoQ), while non-US business declined ~17% YoY.
US sales included one month of Pristiq sales. We expect the US business to
grow sequentially, led by the ramp-up of six products launched in 1Q.
n
Concall takeaways:
(a)
Capex for FY18 to be ~INR5b.
(b)
R&D expense to
remain high at ~INR5b annually, as ALPM plans to file ~100 ANDAs over the
next three years.
(c)
Oncology oral solids and injectables facilities to be ready
for batch testing in FY18; ANDA filings to start FY19 onward.
(d)
Couple of
Derma filings can happen in FY18 through CMO.
(e)
General injectable and
Derma filings in the US to start from FY19.
n
Investments in niche areas to fetch return in medium term:
Given that recent
investments in Oncology, Derma and Opthal will fetch returns only from FY20,
high R&D expense, coupled with pricing pressure in the US, will keep growth in
check over the near term. We maintain
Neutral
with a TP of INR510 @20x
FY19E EPS (v/s INR640 @20x FY19E EPS). We cut FY18E/FY19E EPS by ~20% as
we build in lower domestic growth and operating margins.
(INR Million)
Financials & Valuations (INR b)
Y/E MAR
2017 2018E
Net Sales
31.0
32.5
EBITDA
6.1
5.9
PAT
4.0
3.9
EPS (INR)
21.6
20.5
Gr. (%)
-43.2
-5.2
BV/Sh (INR)
100.8 115.3
RoE (%)
23.0
19.0
RoCE (%)
22.1
18.5
P/E (x)
25.9
27.3
P/BV (x)
5.5
4.8
EV/EBITDA(x)
17.1
17.4
2019E
37.2
7.3
4.8
25.5
24.7
134.8
20.4
20.1
21.9
4.1
14.2
Estimate change
TP change
Rating change
Quarterly Performance (Consolidated)
21 July 2017
11

RESULTS
FLASH
BSE SENSEX
31,904
S&P CNX
9,873
20 July 2017
Results Flash | Sector: Media
DB Corp
Buy
CMP: INR372
n
TP: INR450
We will revisit our estimates
post earnings call/management
interaction.
In-line operational performance; ad performance healthier than expected
PAT grew 6% YoY to INR1.1b (largely in-line; our estimate: INR1.12b). EBITDA
grew 3% YoY to INR1.86b (largely in-line, our estimate: INR1.85b). EBITDA
margin was in-line at 31.4%.
n
Print ad revenue was healthier than expected, given the impact of GST rollout
and high base effect. Print ad revenue grew 4.5% YoY to INR3.9b (1.5% above
our estimated INR3.85b).
n
Circulation revenue disappointed; grew 5% YoY to INR1.23b (our estimate:
INR1.27b); growth was primarily yield-driven on growth from mature markets.
n
Digital business revenue declined 1.5% YoY to INR123m; Radio ad revenue
grew 11% YoY to INR312m (in-line).
n
Raw material cost increased 7% YoY to INR1.71b (1% above estimate). Overall
operating expenses grew 4.8% YoY to INR4.08b, largely in-line, as lower
employee costs more than cushioned the escalation in RM and SG&A expenses.
n
For Emerging business, including mobile app downloading and E-real estate,
reported EBITDA loss reduced to INR62m (v/s INR76m in 4QFY17).
n
RM cost at 28.7% of revenue in 1QFY18 vs 31.1% in 4QFY17 and 28% in 1QFY17
(est: 28.4% of revenue).
n
Key questions for the management
n
Which sectors were laggards and which sectors are expected to drive ad revival
n
Update on the new IRS survey
Valuation and view:
We will revisit our estimates post earnings call. At CMP of
INR372, the stock trades at an attractive 15.7x FY18E and 13.6x FY19E EPS. We
have a
Buy
rating.
FY17
2Q
5,287
10.6
3,782
1,505
33.6
28.5
216
6
41
1,325
440
33.2
885
0
885
47.3
FY18
2Q
5,700
7.8
4,217
1,484
-1.5
26.0
225
11
80
1,328
451
34.0
876
0
876
-1.0
FY17
3Q
7,071
12.7
4,585
2,485
25.4
35.1
227
10
80
2,328
792
34.0
1,537
0
1,537
30.1
4Q
5,653
9.3
4,359
1,294
15.3
22.9
224
11
81
1,140
388
34.0
752
0
752
17.3
22,435
9.4
16,013
6,422
19.9
28.6
863
74
170
5,654
1,907
33.7
3,747
0
3,747
25.9
FY18E
24,366
8.6
17,160
7,205
12.2
29.6
896
43
321
6,588
2,240
34.0
4,348
0
4,348
16.0
Conference Call Details
Date:
21 July 2017
Time:
12:30pm IST
Dial-in details:
+91-22-3938 1071
th
Financials & Valuations (INR b)
2017 2018E 2019E
Y/E Mar
Net Sales
22.4
24.4
26.5
EBITDA
6.4
7.2
8.0
NP
3.7
4.3
5.0
EPS (INR)
20.4
23.6
27.5
EPS Gr. (%)
25.8
16.0
16.1
BV/Sh. (INR)
86.7
97.3 109.7
RoE (%)
25.5
25.7
26.5
RoCE (%)
23.0
24.0
24.9
P/E (x)
18.3
15.7
13.6
P/BV (x)
4.3
3.8
3.4
Quarterly Performance (INR m)
Y/E March
Sales
YoY (%)
Operating Expenses
EBITDA
YoY (%)
EBITDA margin (%)
Depreciation
Interest
Other Income
PBT
Tax
Effective Tax Rate (%)
PAT
Minority Interest
Adj PAT
YoY (%)
1Q
5,704
20.5
3,892
1,812
48.7
31.8
211
34
41
1,608
568
35.3
1,040
0
1,040
56.5
3Q
6,273
7.1
4,290
1,982
6.1
31.6
218
30
36
1,771
590
33.3
1,181
0
1,181
10.6
4Q
5,171
0.6
4,049
1,122
-1.7
21.7
218
5
51
950
309
32.5
641
0
641
-0.2
1Q
5,942
4.2
4,079
1,863
2.8
31.4
220
16
70
1,697
597
35.2
1,100
0
1,100
5.8
21 July 2017
12

RESULTS
FLASH
BSE SENSEX
31,904
S&P CNX
9,873
Zensar Tech
Buy
20 July 2017
Results Flash | Sector: Media
CMP: INR808
TP: INR1,020(+26%)
We will revisit our estimates
post earnings call/management
interaction.
Miss led by top client weakness
Quarterly performance misses estimates
n
ZENT’s 1QFY18 revenue grew 2.5% QoQ CC, below our estimate of +5.3% QoQ.
In USD terms, revenue grew 2.2% QoQ to USD114m, indicating a cross-
currency impact of -30bp.
n
We estimate contribution of 3.9% from the full integration of Foolproof and
Keystone. Excluding this, we estimate organic revenue to have declined by
~1.5% QoQ.
n
EBITDA margin expanded 230bp QoQ to 10.2%. However, this was 160bp
below our estimate of 11.8%. Our expectations were based on reversal of one-
time expenses incurred in the previous quarter and integration of higher-
margin acquisitions.
n
While IMS margins improved to 3.1% from -12.2% in the previous quarter,
Application margins were lower QoQ by 370bp to 13.9%.
n
PAT at INR472m (-36.3% YoY) was lower than our estimate of INR558m (-26.8%
YoY), led by the overall operational miss.
Top client weakness and strong Digital growth
n
Weakness was seen in top five clients (35% of revenue), which saw a decline of
7% QoQ. Barring this, growth was strong across all other buckets: Top 6-10
grew by 8.7% QoQ, Top 11-20 by 15.4% QoQ and Non Top 20 by 6.2% QoQ.
n
Growth in Digital was encouraging, as Foolproof and Keystone got added to the
portfolio. Digital revenue grew 8.8% QoQ and 33.3% YoY.
Valuation and view:
We will revisit our estimates the post earnings call. Outlook on
growth, especially in top accounts, and insights on execution of strategy would be
keenly watched. Based on current estimates, it trades at 15.5/11.1x FY18/19E EPS.
Maintain
Buy.
3Q
118
1.3
7,865
3.9
30.2
16.4
1,085
13.8
12.3
201
30.2
800
13.7
11.9
17.7
8,564
79.5
33.5
4Q
112
-4.9
7,433
-0.4
27.7
19.9
585
7.9
6.2
-228
45.5
104
-87.0
-85.2
2.3
8,524
79.2
34.5
1Q
114
2.2
7,367
-2.5
27.6
17.4
748
10.2
7.7
203
32.0
472
354.7
-36.3
10.5
8,567
83.2
37.5
FY18E
2Q
119
4.2
7,742
0.5
26.5
15.5
850
11.0
9.6
150
29.0
584
23.9
-17.0
13.0
8,807
82.0
36.6
FY17
3Q
121
1.8
7,944
1.0
26.3
15.0
900
11.3
9.9
148
29.0
619
5.9
-22.7
13.7
9,057
80.5
35.9
4Q
125
2.9
8,238
10.8
27.9
15.0
1,061
12.9
11.5
139
29.0
726
17.4
599.7
16.1
9,107
81.0
35.8
459
1.4
30,556
3.1
29.3
16.8
3,819
12.5
10.9
241
31.6
2,349
-24.1
52.1
8,524
79.7
33.2
FY18E
480
4.4
31,291
2.4
27.1
15.7
3,558
11.4
9.7
639
29.6
2,401
2.2
53.2
9,107
81.7
36.4
Est.
1QFY18 Var. (% / bp)
118
-3.4
5.9
-362bp
7,610
-3.2
-0.2
-230bp
28.8
-118bp
17.0
44bp
896
-16.5
11.8
-162bp
10.4
-267bp
28
635.8
29.0
558
-15.5
157.2
19747bp
-26.8
-948bp
12.4
8,724
-1.8
81.0
220bp
34.2
326bp
Conference Call Details
Date:
21 July 2017
Time:
16:00 IST
Dial-in details:
+91-22-3938 1075
st
Financials & Valuations (INR b)
Y/E Mar
2017 2018E 2019E
Net Sales
30.6
31.3
36.7
EBITDA
3.8
3.6
5.0
NP
2.3
2.4
3.3
EPS (INR)
52.1
53.2
72.5
EPS Gr. (%)
-24.1
2.2
36.2
BV/Sh. (INR)
354.0 393.9 449.8
RoE (%)
15.5
14.2
17.2
RoCE (%)
21.4
17.6
23.0
Payout (%)
23.0
21.3
19.7
Div. Yield
1.5
1.4
1.8
Quarterly Performance (Consolidated)
Y/E March
Revenue (USD m)
QoQ (%)
Revenue (INR m)
YoY (%)
GPM (%)
SGA (%)
EBITDA
EBITDA Margin (%)
EBIT Margin (%)
Other income
ETR (%)
PAT
QoQ (%)
YoY (%)
EPS (INR)
Headcount
Utilization (%)
Offshore rev. (%)
1Q
114
3.1
7,554
7.2
29.1
15.4
1,037
13.7
12.3
198
32.6
741
5.4
-2.8
16.4
8,238
79.8
31.2
FY17
2Q
116
1.8
7,703
1.8
30.1
15.6
1,111
14.4
12.8
70
29.6
704
-5.0
-22.9
15.6
8,316
80.1
33.8
21 July 2017
13

NIIT Technologies
BSE SENSEX
31,904
Bloomberg
Equity Shares (m)
M.Cap.(INRb)/(USDb)
52-Week Range (INR)
1, 6, 12 Rel. Per (%)
Avg Val, INRm
Free float (%)
S&P CNX
9,873
NITEC IN
61
33.4 / 0.5
601 / 370
-6/5/2
158
69.3
20 July 2017
Q1FY18 Results Update | Sector: Technology
CMP: INR546
n
TP: INR540(-1%)
Neutral
In-line performance; navigating client-specific challenges
Largely in-line performance:
NITEC’s 1QFY18 CC revenue growth of 1.4% QoQ
(excluding one-time revenue gains in 4Q) was largely in line with our estimate of
+1.3%. RuleTek acquisition contributed ~0.5% QoQ CC (one-month impact),
adjusted for which, the performance was marginally below our estimate. EBITDA
margin shrunk 200bp QoQ to 15.6%, in line with our estimate of 15.8%, but with
better quality (higher GPM offset by higher SGA). Net income for the quarter
increased 64% YoY to INR513m, below our estimate of INR587m, due to tax on
dividend income from foreign subsidiaries
BFSI/manufacturing drove growth, order intake steady:
BFSI grew 1.7% QoQ CC,
while Manufacturing & Others grew 4.3% QoQ CC. Transportation, however, was a
drag (-0.8% QoQ CC). Total order intake during the quarter was USD110m, in the
narrow band of recent quarters. Digital revenues constitute ~21% of the business.
Expects performance to continue picking up:
Despite ~USD2m impact from client
ramp-down in 2Q, NITEC expects its revenue growth to accelerate, with the push
coming from Digital segments and improvement in NITL. Even EBITDA margin
should start inching from 15.6% and exit the year at ~18%, led by business mix and
improvement in GIS for the remainder of the year.
Valuation and view:
Following the positive commentary and stabilizing segments,
our earnings estimates are up by ~3% for FY18/FY19. We expect revenue CAGR of
7.2% and earnings CAGR of 13% over FY17-19. The company’s investments in tuck-
in Digital capabilities can potentially drive better growth, going forward. We
continue to watch out for more definitive signs of the same. The stock trades at
11x FY19E earnings. Expansion of valuation multiple will be a function of improved
revenue growth. Our price target of INR540 discounts FY19E earnings by 11x.
Neutral.
FY17
2Q
103
4.2
6,929
2.2
35.3
18.8
1,145
16.5
11.9
29
24.9
54.0
590
107.0
-13.6
9.7
8,868
81.0
12.9
39.0
46.0
3Q
101
-2.4
6,938
2.2
36.0
19.2
1,162
16.7
12.1
59
25.3
48.0
624
5.8
-15.8
10.6
8,809
80.0
12.9
40.0
48.0
4Q
104
3.1
7,176
4.8
36.2
18.6
1,260
17.6
13.2
-12
13.4
72.0
739
18.4
-6.5
12.6
8,853
81.0
12.7
41.0
48.0
1Q
108
3.9
7,089
5.7
35.4
19.8
1,108
15.6
11.2
58
34.7
42.0
513
-30.6
80.0
8.7
8,963
81.2
12.1
40.0
49.0
FY18E
2Q
109
0.7
7,188
3.7
34.4
18.0
1,181
16.4
11.8
88
24.0
72.0
638
24.3
8.1
10.8
9,138
80.0
FY17
3Q
110
1.4
7,311
5.4
34.1
17.6
1,203
16.5
11.8
71
24.0
72.0
639
0.2
2.4
10.9
9,338
79.0
4Q
112
1.7
7,458
3.9
34.1
17.0
1,279
17.1
12.6
79
24.0
72.0
700
9.5
-5.3
11.9
9,438
79.5
408
0.5
27,750
3.5
35.7
19.1
4,582
16.5
11.9
159
18.6
220.0
2,238
-20.1
38.0
8,853
80.4
39.8
440
7.8
29,046
4.7
34.5
18.1
4,771
16.4
11.8
296
26.4
258.0
2,489
11.2
42.3
9,438
79.9
39.7
FY18E
Est.
1QFY18
105
0.8
6,862
2.5
34.8
19.0
1,084
15.8
11.5
80
24.0
72.0
587
-45.3
87.6
9.5
8,978
80.5
Var.
Financials & Valuations (INR b)
2017 2018E 2019E
Y/E Mar
27.8
29.0
31.3
Net Sales
4.6
4.8
5.2
EBITDA
2.6
2.5
2.9
PAT
38.0
42.3
48.7
EPS (INR)
-16.9
11.2
15.2
Gr. (%)
286.5 300.6 330.1
BV/Sh (INR)
13.7
14.4
15.4
RoE (%)
15.7
14.1
15.3
RoCE (%)
14.3
12.9
11.2
P/E (x)
1.9
1.8
1.7
P/BV (x)
n
n
n
Quarterly Performance (Consolidated)
Y/E March
(Consolidated)
Revenue (USD m) Ex. forex &
bought outs
QoQ (%)
Revenue (INR m)
YoY (%)
GPM (%)
SGA (%)
EBITDA (INRm)
EBITDA Margin (%)
EBIT Ma rgi n (%)
Other i ncome
ETR (%)
Mi nori ty Interes t
PAT
QoQ (%)
YoY (%)
EPS (INR)
Hea dcount
Uti l excl . tra i nees (%)
Attri ti on (%)
Offs hore rev. (%)
Fi xed Pri ce (%)
1Q
99
-2.2
6,707
4.6
35.1
19.9
1,015
15.1
10.3
83
10.4
46.0
285
-63.9
-51.4
5.1
9,022
79.8
13.4
39.0
46.0
3.3
314bp
3.3
316bp
63bp
81bp
2.2
-1.1
-31bp
-27.1
44.6
-12.6
1470bp
-758bp
-0.2
70bp
21 July 2017
14

KPIT Technologies
BSE SENSEX
31,904
Bloomberg
Equity Shares (m)
M.Cap.(INRb)/(USDb)
52-Week Range (INR)
1, 6, 12 Rel. Per (%)
Avg Val, INRm
Free float (%)
S&P CNX
9,873
20 July 2017
Q1FY18 Results Update | Sector: Technology
CMP: INR134
TP: INR140(+4%)
Neutral
KPIT IN
197
n
26.4 / 0.4
147 / 106
3/-24/-17
147.7
83.3
n
Profitability resurrection pushed further ahead
Revenue beat driven by license sale:
KPIT’s 1QFY18 revenue growth of 3.5%
QoQ CC beat our estimate of 1.3%. Growth was primarily driven by ~50%
growth in Products & Platforms, which included a one-time license sale of
USD2m. Excluding this, revenue growth was largely in-line. The strong start to
the year has resulted in an ask rate of -2% to 0% to achieve its guidance of 6-
8%; hence we raise estimates towards achieving the higher end of the band.
Margin improvement yet elusive:
EBITDA margin declined by 100bp to 9.1%, a
200bp miss to our estimate of 11.1%, led by INR appreciation, visa expenses
and higher subcontracting expenses. The company wasn’t able to make use of
the multiple levers it has, especially utilization, as lateral hiring of ~150
employees was undertaken while overall growth momentum has been
subdued. Adjusted PAT at INR530m declined by 1.4% QoQ. The quarter
included an exceptional gain of INR25.5m, resulting out of the sale of minority
stake in Sankalp Semiconductors.
Operational inefficiencies continue to weigh upon profitability:
While growth
momentum has been soft, KPIT undertook aggressive fresher hiring in FY17,
impacting margins by >300bp. While this provides potential tailwinds in the
form of utilization, which is currently at 68%, visibility of revival has been
lowered, as 2Q would be impacted by wage hikes to the tune of 225-250bp.
This is expected to lead to two consecutive years of PAT decline; -20% in FY17E
and -11% in FY18E.
Revenue revival key to re-rating:
Amid sluggish revenue growth momentum and
execution issues, profitability is likely to remain under pressure. We have cut
earnings estimates by 18.7/14% for FY18/19E primarily because of revised
margin expectations. We are now modeling an EBITDA margin of 9.4% in FY18,
compared to 11.7% earlier. Inconsistent revenue performance and the
consequent volatility in profit are key drags on KPIT’s valuation. We maintain our
Neutral
rating, with a price target of INR140—discounting forward EPS by 10x
.
Financials & Valuations (INR b)
2017 2018E 2019E
Y/E Mar
33.2
35.3
38.7
Net Sales
3.5
3.3
4.2
EBITDA
2.1
2.1
2.7
PAT
11.9
10.6
13.1
EPS (INR)
-15.3 -11.2
23.7
Gr. (%)
79.2
85.6
98.7
BV/Sh (INR)
14.3
13.0
14.2
RoE (%)
15.9
13.8
16.5
RoCE (%)
11.2
12.6
10.2
P/E (x)
1.7
1.6
1.4
P/BV (x)
n
Estimate change
TP change
Rating change
n
21 July 2017
15

June 2017 Results Preview | Sector: Automobiles
Ashok Leyland
Bloomberg
Equity Shares (m)
M. Cap. (INR b)/(USD b)
52-Week Range (INR)
1,6,12 Rel Perf. (%)
AL IN
2926.5
291 /4.5
102 / 74
7 / 1 / -13
CMP: INR99
TP: INR123 (+24 %)
Buy
Financial Snapshot (INR b)
Y/E March
2017
2018E 2019E 2020E
Sales
EBITDA
NP
Adj. EPS (INR)
EPS Gr. (%)
BV/Sh. (INR)
RoE (%)
RoCE (%)
Payout (%)
Valuations
P/E (x)
P/BV (x)
Div. Yield (%)
21.6
4.7
1.6
17.4
4.1
9.5
2.0
13.4
3.4
7.5
2.3
10.4
2.8
5.5
2.5
200.2
22.0
13.4
4.6
8.1
20.9
23.3
21.8
33.9
253.6
28.2
16.7
5.7
24.4
24.2
25.3
22.2
35.0
290.0
33.5
21.8
7.4
30.1
29.0
27.9
25.5
30.3
347.5
41.0
28.0
9.6
28.5
35.5
29.6
0.0
26.2
n
Volumes declined 8.6% YoY (and 40% QoQ), as M&HCV sales
declined 17% YoY while LCV sales grew 21%, led by pre-buying
impact and postponement of purchase due to GST.
n
We expect realization to increase by 9.8% YoY (and 8% QoQ), led
by lower discounts and BS-4 related price hikes.
n
Net revenue is likely to grow 0.4% YoY (but decline 35% QoQ), as
lower volumes would be offset by higher realizations.
n
EBITDA margin is likely to contract 133bp YoY (and 104bp QoQ),
driven by higher RM costs and other expenses.
n
EBITDA should decline 11.4% YoY (and 41.5% QoQ) to ~INR4.3b.
n
However, lower tax rate would restrict adjusted PAT decline to
~29% YoY (and 52% QoQ) to INR2.1b.
n
We have revised our EPS estimates for FY18/FY19 by 4%/5%, led
by higher other income. The stock trades at an EV/EBITDA of 9.5x
FY18E and 7.5x FY19E. Maintain
Buy.
Key issues to watch
EV/EBITDA (x) 13.0
Ø
Ø
Ø
Ø
Update on CV demand post BS-IV and GST, and discount trends.
RM cost guidance and price hikes to mitigate the same.
Contribution of exports, spare parts and defense to revenues.
Capex and investment guidance for FY18.
Ø
Update on Hinduja Foundries and its profitability.
Quarterly Performance
Y/E March (INR m)
Total Volumes (nos)
Growth %
Realizations (INR '000)
% change
Net operating revenues
Change (%)
RM/sales %
Staff/sales %
Other exp/sales %
Total Cost
EBITDA
EBITDA Margins(%)
Other Income
Interest
PBT before EO Item
EO Exp/(Inc)
PBT
Tax
Effective Tax Rate (%)
Adj. PAT
Change (%)
E: MOSL Estimates
1Q
31,165
10.7
1,367
-0.9
42,588
9.7
68.7
8.4
11.6
37,768
4,820
11.3
385
338
4,154
0
4,154
1,246
30.0
2,908
130
FY17
2Q
33,446
-10.5
1,382
4.0
46,224
-6.9
67.8
8.0
12.6
40,859
5,365
11.6
316
339
4,146
0
4,146
1,202
29.0
2,944
14
3Q
32,838
6.2
1,375
3.4
45,163
9.8
69.4
8.7
11.8
40,621
4,542
10.1
258
453
2,396
0
2,396
778
32.5
1,618
-26
4Q
47,617
8.5
1,390
2.1
66,179
10.8
71.9
6.2
10.8
58,880
7,299
11.0
404
423
6,114
3,508
2,605
-2,157
-
4,279
-16
1QE
28,484
-8.6
1,501
9.8
42,755
0.4
69.8
9.2
11.0
38,485
4,269
10.0
375
375
2,869
0
2,869
803
28.0
2,066
-29
FY18E
2QE
3QE
40,246
42,591
20.3
29.7
1,493
1,501
8.1
9.1
60,108
63,927
30.0
41.5
70.5
70.5
7.1
7.0
11.0
11.7
53,234
57,068
6,874
6,860
11.4
10.7
425
475
300
225
5,574
5,670
0
0
5,574
5,670
1,561
1,588
28.0
28.0
4,013
4,082
36
152
4QE
57,483
20.7
1,510
8.6
86,794
31.2
70.9
5.5
11.8
76,572
10,223
11.8
555
195
9,121
0
9,121
2,554
-
6,384
49
FY17
145,066
3.4
1,380
2.3
200,187
5.7
69.7
7.6
11.6
178,161
22,025
11.0
1,363
1,554
16,809
3,508
13,301
1,070
8.0
13,447
11.6
FY18E
168,804
16.4
1,502
8.9
253,584
26.7
70.5
6.9
11.4
225,358
28,226
11.1
1,830
1,095
23,234
0
23,234
6,505
28.0
16,728
24.4
21 July 2017
16

June 2017 Results Preview | Sector: Financials
Dewan Housing Finance
Bloomberg
Equity Shares (m)
M. Cap. (INR b)/(USD b)
52-Week Range (INR)
1,6,12 Rel Perf. (%)
DEWH IN
313.2
137 / 2
468 / 204
5 / 62 / 92
n
n
n
n
n
CMP: INR436
n
TP: INR530 (+22%)
Buy
Financial Snapshot (INR m)
Y/E March
NII
PPP
Adj. PAT
EPS (INR)
EPS Gr. (%)
BV (INR)
RoAA (%)
RoE (%)
Payout (%)
Valuations
P/E (x)
P/BV (x)
P/ABV (x)
Div. Yield (%)
2017 2018E 2019E 2020E
18.2 22.7 28.1 34.0
16.2 20.4 25.1 30.2
9.3 11.6 14.2 17.0
29.6 37.0 45.4 54.3
18.5 25.0 22.7 19.6
252
279
315
357
1.2
1.2
1.3
1.3
14.4 13.9 15.3 16.2
15.7 23.2 23.2 23.2
14.7
1.7
1.7
0.9
11.8
1.6
1.6
1.7
9.6
1.4
1.4
2.1
8.0
1.2
1.2
2.5
Business growth has picked up well post the impact of
demonetizaton. We expect 15% YoY growth in disbursements to
drive 3.4%/20% QoQ/YoY growth in AUM in the quarter.
Margins are likely to remain largely stable at 3%. As a result, we
expect 21% YoY growth in NII in the quarter.
Calculated cost-to-income ratio should decline 160bp QoQ to
26.5%, driven by lower advertising and legal costs.
Asset quality is likely to remain stable, with GNPAs of 0.95%. We
factor in provisions of INR500m for 1QFY18.
Net profit is likely to grow 24% YoY to INR2.5b.
The stock trades at 1.6x FY18E and 1.4x FY19E BV. Maintain
Buy.
Key issues to watch for
Ø
Business growth trends and momentum, and management
commentary on the same.
Ø
Management view on margins due to change in liability mix.
Ø
Asset quality trends in non-retail and LAP segments.
Ø
Guidance on cost structure, going forward.
Quarterly performance
Y/E March
Interest Income
Interest Expenses
Net Interest Income
YoY Growth (%)
Fees and other income
Net Income
YoY Growth (%)
Operating Expenses
YoY Growth (%)
Operating Profits
YoY Growth (%)
Provisions
Profit before Tax
Tax Provisions
Profit after tax
YoY Growth (%)
Loan growth (%)
Borrowings growth (%)
Cost to Income Ratio (%)
Tax Rate (%)
E: MOSL Estimates
1Q
19,319
14,754
4,565
14.5
275
4,840
15.5
1,361
8.4
3,479
18.6
450
3,029
1,015
2,014
16.2
18.3
20.4
28.1
33.5
FY17
2Q
3Q
21,227
23,151
16,307
18,001
4,920
5,150
21.0
20.8
451
514
5,371
5,664
18.3
21.6
1,398
1,497
6.1
9.1
3,972
4,167
23.2
26.9
450
450
3,522
3,717
1,196
1,269
2,326
2,448
29.0
31.7
16.0
16.9
38.5
28.0
26.0
26.4
34.0
34.2
4Q
22,835
17,475
5,360
22.6
943
6,303
29.1
1,717
10.8
4,586
37.7
830
3,756
1,273
2,483
30.9
16.7
33.1
27.2
33.9
1QE
23,520
17,999
5,521
20.9
300
5,821
20.3
1,542
13.3
4,279
23.0
500
3,779
1,281
2,498
24.0
20.0
29.0
26.5
33.9
FY18E
2QE
3QE
24,225
25,194
18,359
18,542
5,866
6,652
19.2
29.2
450
500
6,316
7,152
17.6
26.3
1,617
1,695
15.6
13.2
4,700
5,457
18.3
31.0
400
800
4,300
4,657
1,458
1,579
2,842
3,078
22.2
25.8
20.0
20.0
7.0
11.0
25.6
23.7
33.9
33.9
(INR Million)
FY17
FY18
4QE
26,585
19,403
7,182
34.0
695
7,877
25.0
1,943
13.2
5,934
29.4
1,134
4,800
1,627
3,173
27.8
23.9
7.6
24.7
33.9
86,531
66,536
19,995
19.8
2,182
22,177
21.4
5,973
8.7
16,204
26.9
2,180
14,024
4,754
9,270
27.1
18.5
45.7
26.9
33.9
99,524
74,302
25,221
26.1
1,945
27,166
22.5
6,797
13.8
20,369
25.7
2,834
17,535
5,944
11,591
25.0
0.0
23.9
25.0
33.9
21 July 2017
17

June 2017 Results Preview | Sector: Financials - Banks
Indian Bank
Bloomberg
Equity Shares (m)
M. Cap. (INR b)/(USD b)
52-Week Range (INR)
1,6,12 Rel Perf. (%)
Financial Snapshot (INR b)
Y/E March
2017 2018E
NII
51.5
55.2
OP
40.0
42.2
NP
14.1
16.0
EPS (INR)
29.3
33.2
EPS Gr. (%)
97.6
13.6
BV/Sh. (INR)
301
327
ABV/Sh (INR)
220
243
RoE (%)
10.1
10.6
RoA (%)
0.7
0.7
Div. Payout (%) 23.8
23.2
Valuations
P/E (x)
9.7
8.5
P/ BV (x)
0.9
0.9
P/ABV (x)
1.3
1.2
Div. Yield (%)
2.1
2.4
INBK IN
480.3
136 / 2
365 / 140
-11 / 8 / 72
2019E
63.9
46.0
18.3
38.0
14.3
356
271
11.1
0.7
23.2
7.4
0.8
1.0
2.7
2020E
73.1
49.9
20.1
41.9
10.3
388
304
11.3
0.7
23.2
6.7
0.7
0.9
3.0
n
CMP: INR283
n
TP: INR357 (+26%)
Buy
n
n
n
Loan growth is expected to be muted at ~5% YoY (+2% QoQ), led by
balance sheet recalibration. Deposit growth is expected be in line
with loan growth (+2% QoQ, +5% YoY).
Calculated NIMs are expected to shrink ~18bp QoQ (-5bp YoY).
4QFY17 had interest on IT refund of INR1.3b. NII will grow ~9% YoY,
but decline ~3% QoQ.
Overall non-interest income is expected to grow 22%, led by strong
fee income growth of 20% (on a low base) and higher recoveries.
Trading gains are expected to increase 11% on a YoY basis.
We expect slippage ratio to remain elevated at 2.8% and credit
costs to remain high at 1.5% (1.3% in 1QFY17), as INBK looks to
improve provision coverage.
INBK trades at 0.8x FY19E BV and 7.4x FY19E EPS. Maintain Buy.
Key issues to watch for
Ø
Outlook on business growth and asset quality remains the key
factor to monitor.
Ø
Quantum of loans rescheduled under the 5/25 scheme.
Ø
View on margins with an improvement in liquidity and lower
interest rates.
Quarterly Performance
Net Interest Income
% Change (Y-o-Y)
Other Income
Net Income
Operating Expenses
Operating Profit
% Change (Y-o-Y)
Other Provisions
Profit before Tax
Tax Provisions
Net Profit
% Change (Y-o-Y)
Operating Parameters
NIM (Cal, %)
Deposit Growth (%)
Loan Growth (%)
Tax Rate (%)
Asset Quality
Gross NPA (INR b)
Gross NPA (%)
E: MOSL Estimates
1Q
12,363
10.4
4,417
16,780
7,748
9,032
27.5
4,170
4,862
1,788
3,074
42.8
2.7
1.1
1.5
36.8
88.9
7.0
FY17
2Q
12,783
18.3
5,846
18,629
8,567
10,062
36.8
4,783
5,279
1,228
4,051
9.7
2.8
3.2
0.2
23.3
91.9
7.3
3Q
12,466
12.2
5,997
18,463
8,251
10,212
33.2
5,403
4,809
1,074
3,735
670.4
2.6
5.2
-0.7
22.3
96.8
7.7
4Q
13,849
22.1
5,854
19,703
9,001
10,701
29.3
8,069
2,632
-565
3,197
278.4
2.8
2.4
-1.0
-21.5
98.7
7.5
1QE
13,421
8.6
5,452
18,873
8,595
10,277
13.8
4,700
5,577
1,785
3,792
23.4
2.7
4.9
4.9
32.0
100.4
7.5
FY18E
2QE
3QE
13,837
13,919
8.3
11.7
6,192
6,607
20,030
20,526
9,531
9,907
10,498
10,619
4.3
4.0
4,700
4,700
5,798
5,919
1,855
1,894
3,943
4,025
-2.7
7.8
2.7
6.6
8.3
32.0
101.2
7.4
2.7
5.5
11.1
32.0
101.9
7.3
FY17
4QE
14,051
1.5
6,053
20,104
9,278
10,826
1.2
4,640
6,187
1,980
4,207
31.6
2.7
7.5
10.0
32.0
102.7
7.1
(INR Million)
FY18E
55,230
7.3
24,304
79,534
37,311
42,222
8.1
18,740
23,482
7,514
15,968
13.6
2.7
7.5
10.0
32.0
102.7
7.1
51,461
15.7
22,114
73,574
33,567
40,007
18.1
22,425
17,582
3,526
14,057
97.6
2.7
2.4
-1.0
20.1
98.7
7.5
21 July 2017
18

June 2017 Results Preview | Sector: Oil & Gas
MRPL
Bloomberg
Equity Shares (m)
M. Cap. (INR b)/(USD b)
52-Week Range (INR)
1,6,12 Rel Perf. (%)
MRPL IN
1752.7
212 / 3
143 / 67
-9 / -5 / 63
n
CMP: INR121
n
TP: INR113 (-6%)
Neutral
Financial snapshot (INR b)
Y/E march
2017 2018E 2019E 2020E
Sales
EBITDA
Adj. PAT
Adj. EPS (INR)
EPS Gr. (%)
BV/Sh.(INR)
RoE (%)
RoCE (%)
Payout (%)
Valuation
P/E (x)
P/BV (x)
EV/EBITDA (x)
Div. Yield (%)
8.2
2.1
5.5
3.4
11.9
1.9
6.1
1.7
10.3
1.6
5.5
1.9
9.8
1.4
4.6
2.0
432.1 436.9 488.2 488.2
47.1
25.9
14.8
95.1
57.5
31.4
19.6
23.4
37.0
17.8
10.2
(31.3)
65.2
16.5
12.4
23.4
40.3
20.6
11.8
15.9
74.2
16.9
13.5
23.4
40.3
21.5
12.3
4.3
83.6
15.5
13.3
23.4
n
n
We expect MRPL to report EBITDA of INR7.5b (v/s INR15.5b in
4QFY17). We estimate adjusted PAT at INR3.3b (v/s INR8.7b in
4QFY17).
Regional benchmark Reuters Singapore’s GRM is up 28% YoY and
flat QoQ at USD6.4/bbl. We model MRPL’s GRM at USD5.5/bbl v/s
USD8.1/bbl in 4QFY17 and USD5.3/bbl in 1QFY17 due to the
shutdown at its plant.
We expect refinery throughput at 4mmt v/s 4.2mmt in 4QFY17 and
3.7mmt in 1QFY17.
For MRPL, we model GRM of ~USD6.2/bbl in FY18 and ~USD6.45/bbl
in FY19/20. The stock trades at 10.3x FY19E EPS of INR11.8 and EV
of 5.5x FY19E EBITDA. Maintain Neutral.
Key issues to watch for
Ø
GRM.
Ø
Forex fluctuations.
Ø
Inventory changes.
Standalone - Quarterly Earning Model
Y/E March
Net Sales
YoY Change (%)
Total Expenditure
EBITDA
Margins (%)
Depreciation
Interest
Other Income
PBT before EO expense
Extra-Ord expense
PBT
Tax
Rate (%)
Reported PAT
Adj. PAT
YoY Change (%)
Margins (%)
Key Assumptions
Refining throughput (mmt)
Core GRM (USD/bbl)
E: MOSL Estimates
1Q
84,288
-25.5
72,076
12,212
14.5
1,707
1,465
2,295
11,335
0
11,335
4,155
37
7,181
7,181
35.9
8.5
3.7
5.3
FY17
2Q
3Q
99,690 114,753
-2.5
30.1
91,835 103,277
7,855
11,476
7.9
10.0
1,681
1,702
1,115
1,395
926
636
5,984
9,015
0
0
5,984
9,015
1,826
3,355
31
37
4,159
5,660
4,159
5,660
-146.5
91.8
4.2
4.9
4.0
5.5
4.4
5.1
4Q
133,349
43.5
117,808
15,540
11.7
1,703
1,219
375
12,993
-15,973
28,966
9,542
33
19,424
8,713
-35.5
6.5
4.2
8.1
1QE
106,126
25.9
98,564
7,562
7.1
1,896
1,263
584
4,987
0
4,987
1,662
33
3,325
3,325
-53.7
3.1
4.0
5.5
FY18
2QE
3QE
109,409 110,241
9.7
-3.9
99,672 100,433
9,737
9,809
8.9
8.9
1,896
1,896
1,263
1,263
584
584
7,162
7,234
0
0
7,162
7,234
2,387
2,411
33
33
4,775
4,823
4,775
4,823
14.8
-14.8
4.4
4.4
4.0
6.4
4.0
6.4
4QE
111,074
-16.7
101,194
9,881
8.9
1,896
1,263
584
7,305
0
7,305
2,435
33
4,871
4,871
-44.1
4.4
4.0
6.4
(INR Million)
FY17
FY18E
432,079
9.0
384,996
47,083
10.9
6,793
5,194
4,232
39,328
-15,973
55,301
18,877
34
36,423
25,903
98.2
6.0
16.3
6.0
436,851
1.1
399,863
36,988
8.5
7,583
5,053
2,336
26,688
0
26,688
8,895
33
17,793
17,793
-31.3
4.1
16.0
6.2
21 July 2017
19

June 2017 Results Preview | Sector: Information Technology
Persistent Systems
Bloomberg
Equity Shares (m)
M. Cap. (INR b)/(USD b)
52-Week Range (INR)
1,6,12 Rel Perf. (%)
PSYS IN
80.0
54 / 1
710 / 501
12 / -12 / -15
n
CMP: INR670
n
TP: INR740 (11%)
Buy
Financial Snapshot (INR b)
Y/E march
2017 2018E 2019E 2020E
Sales
EBITDA
Adj. PAT
Adj. EPS (INR)
EPS Gr. (%)
BV/Sh.(INR)
RoE (%)
RoCE (%)
Payout (%)
Valuations
P/E (x)
P/BV (x)
EV/EBITDA (x)
Div. Yield (%)
17.1
2.6
9.0
1.4
14.7
2.5
7.9
1.9
12.3
2.4
6.6
2.2
10.8
2.4
6.1
2.5
28.8
4.7
3.1
37.7
1.4
244.5
17.0
16.7
23.9
31.0
5.2
3.5
43.9
16.4
254.2
18.1
16.0
27.3
34.8
6.1
4.2
52.3
19.2
264.5
20.8
17.3
26.8
38.0
6.6
4.7
59.3
13.4
269.7
22.9
20.0
27.0
n
n
n
We expect 3.4% QoQ revenue growth in 1QFY18, driven by [1] high
single-digit growth in Digital (versus a CQGR of 11.5% over the past
three quarters), [2] growth in IBM IoT, led by seasonal strength, [3]
stability in Services and Accelerite.
While this is a slightly soft start to the season at 7.6% YoY, Digital
should come back in the quarters going forward, to drive ~10% full-
year revenue growth.
We are modeling EBITDA margin of 16.5% (-140bp QoQ). This is
expansion of 140bp YoY from 15.1% in 1QFY17. The key headwinds
of INR appreciation, visa expenses and absence of write-back of bad
debt provisions should be partly negated by seasonal strength in
IBM IoT.
Our PAT estimate for the quarter is INR758m, down 10% QoQ
owing to lower margins.
The stock trades at 14.7x FY18E and 12.3x FY19E earnings. Buy
Key issues to watch for
Ø
Performance and outlook for top clients in ISV (ex-IBM).
Ø
Commentary on traction with Enterprise customers and potential
of winning large deals.
Ø
Outlook on sustainable profit margins in the near to medium
term.
Quarterly Performance (IFRS)
Y/E March
Revenue (USD m)
QoQ (%)
Revenue (INR m)
QoQ (%)
YoY (%)
GPM (%)
SGA (%)
EBITDA
EBITDA Margin (%)
EBIT Margin (%)
Other income
ETR (%)
PAT
QoQ (%)
YoY (%)
EPS (INR)
Headcount
Util excl. trainees (%)
Attrition (%)
IP rev. proportion(%)
E: MOSL Estimates
1Q
104.8
4.3
7,018
3.6
40.2
34.7
19.6
1,058
15.1
10.2
253
24.3
733
-9.3
9.0
9.2
9,389
75.3
16.7
28.2
FY17
2Q
105.2
0.4
7,040
0.3
29.7
35.5
19.8
1,108
15.7
10.5
243
25.3
735
0.3
2.3
9.2
9,305
74.2
15.9
27.8
3Q
110.0
4.6
7,455
5.9
25.9
36.3
20.4
1,187
15.9
10.7
318
26.7
819
11.4
5.7
10.2
9,229
78.9
15.8
28.4
4Q
109.0
-0.9
7,271
-2.5
7.4
36.1
18.2
1,302
17.9
12.5
143
19.9
842
2.8
4.2
9.1
9,460
77.8
15.7
27.6
1QE
112.7
3.4
7,269
0.0
3.6
35.7
18.7
1,198
16.5
11.1
206
25.0
758
-9.9
3.5
9.5
9,741
78.5
28.4
FY18E
2QE
3QE
116.0
121.3
2.9
4.6
7,595
8,007
4.5
5.4
7.9
7.4
35.1
37.2
19.0
19.0
1,188
1,420
15.6
17.7
10.5
12.8
265
297
25.0
25.0
794
991
4.7
24.7
8.1
21.0
9.9
12.4
9,847
10,028
78.0
78.5
28.4
28.9
FY17
4QE
121.7
0.3
8,091
1.1
11.3
36.8
18.9
1,409
17.4
12.4
284
25.0
967
-2.4
14.9
12.1
10,209
78.5
27.4
429
22.0
28,784
24.5
35.7
19.5
4,653
16.2
11.0
958
24.1
3,129
5.2
37.7
9,460
76.6
28.0
(INR m)
FY18E
472
9.9
30,962
7.6
36.2
19.4
5,215
16.8
11.7
1,051
25.0
3,510
12.2
43.9
10,209
77.5
28.2
21 July 2017
20

In conversation
1. India Gate' not registered; does not fall under GST Ambit:
KRBL; Anoop Gupta, Joint MD
n
n
n
n
n
n
n
n
n
n
5% GST is on the registered brand but the brand ‘India Gate’ is not registered. So
we do not fall under any 5 percent.
Will be having zero taxability as far as India Gate brand is concerned
Company is at an advantage compared to peers and would like to increase its
market share.
Average realisation is around USD 1,200 and EBITDA > 20% for exports
Company has hardly any exposure to Europe of about Rs 30-40 crore in a topline
of Rs 4,000 crore.
Current capacity utilisation of the company is 55-60 percent.
Iran will stop importing rice from next month
Coming year season looks to be very good
Lowered the price of India Gate by 3-3.5 percent
Launching a new kind of food grain called Quinoa. It will be started in next 15
days by first week of August and the revenue expected from Quinoa in first year
is Rs 100 crore.
2. LNG prices may remain low for 5-6 years: Petronet LNG; RK
Garg, Director-Finance
n
n
n
n
n
n
n
n
Overall fundamentals are good and overall growth is on increasing trend
LNG consumption in the country during 2016 have been 19 million tonne, there
has been a growth and that growth momentum would continue.
There is an increase in the overall demand of the gas in the country
Speaking about Dahej, there is a ramp up going on due to capacity expansion to
15 million tonne. Tariff increase is a yearly phenomenon and would happen in
January 2018
Mundra terminal is getting ready by end of this year and it is in Gujarat, thought
there could be some synergy with Dahej and Mundra. That is why Petronet is
looking into the terminal
No concrete decision has been taken yet, yes we are looking into it
Kochi terminal may see a ramp up in 2019
In the next five-six years LNG prices are likely to remain low and India being a
major consumer of energy and gas, we will take advantage of this low price gas
in India
3. Expect slippages in agriculture to reduce going ahead: Canara
Bank; Rakesh Sharma, MD & CEO
n
n
n
n
n
Emphasis was more on retail and CASA deposits
Stopped taking bulk deposits.
Cost of deposits declined to 5.83 percent versus 6.45 percent YoY
Looking at loan growth of 10-11 percent for FY18.
Expects slippages in agriculture to reduce going ahead.
21 July 2017
21

From the think tank
1. Who cares about monetary policy?
n
The Reserve Bank of India (RBI) will announce monetary policy in less than two
weeks’ time. There is already speculation about the official rate of interest,
essentially based on information about softening of the inflation rate.
Movements in both the Consumer Price Index for all items (CPI) and Whole Price
Index (WPI) show declines much below the average inflation target of 4%. In the
circumstances, it is no wonder the chief economic adviser to the ministry of
finance (MoF), Arvind Subramanian, has strongly pitched for a rate cut. Bank of
America-Merrill Lynch strongly favours rate cuts. A number of other
commentators have taken the same position. However, the amount of rate cut
is not under any serious discussion at this point in time. Do money and asset
markets care for monetary policy announcements now? Don’t they have
solutions, digital or otherwise, to counter the different scenarios of rate cut and
constancy of the rate?
2. Indian Economy: a tale of two narratives
n
There are two competing, economic narratives on India at the moment. They sit
uneasily with each other. But both are correct. The first centres around the
dramatic improvement in macroeconomic stability. Just four years ago, India
was the poster-child of emerging market vulnerability. Double-digit inflation,
and elevated fiscal and current account deficits (CAD) drove India into a mini
balance of payments crisis in 2013. There is, however, a second—more
sobering—narrative: of a near-term slowdown that may be hard to reverse
using traditional fiscal and monetary policy. After the latest gross domestic
product (GDP) revisions, the statistics have finally caught up with the economy.
It’s clear now that growth had begun to slow well before demonetisation.
3. China’s cashless revolution is likely to spread
n
On a recent trip to Shenzhen, in southern China, I came across a subway busker
with two tip jars. The first was a cardboard box filled with coins and bills; the
second was a small QR code taped to the box that allowed passersby to leave a
tip by smartphone. On one level, this was simply smart business: Chinese made
around $5.5 trillion in e-payment transactions last year. But it also offered a
glimpse of the future. Around the developing world, QR codes are beating out
Apple Pay and other brand-name payment services for consumers and
businesses keen to go cashless. China offers a useful model for that
transformation—and a standard that others may soon be emulating. The QR
code may seem like an unlikely candidate to foster a financial revolution. It was
developed in the 1990s by Japan’s Denso Corp. after customers grew dissatisfied
with the limited amount of information that could be stored using traditional
barcodes. In solving that problem, Denso came up with new codes that could be
read 10 times more quickly than their predecessors—QR stands for “quick
response.”
21 July 2017
22

International
4. Taking charge at the G-20
n
Coming on the heels of prime minister Narendra Modi’s recent visits to Tel Aviv
and Washington, DC was the G-20 summit in Hamburg, Germany. Much of the
media attention on the two-day summit focused on US President Donald Trump,
his bilateral meetings with key heads of state, and whether the Trump
administration would use the meeting to push a narrower agenda for
globalization where protectionism and parochialism, not partnership, is
emphasized. The resultant communique revealed that current US policy runs
against the consensus among G-20 countries, particularly in areas like trade and
climate change. The communique called for new trade deals to be reciprocal
and non-discriminatory, swiftly dispensing with now seemingly archaic notions
of trade liberalization. The US aside, the other 19 countries affirmed the
importance of climate change, declaring the Paris Agreement as “irreversible”.
21 July 2017
23

Click excel icon
for detailed
valuation guide
Rs
Valuation snapshot
P/E (x)
P/B (x)
FY17 FY18E FY17 FY18E
29.7
23.1
21.3
43.4
50.8
19.6
47.6
37.7
33.1
26.8
22.1
25.6
45.8
30.1
23.2
48.7
28.9
35.2
27.6
35.8
24.7
30.1
19.7
20.4
32.6
NM
36.5
45.3
13.0
21.5
29.1
27.0
NM
18.7
38.2
11.3
NM
25.2
977.1
20.1
108.9
47.3
37.0
24.8
16.1
59.4
35.2
16.8
29.2
19.6
24.7
19.2
19.6
30.1
37.0
19.0
33.9
29.0
17.9
22.6
18.8
20.9
24.9
25.6
14.9
35.1
22.4
22.7
23.1
34.9
21.8
25.4
19.2
17.5
25.2
19.2
30.4
29.9
9.9
17.3
23.2
8.8
11.0
11.7
9.1
9.9
8.7
15.3
16.2
6.2
13.2
33.3
18.8
20.7
12.9
48.6
32.6
13.0
21.3
15.7
5.5
5.1
4.8
6.4
8.3
3.1
16.5
7.2
3.3
3.7
7.4
3.2
2.8
6.3
2.7
11.3
4.9
2.4
2.8
2.6
2.3
4.9
2.2
1.4
4.7
0.8
4.7
4.8
1.1
3.4
3.3
1.1
0.7
0.7
0.5
1.1
0.4
0.9
1.4
0.5
1.0
9.0
4.4
4.2
1.9
17.8
6.5
4.0
3.4
3.5
4.6
4.4
4.3
5.6
7.4
2.7
11.9
5.9
2.9
3.3
6.3
2.9
2.5
5.4
2.3
9.0
4.3
2.2
2.3
2.4
1.9
4.4
2.1
1.3
4.1
0.8
4.2
4.2
1.0
2.9
3.0
1.0
0.7
0.7
0.5
1.0
0.4
0.8
1.3
0.5
0.9
7.3
3.6
3.5
1.7
14.6
5.9
3.6
3.0
3.0
ROE (%)
FY17 FY18E FY19E
20.3
23.3
25.3
16.2
15.8
16.9
40.3
20.8
10.6
14.0
35.7
14.2
6.4
20.3
9.8
25.6
17.1
6.9
10.8
8.9
9.9
17.9
10.2
7.2
15.4
-27.0
13.8
12.3
9.5
18.9
11.4
4.1
-6.7
4.2
1.4
10.1
-8.4
3.6
-0.2
2.7
0.9
21.7
15.1
18.1
14.4
32.5
19.3
25.5
12.4
19.4
20.4
24.5
23.1
19.8
21.1
15.1
40.8
22.4
17.3
14.8
36.0
14.1
10.8
20.8
16.5
28.6
19.0
10.1
11.4
7.1
10.2
18.2
9.4
7.9
17.3
4.0
14.9
14.9
10.8
18.0
12.8
11.9
6.1
6.2
5.8
10.6
4.6
5.6
8.7
8.1
6.7
24.3
20.9
18.5
13.9
33.0
18.3
29.0
15.3
20.6
20.7
27.1
24.4
22.3
21.9
17.8
38.0
23.6
18.3
15.9
31.0
14.6
11.5
22.8
27.3
35.2
22.6
15.4
11.8
10.1
10.5
19.0
10.1
8.8
18.5
7.0
16.1
17.5
12.7
19.5
14.4
13.2
9.0
9.1
7.3
11.1
5.4
7.5
10.0
10.5
8.2
25.9
21.6
18.9
15.3
32.8
17.4
32.7
17.5
19.7
Company
Automobiles
Amara Raja
Ashok Ley.
Bajaj Auto
Bharat Forge
Bosch
CEAT
Eicher Mot.
Endurance Tech.
Escorts
Exide Ind
Hero Moto
M&M
Mahindra CIE
Maruti Suzuki
Tata Motors
TVS Motor
Aggregate
Banks - Private
Axis Bank
DCB Bank
Equitas Hold.
Federal Bank
HDFC Bank
ICICI Bank
IDFC Bank
IndusInd
J&K Bank
Kotak Mah. Bk
RBL Bank
South Indian
Yes Bank
Aggregate
Banks - PSU
BOB
BOI
Canara
IDBI Bk
Indian Bk
OBC
PNB
SBI
Union Bk
Aggregate
NBFCs
Bajaj Fin.
Bharat Fin.
Cholaman.Inv.&F
n
Dewan Hsg.
GRUH Fin.
HDFC
Indiabulls Hsg
L&T Fin Holdings
LIC Hsg Fin
Reco
Buy
Buy
Buy
Buy
Neutral
Buy
Buy
Buy
Neutral
Buy
Neutral
Buy
Not Rated
Buy
Buy
Buy
CMP
(INR)
TP
% Upside
EPS (INR)
(INR) Downside FY17 FY18E FY19E
29
15
19
17
-1
15
7
16
11
31
-2
14
13
45
6
28.0
4.6
132.3
26.2
473.1
93.3
613.8
23.5
20.0
8.2
169.1
54.3
5.4
248.6
19.8
11.7
33.8
40.5
5.5
7.1
143.5 167.9
37.7
49.7
649.9 766.2
96.2
131.3
861.2 1,102.9
30.5
38.8
36.9
45.7
9.7
11.9
198.2 198.7
66.7
79.9
9.9
11.8
292.6 379.7
30.9
64.3
16.3
25.9
833
1,073
106
122
2,819 3,359
1,135 1,330
24,035 23,738
1,828 2,100
29,201 31,326
886
1,025
660
731
218
286
3,730 3,666
1,393 1,586
245
-
7,491 8,483
460
666
572
606
Neutral
540
Neutral
193
Buy
169
Buy
119
Buy
1,708
Buy
301
Neutral
61
Buy
1,562
Neutral
84
Buy
980
Under Review 539
Buy
28
Buy
1,571
500
192
207
134
1,885
340
62
1,800
89
1,146
-
34
2,121
-7
-1
23
13
10
13
1
15
5
17
20
35
15.4
7.0
4.7
4.8
56.8
15.3
3.0
47.9
-31.3
26.8
11.9
2.2
73.0
23.8
8.4
4.8
5.5
67.1
15.6
3.5
61.9
4.4
32.2
18.0
2.9
90.7
40.3
10.4
7.4
6.8
79.4
17.9
4.2
76.8
8.0
40.4
24.2
3.7
114.6
Buy
Neutral
Neutral
Neutral
Buy
Neutral
Buy
Buy
Neutral
162
151
352
58
330
149
157
291
154
212
147
360
49
357
150
184
362
162
31
-3
2
-15
8
1
17
25
6
6.0
-14.8
18.8
1.5
29.3
-31.6
6.2
0.3
7.6
18.4
13.7
30.1
6.4
33.2
17.1
10.3
17.9
24.6
22.5
22.0
47.0
8.6
38.0
21.4
14.5
23.3
34.5
Buy
Neutral
Buy
1,588
777
1,141
1,800
800
1,300
530
450
-
1,300
180
750
13
3
14
11
-7
12
18
0
33.6
21.0
46.0
29.6
8.1
46.8
69.0
5.2
38.2
47.6
41.3
55.0
37.0
9.9
50.7
88.9
7.2
47.9
62.9
53.0
66.4
45.4
12.1
55.9
113.9
9.6
53.8
Buy
477
Neutral
483
Under Review 1,651
Buy
1,159
Buy
153
Neutral
751
21 July 2017
24

Company
Reco
Manappuram
Not Rated
M&M Fin.
Buy
Muthoot Fin
Buy
PFC
Neutral
Repco Home
Buy
REC
Neutral
Shriram
City
Buy
Union
STF
Buy
Aggregate
Capital Goods
ABB
Sell
Bharat Elec.
Buy
BHEL
Sell
Blue Star
Neutral
CG Cons. Elec.
Buy
CG Power & Indu. Sell
Cummins
Buy
GE T&D
Neutral
Havells
Neutral
K E C Intl
Neutral
L&T
Buy
Pennar Eng.
Not Rated
Siemens
Neutral
Solar Ind
Neutral
Suzlon Energy
Not Rated
Thermax
Sell
Va Tech Wab.
Buy
Voltas
Sell
Aggregate
Cement
Ambuja Cem.
Buy
ACC
Neutral
Birla Corp.
Buy
Dalmia Bharat
Buy
Grasim Inds.
Neutral
India Cem
Neutral
J K Cements
Buy
JK Lakshmi Ce
Buy
Ramco Cem
Buy
Orient Cem
Buy
Prism Cem
Buy
Shree Cem
Buy
Ultratech
Buy
Aggregate
Consumer
Asian Paints
Neutral
Britannia
Buy
Colgate
Buy
Dabur
Neutral
Emami
Buy
Godrej Cons.
Neutral
GSK Cons.
Sell
HUL
Buy
ITC
Neutral
CMP
(INR)
102
358
460
127
812
184
2,318
961
TP
% Upside
EPS (INR)
(INR) Downside FY17 FY18E FY19E
-
8.6
10.8
12.5
415
16
7.1
13.6
16.4
550
19
29.5 41.0
43.3
117
-8
25.7 27.2
30.2
936
15
29.1 35.8
42.5
134
-27
31.4 35.0
40.4
2,900
1,340
25
40
84.3
55.6
132.8
78.5
171.2
98.5
P/E (x)
P/B (x)
FY17 FY18E FY17 FY18E
11.8
9.5
2.6
2.3
50.6 26.4
3.1
2.9
15.6 11.2
2.8
2.4
4.9
4.7
0.8
0.7
27.9 22.7
4.5
3.8
5.9
5.2
1.1
0.9
27.5
17.3
19.7
74.0
24.9
68.2
50.8
44.1
20.9
36.6
56.8
48.5
24.9
28.0
17.6
76.7
42.7
29.2
30.3
21.1
31.8
35.4
53.6
47.5
32.1
68.4
15.8
37.2
29.1
66.7
24.9
NM
357.3
46.5
43.1
37.1
55.0
51.4
50.1
41.6
40.8
50.6
35.0
58.7
34.5
17.5
12.2
16.4
58.2
24.1
41.2
36.8
37.6
37.5
33.2
52.5
42.4
23.0
25.2
13.7
56.3
38.9
21.0
28.6
17.5
31.5
31.1
36.1
34.5
23.0
39.7
15.1
22.4
24.2
40.7
21.9
35.2
33.5
39.3
45.3
31.3
50.0
44.3
41.4
39.0
38.3
43.9
32.8
50.2
31.3
3.0
1.9
3.3
9.4
5.1
1.1
8.3
24.0
1.3
7.2
8.1
8.8
4.8
3.3
1.8
7.1
7.8
-1.7
4.1
3.4
4.9
4.0
2.7
3.7
2.2
4.7
1.7
1.3
3.9
3.9
4.4
3.4
6.2
8.8
4.8
3.6
14.6
16.9
22.7
11.0
14.0
12.3
7.4
37.4
7.8
2.7
1.7
2.9
8.1
4.0
1.1
7.8
17.3
1.2
6.6
7.4
7.9
4.1
3.1
1.6
6.2
6.7
-1.8
3.7
2.9
4.4
3.6
2.6
3.6
2.1
4.3
1.6
1.2
3.4
3.6
3.8
3.1
5.4
7.3
4.4
3.3
14.0
15.5
21.4
9.4
11.8
9.5
7.2
36.1
7.7
FY17
24.0
6.3
19.4
17.9
17.4
19.9
11.7
11.7
16.9
12.7
20.6
1.6
18.0
76.4
6.2
21.2
12.4
18.2
21.2
12.2
10.2
9.3
19.8
NM
14.3
16.3
18.0
11.2
5.1
7.9
7.5
7.2
11.5
3.4
14.4
6.0
19.2
-3.2
1.8
20.2
11.6
9.7
28.5
36.9
50.4
28.4
35.8
24.6
22.2
65.6
23.5
ROE (%)
FY18E
25.9
11.4
23.2
17.0
18.1
19.1
16.2
14.7
17.8
13.9
16.5
2.7
21.7
53.4
3.4
20.7
14.7
18.6
19.2
12.6
11.6
11.0
18.6
-8.8
13.7
17.7
14.7
11.7
7.3
10.6
9.2
11.3
10.9
5.5
15.0
9.2
18.6
9.2
17.2
20.4
10.1
10.5
28.6
36.5
53.2
26.0
33.4
24.5
22.1
73.1
24.8
FY19E
26.9
12.8
21.4
16.8
18.2
19.1
18.1
16.3
17.9
15.8
16.8
3.4
30.1
49.8
4.2
23.5
16.4
20.7
20.9
13.4
12.6
13.7
19.9
-11.0
12.9
17.5
14.9
12.7
7.8
13.1
12.2
13.1
13.9
7.2
17.2
13.8
19.1
12.6
22.0
21.3
14.0
12.9
30.6
38.3
60.3
26.3
34.1
23.0
22.4
82.8
26.3
1,459
173
147
655
206
86
970
326
463
295
1,186
124
1,366
880
19
934
612
491
1,200
200
100
610
240
65
1,110
320
455
250
1,340
-
1,355
825
-
850
800
400
-18
16
-32
-7
16
-24
14
-2
-2
-15
13
-1
-6
-9
31
-19
19.7
6.9
2.1
12.9
4.7
4.1
26.5
5.7
9.6
11.9
42.3
7.1
17.8
20.6
0.6
30.8
28.9
15.5
25.1
7.2
3.6
17.8
5.5
2.3
29.2
6.2
10.9
12.8
47.1
9.1
24.3
22.6
0.9
32.7
34.9
15.6
32.2
8.1
4.7
26.6
6.6
4.5
36.0
7.6
13.8
16.4
54.0
11.2
33.3
28.2
1.0
34.0
39.8
17.6
262
291
1,716 1,622
942
1,205
2,651 3,162
1,073 1,384
209
219
979
1,287
464
553
679
823
163
178
124
145
17,870 21,052
4,143 4,936
11
-5
28
19
29
5
31
19
21
9
17
18
19
4.9
7.3
36.1 49.8
29.4 40.9
38.8 66.7
67.9 71.2
5.6
9.3
33.7 40.4
7.0
11.4
27.3 31.1
-1.6
4.6
0.3
3.7
384.4 454.7
96.1 91.5
8.2
65.0
58.9
87.1
102.6
12.9
53.5
19.2
37.5
7.0
5.6
575.2
138.8
1,157
3,789
1,063
302
1,082
956
5,460
1,153
290
1,240
4,450
1,335
315
1,265
930
4,500
1,285
280
7
17
26
4
17
-3
-18
11
-3
21.0 23.1
73.7 85.5
21.2 25.7
7.2
7.7
26.5 28.3
18.9 21.8
156.1 166.3
19.6 22.9
8.4
9.3
27.4
105.4
31.1
9.1
33.9
25.0
181.9
27.3
10.3
21 July 2017
25

Company
Jyothy Lab
Marico
Nestle
Page Inds
Parag Milk
Pidilite Ind.
P&G Hygiene
Prabhat Dairy
United Brew
United Spirits
Aggregate
Healthcare
Alembic Phar
Alkem Lab
Ajanta Pharma
Aurobindo
Biocon
Cadila
Cipla
Divis Lab
Dr Reddy’s
Fortis Health
Glenmark
Granules
GSK Pharma
IPCA Labs
Jubilant Life
Lupin
Sanofi India
Sun Pharma
Syngene Intl
Torrent Pharma
Aggregate
Logistics
Allcargo Logistics
Blue Dart
Concor
Gateway
Distriparks
Gati
Transport Corp.
Aggregate
Media
Dish TV
D B Corp
Den Net.
Hind. Media
HT Media
Jagran Prak.
PVR
Siti Net.
Sun TV
Zee Ent.
Aggregate
Metals
Reco
Neutral
Neutral
Sell
Buy
Neutral
Neutral
Buy
Not Rated
Neutral
Neutral
CMP
TP
% Upside
(INR)
(INR) Downside
379
405
7
326
360
11
6,859 5,990
-13
16,833 20,195
20
248
240
-3
798
835
5
8,020 9,082
13
138
-
820
850
4
2,700 2,415
-11
FY17
11.2
6.3
118.0
238.7
3.6
16.7
144.9
3.5
8.7
26.7
EPS (INR)
FY18E FY19E
8.9
11.0
6.9
8.4
118.6 139.5
317.0 400.0
7.4
12.3
18.4
21.2
155.8 181.6
3.5
6.4
9.7
14.7
37.4
51.8
P/E (x)
P/B (x)
FY17 FY18E FY17 FY18E
33.7 42.3
6.3
6.5
51.8 46.9 18.1 15.4
58.1 57.8 21.9 20.2
70.5 53.1 28.2 22.3
68.8 33.3
3.2
2.9
47.7 43.3 12.4 10.0
55.3 51.5 45.7 36.5
39.1 39.7
2.0
1.9
94.3 84.5
9.4
8.6
101.0 72.3 20.2 13.9
46.7 41.8 12.9 12.0
25.9
23.8
25.1
19.1
39.6
37.1
36.0
18.8
37.8
15.2
18.0
20.1
74.1
29.8
20.0
19.7
32.4
22.3
37.4
23.1
25.6
18.1
43.8
31.1
39.7
14.9
19.1
29.7
83.9
18.4
NM
10.8
11.5
16.0
67.4
NM
33.3
23.3
40.6
22.4
22.6
22.2
16.4
39.0
29.7
28.6
21.1
25.9
74.4
16.5
17.8
49.0
22.4
15.7
20.1
31.3
23.1
30.1
22.5
23.8
14.6
34.6
30.1
25.2
7.9
15.4
25.3
58.3
15.8
NM
9.9
10.8
14.1
47.8
NM
29.0
34.6
30.4
5.5
5.1
8.3
4.8
5.4
8.4
3.7
4.2
3.7
1.6
4.4
3.7
16.0
2.5
3.4
4.0
5.6
3.8
7.5
5.4
4.5
2.7
19.4
3.3
2.3
2.0
3.0
3.6
18.0
4.3
1.5
1.9
0.8
2.3
6.7
3.6
8.3
8.9
6.0
4.7
4.3
6.3
3.7
4.9
7.0
3.3
3.8
3.1
1.4
3.6
2.6
19.4
2.3
2.8
3.4
5.2
3.6
6.2
4.7
3.9
2.4
14.8
3.1
2.3
1.8
2.5
3.4
13.8
3.8
1.6
1.6
0.7
2.3
5.9
3.7
7.6
7.5
5.4
FY17
21.1
36.7
39.0
40.0
5.9
28.2
45.3
5.2
10.4
21.3
27.6
23.0
23.4
37.7
28.3
13.6
24.8
10.2
23.5
9.6
11.3
24.7
21.1
21.5
8.6
18.1
22.0
17.1
18.5
22.2
25.3
17.5
12.6
50.5
10.8
5.9
12.4
16.7
12.2
24.1
25.5
-12.0
19.0
7.1
17.6
10.4
-23.5
25.0
24.7
14.7
ROE (%)
FY18E
15.1
35.5
36.4
42.0
9.1
25.6
78.9
4.9
10.7
19.3
28.7
22.6
20.7
32.2
25.5
12.6
25.7
11.5
19.0
13.2
2.0
21.6
17.7
39.7
10.5
19.5
18.2
16.6
16.1
22.5
22.4
16.5
17.2
48.6
10.6
9.1
19.4
17.8
13.4
26.8
25.7
-5.3
17.3
6.9
16.4
13.2
-2.0
26.3
23.6
17.8
FY19E
18.4
38.1
39.0
42.8
13.4
24.0
74.0
8.5
14.6
19.7
29.6
23.1
21.0
29.9
22.3
15.6
27.2
12.8
19.2
14.9
5.3
20.9
18.8
54.4
12.7
19.6
19.4
18.1
17.9
20.7
24.2
17.5
17.8
46.8
11.8
11.1
25.4
18.6
15.0
327.5
26.5
0.7
17.3
6.4
17.2
17.7
6.9
30.2
23.7
22.7
Neutral
Neutral
Buy
Buy
Sell
Buy
Neutral
Neutral
Neutral
Buy
Neutral
Buy
Neutral
Neutral
Buy
Buy
Buy
Buy
Not Rated
Buy
558
1,801
1,466
750
404
528
572
745
2,746
157
707
145
2,547
479
740
1,166
4,189
582
486
1,275
640
1,900
2,028
850
300
510
500
600
2,600
240
800
200
2,700
480
905
1,475
4,820
650
-
1,450
15
5
38
13
-26
-3
-13
-19
-5
53
13
38
6
0
22
27
15
12
14
21.6 24.9
75.7 79.7
58.4 66.1
39.3 45.7
10.2 10.4
14.2 17.8
15.9 20.0
39.7 35.4
72.6 106.2
10.3
2.1
39.3 42.9
7.2
8.2
34.4 51.9
16.1 21.3
37.0 47.1
59.2 57.9
129.1 133.6
26.1 25.2
13.0 16.1
55.2 56.8
30.5
95.0
79.6
50.0
14.4
23.2
25.0
39.8
143.0
6.1
51.7
11.5
60.1
28.5
56.7
72.0
160.6
30.8
18.0
71.4
Buy
Not Rated
Neutral
Buy
Not Rated
Not Rated
178
4,490
1,182
270
125
324
228
-
1,236
313
-
-
28
5
16
9.8
12.2
102.5 129.9
38.0 39.2
6.8
8.4
16.9
10.7
15.9
21.0
14.3
163.2
45.8
13.6
23.9
25.9
Buy
Buy
Neutral
Buy
Neutral
Buy
Buy
Neutral
Neutral
Buy
83
375
79
280
86
173
1,384
26
828
539
105
450
90
350
90
225
1,588
32
860
585
27
20
14
25
5
30
15
23
4
9
1.0
20.4
-8.6
25.9
7.4
10.8
20.5
-1.8
24.9
23.1
1.4
23.6
-2.7
28.3
7.9
12.3
28.9
-0.1
28.5
15.6
4.0
27.5
0.3
33.6
8.1
14.0
45.1
0.5
35.9
18.6
21 July 2017
26

Company
Hindalco
Hind. Zinc
JSPL
JSW Steel
Nalco
NMDC
SAIL
Vedanta
Tata Steel
Aggregate
Oil & Gas
BPCL
GAIL
Gujarat Gas
Gujarat St. Pet.
HPCL
IOC
IGL
MRPL
Oil India
ONGC
PLNG
Reliance Ind.
Aggregate
Retail
Jubilant Food
Titan Co.
Aggregate
Technology
Cyient
HCL Tech.
Hexaware
Infosys
KPIT Tech
L&T Infotech
Mindtree
Mphasis
NIIT Tech
Persistent Sys
Tata Elxsi
TCS
Tech Mah
Wipro
Zensar Tech
Aggregate
Telecom
Bharti Airtel
Bharti Infratel
Idea Cellular
Tata Comm
Aggregate
Utiltites
Coal India
CESC
JSW Energy
Reco
Buy
Sell
Buy
Buy
Neutral
Buy
Sell
Buy
Neutral
CMP
(INR)
214
281
141
215
70
124
63
270
556
TP
% Upside
EPS (INR)
(INR) Downside FY17 FY18E FY19E
308
44
16.2 21.8
26.1
246
-12
19.7 22.1
26.8
190
35
-20.9 -17.2
2.4
281
31
14.8 19.0
22.6
70
0
3.7
3.8
4.2
180
46
10.0 12.1
12.2
37
-41
-6.2 -10.6
-4.2
311
15
15.1 24.5
32.2
583
5
37.0 50.5
66.5
P/E (x)
P/B (x)
FY17 FY18E FY17 FY18E
13.2
9.8
1.6
1.4
14.3 12.7
3.9
4.2
NM
NM
0.4
0.5
14.5 11.3
2.3
2.0
19.0 18.6
1.3
1.3
12.4 10.2
1.7
1.6
NM
NM
0.7
0.8
17.8 11.0
1.7
1.6
15.0 11.0
1.7
1.5
19.4 14.9
1.6
1.5
9.7
16.8
37.5
19.5
9.0
8.7
26.4
8.5
14.6
10.1
18.1
14.3
12.1
129.7
58.7
64.2
17.0
14.8
17.9
15.4
10.9
14.1
19.5
14.8
12.8
17.4
30.0
18.3
12.7
15.9
14.8
16.7
37.8
27.3
NM
25.7
39.9
17.1
17.3
16.9
12.7
14.4
22.8
15.6
12.4
10.4
24.0
12.4
10.1
9.5
24.0
12.5
12.3
87.7
51.5
55.2
14.7
14.4
15.9
15.2
12.0
13.3
16.9
13.6
13.3
15.0
24.9
18.3
12.6
15.6
13.1
16.6
71.5
23.6
NM
65.4
130.2
14.5
11.4
20.8
3.0
1.7
6.4
2.2
2.8
1.7
5.4
2.2
0.8
1.0
3.8
1.6
1.6
10.6
11.1
11.1
2.8
3.7
4.4
3.2
1.6
4.9
3.2
2.0
2.0
2.7
9.4
5.5
2.1
2.5
2.3
3.8
2.5
4.8
1.4
11.9
2.8
6.5
1.8
1.0
2.6
1.6
5.2
1.9
2.4
1.6
4.6
1.9
0.7
0.9
3.4
1.4
1.5
9.8
10.2
10.1
2.4
3.7
3.8
2.9
1.5
3.8
3.1
2.3
1.8
2.6
7.6
5.8
1.9
2.3
2.0
3.7
2.4
4.2
1.6
10.1
2.7
6.5
1.6
1.0
FY17
14.0
24.4
-7.9
17.3
7.2
12.4
-6.7
9.7
15.4
8.2
32.4
9.6
17.8
11.6
32.4
21.2
21.0
31.4
5.7
10.1
23.2
11.9
13.3
8.2
20.6
17.2
16.2
27.5
26.5
22.0
14.3
40.4
16.8
13.2
16.1
17.0
37.1
32.6
18.4
16.9
16.3
22.9
6.7
16.2
-1.6
126.2
6.9
37.8
10.5
6.3
ROE (%)
FY18E
15.2
31.5
-5.4
18.7
7.0
15.0
-12.6
14.6
14.6
10.3
21.7
11.3
25.3
13.1
20.6
15.8
20.6
16.5
7.5
9.9
15.1
11.8
12.0
11.1
20.6
18.4
16.6
25.2
25.3
20.0
13.2
32.5
17.3
14.2
14.3
18.1
33.7
31.1
16.0
15.4
16.3
22.4
3.4
19.1
-15.3
16.7
2.1
44.5
14.4
4.9
FY19E
15.4
35.2
0.8
19.0
7.5
15.5
-5.5
17.9
17.0
13.2
22.3
11.8
28.0
14.0
20.0
15.8
19.6
16.9
7.8
10.8
26.4
11.5
12.4
14.0
21.6
19.2
17.3
25.8
23.5
19.8
12.5
28.4
20.1
16.1
15.2
20.8
32.3
33.5
16.9
15.5
17.1
22.2
6.1
18.7
-20.8
37.8
4.2
47.0
13.9
4.8
Neutral
Sell
Sell
Neutral
Buy
Neutral
Neutral
Neutral
Buy
Buy
Buy
Neutral
467
379
767
172
367
374
1,124
126
282
166
206
1,529
511
340
697
168
420
459
1,070
113
305
195
259
1,262
10
-10
-9
-2
14
23
-5
-10
8
18
26
-17
48.3 36.7
22.6 26.3
20.4 33.7
8.8
11.0
40.7 29.5
43.0 36.0
42.5 46.8
14.8 10.2
19.3 27.9
16.4 17.4
11.4
8.6
106.6 122.1
43.5
29.8
46.5
13.1
32.6
40.0
51.9
11.8
30.1
19.7
17.6
131.0
Sell
Neutral
1,298
530
850
545
-35
3
10.0
9.0
14.8
10.3
20.7
12.1
Buy
Buy
Neutral
Buy
Neutral
Buy
Sell
Neutral
Neutral
Buy
Buy
Neutral
Buy
Neutral
Buy
522
885
245
969
130
784
484
577
546
657
1,690
2,445
392
269
812
600
960
235
1,200
150
850
450
600
470
740
1,607
2,350
465
250
1,020
15
8
-4
24
16
8
-7
4
-14
13
-5
-4
19
-7
26
30.6 35.4
59.8 61.4
13.7 15.4
62.9 63.7
11.9 10.8
55.5 59.1
24.9 28.7
38.9 42.3
42.8 41.0
37.7 43.9
56.3 68.0
133.4 133.6
30.9 31.0
16.9 17.3
54.9 62.0
41.9
66.7
16.7
69.5
11.4
65.1
32.9
46.2
47.3
52.3
80.4
147.7
36.2
18.9
74.2
Buy
Buy
Buy
Buy
420
406
95
667
430
440
110
811
2
8
16
22
11.1
14.9
-1.1
26.0
5.9
17.2
-9.7
10.2
10.9
19.3
-11.2
30.8
Buy
Buy
Buy
255
899
65
315
1,140
85
23
27
30
14.9
51.9
3.9
17.6
78.6
3.2
18.6
86.0
3.1
21 July 2017
27

Company
NTPC
Power Grid
Tata Power
Aggregate
Others
Arvind
Avenue
Supermarts
Bata India
Castrol India
Century Ply.
Coromandel Intl
Delta Corp
Dynamatic Tech
Eveready Inds.
Interglobe
Indo Count
Info Edge
Inox Leisure
Jain Irrigation
Just Dial
Kaveri Seed
Kitex Garm.
Manpasand
MCX
Monsanto
Navneet
Education
PI Inds.
Piramal Enterp.
SRF
S H Kelkar
Symphony
TTK Prestige
V-Guard
Wonderla
Reco
Buy
Buy
Sell
CMP
(INR)
165
219
83
TP
% Upside
EPS (INR)
(INR) Downside FY17 FY18E FY19E
198
20
13.0 13.4
16.2
242
11
14.2 17.6
20.6
68
-18
5.2
6.4
6.7
P/E (x)
P/B (x)
FY17 FY18E FY17 FY18E
12.7 12.3
1.4
1.3
15.4 12.4
2.3
2.0
16.0 13.0
1.9
1.7
15.1 13.2
2.3
2.1
30.6
118.5
42.3
29.7
33.0
25.8
53.3
35.4
25.8
27.0
12.2
65.4
77.5
19.8
21.7
33.9
14.8
58.5
44.4
31.3
22.6
22.9
40.6
17.6
37.5
55.2
48.5
50.9
51.1
30.3
70.8
36.4
28.0
29.2
19.7
28.6
21.2
23.1
21.4
12.1
50.6
32.2
14.4
20.5
20.6
12.4
36.7
39.3
25.7
18.5
22.8
28.3
17.6
31.6
37.2
46.4
40.6
29.9
2.7
14.8
5.5
33.6
8.9
4.3
4.1
4.9
8.4
22.2
3.7
6.3
4.5
1.7
2.9
4.4
4.0
3.7
4.1
8.8
5.6
6.5
3.8
2.8
4.8
20.5
8.7
12.1
4.7
2.6
12.9
5.0
30.1
7.4
3.8
2.7
4.0
6.7
19.9
2.8
5.8
4.0
1.6
2.6
4.7
3.2
3.4
3.9
8.0
4.8
5.3
3.5
2.5
4.4
18.0
8.0
9.9
4.2
FY17
11.5
16.2
11.2
15.2
10.3
17.9
ROE (%)
FY18E
10.9
17.5
13.9
16.1
8.8
19.4
FY19E
12.3
17.8
12.1
16.8
11.8
23.3
15.8
106.1
29.6
21.6
11.5
24.3
31.6
136.2
23.5
12.3
16.2
14.8
13.7
26.0
27.6
13.5
14.5
34.5
28.2
23.8
16.4
16.7
15.6
54.5
20.7
28.8
17.5
Neutral
Neutral
Under Review
Buy
Neutral
Under Review
Buy
Buy
Buy
Neutral
Buy
Buy
Sell
Under Review
Neutral
Buy
Buy
Buy
Buy
Buy
Buy
Buy
Buy
Buy
Buy
Sell
Neutral
Neutral
Buy
380
909
572
405
287
429
163
2,392
333
1,242
159
1,025
258
110
378
646
274
743
1,101
2,703
175
764
2,946
1,515
272
1,306
6,400
182
357
359
804
-
527
323
-
215
3,334
368
1,283
200
1,050
240
-
465
755
394
927
1,300
3,295
226
952
3,044
1,816
287
1,288
5,281
167
393
-5
-12
30
13
32
39
11
3
26
2
-7
23
17
44
25
18
22
29
25
3
20
6
-1
-17
-8
10
12.4
7.7
13.5
13.6
8.7
16.6
3.1
67.6
12.9
46.0
13.0
15.7
3.3
5.5
17.5
19.1
18.6
12.7
24.8
86.2
7.8
12.5
12.8
15.7
14.4
9.8
21.8
5.7
112.9
14.4
57.9
13.2
20.3
8.0
7.6
18.5
31.3
22.1
20.3
28.0
105.1
9.4
18.1
17.9
19.4
15.0
12.9
26.1
7.2
166.7
17.5
91.6
15.4
22.9
12.0
10.0
21.1
37.7
26.2
30.9
42.2
126.7
11.3
38.1
144.6
109.2
10.3
42.9
176.1
6.0
16.0
13.9 14.4
115.2 113.3
31.1 27.7
17.5 20.6
8.1
12.1
15.1 20.7
37.7 32.3
86.2 98.0
34.8 26.4
10.2 11.9
5.9
12.5
8.6
11.7
14.8 13.4
13.6 21.6
29.8 28.6
7.3
8.5
10.2 10.2
31.6 32.5
26.8
32.8
9.8
16.6
13.7
43.3
19.5
27.4
9.5
27.8
25.4
13.0
14.7
14.5
51.6
18.0
26.9
14.8
33.4 33.4
72.6 104.1
85.9 86.3
7.2
8.6
23.7 35.1
132.1 137.8
3.6
4.5
7.0
11.9
21 July 2017
28

MOSL Universe stock performance
Company
Automobiles
Amara Raja
Ashok Ley.
Bajaj Auto
Bharat Forge
Bosch
CEAT
Eicher Mot.
Endurance Tech.
Escorts
Exide Ind
Hero Moto
M&M
Mahindra CIE
Maruti Suzuki
Tata Motors
TVS Motor
Banks - Private
Axis Bank
DCB Bank
Equitas Hold.
Federal Bank
HDFC Bank
ICICI Bank
IDFC Bank
IndusInd
J&K Bank
Kotak Mah. Bk
RBL Bank
South Indian
Yes Bank
Banks - PSU
BOB
BOI
Canara
IDBI Bk
Indian Bk
OBC
PNB
SBI
Union Bk
NBFCs
Bajaj Fin.
Bharat Fin.
Cholaman.Inv.&Fn
Dewan Hsg.
GRUH Fin.
HDFC
Indiabulls Hsg
L&T Fin.Holdings
LIC Hsg Fin
Manappuram
M&M Fin.
Muthoot Fin
PFC
Repco Home
REC
STF
Shriram City Union
1 Day (%)
-0.2
-0.9
-0.2
-1.2
-1.4
-1.3
0.1
0.5
1.1
0.1
-1.0
0.7
-1.5
-0.9
-0.1
-0.2
3.9
-0.1
-0.7
3.1
0.9
-0.5
-1.0
-0.9
-2.8
-1.4
0.2
-0.9
0.5
-1.5
-2.9
-5.1
0.6
0.2
-0.5
-1.0
-0.9
-1.7
2.9
0.5
-0.7
1.7
-1.2
-0.2
0.8
1.7
0.0
0.9
0.3
-2.1
2.9
-0.2
0.8
-1.1
0.5
1M (%)
-0.2
13.8
0.1
-4.0
-2.7
-2.2
4.7
-2.1
-8.9
-3.0
-1.9
0.2
1.7
3.8
-1.5
4.2
5.6
-7.6
6.8
-0.1
1.2
2.7
7.2
3.1
-11.4
-0.2
5.6
-3.7
8.9
-3.3
10.3
-0.1
4.5
9.5
0.1
8.9
0.2
1.4
12.6
7.2
0.9
3.7
9.1
1.1
2.6
3.9
-3.1
9.9
0.9
-0.8
-3.8
-8.4
-2.6
-3.0
-4.3
12M (%)
-4.7
13.4
1.8
52.1
-3.5
108.1
47.0
165.6
23.8
13.8
-4.6
33.9
67.6
-6.8
89.0
-3.3
93.9
-3.4
89.5
38.6
23.5
19.6
39.7
23.9
25.4
44.5
35.3
2.7
37.5
39.6
-20.5
113.9
28.5
21.1
25.9
12.4
83.8
-0.6
17.8
117.0
63.7
23.7
62.5
101.1
48.8
33.3
13.6
65.5
21.3
0.8
82.1
-19.5
21.8
Company
Capital Goods
ABB
Bharat Elec.
BHEL
Blue Star
CG Cons. Elec.
CG Power & Inds Sol.
Cummins
GE T&D
Havells
K E C Intl
L&T
Pennar Eng.
Siemens
Solar Ind
Suzlon Energy
Thermax
Va Tech Wab.
Voltas
Cement
Ambuja Cem.
ACC
Birla Corp.
Dalmia Bharat
Grasim Inds.
India Cem
J K Cements
JK Lakshmi Ce
Ramco Cem
Orient Cem
Prism Cem
Shree Cem
Ultratech
Consumer
Asian Paints
Britannia
Colgate
Dabur
Emami
Godrej Cons.
GSK Cons.
HUL
ITC
Jyothy Lab
Marico
Nestle
Page Inds
Parag Milk
Pidilite Ind.
P&G Hygiene
Prabhat Dairy
United Brew
United Spirits
Healthcare
Alembic Phar
Alkem Lab
Ajanta Pharma
Aurobindo
Biocon
1 Day (%)
0.4
-0.7
0.9
-1.2
0.9
0.7
0.4
1.9
-0.9
-5.4
0.4
-1.4
0.9
1.1
0.0
1.8
-8.7
-0.5
-0.8
-1.0
0.8
-2.9
2.2
0.1
0.3
-1.1
-2.5
2.1
0.8
-2.1
-1.5
0.1
-0.5
-0.8
-1.6
1.1
-0.4
-0.1
0.0
-0.6
3.7
-1.5
-1.1
-0.3
1.1
-0.2
-1.3
0.5
-1.7
-1.3
2.7
1.1
0.2
-2.1
-3.1
1M (%)
-2.5
2.8
6.4
0.5
-6.1
1.2
4.7
-4.3
-4.3
18.3
1.6
-9.1
2.7
6.9
-0.3
-3.0
-15.5
4.4
9.0
4.1
3.0
4.0
12.6
-3.4
-1.9
-4.4
-2.0
10.0
7.4
1.7
1.9
0.5
5.8
-1.7
5.2
-3.0
-1.3
2.0
5.2
-6.1
-0.7
2.5
2.3
3.0
12.8
-1.8
0.7
8.1
4.9
18.2
6.7
-3.8
-4.4
13.9
20.6
12M (%)
12.1
38.1
1.6
46.2
34.8
16.8
13.4
-9.8
26.6
110.3
13.2
-31.0
1.6
28.8
1.6
1.0
3.8
46.7
0.0
5.0
72.7
106.2
33.2
80.8
39.0
11.3
20.5
-6.4
16.2
10.2
16.4
12.4
35.1
12.0
-0.7
-2.4
18.5
-14.4
27.1
15.5
30.8
17.1
3.0
24.6
-23.9
9.8
26.5
42.0
4.3
12.6
-5.3
17.4
-10.0
-6.0
70.6
21 July 2017
29

MOSL Universe stock performance
Company
Cadila
Cipla
Divis Lab
Dr Reddy’s
Fortis Health
Glenmark
Granules
GSK Pharma
IPCA Labs
Jubilant Life
Lupin
Sanofi India
Sun Pharma
Syngene Intl
Torrent Pharma
Logistics
Allcargo Logistics
Blue Dart
Concor
Gateway Distriparks
Gati
Transport Corp.
Media
Dish TV
D B Corp
Den Net.
Hind. Media
HT Media
Jagran Prak.
PVR
Siti Net.
Sun TV
Zee Ent.
Metals
Hindalco
Hind. Zinc
JSPL
JSW Steel
Nalco
NMDC
SAIL
Vedanta
Tata Steel
Oil & Gas
BPCL
GAIL
Gujarat Gas
Gujarat St. Pet.
HPCL
IOC
IGL
MRPL
Oil India
ONGC
PLNG
Reliance Ind.
Retail
Jubilant Food
Titan Co.
1 Day (%)
-3.1
0.6
-1.3
-0.9
4.2
-0.1
0.4
-0.3
-0.3
2.9
-0.5
-0.5
-1.0
-1.4
-1.8
0.4
-1.7
0.2
1.8
-0.2
0.4
0.8
0.9
1.3
0.5
-2.3
1.2
-0.3
-0.4
-1.0
-0.9
0.2
0.2
-1.5
-2.2
-1.8
2.9
-1.2
-1.3
-2.6
-0.6
-0.2
0.7
-1.4
-4.3
-0.2
-0.8
-3.7
-0.5
1.7
0.0
-0.3
0.6
-0.5
1M (%)
0.7
4.7
15.8
2.8
-20.8
12.5
5.0
3.4
1.0
5.6
4.8
-1.3
11.1
4.4
6.7
0.4
6.1
-0.4
5.8
-5.3
4.6
4.5
-0.6
-4.8
1.6
5.0
-5.2
-11.9
-10.8
-2.2
6.7
5.8
11.3
11.7
7.8
10.4
9.4
9.6
11.9
6.5
5.4
0.8
-4.2
2.6
3.3
-8.9
3.7
-0.9
-4.4
-1.7
-7.3
8.2
40.3
0.5
12M (%)
41.9
10.4
-37.2
-25.4
-12.0
-17.1
-1.2
-25.1
-1.9
136.8
-32.0
-6.6
-27.0
15.0
-10.9
-5.1
-25.3
1.7
-6.6
-29.7
50.1
-14.2
-5.1
-10.9
2.6
8.4
-4.2
28.0
-31.3
106.8
16.1
57.4
44.8
101.9
32.6
46.3
30.8
31.3
66.8
50.9
21.9
27.9
39.1
33.9
47.4
46.0
82.5
64.2
0.9
11.2
40.9
49.5
13.4
29.0
Company
Technology
Cyient
HCL Tech.
Hexaware
Infosys
KPIT Tech
L&T Infotech
Mindtree
Mphasis
NIIT Tech
Persistent Sys
Tata Elxsi
TCS
Tech Mah
Wipro
Zensar Tech
Telecom
Bharti Airtel
Bharti Infratel
Idea Cellular
Tata Comm
Utiltites
Coal India
CESC
JSW Energy
NTPC
Power Grid
Tata Power
Others
Arvind
Avenue Super.
Bata India
Castrol India
Century Ply.
Coromandel Intl
Delta Corp
Dynamatic Tech
Eveready Inds.
Interglobe
Indo Count
Info Edge
Inox Leisure
Jain Irrigation
Just Dial
Kaveri Seed
Kitex Garm.
Manpasand
MCX
Monsanto
Navneet Educat.
PI Inds.
Piramal Enterp.
SRF
S H Kelkar
Symphony
TTK Prestige
V-Guard
Wonderla
1 Day (%)
-0.4
-1.0
-0.9
-1.1
-3.1
-0.4
-4.4
0.6
-0.7
-0.8
1.1
-0.2
-1.3
-0.8
2.2
-0.4
-2.2
-0.2
-1.1
0.2
-0.4
2.2
-1.2
0.2
-0.2
-0.1
-0.3
-0.4
-0.8
-1.1
0.2
-1.8
-2.4
1.7
-1.4
-1.6
-0.5
-3.1
0.3
6.7
-0.6
1.1
0.1
-0.5
-1.7
-1.2
-2.3
-0.3
-1.0
3.3
-1.0
0.0
-0.1
0.2
1M (%)
2.9
3.6
-4.7
2.7
4.1
-5.0
-6.8
-3.0
-5.2
-3.5
4.5
0.2
-0.7
5.9
-6.6
14.7
7.5
15.7
-10.5
0.5
1.3
4.6
4.1
5.2
0.7
-0.6
10.5
7.5
-1.8
-2.1
1.8
-0.1
-6.9
-5.7
0.9
-12.1
3.4
-9.7
1.2
-7.5
3.6
-3.9
-7.0
0.9
-5.2
-4.3
-6.2
1.3
-7.0
-3.9
-2.5
-4.7
-2.5
-5.0
12M (%)
7.0
21.4
11.9
-10.5
-2.4
10.4
-15.2
6.9
16.4
2.5
1.4
-1.9
-22.5
-0.1
-19.4
15.4
14.3
-10.1
43.2
-22.4
48.6
-21.7
5.1
30.3
14.4
19.9
0.0
-2.1
25.7
81.3
76.5
-7.4
25.1
30.7
-12.0
23.6
4.8
54.0
-31.2
55.3
-21.4
4.4
6.1
9.4
86.0
3.7
79.0
12.0
17.7
8.4
34.3
84.4
-11.5
21 July 2017
30

THEMATIC/STRATEGY RESEARCH GALLERY

REPORT GALLERY
RECENT INITIATING COVERAGE REPORTS
Rs

DIFFERENTIATED PRODUCT GALLERY

Disclosures
This document has been prepared by Motilal Oswal Securities Limited (hereinafter referred to as Most) to provide information about the company (ies) and/sector(s), if any, covered in the report and may be distributed by it and/or its
affiliated company(ies). This report is for personal information of the selected recipient/s and does not construe to be any investment, legal or taxation advice to you. This research report does not constitute an offer, invitation or
inducement to invest in securities or other investments and Motilal Oswal Securities Limited (hereinafter referred as MOSt) is not soliciting any action based upon it. This report is not for public distribution and has been furnished to
you solely for your general information and should not be reproduced or redistributed to any other person in any form. This report does not constitute a personal recommendation or take into account the particular investment
objectives, financial situations, or needs of individual clients. Before acting on any advice or recommendation in this material, investors should consider whether it is suitable for their particular circumstances and, if necessary, seek
professional advice. The price and value of the investments referred to in this material and the income from them may go down as well as up, and investors may realize losses on any investments. Past performance is not a guide for
future performance, future returns are not guaranteed and a loss of original capital may occur.
MOSt and its affiliates are a full-service, integrated investment banking, investment management, brokerage and financing group. We and our affiliates have investment banking and other business relationships with a some
companies covered by our Research Department. Our research professionals may provide input into our investment banking and other business selection processes. Investors should assume that MOSt and/or its affiliates are
seeking or will seek investment banking or other business from the company or companies that are the subject of this material and that the research professionals who were involved in preparing this material may educate investors
on investments in such business . The research professionals responsible for the preparation of this document may interact with trading desk personnel, sales personnel and other parties for the purpose of gathering, applying and
interpreting information. Our research professionals are paid on twin parameters of performance & profitability of MOSt.
MOSt generally prohibits its analysts, persons reporting to analysts, and members of their households from maintaining a financial interest in the securities or derivatives of any companies that the analysts cover. Additionally, MOSt
generally prohibits its analysts and persons reporting to analysts from serving as an officer, director, or advisory board member of any companies that the analysts cover. Our salespeople, traders, and other professionals or affiliates
may provide oral or written market commentary or trading strategies to our clients that reflect opinions that are contrary to the opinions expressed herein, and our proprietary trading and investing businesses may make investment
decisions that are inconsistent with the recommendations expressed herein. In reviewing these materials, you should be aware that any or all of the foregoingamong other things, may give rise to real or potential conflicts of interest.
MOSt and its affiliated company(ies), their directors and employees and their relatives may; (a) from time to time, have a long or short position in, act as principal in, and buy or sell the securities or derivatives thereof of companies
mentioned herein. (b) be engaged in any other transaction involving such securities and earn brokerage or other compensation or act as a market maker in the financial instruments of the company(ies) discussed herein or act as an
advisor or lender/borrower to such company(ies) or may have any other potential conflict of interests with respect to any recommendation and other related information and opinions.; however the same shall have no bearing
whatsoever on the specific recommendations made by the analyst(s), as the recommendations made by the analyst(s) are completely independent of the views of the affiliates of MOSt even though there might exist an inherent
conflict of interest in some of the stocks mentioned in the research report Reports based on technical and derivative analysis center on studying charts company's price movement, outstanding positions and trading volume, as
opposed to focusing on a company's fundamentals and, as such, may not match with a report on a company's fundamental analysis. In addition MOST has different business segments / Divisions with independent research
separated by Chinese walls catering to different set of customers having various objectives, risk profiles, investment horizon, etc, and therefore may at times have different contrary views on stocks sectors and markets.
Unauthorized disclosure, use, dissemination or copying (either whole or partial) of this information, is prohibited. The person accessing this information specifically agrees to exempt MOSt or any of its affiliates or employees from,
any and all responsibility/liability arising from such misuse and agrees not to hold MOSt or any of its affiliates or employees responsible for any such misuse and further agrees to hold MOSt or any of its affiliates or employees free
and harmless from all losses, costs, damages, expenses that may be suffered by the person accessing this information due to any errors and delays. The information contained herein is based on publicly available data or other
sources believed to be reliable. Any statements contained in this report attributed to a third party represent MOSt’s interpretation of the data, information and/or opinions provided by that third party either publicly or through a
subscription service, and such use and interpretation have not been reviewed by the third party. This Report is not intended to be a complete statement or summary of the securities, markets or developments referred to in the
document. While we would endeavor to update the information herein on reasonable basis, MOSt and/or its affiliates are under no obligation to update the information. Also there may be regulatory, compliance, or other reasons that
may prevent MOSt and/or its affiliates from doing so. MOSt or any of its affiliates or employees shall not be in any way responsible and liable for any loss or damage that may arise to any person from any inadvertent error in the
information contained in this report. MOSt or any of its affiliates or employees do not provide, at any time, any express or implied warranty of any kind, regarding any matter pertaining to this report, including without limitation the
implied warranties of merchantability, fitness for a particular purpose, and non-infringement. The recipients of this report should rely on their own investigations.
This report is intended for distribution to institutional investors. Recipients who are not institutional investors should seek advice of their independent financial advisor prior to taking any investment decision based on this report or for
any necessary explanation of its contents.
Most and it’s associates may have managed or co-managed public offering of securities, may have received compensation for investment banking or merchant banking or brokerage services, may have received any compensation
for products or services other than investment banking or merchant banking or brokerage services from the subject company in the past 12 months.
Most and it’s associates have not received any compensation or other benefits from the subject company or third party in connection with the research report.
Subject Company may have been a client of Most or its associates during twelve months preceding the date of distribution of the research report
MOSt and/or its affiliates and/or employees may have interests/positions, financial or otherwise of over 1 % at the end of the month immediately preceding the date of publication of the research in the securities mentioned in this
report. To enhance transparency, MOSt has incorporated a Disclosure of Interest Statement in this document. This should, however, not be treated as endorsement of the views expressed in the report.
Motilal Oswal Securities Limited is registered as a Research Analyst under SEBI (Research Analyst) Regulations, 2014. SEBI Reg. No. INH000000412
Pending Regulatory inspections against Motilal Oswal Securities Limited:
SEBI pursuant to a complaint from client Shri C.R. Mohanraj alleging unauthorized trading, issued a letter dated 29th April 2014 to MOSL notifying appointment of an Adjudicating Officer as per SEBI regulations to hold inquiry and
adjudge violation of SEBI Regulations; MOSL replied to the Show Cause Notice whereby SEBI granted us an opportunity of Inspection of Documents. Since all the documents requested by us were not covered we have requested to
SEBI vide our letter dated June 23, 2015 to provide pending list of documents for inspection.
List of associate companies of Motilal Oswal Securities Limited -Click
here to access detailed report
Analyst Certification
The views expressed in this research report accurately reflect the personal views of the analyst(s) about the subject securities or issues, and no part of the compensation of the research analyst(s) was, is, or will be directly or
indirectly related to the specific recommendations and views expressed by research analyst(s) in this report. The research analysts, strategists, or research associates principally responsible for preparation of MOSt research receive
compensation based upon various factors, including quality of research, investor client feedback, stock picking, competitive factors and firm revenues
Disclosure of Interest Statement
Analyst ownership of the stock
Served as an officer, director or employee
Companies where there is interest
No
No
A graph of daily closing prices of securities is available at www.nseindia.com and http://economictimes.indiatimes.com/markets/stocks/stock-quotes
Regional Disclosures (outside India)
This report is not directed or intended for distribution to or use by any person or entity resident in a state, country or any jurisdiction, where such distribution, publication, availability or use would be contrary to law, regulation or which
would subject MOSt& its group companies to registration or licensing requirements within such jurisdictions.
For Hong Kong:
This report is distributed in Hong Kong by Motilal Oswal capital Markets (Hong Kong) Private Limited, a licensed corporation (CE AYY-301) licensed and regulated by the Hong Kong Securities and Futures
Commission (SFC) pursuant to the Securities and Futures Ordinance (Chapter 571 of the Laws of Hong Kong) “SFO”. As per SEBI (Research Analyst Regulations) 2014 Motilal Oswal Securities (SEBI Reg No. INH000000412) has
an agreement with Motilal Oswal capital Markets (Hong Kong) Private Limited for distribution of research report in Kong Kong. This report is intended for distribution only to “Professional Investors” as defined in Part I of Schedule 1 to
SFO. Any investment or investment activity to which this document relates is only available to professional investor and will be engaged only with professional investors.” Nothing here is an offer or solicitation of these securities,
products and services in any jurisdiction where their offer or sale is not qualified or exempt from registration. The Indian Analyst(s) who compile this report is/are not located in Hong Kong & are not conducting Research Analysis in
Hong Kong.
Motilal Oswal Securities Limited (MOSL) is not a registered broker - dealer under the U.S. Securities Exchange Act of 1934, as amended (the"1934 act") and under applicable state laws in the United States. In addition MOSL is not a
registered investment adviser under the U.S. Investment Advisers Act of 1940, as amended (the "Advisers Act" and together with the 1934 Act, the "Acts), and under applicable state laws in the United States. Accordingly, in the
absence of specific exemption under the Acts, any brokerage and investment services provided by MOSL, including the products and services described herein are not available to or intended for U.S. persons.
This report is intended for distribution only to "Major Institutional Investors" as defined by Rule 15a-6(b)(4) of the Exchange Act and interpretations thereof by SEC (henceforth referred to as "major institutional investors"). This
document must not be acted on or relied on by persons who are not major institutional investors. Any investment or investment activity to which this document relates is only available to major institutional investors and will be
engaged in only with major institutional investors. In reliance on the exemption from registration provided by Rule 15a-6 of the U.S. Securities Exchange Act of 1934, as amended (the "Exchange Act") and interpretations thereof by
the U.S. Securities and Exchange Commission ("SEC") in order to conduct business with Institutional Investors based in the U.S., MOSL has entered into a chaperoning agreement with a U.S. registered broker-dealer, Motilal Oswal
Securities International Private Limited. ("MOSIPL"). Any business interaction pursuant to this report will have to be executed within the provisions of this chaperoning agreement.
The Research Analysts contributing to the report may not be registered /qualified as research analyst with FINRA. Such research analyst may not be associated persons of the U.S. registered broker-dealer, MOSIPL, and therefore,
may not be subject to NASD rule 2711 and NYSE Rule 472 restrictions on communication with a subject company, public appearances and trading securities held by a research analyst account.
For Singapore
Motilal Oswal Capital Markets Singapore Pte Limited is acting as an exempt financial advisor under section 23(1)(f) of the Financial Advisers Act(FAA) read with regulation 17(1)(d) of the Financial Advisors Regulations and is a
subsidiary of Motilal Oswal Securities Limited in India. This research is distributed in Singapore by Motilal Oswal Capital Markets Singapore Pte Limited and it is only directed in Singapore to accredited investors, as defined in the
Financial Advisers Regulations and the Securities and Futures Act (Chapter 289), as amended from time to time.
In respect of any matter arising from or in connection with the research you could contact the following representatives of Motilal Oswal Capital Markets Singapore Pte Limited:
Varun Kumar
Varun.kumar@motilaloswal.com
Contact : (+65) 68189232
Office Address:21 (Suite 31),16 CollyerQuay,Singapore 04931
For U.S
13 December 2016
Motilal Oswal Tower, Level 9, Sayani Road, Prabhadevi, Mumbai 400 025
Phone: +91 22 3982 5500 E-mail: reports@motilaloswal.com
Motilal Oswal Securities Ltd
20